Abstract
A new voltammetric sensor (BDDE/Nafion@Fe3O4/BiF) was fabricated by applying a nanocomposite drop of Fe3O4 magnetic nanoparticles in Nafion onto the polished boron-doped diamond electrode (BDDE) surface. Then, after drying (5 min at room temperature), the electrode was electrochemically modified with bismuth film (BiF) during in situ analysis. The Nafion@Fe3O4/BiF modification of the BDDE contributes to the acquisition of the highest differential-pulse adsorptive stripping voltammetric (DPAdSV) signals of caffeine (CAF) due to the improvement of electron transfer and the increase in the number of active sites on which CAF can be adsorbed. The DPAdSV signals exhibited a linearly varied oxidation peak with the CAF concentration range between 0.5 and 10,000 nM, leading to the 0.043 and 0.14 nM detection and quantification limits, respectively. The practical applicability of the DPAdSV procedure using the BDDE/Nafion@Fe3O4/BiF was positively confirmed with commercially available energy drinks.
1. Introduction
Caffeine (3,7-dihydro-1,3,7-trimethyl-1H-purine-2,6-dione, CAF) is an alkaloid that belongs to N-methyl derivatives of xanthine. It occurs naturally and can be found in many plant products, such as coffee and cacao beans, tea and yerba mate leaves, cola nuts, and guarana berries. It is also known as theine, mateine, and guaranine, depending on where it originates from. CAF is one of the most widely used chemical compounds in the food industry, mainly as an additive in beverages such as cola and energy drinks. It can also be found in many drugs, often combined with acetaminophen. Such drugs are especially used to treat pain coming from various sources, e.g., headaches (also migraines), muscle pain, and toothaches. In addition to treating pain, caffeine is used to treat asthma and nasal congestion as well. It is also found in supplements that support weight loss [1,2,3,4]. Due to its very wide distribution in food and medical products, CAF is believed to be the most commonly consumed drug in everyday life worldwide [5].
CAF does not have any nutritional value, but it shows a particular effect on the human body. It mainly affects the central nervous system and cardiovascular system. In moderate doses, it supports concentration, observation skills, and memory. It reduces the feeling of drowsiness and fatigue and can be used to restore consciousness in states of fainting. CAF consumption may also cause mood improvement. Its effect on the cardiovascular system shows itself through narrowing the blood vessels and increasing the blood pressure. It reduces inflammatory reactions in the body, improves glucose metabolism, and increases gastric acid secretion. However, larger doses of CAF have a harmful effect on human health. It can cause hyperactivity, insomnia, nausea and vomiting, convulsions, heart diseases, depression, and even mutations. An overdose of CAF may be fatal. A lethal dose is estimated to be 170 mg/kg body weight [3,6,7].
As mentioned above, CAF is widely used as an additive in many beverages, mainly energy drinks. Those drinks are very often readily consumed by many young adults, adolescents, and even children, who are most at risk of the side effects of CAF overdose. Consumption of energy drinks has been reported in connection with many harmful effects, e.g., diabetes, sleeplessness, seizures, cardiac, and mood disorders. Moreover, the cessation of CAF intake may lead to withdrawal symptoms, such as headache, lower concentration, fatigue, muscle stiffness, nausea, irritability, and depression. The intensity of those symptoms may be severe. Due to the harmful effects of CAF overconsumption on human health, the advertisement and sales of energy drinks have been restricted in some countries [8,9,10]. For example, in Poland, from 1 January 2024, the sale of energy drinks to children and adolescents under 18 is prohibited. The relevant Act defines it as a beverage that is a food, included in the Polish Classification of Products and Services, which “contains caffeine in a proportion exceeding 150 mg/L or taurine, excluding substances occurring naturally in them” [11].
In conclusion, it is undeniable that CAF has a tremendous impact on the human body. If we add to this its common occurrence in our life and the legal norms, it becomes very important to develop fast, simple, sensitive, and accurate methods for the determination of this compound in various samples, including food and beverages. So far, many different methods have been developed, e.g., using high performance liquid chromatography (HPLC) [12], thermal desorption–gas chromatography mass spectrometry (TD-GC/MS) [13], and voltammetry [1,2,3,4,5,6,7]. Due to the much less expensive equipment, the voltammetric methods are cheaper compared to others, which is a great advantage. Voltammetric measurements are also characterized by higher sensitivity and accuracy as well as lower detection and quantification limits (LODs and LOQs, respectively). Moreover, using screen-printed electrodes (SPEs), it is possible to develop and use voltammetric methods that are suitable for field analysis [7]. Many different approaches have been taken in voltammetric methods of CAF analysis. Nowadays, electrode surface modifications are used very often. These modifications can be realized in many ways, such as deposition of a metal film (e.g., the frequently used bismuth film, BiF) [7], deposition of metallic nanoparticles (e.g., palladium nanoparticles, PdNPs) [14], and coating the surface with a cation exchanger (e.g., Nafion) [5] or carbon nanomaterials (e.g., single-walled carbon nanotubes, SWCNTs) [6]. Such modifications can be combined in many ways to achieve even better results [1,15,16]. The comparison of some methods used for CAF analysis is presented in Table 1.

Table 1.
Comparison of the methods used for the CAF analysis in various samples.
Recently, magnetic nanoparticles (MNPs) have become increasingly popular in electrochemical analysis. Due to their many advantages, Fe3O4 MNPs are one of the most widely used magnetic nanomaterials to modify the electrode surface. They are characterized by high surface area, biocompatibility, easy preparation, high absorption ability, and low toxicity. Moreover, they promote a very fast electron transfer between the sensor and the active site of the redox reaction [17,18].
In this paper, we propose a new composite based on magnetic nanoparticles and Nafion to modify the surface of a boron-doped diamond electrode. The electrode was further modified with electrochemically deposited bismuth film (BDDE/Nafion@Fe3O4/BiF). This way, we acquired a sensitive sensor, which is easy to prepare. Our study aimed to test the proposed electrode modification in the determination of CAF in energy drinks. During our studies, we performed many measurements using differential-pulse adsorptive stripping voltammetry (DPAdSV) to optimize the procedure. It was shown that the use of the BDDE/Nafion@Fe3O4/BiF increases the oxidation peak currents of CAF. Moreover, we obtained a very low limit of detection (LOD) and limit of quantification (LOQ). The analytical performance of the proposed sensor was tested in the determination of CAF in energy drink samples. The analysis was fast, and the results were found to be satisfactory.
2. Results and Discussion
2.1. Comparison of the Electrodes
In preliminary studies, the analytical signals of caffeine (CAF, 0.1 µM) on an unmodified boron-doped diamond electrode (BDDE), a BDDE modified with a Nafion layer (BDDE/Nafion) and an in situ deposited bismuth film (BDDE/Nafion/BiF), and a BDDE modified with a nanocomposite consisting of magnetic nanoparticles (Fe3O4) and Nafion, and electrochemically modified with bismuth film (BDDE/Nafion@Fe3O4/BiF) (Figure 1A,B), were compared. The choice of the BDDE, Nafion, and Bi film modification was not accidental since it was based on the results obtained in our previous study [1]. In that paper, among others, it was demonstrated that: (1) the use of BDDE instead of a glassy carbon electrode provided a lower background current as well as a better repeatability of the paracetamol signal, (2) the advantages of using the Nafion film was connected with preconcentration of caffeine in the polymer layer, (3) higher and better shaped signals of paracetamol and caffeine were obtained when the BDDE/Nafion was modified with BiF instead the PbF. The differential-pulse adsorptive stripping voltammograms (DPAdSVs, Figure 1A) show the presence of a CAF peak at a potential of about 1.5 V on all the tested electrodes. The results obtained in our previous study were confirmed; the Nafion layer causes an increase in the analytical signal of CAF due to its preconcentration in the polymer layer (BDDE vs. BDDE/Nafion, 0.089 vs. 0.29 µA) [1,19]. Furthermore, the bismuth film modification contributed to another CAF signal increase (BDDE/Nafion vs. BDDE/Nafion/BiF, 0.29 vs. 0.77 µA). In the previous work, we did not explain what this is related to [1]. This work explained it by using cyclic voltammetric studies (the results described below). Additionally, we observed a significant increase in the CAF signal (BDDE/Nafion/BiF vs. BDDE/Nafion@F3O4/BiF, 0.77 vs. 1.96 µA) after introducing the nanocomposite based on commercially available Fe3O4 nanoparticles onto the electrode surface. This is most likely related to the excellent adsorption and catalytic properties of Fe3O4 nanoparticles [20,21].
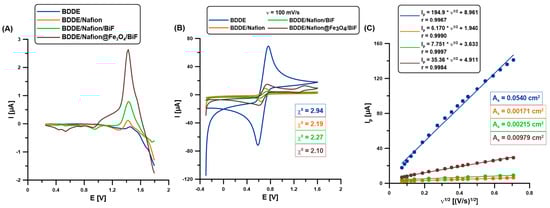
Figure 1.
(A) The DPAdSVs of 0.1 µM CAF on the BDDE (blue curve), BDDE/Nafion (red curve), BDDE/Nafion/BiF (green curve), and BDDE/Nafion@Fe3O4/BiF (brown) in 0.1 M H2SO4 (0 or 6.0 µM Bi(III), Edep.Bi+acc.CAF of −0.95 V, tdep.Bi+acc.CAF of 60 s, ΔEA of 75 mV, ʋ of 175 mV/s, and tm of 4 ms. (B) CVs (ʋ = 100 mV/s) in 0.1 M KCl and 5.0 mM [Fe(CN)6]3−/4− for all the tested electrodes. (C) The relationship between the anode peak (Ip) and the square root of ʋ (ʋ1/2) was determined for the examined sensors (ʋ of 5–500 mV/s).
The changes in the electrochemical properties of all the studied electrodes were also examined using cyclic voltammetry (CV, solution: 0.1 M KCl and 0.5 mM [Fe(CN)6]3−/4−, at a scan rate (ʋ) of 5–500 mV/s). Figure 1B demonstrates the enhancement of the analytical signals of Fe(II) and Fe(III) with each subsequent component of the electrode surface modifier (the red, green, and brown curves, respectively). However, the highest peak intensities of Fe(II) and Fe(III) were on the unmodified BDDE, which results in the largest active surface area (As, Figure 1C) [22]. Nonetheless, this does not translate into the highest CAF signal on the BDDE due to the weakest electron transfer between the electrode surface and solution (the highest relative separation of the oxidation and reduction iron peaks, χ0 of 2.94). Based on the determined As and χ0 values for all tested electrodes (Figure 1B,C), it can be stated that among the BDDE surface modifiers used, Nafion@Fe3O4/BiF modification contributes to the acquisition of the highest DPAdSV signals of CAF due to the improvement of electron transfer (the lowest χ0 value of 2.10) and the increase in the number of active sites on which CAF can be adsorbed (the highest As value among the modified electrodes—BDDE/Nafion, BDDE/Nafion/BiF and BDDE/Nafion@Fe3O4/BiF).
2.2. Surface Modifier Composition Optimization
In the next stage of the research, the composition of the modifier (Nafion@Fe3O4/BiF) of the BDDE was optimized. The effect of parameters such as mass of Fe3O4 (Figure 2A) in the 100 μL of 3% Nafion, concentration of Nafion (Figure 2B), droplet volume (Figure 2C), and concentration of Bi(III) in the supporting electrolyte (Figure 2D), on the 50 and 100 nM CAF signals, was examined. As can be seen, with the increase of Fe3O4 content to 0.5 mg, Nafion concentration to 3%, and Bi(III) to 5 µM, the analytical signals of CAF increase. This is related to the improvement of the adsorption capacity of the modifier. Above these values, a decrease in CAF signals was observed, which is associated with the blocking of the active surface of the electrode. As for the droplet size, the value of 0.5 µL was selected for further measurements. Too small a drop volume causes the entire geometric surface of the BDDE (0.0707 cm2) to be uncovered, while too large a drop volume results in the formation of too thick a layer and/or spreading beyond the active surface. The following parameters were selected: 0.5 mg of Fe3O4 in 100 μL of 3% Nafion, a droplet volume of 0.5 µL, and a Bi(III) concentration of 5 µM.
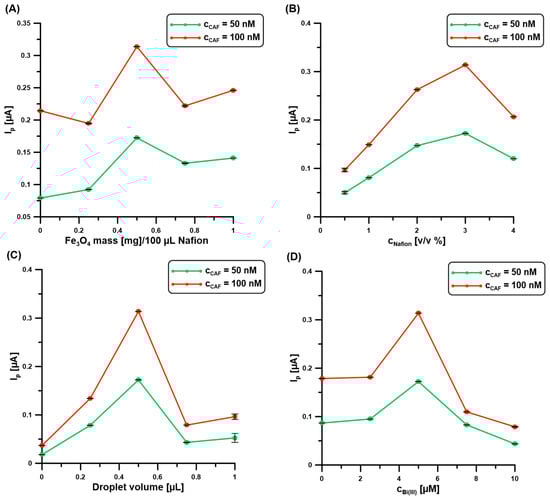
Figure 2.
The relationship between the 50 and 100 nM CAF signals, and (A) mass of Fe3O4 in the 100 μL of 3% Nafion, (B) concentration of Nafion, (C) droplet volume, and (D) concentration of Bi(III) in the supporting electrolyte (0.1 M H2SO4). DPAdSV parameters: Edep.Bi+acc.CAF of −0.95 V, tdep.Bi+acc.CAF of 60 s, ΔEA of 75 mV, ʋ of 175 mV/s, and tm of 4 ms. The SD values were calculated for n = 5.
2.3. Type and Concentration of the Base Electrolyte
In the next stage of research, the type (Figure 3A) and concentration (Figure 3B) of the base electrolyte were tested. According to the literature data, the three main advantages are using a low pH during CAF determination: a relatively high analytical signal, relatively little interference from background current (probably oxygen evolution), and freedom from extraneous peaks due to possible adsorption [23]. Therefore, an acidic environment for the CAF (50 nM) analysis at the BDDE/Nafion@Fe3O4/BiF was studied, including H2SO4, HCl, CH3COOH, and CH3COONa/CH3COOH of pH = 3.5 and 4.5 (Figure 3A). At this stage of research, a constant electrolyte concentration of 0.1 M was used. The increase in the analytical CAF signal is visible with the decrease in the electrolyte pH value. The highest CAF signal was obtained for 0.1 M H2SO4. The data described in the literature are also confirmed at the BDDE/Nafion@Fe3O4/BiF. CAF is a weak electrolyte, and its ionization is highly influenced by the solution’s pH. Based on the CAF pKa values (pKa1 = 0.6–0.7 and pKa2 = 14), at a low pH a higher concentration of the protonated form is present, which is easily incorporated in the cation-exchange Nafion polymer [24,25]. This contributes to the increase in the CAF analytical signal due to more effective adsorption.
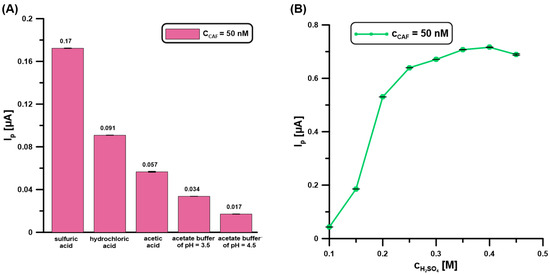
Figure 3.
The influence of type (A) (0.1 M H2SO4, HCl, CH3COOH, CH3COONa/CH3COOH of pH = 3.5 and 4.5 0.1), and (B) concentration of H2SO4 on the DPAdSV response of CAF (50 nM). DPAdSV parameters: Edep.Bi+acc.CAF of −0.95 V, tdep.Bi+acc.CAF of 60 s, ΔEA of 75 mV, ʋ of 175 mV/s, and tm of 4 ms. The standard deviation (SD) values were calculated for n = 5.
Then, the effect of electrolyte concentration on the analytical signal of CAF (50 nM) was examined. The concentration of H2SO4 varied from 0.1 to 0.45 M (Figure 3B). The CAF signal increases with increasing electrolyte concentration up to 0.4 M, and then it is almost constant. For further measurements, 0.4 M was selected.
2.4. Electrochemical Performance of CAF
The electrochemical performance of CAF on Nafion-modified BDDEs is very well described in the literature—the oxidation mechanism reaction of CAF proceeds by an overall 4e−, 4H+ process. The first step, the 2e−, 2H+ oxidation of the C-8 to N-9 bonds to give the substituted uric acid, is followed by the immediate 2e−, 2H+ oxidation to the 4,5-diol analog of uric acid, which rapidly fragments [23,26,27].
Further experiments were performed to study the transport characteristics of CAF in the Nafion@Fe3O4/BiF layer. Figure 4A shows the selected CVs (ʋ: 50, 100, and 150 mV/s), which are all applied in the scan rate range (ʋ: 5–450 mV/s). The CVs were registered in 0.1 M H2SO4 and 100 mM CAF at the BDDE/Nafion@Fe3O4/BiF. The sensor was prepared in a separate solution (0.1 M H2SO4 containing 5 µM Bi(III), Edep.Bi of −0.95 V, tdep.Bi of 60 s) once before CV measurements. The clear well-formed CAF analytical signals are visible at a potential of approx. 1.4 V. The current response (Ip) was found to be not directly proportional to the ʋ1/2 in a wide range of ʋ between 5 and 450 mV/s (r = 0.9878), which demonstrates that the electrode oxidation reaction of CAF was an adsorption-controlled process at the BDDE/Nafion@Fe3O4/BiF (Figure 4B). It was confirmed by the slope value (0.66), which was higher than the theoretical one of 0.5 (Figure 4C).
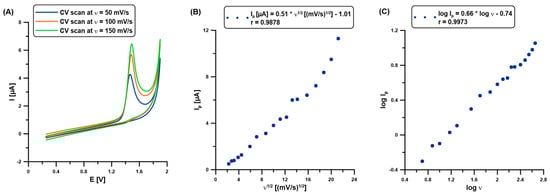
Figure 4.
(A) CVs at the BDDE/Nafion@Fe3O4/BiF in 0.1 M H2SO4 and 100 mM CAF. The relationship between (B) Ip and ʋ1/2, and (C) log Ip and log ʋ (ʋ: 5–450 mV/s).
2.5. Deposition and Accumulation Step
The BiF deposition and CAF accumulation steps were performed simultaneously to reduce the measurement time. In the first stage of the experiments, the impact of the potential of simultaneous BiF deposition and CAF accumulation (Edep.Bi+acc.CAF) on the DPAdSV response was studied (Figure 5A). The changes in the potential range from −0.7 to −1.4 V significantly affect the CAF signal (5 nM). It is worth adding that the time between the application of the potential and the working electrode was equal to 60 s. The highest signal with satisfactory repeatability was obtained at a potential of −0.95 V. Then, the time of simultaneous BiF deposition and CAF accumulation (tdep.Bi+acc.CAF) was changed from 0 to 240 s (Figure 5B). In the case of the BDDE/Nafion@Fe3O4/BiF, the voltammetric peak height of CAF (1 nM) increases with time, which is caused by the increasing amount of Bi particles deposited on the surface and the increased efficiency of molecule accumulation on/in the modifier layer. To shorten the analysis time, a time of 60 s was chosen. However, studies show that the detection limit can be reduced by extending the BiF deposition time and CAF accumulation.
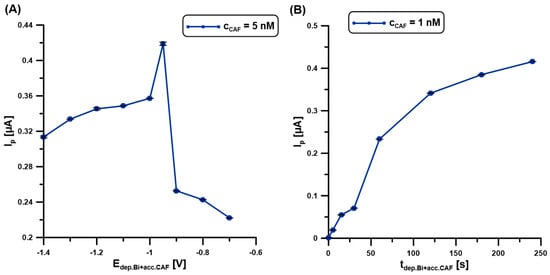
Figure 5.
The influence of Edep.Bi+acc.CAF (A), and tdep.Bi+acc.CAF. (B) on the DPAdSV responses of 5 (A) and 1 nM (B) CAF. DPAdSV parameters: tdep.Bi+acc.CAF of 60 s (A), Edep.Bi+acc.CAF of −0.95 V (B), ΔEA of 75 mV, ʋ of 175 mV/s, and tm of 4 ms. The SD values were calculated for n = 5.
2.6. Technique Parameters
Due to achieving optimal sensitivity, the following parameters of the DPAdSV technique were optimized: the amplitude (ΔEA), the scan rate (υ), and the modulation time (tm). The effect of ΔEA (25–200 mV) on the 1 nM CAF signal was evaluated (Figure 6A). The peak current of CAF was observed to increase with increasing ΔEA up to 150 mV, while the signal intensity had similar values. For the selected value of ΔEA (150 mV), ʋ was now varied from 50 to 175 mV/s and the changes in the CAF signal (1 nM) were observed (Figure 6B). With the increase in ν, the CAF signals increased, reaching the highest intensity at ʋ of 100 mV/s. The effect of tm on the DPAdSV responses of 1 nM CAF was evaluated in the range of 2–10 ms. The maximum CAF signals were recorded at 6 ms (Figure 6C).
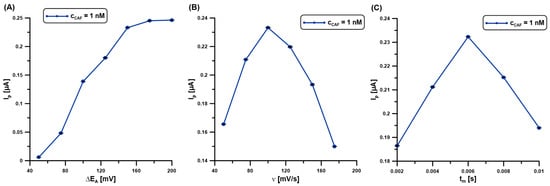
Figure 6.
The influence of ΔEA (A), ʋ (B), and tm (C) on the DPAdSV responses of 1 nM CAF. DPAdSV parameters: Edep.Bi+acc.CAF of −0.95 V and tdep.Bi+acc.CAF of 60 s. The SD values were calculated for n = 5.
2.7. Repeatability and Reproducibility
Repeatability was evaluated with successive 1, 2, and 5 nM CAF measurements (n = 5) at the BDDE/Nafion@Fe3O4/BiF. The electrodes were prepared by applying 0.5 µL of the nanocomposite onto the BDDE surface, then drying it at room temperature for 5 or 30 min, or in a drying oven (T = 55 °C) for 60 min. Next, the electrode was placed in a basic electrolyte containing Bi(III) (5 µM) and the analyte, a BiF film was deposited, and CAF was determined. There was no significant improvement in signal repeatability or intensity with increasing the time or temperature of drying the Nafion@Fe3O4 layer on the BDDE surface (Figure 7). To shorten the electrode preparation time, drying for 5 min at room temperature was chosen. The obtained RSD values in these conditions for 1, 2, and 5 nM CAF are 2.4, 2.0, and 1.3%, respectively, which confirms the satisfactory signal repeatability.
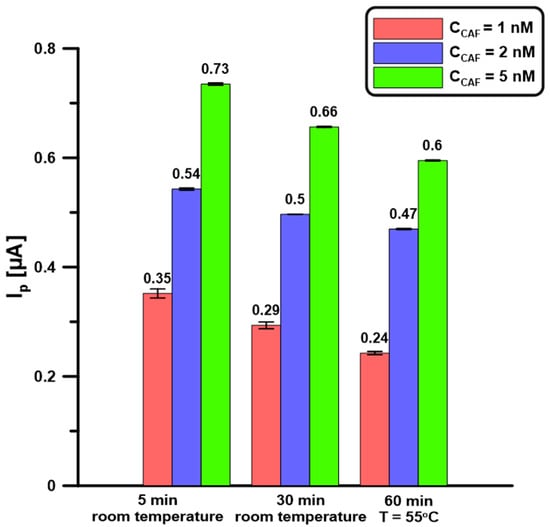
Figure 7.
BDDE/Nafion@Fe3O4 drying procedures. DPAdSV parameters: Edep.Bi+acc.CAF of −0.95 V, tdep.Bi+acc.CAF of 60 s, ΔEA of 150 mV, ʋ of 100 mV/s, and tm of 6 ms. The SD values were calculated for n = 5.
Electrode-to-electrode reproducibility was calculated for three independently prepared BDDE/Nafion@Fe3O4/BiF based on the 5 nM CAF signal intensities (n = 15). The RSD value of 5.9% confirms satisfactory reproducibility.
2.8. Sensitivity, Selectivity and Application
Measurements for the calibration curve were made in the base electrolyte solution (0.1 M H2SO4) containing 5 µM Bi(III) after introducing a CAF standard solution of known concentration. The obtained calibration curve is characterized by a very wide linear range from 0.5 to 10,000 nM (0.0005–10 µM) CAF (Figure 8). The equations, LOD = 3 SDa/b and LOQ = 10 SDa/b (SDa—standard deviation of intercept (n = 3), b—slope of the linear regression equation), were used to determine the limits of detection (LOD = 0.043 nM) and quantification (LOQ = 0.14 nM) of CAF calculation. Table 1 compares the selected methods for CAF determination [1,3,6,12,13]. The results collected in this table confirm that the developed procedure at the BDDE/Nafion@Fe3O4/BiF offers a wide linear range of the calibration curve and one of the lowest LODs.
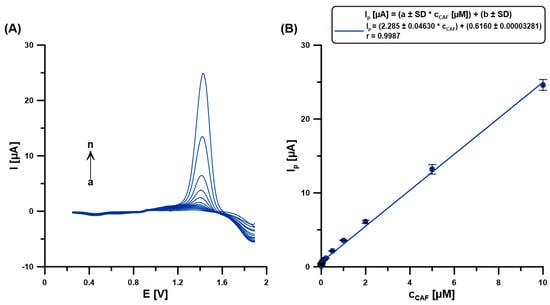
Figure 8.
(A) The DPAdSVs registered at the BDDE/Nafion@Fe3O4 in 0.1 M H2SO4 containing 5 µM Bi(III) and CAF (a → n, 0.0005–10 µM). (B) The calibration curve. DPAdSV parameters: Edep.Bi+acc.CAF of −0.95 V, tdep.Bi+acc.CAF of 60 s, ΔEA of 150 mV, ʋ of 100 mV/s, and tm of 6 ms. The SD values were calculated for n = 5.
Possible interferents were selected for the selectivity study based on the composition presented on the labels of the analyzed energy drinks. The influence of glucose, vitamin C, vitamin B3 (nicotinic acid), vitamin B5 (pantothenic acid), and citric acid on the 50 nM CAF signals was examined. It was found that a 100-fold excess of these substances in relation to the CAF concentration did not cause a change in its signal by more than ±10% (Figure 9). Moreover, none of the possible interferents gave an oxidation signal in the recorded potential range. The results suggested that the developed procedure at the BDDE/Nafion@Fe3O4/BiF can accurately determine CAF in energy drink samples.
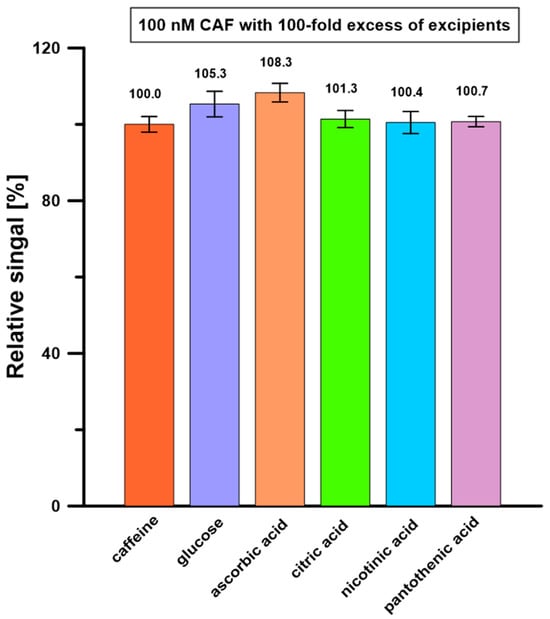
Figure 9.
Influence of 100-fold excess of possible interferents on 100 nM CAF signals. The SD values were calculated for n = 5.
The developed procedure at the BDDE/Nafion@Fe3O4/BiF was optimized for its application in determining CAF in energy drink samples. The samples were analyzed by the standard addition method. The samples were only degassed and diluted in distilled water at a ratio of 1:10 before being introduced into the electrochemical cell. Sample 1 with a CAF content of 32 mg/100 mL (1.65 mM), as declared by the manufacturer, was introduced in 5 µL, and sample 2 with the content of 14 mg/100 mL (0.72 mM), as declared by the manufacturer, was introduced in 10 µL. The results (Table 2) show a satisfactory degree of precision (coefficients of variation: 7.5 and 1.8%) and accuracy (recoveries: 97.0 and 100.0%) of the developed DPAdSV procedure.
Table 2.
The results of CAF determination in energy drink samples.
3. Materials and Methods
3.1. Instrumentations
For the voltammetric studies, an electrochemical analyzer µAutolab (Eco Chemie, Utrecht, The Netherlands) was used. A commercially available BDD electrode (Windsor Scientific Ltd., Slough, Berkshire, UK) was purchased in an inert polytetrafluoroethylene (PTFE, Teflon) body with an inner diameter of 3 mm (D-086-SA, boron doping level of 1000 ppm, electrical resistivity of 0.075 Ωm). Before applying onto the BDDE surface nanocomposite layer, it was polished using 0.3 µm alumina slurry on a Buehler polishing pad (Lake Bluff, IL, USA). The electrochemical cell also consisted of a silver chloride electrode (3 M KCl, reference) and a Pt wire (auxiliary electrode).
3.2. Reagents
The caffeine (CAF) solutions were prepared by dissolving the reagent obtained from Merck (Darmstadt, Germany) in deionized water or by diluting solutions of higher concentration and storing them at 4 °C in the dark until used. Fe3O4 nanoparticles (nanopowder, 50–100 nm particle size) were obtained from Sigma-Aldrich (Darmstadt, Germany). The 0.1 M H2SO4 and 1 mM Bi(III) solutions were prepared from reagents purchased from Merck (Darmstadt, Germany). Nafion (etrafluoroethylene-perfluoro-3,6-dioxa-4-methyl-7-octenesulfonic acid copolymer, 5% w/v solution) was obtained by diluting a reagent purchased from Aldrich (Darmstadt, Germany) with ethanol (POCH, Lublin, Poland) to reach a 3% concentration. The stock standard solution of glucose, vitamin C, vitamin B3, vitamin B5, and citric acid (Sigma-Aldrich, Darmstadt, Germany) was prepared in ultra-purified water (>18 MΩ cm, Milli-Q system, Millipore, Gillingham, UK).
3.3. BDDE/Nafion@Fe3O4/BiF Preparation and CAF Analysis
In the first stage, a nanocomposite containing 0.5 mg Fe3O4 in 100 µL of 3% (v/v) Nafion (in ethanol) was prepared. It was placed in an ultrasonic bath for 2 h. Then, 0.5 µL of such a nanocomposite was applied with an automatic pipette onto the polished and dried BDDE surface. Next, after 5 min at room temperature, the electrode was placed in a solution containing 0.1 M H2SO4, 5 µM Bi(III), and CAF. The bismuth film was deposited, and CAF was accumulated simultaneously at a potential of −0.95 V (Edep.Bi+acc.CAF) for 60 s (tdep.Bi+acc.CAF) under string. The differential-pulse adsorptive stripping voltammograms were registered in the range of 0.25 to 1.85 V with the amplitude (ΔEA) of 150 mV, the scan rate (υ) of 100 mV/s, and the modulation time (tm) of 6 ms. The background was subtracted from each measurement.
The BDDE/Nafion@Fe3O4 was prepared before each series of measurements, i.e., a given stage of procedure optimization, measurements to the calibration curve, and sample analysis. The bismuth film was applied in situ, during the CAF determination.
4. Conclusions
The voltammetric sensor (BDDE/Nafion@Fe3O4/BiF) based on Fe3O4 nanoparticles in the cation-exchange Nafion polymer and electrochemically deposited bismuth film was fabricated for the sensitive and selective determination of caffeine (CAF). It was found that the Nafion@Fe3O4/BiF modification contributes to the acquisition of the highest differential-pulse adsorptive stripping voltammetric (DPAdSV) signals of CAF due to the improvement of electron transfer (the lowest χ0 value) and the increase in the number of active sites on which CAF can be adsorbed (the highest As value among the modified electrodes—BDDE/Nafion, BDDE/Nafion/BiF and BDDE/Nafion@Fe3O4/BiF). The developed DPAdSV procedure at the BDDE/Nafion@Fe3O4/BiF offers a wide linear range of the calibration curve and one of the lowest limits of detection. The analytical performances of the BDDE/Nafion@Fe3O4/BiF were satisfactory as evidenced in the repeatability, reproducibility, and selectivity. The practical applicability of the DPAdSV procedure using the BDDE/Nafion@Fe3O4/BiF was positively confirmed with commercially available energy drinks.
Author Contributions
Conceptualization, K.T.-R., A.L. and A.K.; methodology, K.T.-R., A.L. and A.K.; validation, K.T.-R., A.L. and A.K.; investigation, K.T.-R., A.L. and A.K.; writing—original draft preparation, K.T.-R., A.L. and A.K.; writing—review and editing, K.T.-R., A.L. and A.K.; visualization, K.T.-R., A.L. and A.K.; supervision, K.T.-R. All authors have read and agreed to the published version of the manuscript.
Funding
This research received no external funding.
Institutional Review Board Statement
Not applicable.
Informed Consent Statement
Not applicable.
Data Availability Statement
The original contributions presented in this study are included in the article. Further inquiries can be directed to the corresponding author.
Conflicts of Interest
The authors declare no conflicts of interest.
References
- Sadok, I.; Tyszczuk-Rotko, K.; Nosal-Wiercińska, A. Bismuth particles Nafion covered boron-doped diamond electrode for simultaneous and individual voltammetric assays of paracetamol and caffeine. Sens. Actuators B Chem. 2016, 235, 263–272. [Google Scholar] [CrossRef]
- Tefera, M.; Geto, A.; Tessema, M.; Admassie, S. Simultaneous determination of caffeine and paracetamol by square wave voltammetry at poly(4-amino-3-hydroxynaphthalene sulfonic acid)- modified glassy carbon electrode. Food Chem. 2016, 210, 156–162. [Google Scholar] [CrossRef]
- Tyszczuk-Rotko, K.; Pietrzak, K.; Sasal, A. Adsorptive stripping voltammetric method for the determination of caffeine at an integrated three-electrode screen-printed sensor with carbon/carbon nanofibers working electrode. Adsorption 2019, 25, 913–921. [Google Scholar] [CrossRef]
- Sanghavi, B.J.; Srivastava, A.K. Simultaneous voltammetric determination of acetaminophen, aspirin and caffeine using an in situ surfactant-modified multiwalled carbon nanotube paste electrode. Electrochim. Acta 2010, 55, 8638–8648. [Google Scholar] [CrossRef]
- Farag, A.S.; Pravcová, K.; Česlová, L.; Vytřas, K.; Sýs, M. Simultaneous Determination of Caffeine and Pyridoxine in Energy Drinks using Differential Pulse Voltammetry at Glassy Carbon Electrode Modified with Nafion®. Electroanalysis 2019, 31, 1494. [Google Scholar] [CrossRef]
- Habibi, B.; Abazari, M.; Pournaghi-Azar, M.H. A Carbon Nanotube Modified Electrode for Determination of Caffeine by Differential Pulse Voltammetry. Chinese J. Catal. 2012, 33, 1783–1790. [Google Scholar] [CrossRef]
- Tyszczuk-Rotko, K.; Szwagierek, A. Green Electrochemical Sensor for Caffeine Determination in Environmental Water Samples: The Bismuth Film Screen-Printed Carbon Electrode. J. Electrochem. Soc. 2017, 164, B342. [Google Scholar] [CrossRef]
- Seifert, S.M.; Schaechter, J.L.; Hershorin, E.R.; Lipshultz, S.E. Health Effects of Energy Drinks on Children, Adolescents, and Young Adults. Pediatrics 2011, 127, 511–528. [Google Scholar] [CrossRef]
- Owens, J. Insufficient Sleep in Adolescents and Young Adults: An Update on Causes and Consequences. Pediatrics 2014, 134, e921–e932. [Google Scholar] [CrossRef]
- Reissig, C.J.; Strain, E.C.; Griffiths, R.R. Caffeinated energy drinks—A growing problem. Drug Alcohol Depend. 2009, 99, 1–10. [Google Scholar] [CrossRef]
- Journal of Laws of the Republic of Poland. ACT on Amending the Public Health Act and Certain Other Acts. Available online: https://orka.sejm.gov.pl/proc9.nsf/ustawy/3258_u.htm (accessed on 17 August 2023).
- Franeta, J.T.; Agbaba, D.; Eric, S.; Pavkov, S.; Aleksic, M.; Vladimirov, S. HPLC assay of acetylsalicylic acid, paracetamol, caffeine and phenobarbital in tablets. Il Farmaco 2002, 57, 709–713. [Google Scholar] [CrossRef]
- Peng, X.; Brown, M.; Bowdler, P.; Honeychurch, K.C. Extraction-Free, Direct Determination of Caffeine in Microliter Volumes of Beverages by Thermal Desorption-Gas Chromatography Mass Spectrometry. Int. J. Anal. Chem. 2020, 149, 405184. [Google Scholar] [CrossRef]
- Wong, A.; Santos, A.M.; da Fonseca Alves, R.; Vicentini, F.C.; Fatibello-Filho, O.; Del Pilar Taboada Sotomayor, M. Simultaneous determination of direct yellow 50, tryptophan, carbendazim, and caffeine in environmental and biological fluid samples using graphite pencil electrode modified with palladium nanoparticles. Talanta 2021, 222, 121539. [Google Scholar] [CrossRef]
- Yang, S.; Yang, R.; Li, G.; Qu, L.; Li, J.; Yu, L. Nafion/multi-wall carbon nanotubes composite film coated glassy carbon electrode for sensitive determination of caffeine. J. Electroanal. Chem. 2010, 639, 77–82. [Google Scholar] [CrossRef]
- Wang, Y.; Wei, X.; Wang, F.; Li, M. Sensitive voltammetric detection of caffeine in tea and other beverages based on a DNA functionalized single-walled carbon nanotube modified glassy carbon electrode. Anal. Methods 2014, 6, 7525–7531. [Google Scholar] [CrossRef]
- Miao, P.; Tang, Y.; Wang, L. DNA Modified Fe3O4@Au Magnetic Nanoparticles as Selective Probes for Simultaneous Detection of Heavy Metal Ions. ACS Appl. Mater. Interfaces 2017, 9, 3940–3947. [Google Scholar] [CrossRef]
- Arvand, M.; Hemmati, S. Magnetic nanoparticles embedded with graphene quantum dots and multiwalled carbon nanotubes as a sensing platform for electrochemical detection of progesterone. Sens. Actuat. B Chem. 2017, 238, 346–356. [Google Scholar] [CrossRef]
- Tyszczuk-Rotko, K.; Bęczkowska, I. Nafion covered lead film electrode for the voltammetric determination of caffeine in beverage samples and pharmaceutical formulations. Food Chem. 2015, 172, 24–29. [Google Scholar] [CrossRef]
- Wu, W.; Jia, M.; Zhang, Z.; Chen, X.; Zhang, Q.; Zhang, W.; Li, P.; Chen, L. Sensitive, selective and simultaneous electrochemical detection of multiple heavy metals in environment and food using a lowcost Fe3O4 nanoparticles/fluorinated multi-walled carbon nanotubes sensor. Ecotoxicol. Environ. Saf. 2019, 175, 243–250. [Google Scholar] [CrossRef]
- Xu, Z.; Fan, X.; Ma, Q.; Tang, B.; Lu, Z.; Zhang, J.; Mo, G.; Ye, J.; Ye, J. A sensitive electrochemical sensor for simultaneous voltammetric sensing of cadmium and lead based on Fe3O4/multiwalled carbon nanotube/laser scribed graphene composites functionalized with chitosan modified electrode. Mater. Chem. Phys. 2019, 238, 121877. [Google Scholar] [CrossRef]
- Gosser, D.K. Cyclic Voltammetry: Simulation and Analysis of Reaction Mechanism; VCH: New York, NY, USA, 1993. [Google Scholar]
- Spataru, N.; Sarada, B.V.; Tryk, D.A.; Fujishima, A. Anodic voltammetry of xanthine, theophylline, theobromine and caffeine at conductive diamond electrodes and its analytical application. Electroanalysis 2002, 14, 721–728. [Google Scholar] [CrossRef]
- Newton, D.W.; Kluza, R.B. pKa values of medicinal compounds in pharmacy practice. Drug Intell. Clin. Pharm. 1978, 12, 546–554. [Google Scholar] [CrossRef]
- Vandeponseele, A.; Draye, M.; Piot, C.; Chatel, G. Study of influential parameters of the caffeine extraction from spent coffee grounds: From brewing coffee method to the waste treatment conditions. Clean Technol. 2021, 3, 335–350. [Google Scholar] [CrossRef]
- Martínez-Huitle, C.A.; Suely Fernandes, N.; Ferro, S.; De Battisti, A.; Quiroz, M.A. Fabrication and application of Nafion®—Modified boron-doped diamond electrode as sensor for detection caffeine. Diam. Relat. Mater. 2010, 19, 1188–1193. [Google Scholar] [CrossRef]
- Telo, J.P.; Vieira, A.J.S.C. Mechanism of free radical oxidation of caffeine in aqueous solution. J. Chem. Soc. Perkin Trans. 2 1997, 9, 1755–1758. [Google Scholar] [CrossRef]
Disclaimer/Publisher’s Note: The statements, opinions and data contained in all publications are solely those of the individual author(s) and contributor(s) and not of MDPI and/or the editor(s). MDPI and/or the editor(s) disclaim responsibility for any injury to people or property resulting from any ideas, methods, instructions or products referred to in the content. |
© 2025 by the authors. Licensee MDPI, Basel, Switzerland. This article is an open access article distributed under the terms and conditions of the Creative Commons Attribution (CC BY) license (https://creativecommons.org/licenses/by/4.0/).