Corn Seed Freezing Damage Identification of Different Sides Based on Hyperspectral Imaging and SPA-2DCOS Fusion Algorithm


Abstract
1. Introduction
2. Results and Discussion
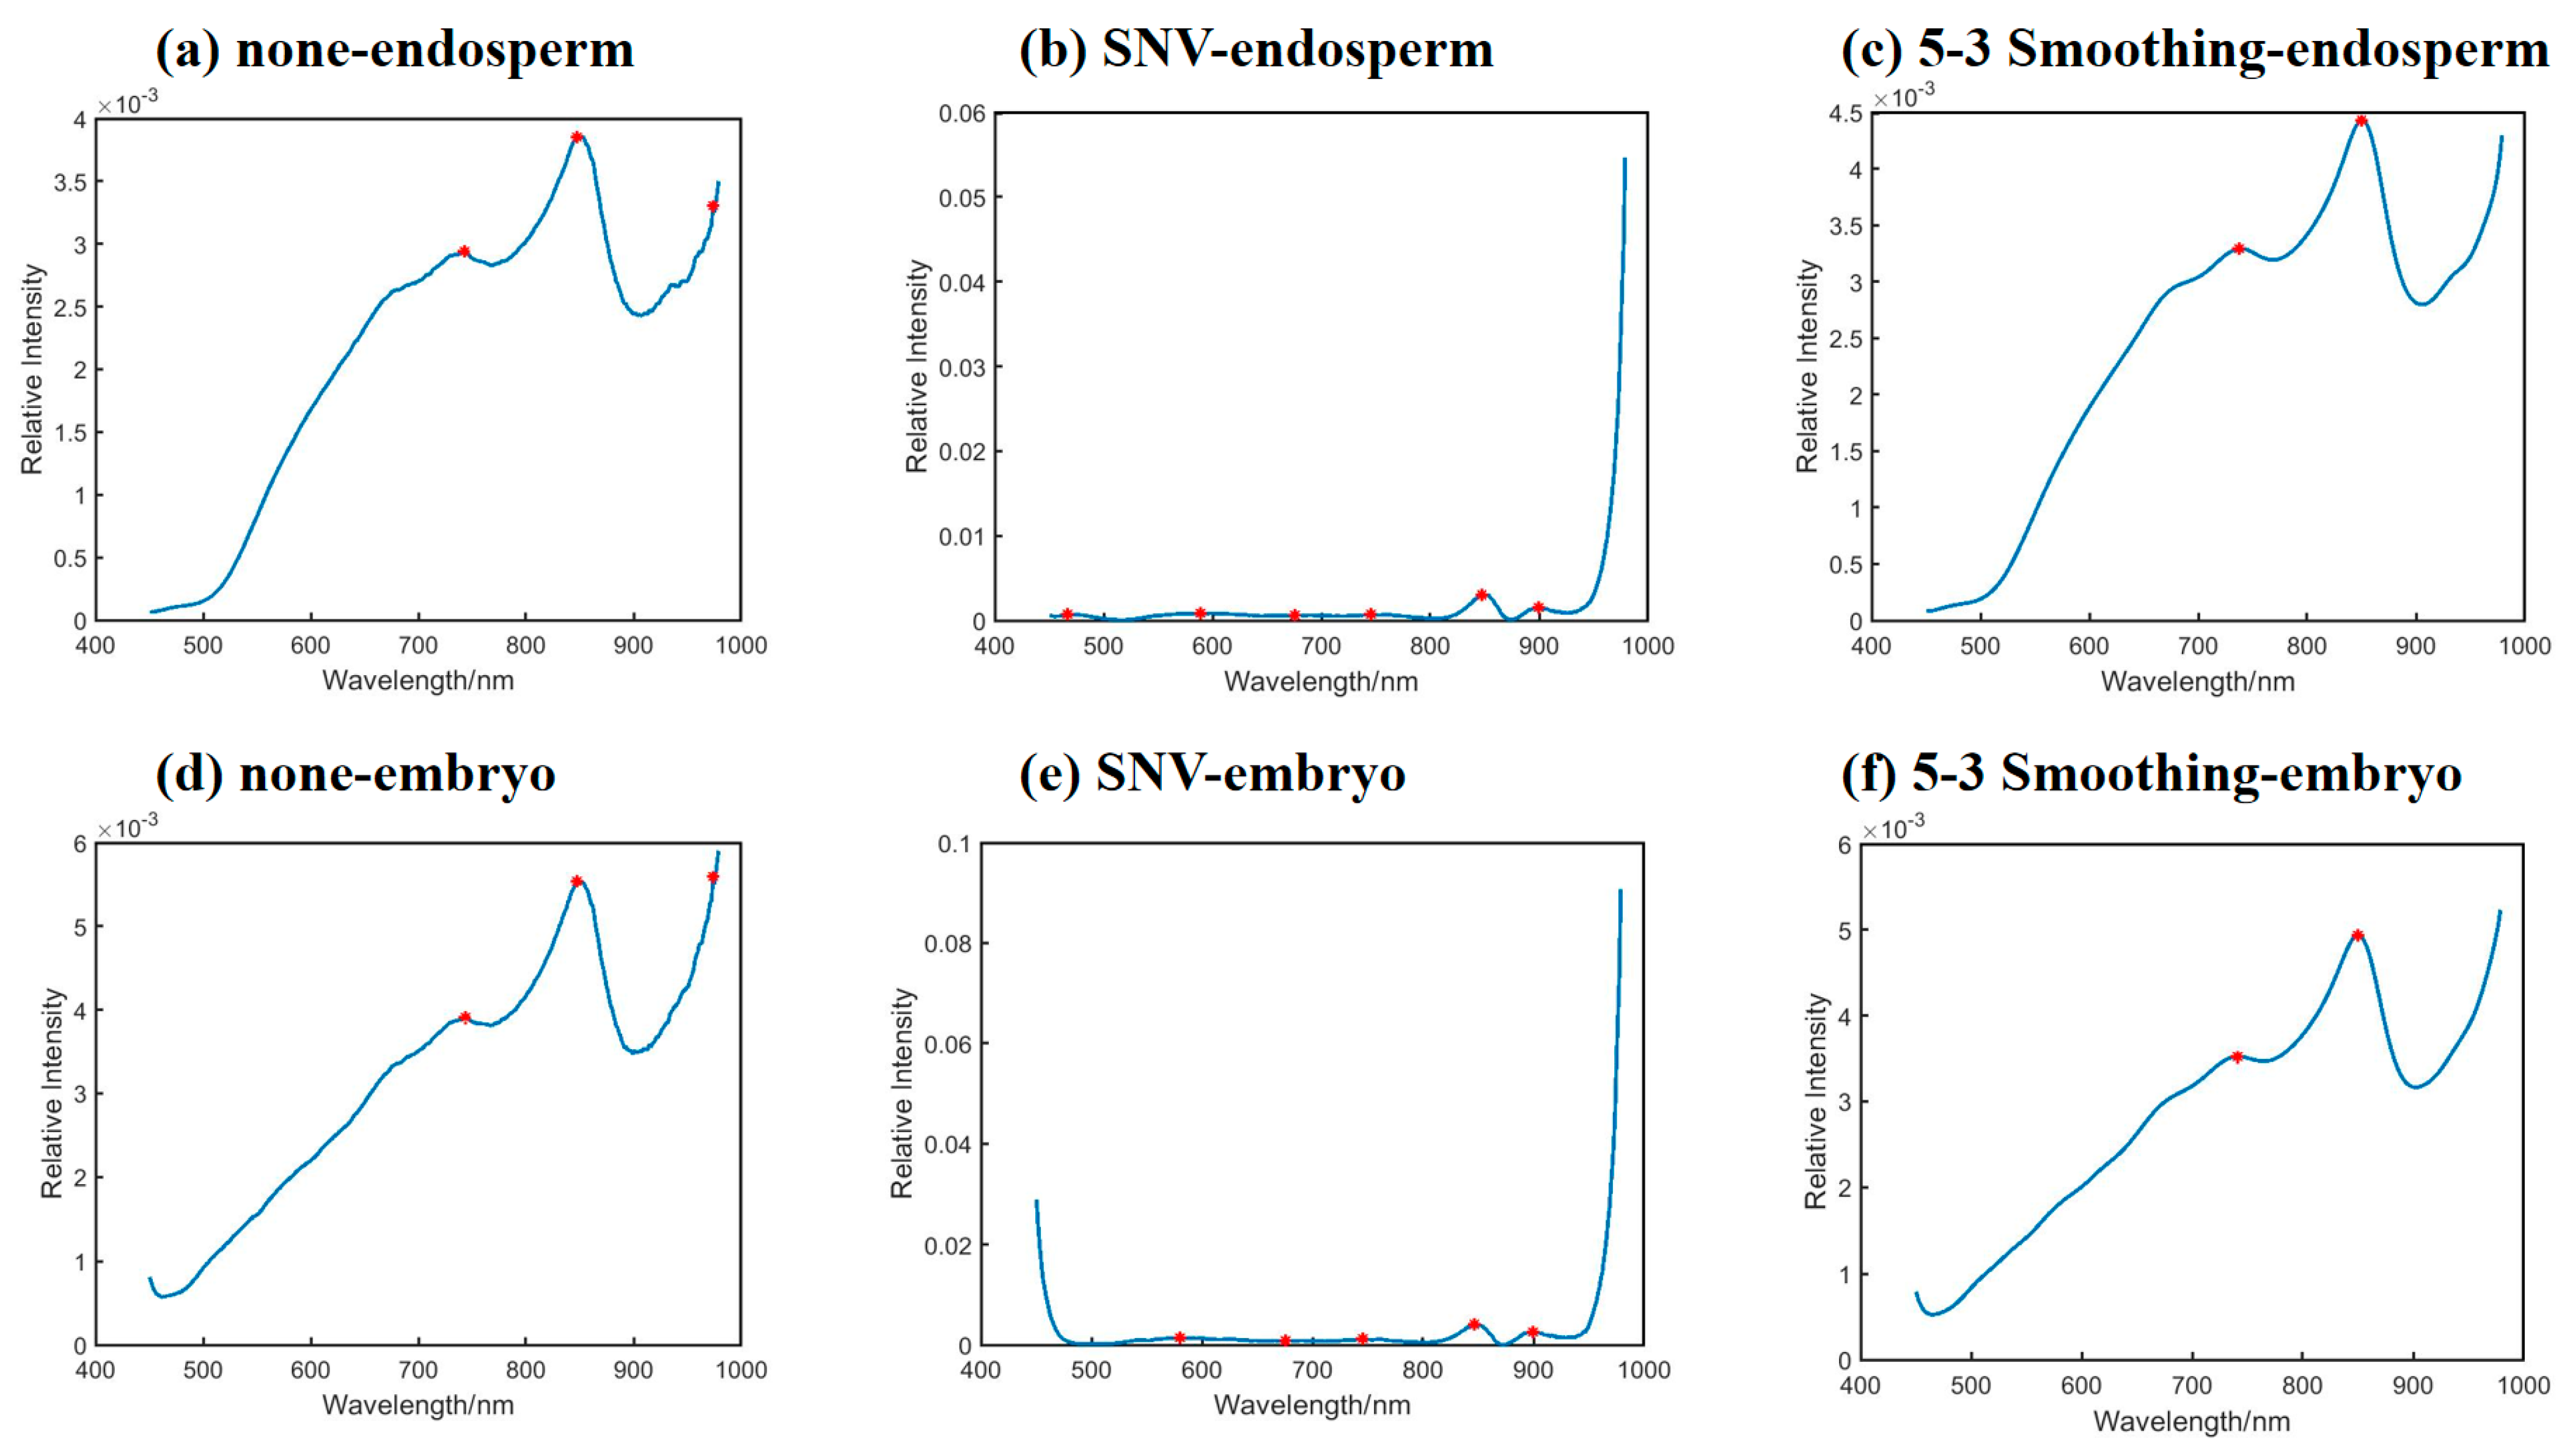
2.1. Original and Preprocessing Spectra
2.2. Selection of Feature Wavelength
2.2.1. SPA
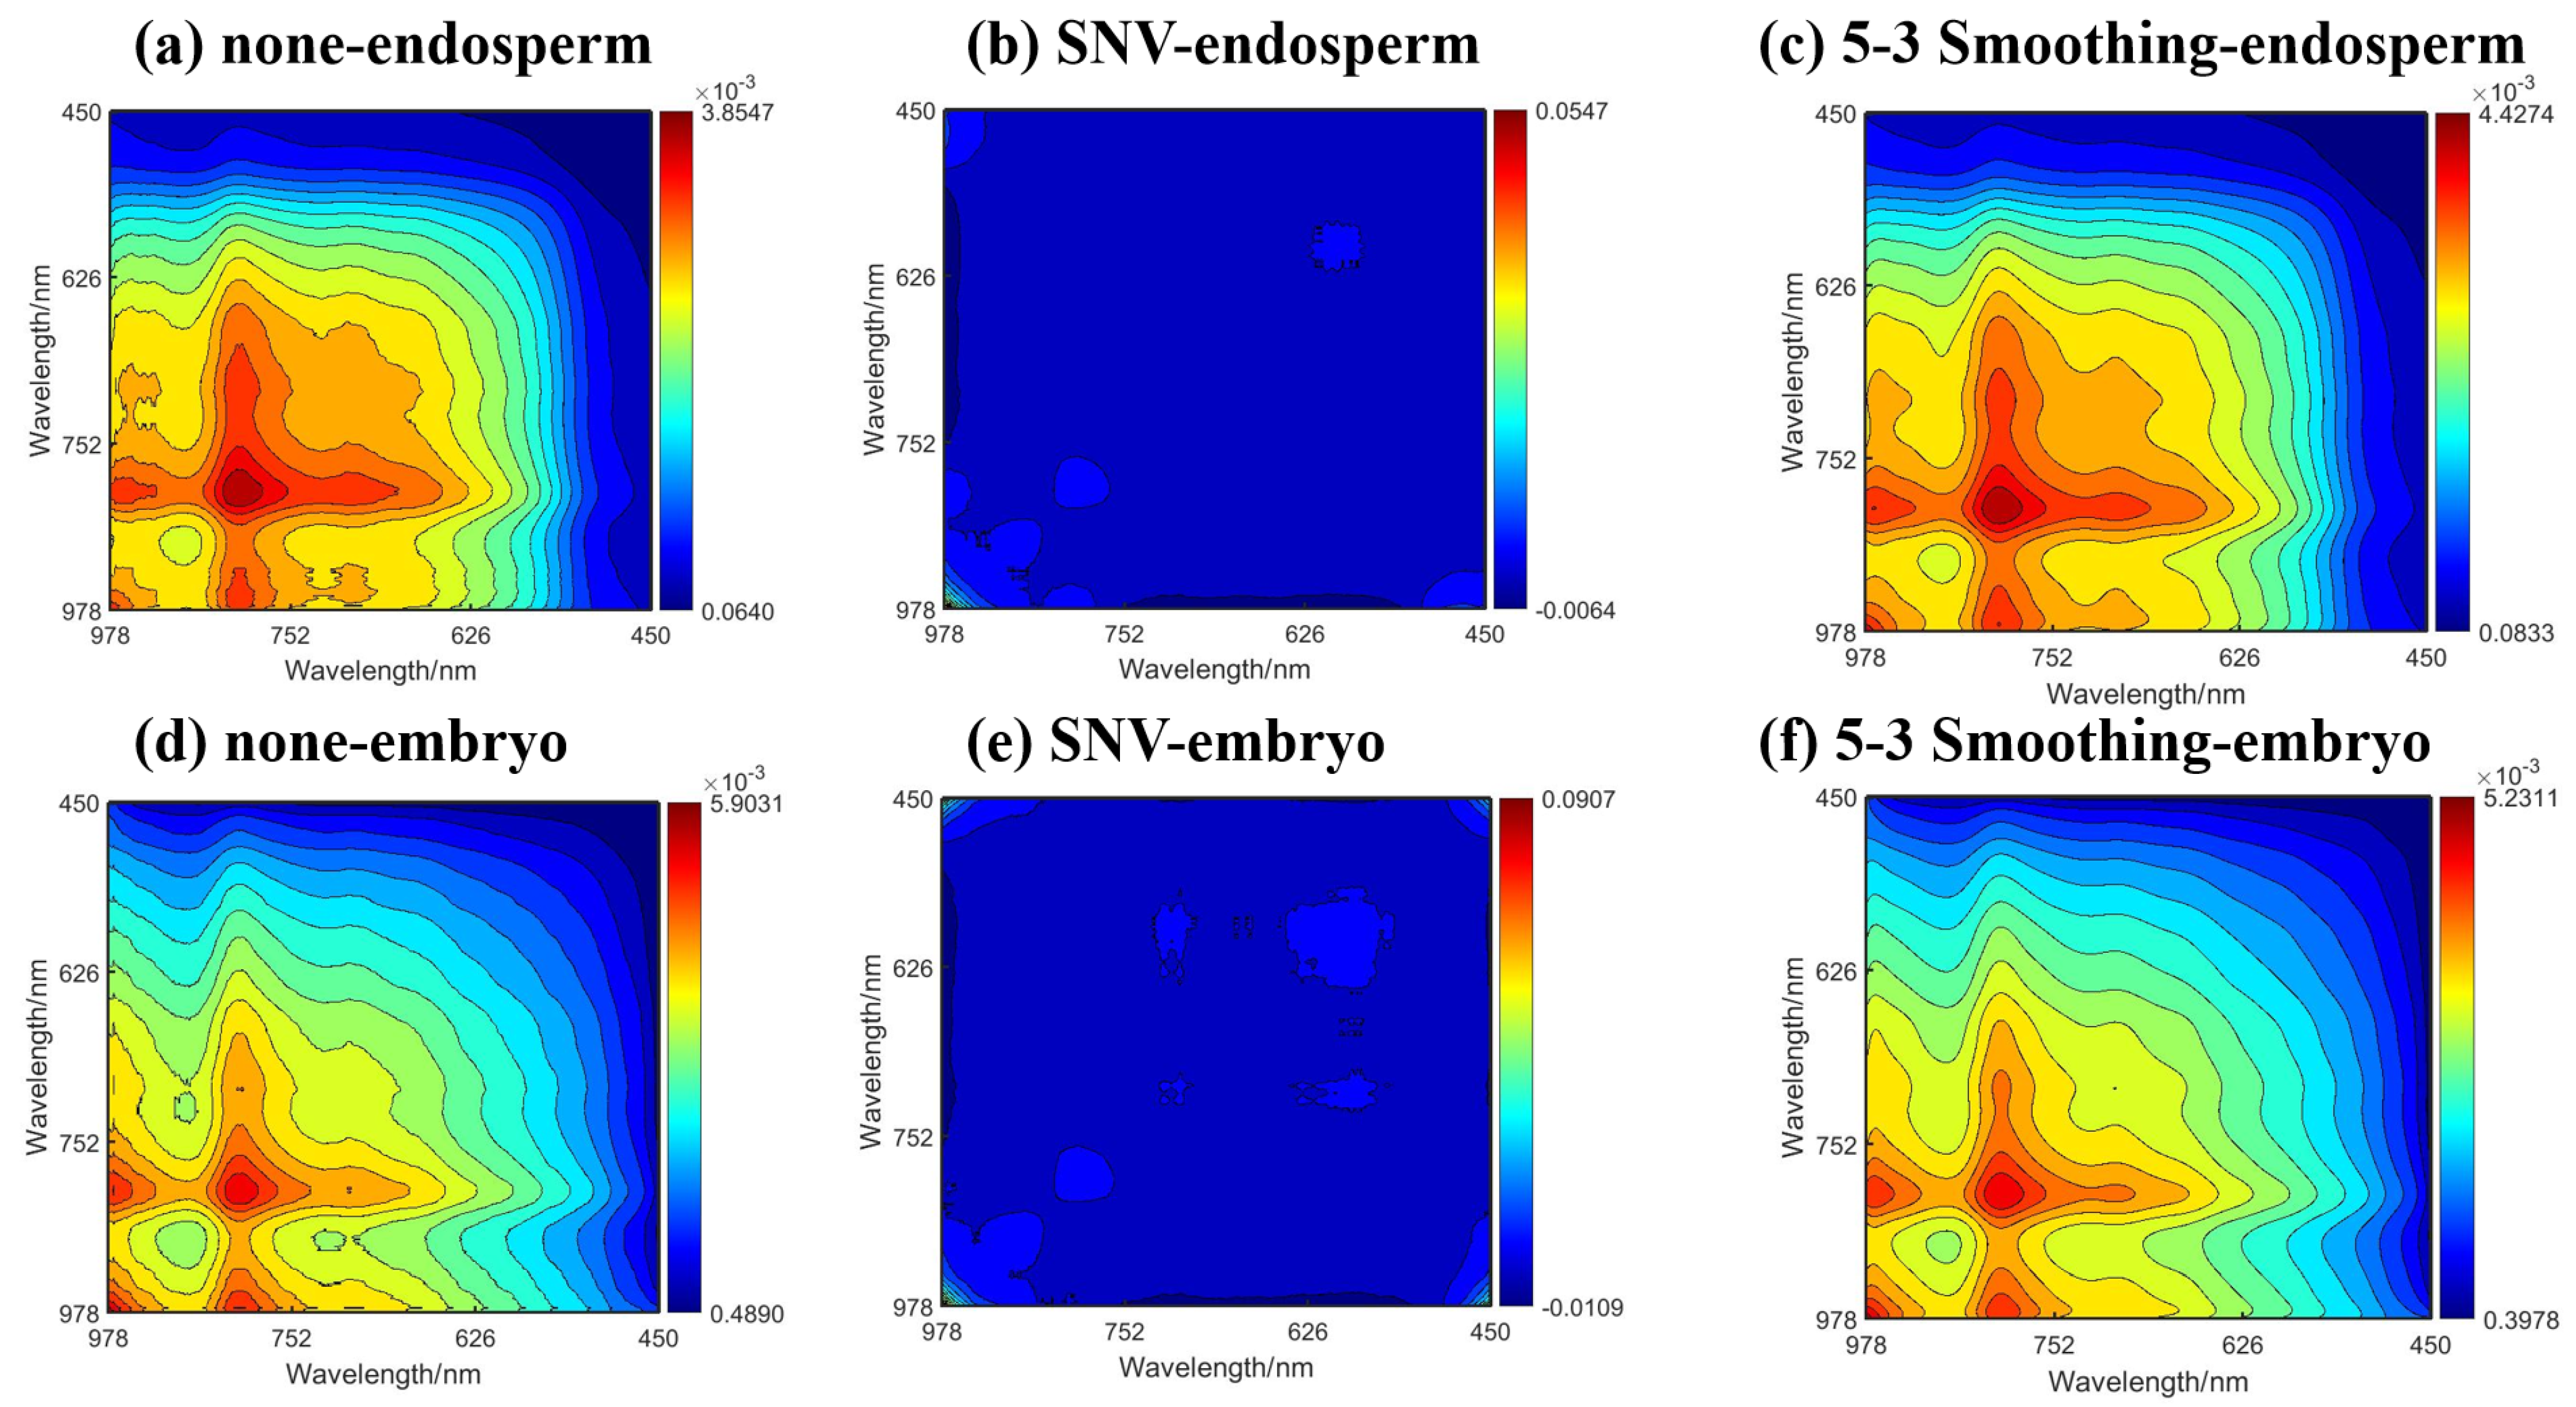
2.2.2. 2DCOS
2.3. Classification Results on Endosperm Side

| Preprocessing | Extraction Methods | KNN | LDA | SVM | |||
|---|---|---|---|---|---|---|---|
| Training | Testing | Training | Testing | Training | Testing | ||
| None | Full-band | 85.8% | 84.7% | 93.4% | 88.5% | 93.0% | 88.6% |
| SPA | 91.9% | 88.5% | 92.3% | 88.8% | 92.6% | 88.3% | |
| 2DCOS | 91.5% | 88.6% | 92.2% | 88.6% | 92.4% | 88.6% | |
| SPA+2DCOS | 91.6% | 88.5% | 92.9% | 89.7% | 92.9% | 88.6% | |
| SNV | Full-band | 90.3% | 87.5% | 93.8% | 88.8% | 92.9% | 90.0% |
| SPA | 90.2% | 86.3% | 92.5% | 88.5% | 92.6% | 90.9% | |
| 2DCOS | 87.3% | 85.8% | 89.0% | 86.7% | 90.2% | 87.2% | |
| SPA+2DCOS | 91.0% | 87.1% | 92.6% | 88.6% | 92.9% | 91.2% | |
| 5-3 smoothing | Full-band | 85.3% | 85.6% | 93.7% | 88.1% | 93.0% | 88.6% |
| SPA | 85.5% | 85.0% | 93.0% | 88.9% | 93.0% | 88.6% | |
| 2DCOS | 77.1% | 74.9% | 82.5% | 81.6% | 83.9% | 82.2% | |
| SPA+2DCOS | 87.1% | 85.8% | 93.0% | 88.9% | 93.0% | 88.6% | |
2.4. Classification Results on Embryo Side
2.5. Model Performance in Optimal Wavelength Selection on Each Side
| Seed Side | Training Set | Testing Set | |||||
|---|---|---|---|---|---|---|---|
| Category 1 | Category 2 | Category 3 | Category 1 | Category 2 | Category 3 | ||
| Endosperm side | Category 1 | 533 | 0 | 0 | 264 | 1 | 2 |
| Category 2 | 3 | 392 | 32 | 2 | 191 | 20 | |
| Category 3 | 7 | 49 | 264 | 4 | 27 | 129 | |
| Sensitivity,% | 100 | 91.8 | 82.5 | 98.9 | 89.7 | 80.6 | |
| Accuracy,% | 92.9 | 91.2 | |||||
| Accuracy RND,% | 34.9 | 34.9 | |||||
| Accuracy-Accuracy RND,% | 58.0 | 56.3 | |||||
| Embryo side | Category 1 | 533 | 0 | 0 | 267 | 0 | 0 |
| Category 2 | 0 | 413 | 14 | 0 | 200 | 13 | |
| Category 3 | 2 | 16 | 302 | 1 | 19 | 140 | |
| Sensitivity,% | 100 | 96.7 | 94.4 | 100 | 93.9 | 87.5 | |
| Accuracy,% | 97.5 | 94.9 | |||||
| Accuracy RND,% | 34.8 | 34.8 | |||||
| Accuracy-Accuracy RND,% | 62.7 | 60.1 | |||||
2.6. Discussion
3. Materials and Methods
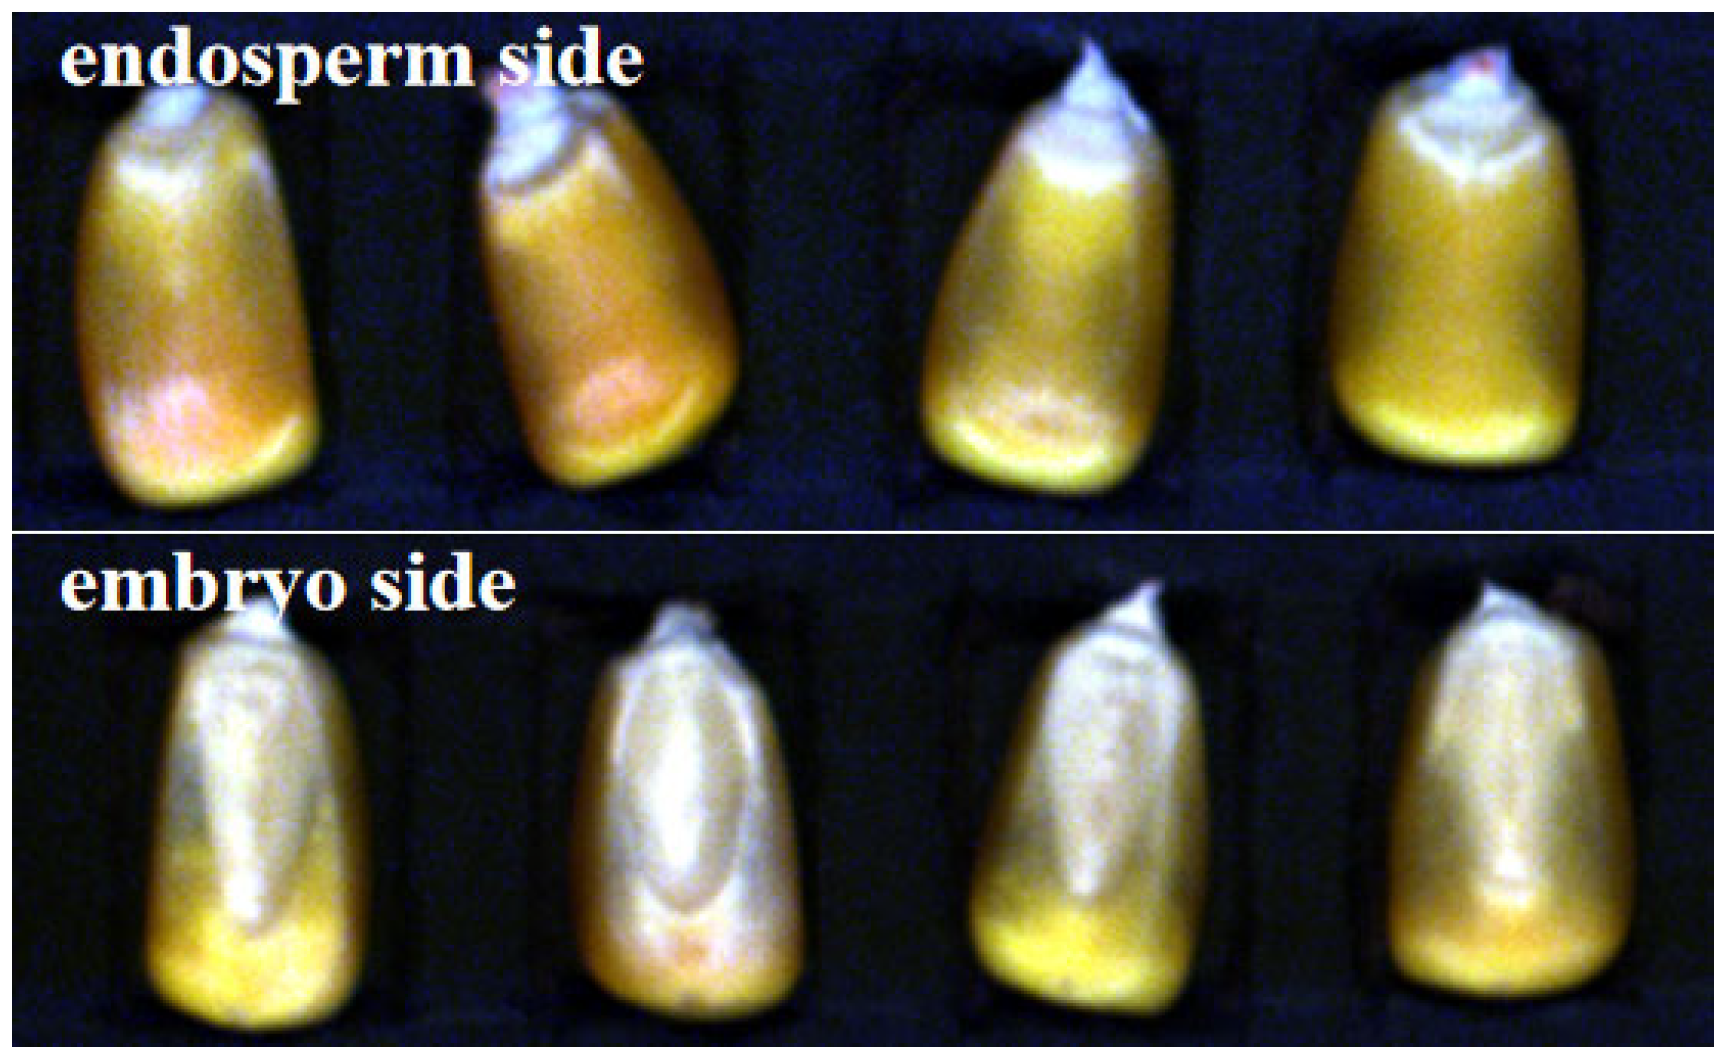
3.1. Sample Preparation
3.2. Hyperspectral Image Acquisition and Correction
3.3. Data Processing Methods
3.3.1. Imaging Segmentation and Spectrum Extraction
3.3.2. Spectrum Preprocessing Methods
3.3.3. Feature Wavelength Extraction Methods
3.3.4. Classification Models
4. Conclusions
Author Contributions
Funding
Institutional Review Board Statement
Informed Consent Statement
Data Availability Statement
Conflicts of Interest
References
- Ambrose, A.; Kandpal, L.M.; Kim, M.S.; Lee, W.; Cho, B. High speed measurement of corn seed viability using hyperspectral imaging. Infrared Phys. Technol. 2016, 75, 173–179. [Google Scholar] [CrossRef]
- Rossman, E.C. Freezing injury of maize seed. Plant Physiol. 1949, 24, 629–656. [Google Scholar] [CrossRef]
- Aboul-Ela, M.M. Physiological changes and freezing injury in maturing maize. Plant Physiol. 1952, 27, 778–786. [Google Scholar] [CrossRef]
- Woltz, J.; Tekrony, D.M.; Egli, D.B. Corn seed germination and vigor following freezing during seed development. Crop Sci. 2006, 46, 1526–1535. [Google Scholar] [CrossRef]
- Devries, M.; Goggi, A.S.; Moore, K.J. Determining seed performance of frost-damaged maize seed lots. Crop Sci. 2007, 47, 2089–2097. [Google Scholar] [CrossRef]
- Zhang, J.; Wang, Z.; Qu, M.; Cheng, F. Research on physicochemical properties, microscopic characterization and detection of different freezing-damaged corn seeds. Food Chem. X 2022, 14, 100338. [Google Scholar] [CrossRef]
- Hampton, J.G.; Tekrony, D.M. Handbook of Vigour Test Methods; ISTA: Zurich, Switzerland, 1995. [Google Scholar]
- Agelet, E.L.; Ellis, D.D.; Duvick, S.; Goggi, A.S.; Hurburgh, C.R.; Gardner, C.A. Feasibility of near infrared spectroscopy for analyzing corn kernel damage and viability of soybean and corn kernels. J. Cereal Sci. 2012, 55, 160–165. [Google Scholar] [CrossRef]
- Jia, S.; Yang, L.; An, D.; Liu, Z.; Yan, Y.; Li, S.; Zhang, X.; Zhu, D.; Gu, J. Feasibility of analyzing frost-damaged and non-viable maize kernels based on near infrared spectroscopy and chemometrics. J. Cereal Sci. 2016, 69, 145–150. [Google Scholar] [CrossRef]
- Sendin, K.; Williams, P.J.; Manley, M. Near infrared hyperspectral imaging in quality and safety evaluation of cereals. Crit. Rev. Food Sci. Nutr. 2018, 58, 575–590. [Google Scholar] [CrossRef]
- Dale, L.M.; Thewis, A.; Boudry, C.; Rotar, I.; Dardenne, P.; Baeten, V.; Fernández Pierna, J.A. Hyperspectral imaging applications in agriculture and agro-food product quality and safety control: A Review. Appl. Spectrosc. Rev. 2013, 48, 142–159. [Google Scholar] [CrossRef]
- Huang, H.; Liu, L.; Ngadi, M. Recent developments in hyperspectral imaging for assessment of food quality and safety. Sensors 2014, 14, 7248–7276. [Google Scholar] [CrossRef]
- Liu, Y.; Pu, H.; Sun, D. Hyperspectral imaging technique for evaluating food quality and safety during various processes: A review of recent applications. Trends Food Sci. Technol. 2017, 69, 25–35. [Google Scholar] [CrossRef]
- Martinez-Pena, R.; Castillo-Girones, S.; Alvarez, S.; Velez, S. Tracing pistachio nuts’ origin and irrigation practices through hyperspectral imaging. Curr. Res. Food Sci. 2024, 9, 100835. [Google Scholar] [CrossRef]
- Gerrit, J.; Anja, D.; Selwin, H.; Esther, M. Imaging spectroscopy for monitoring the crop status of tomato plants. Comput. Electron. Agric. 2024, 216, 108504. [Google Scholar]
- Khan, A.; Vibhute, A.D.; Mali, S.; Patil, C.H. A systematic review on hyperspectral imaging technology with a machine and deep learning methodology for agricultural applications. Ecol. Inform. 2022, 69, 101678. [Google Scholar] [CrossRef]
- Zhang, J.; Dai, L.; Cheng, F. Corn seed variety classification based on hyperspectral reflectance imaging and deep convolutional neural network. J. Food Meas. Charact. 2021, 15, 484–494. [Google Scholar] [CrossRef]
- Zhang, J.; Xu, B.; Wang, Z.; Cheng, F. Application of hyperspectral imaging in the detection of aflatoxin B1 on corn seed. J. Food Meas. Charact. 2022, 16, 448–460. [Google Scholar] [CrossRef]
- Wu, X.; Zeng, S.; Fu, H.; Wu, B.; Zhou, H.; Dai, C. Determination of corn protein content using near-infrared spectroscopy combined with A-CARS-PLS. Food Chem. X 2023, 18, 100666. [Google Scholar] [CrossRef]
- Zhang, J.; Dai, L.; Cheng, F. Classification of Frozen Corn Seeds Using Hyperspectral VIS/NIR Reflectance Imaging. Molecules 2019, 24, 149. [Google Scholar] [CrossRef]
- Lee, L.C.; Liong, C.; Jemain, A.A. A contemporary review on Data Preprocessing (DP) practice strategy in ATR-FTIR spectrum. Chemom. Intell. Lab. Syst. 2017, 163, 64–75. [Google Scholar] [CrossRef]
- Jiao, Y.; Li, Z.; Chen, X.; Fei, S. Preprocessing methods for near-infrared spectrum calibration. J. Chemometr. 2020, 34, e3306. [Google Scholar] [CrossRef]
- Dai, Q.; Cheng, J.H.; Sun, D.W.; Zeng, X.A. Advances in feature selection methods for hyperspectral image processing in foodindustry applications: A review. Crit. Rev. Food Sci. 2015, 55, 1368–1382. [Google Scholar] [CrossRef]
- Li, H.; Liang, Y.; Xu, Q.; Cao, D. Model population analysis for variable selection. J. Chemometr. 2010, 24, 418–423. [Google Scholar] [CrossRef]
- Liu, D.; Sun, D.; Zeng, X. Recent Advances in Wavelength Selection Techniques for Hyperspectral Image Processing in the Food Industry. Food Bioprocess Technol. 2014, 7, 307–323. [Google Scholar] [CrossRef]
- Ramirez, C.A.M.; Greenop, M.; Ashton, L.; Rehman, I.U. Applications of machine learning in spectroscopy. Appl. Spectrosc. Rev. 2021, 8–10, 733–763. [Google Scholar] [CrossRef]
- Zhang, X.; Liu, F.; He, Y.; Li, X. Application of Hyperspectral Imaging and Chemometric Calibrations for Variety Discrimination of Maize Seeds. Sensors 2012, 12, 17234–17246. [Google Scholar] [CrossRef]
- Wang, L.; Sun, D.; Pu, H.; Zhu, Z. Application of Hyperspectral Imaging to Discriminate the Variety of Maize Seeds. Food Anal. Method 2016, 9, 225–234. [Google Scholar] [CrossRef]
- You, Z.; Hong, H.; Cheng, F.; Yang, X. Feasibility of 2DCOS based on ATR-MIR in surimi quality inspection. Spectrosc. Spectr. Anal. 2018, 38, 1626–1632. [Google Scholar]
- Jiang, H.; Wang, W.; Zhuang, H.; Yoon, S.; Yang, Y.; Zhao, X. Hyperspectral imaging for a rapid detection and visualization of duck meat adulteration in beef. Food Anal. Methods 2019, 12, 2205–2215. [Google Scholar] [CrossRef]
- Zheng, Q. Influence of Freezing Injury on Germination Characteristics and Structure of Hybrid Maize Seed. Master’s Thesis, Gansu Agricultural University, Lanzhou, China, 2010. [Google Scholar]
- Zhang, J.; Dai, L.; Cheng, F. Identification of Corn Seeds with Different Freezing Damage Degree Based on Hyperspectral Reflectance Imaging and Deep Learning Method. Food Anal. Methods 2021, 14, 389–400. [Google Scholar] [CrossRef]
- Zhang, J.; Dai, L. Application of Hyperspectral Imaging and Deep Convolutional Neural Network for Freezing Damage Identification on Embryo and Endosperm Side of Single Corn Seed. Foods 2025, 14, 659. [Google Scholar] [CrossRef]
- Ruiz, J.R.R.; Parello, T.C.; Gomez, R.C. Comparative study of multivariate methods to identify paper finishes using infrared spectroscopy. IEEE Trans. Instrum. Meas. 2012, 61, 1029–1036. [Google Scholar] [CrossRef]
- Lei, T.; Lin, X.H.; Sun, D.W. Rapid classification of commercial Cheddar cheeses from different brands using PLSDA, LDA and SPA–LDA models built by hyperspectral data. J. Food Meas. Charact. 2019, 13, 3119–3129. [Google Scholar] [CrossRef]
- Mavroforakis, M.; Theodoridis, S. A geometric approach to support vector machine (SVM) classification. IEEE Trans. Neural Netw. 2006, 17, 671–682. [Google Scholar] [CrossRef]
- de Sousa Fernandes, D.D.; de Almeida, V.E.; Fontes, M.M.; de Araújo, M.C.U.; Véras, G.; Diniz, P.H.G.D. Simultaneous identification of the wood types in aged cachaças and their adulterations with wood extracts using digital images and SPA-LDA. Food Chem. 2019, 273, 77–84. [Google Scholar] [CrossRef]
- Luěic, B.; Batista, J.; Bojovic, V.; Lovric, M.; Krzic, A.S.; Bešlo, D.; Nadramija, D.; Vikié-Topié, D. Estimation of random accuracy and its use in validation of predictive quality of classification models within predictive challenges. Croat. Chem. Acta 2019, 92, 379–391. [Google Scholar]


| None | Endosperm Wavelength/nm (Number) | Embryo Wavelength/nm (Number) |
|---|---|---|
| Full-band | 450–979 (420) | 450–979 (420) |
| SPA | 839, 903, 949, 979 (4) | 450, 454, 467, 490, 504, 538, 636, 686, 800, 859, 891, 979 (12) |
| 2DCOS | 743, 848, 974 (3) | 744, 848, 974 (3) |
| SPA+2DCOS | 743, 839, 848, 903, 949, 974, 979 (7) | 450, 454, 467, 490, 504, 538, 636, 686, 744, 800, 848, 859, 891, 974, 979 (15) |
| SNV | Endosperm Wavelength/nm (Number) | Embryo Wavelength/nm (Number) |
| Full-band | 450–979 (420) | 450–979 (420) |
| SPA | 509, 523, 586, 705, 738, 770, 809, 820, 873, 879, 886, 904, 921 (13) | 509, 520, 554, 640, 703, 743, 800, 876, 886, 911, 922, 938 (12) |
| 2DCOS | 467, 589, 676, 745, 848, 899 (6) | 580, 676, 745, 846, 899 (5) |
| SPA+2DCOS | 467, 509, 523, 586, 589, 676, 705, 738, 745, 770, 809, 820, 848, 873, 879, 886, 899, 904, 921 (19) | 509, 520, 554, 580, 640, 676, 703, 743, 745, 800, 846, 876, 886, 899, 911, 922, 938 (17) |
| 5-3 smoothing | Endosperm Wavelength/nm (Number) | Embryo Wavelength/nm (Number) |
| Full-band | 450–979 (420) | 450–979 (420) |
| SPA | 550, 576, 638, 696, 736, 832, 864, 949, 961 (9) | 450, 470, 487, 511, 532, 562, 700, 740, 825, 854, 876, 949, 962, 973 (14) |
| 2DCOS | 738, 850 (2) | 742, 850 (2) |
| SPA+2DCOS | 550, 576, 638, 696, 736, 738, 832, 850, 864, 949, 961 (11) | 450, 470, 487, 511, 532, 562, 700, 740, 742, 825, 850, 854, 876, 949, 962, 973 (16) |
| Preprocessing | Extraction Methods | KNN | LDA | SVM | |||
|---|---|---|---|---|---|---|---|
| Training | Testing | Training | Testing | Training | Testing | ||
| None | Full-band | 94.2% | 89.1% | 96.6% | 93.3% | 97.3% | 94.1% |
| SPA | 94.5% | 89.9% | 97.3% | 94.4% | 96.6% | 93.1% | |
| 2DCOS | 92.0% | 88.2% | 93.9% | 89.7% | 93.6% | 89.6% | |
| SPA+2DCOS | 94.7% | 90.3% | 97.5% | 94.9% | 96.7% | 93.2% | |
| SNV | Full-band | 93.9% | 91.2% | 96.9% | 93.0% | 98.1% | 95.4% |
| SPA | 93.1% | 89.8% | 95.0% | 92.3% | 96.7% | 93.1% | |
| 2DCOS | 90.5% | 85.9% | 93.0% | 87.2% | 93.1% | 87.2% | |
| SPA+2DCOS | 94.1% | 89.5% | 95.0% | 92.2% | 96.7% | 94.1% | |
| 5-3 smoothing | Full-band | 94.1% | 88.7% | 97.7% | 95.9% | 97.3% | 94.0% |
| SPA | 94.4% | 89.6% | 97.7% | 94.8% | 97.2% | 93.8% | |
| 2DCOS | 66.8% | 70.3% | 80.2% | 75.8% | 80.3% | 75.8% | |
| SPA+2DCOS | 95.0% | 89.8% | 97.7% | 94.8% | 97.2% | 93.8% | |
Disclaimer/Publisher’s Note: The statements, opinions and data contained in all publications are solely those of the individual author(s) and contributor(s) and not of MDPI and/or the editor(s). MDPI and/or the editor(s) disclaim responsibility for any injury to people or property resulting from any ideas, methods, instructions or products referred to in the content. |
© 2025 by the authors. Licensee MDPI, Basel, Switzerland. This article is an open access article distributed under the terms and conditions of the Creative Commons Attribution (CC BY) license (https://creativecommons.org/licenses/by/4.0/).
Share and Cite
Zhang, J.; Dai, L.; Zhuang, R. Corn Seed Freezing Damage Identification of Different Sides Based on Hyperspectral Imaging and SPA-2DCOS Fusion Algorithm. Molecules 2025, 30, 2178. https://doi.org/10.3390/molecules30102178
Zhang J, Dai L, Zhuang R. Corn Seed Freezing Damage Identification of Different Sides Based on Hyperspectral Imaging and SPA-2DCOS Fusion Algorithm. Molecules. 2025; 30(10):2178. https://doi.org/10.3390/molecules30102178
Chicago/Turabian StyleZhang, Jun, Limin Dai, and Ruiyuan Zhuang. 2025. "Corn Seed Freezing Damage Identification of Different Sides Based on Hyperspectral Imaging and SPA-2DCOS Fusion Algorithm" Molecules 30, no. 10: 2178. https://doi.org/10.3390/molecules30102178
APA StyleZhang, J., Dai, L., & Zhuang, R. (2025). Corn Seed Freezing Damage Identification of Different Sides Based on Hyperspectral Imaging and SPA-2DCOS Fusion Algorithm. Molecules, 30(10), 2178. https://doi.org/10.3390/molecules30102178