
Influence of Hydrothermal Modification on Adsorptive Performance of Clay Minerals for Malachite Green

Abstract
1. Introduction
2. Materials and Methods
2.1. Materials
2.2. Preparation of Materials
2.2.1. Expanded Graphite
2.2.2. Hydrothermal Modification of Base Material
2.2.3. Granulation of CM-HT
2.3. Characterization of Adsorbents
2.4. Adsorption Test
2.5. Static Regeneration Test
2.6. Conditions and Variables of the Tests
2.6.1. Temperature
2.6.2. Time
2.6.3. Liquid/Solid Ratio
2.6.4. Adsorbent Concentration
- (1)
- Test conditions
- (2)
- Test variables
2.6.5. Initial Dye Concentration
- (1)
- Test conditions
- (2)
- Test variables
2.6.6. Adsorption Time
- (1)
- Test conditions
- (2)
- Test variables
2.6.7. Initial pH
- (1)
- Test conditions
- (2)
- Test variables
2.6.8. Desorbed Recycling of Adsorbents
3. Results and Discussion
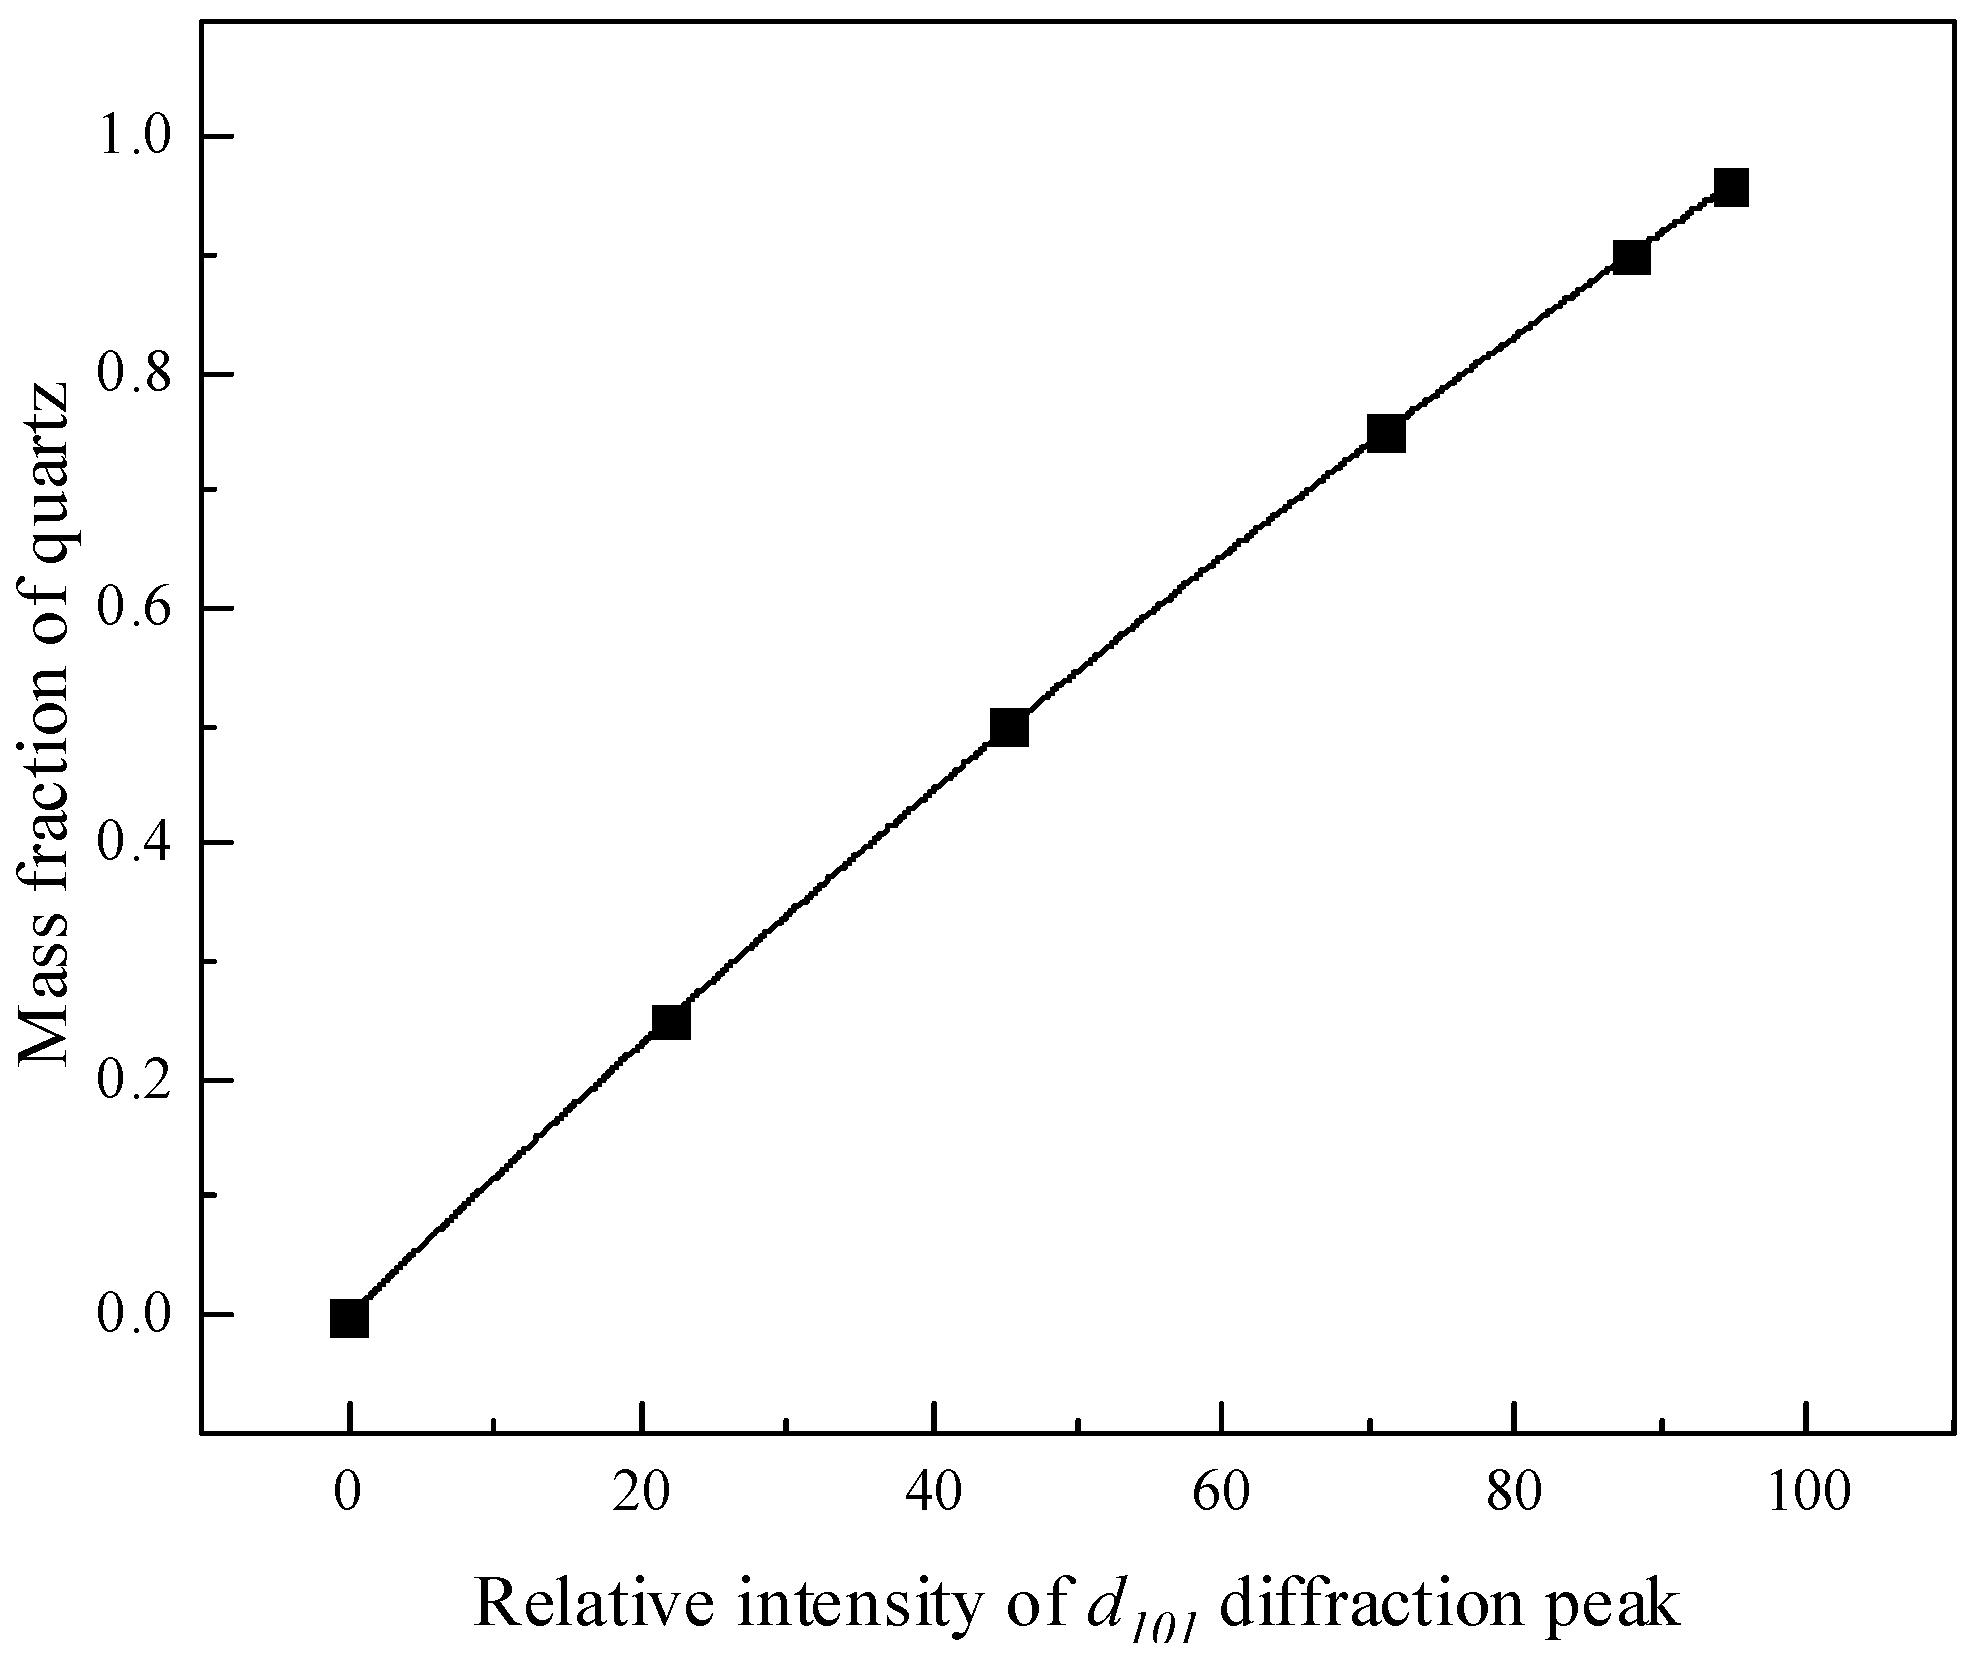
3.1. XRD Quantitative Analysis of Clays
3.1.1. Establishment of the Standard Curve
- (1)
- The standard curve of pyrite
- (2)
- The standard curve of quartz
3.1.2. The Content Calculation
- (1)
- The content of rectorite
- (2)
- The content of montmorillonite
3.2. Influence of Hydrothermal Modification Process
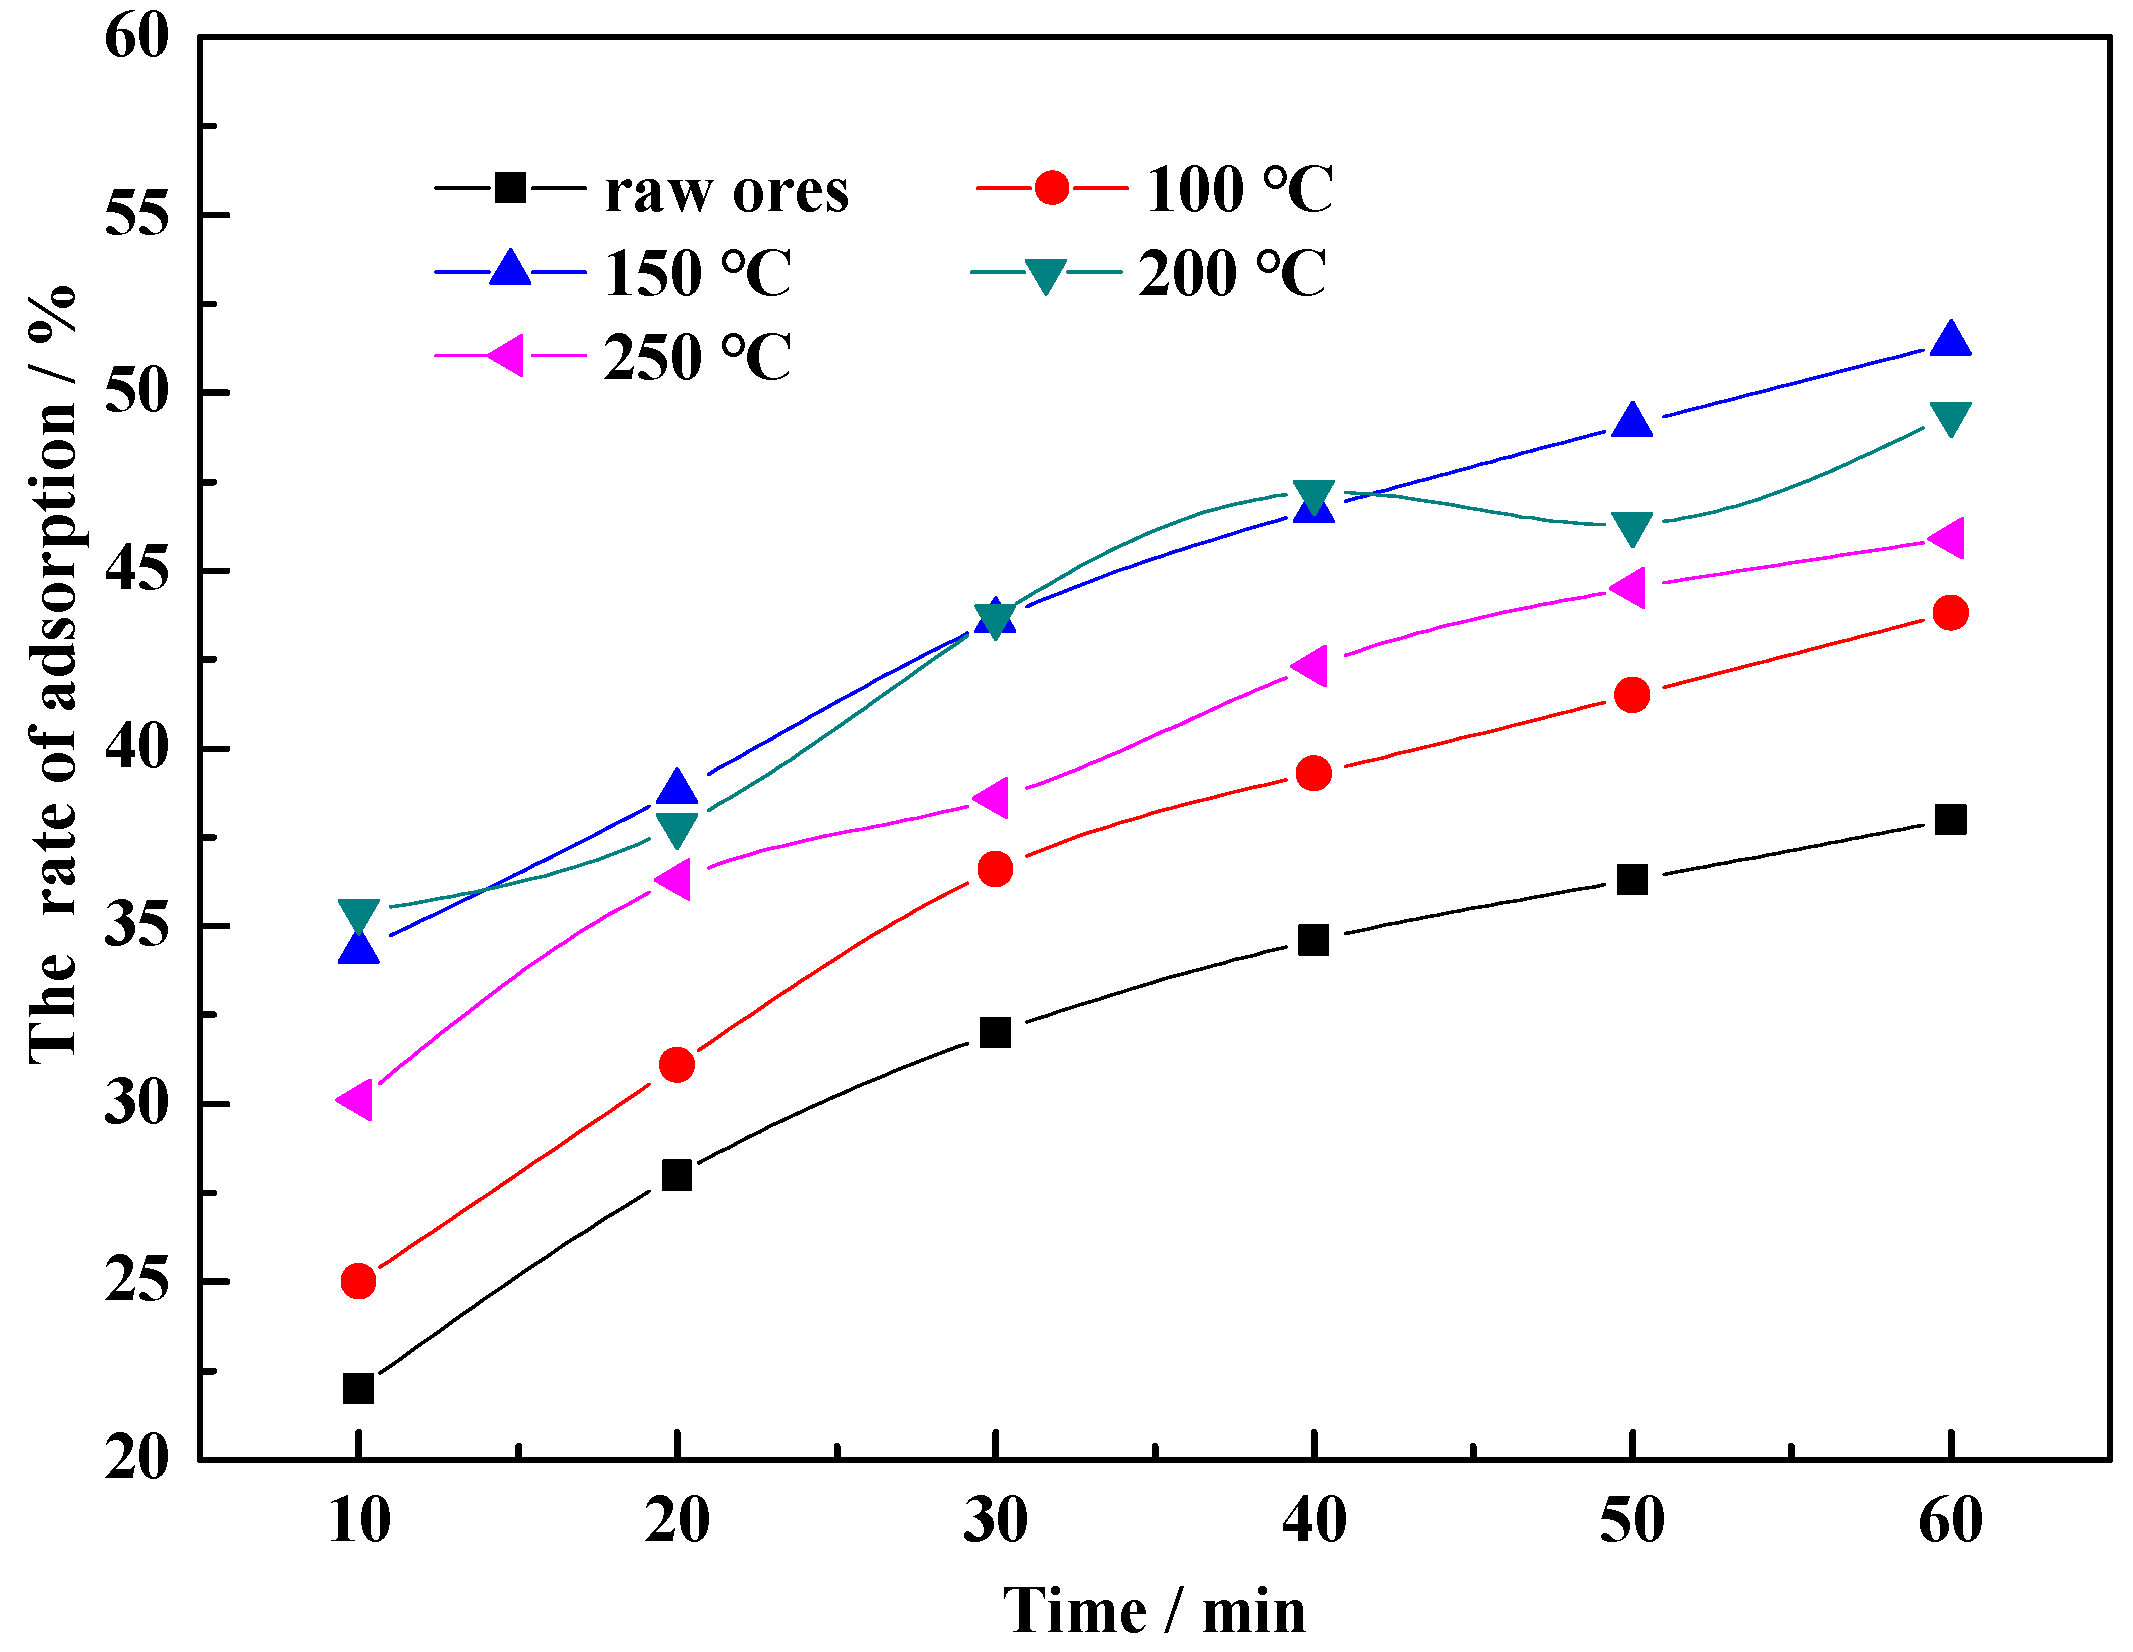
3.2.1. Temperature
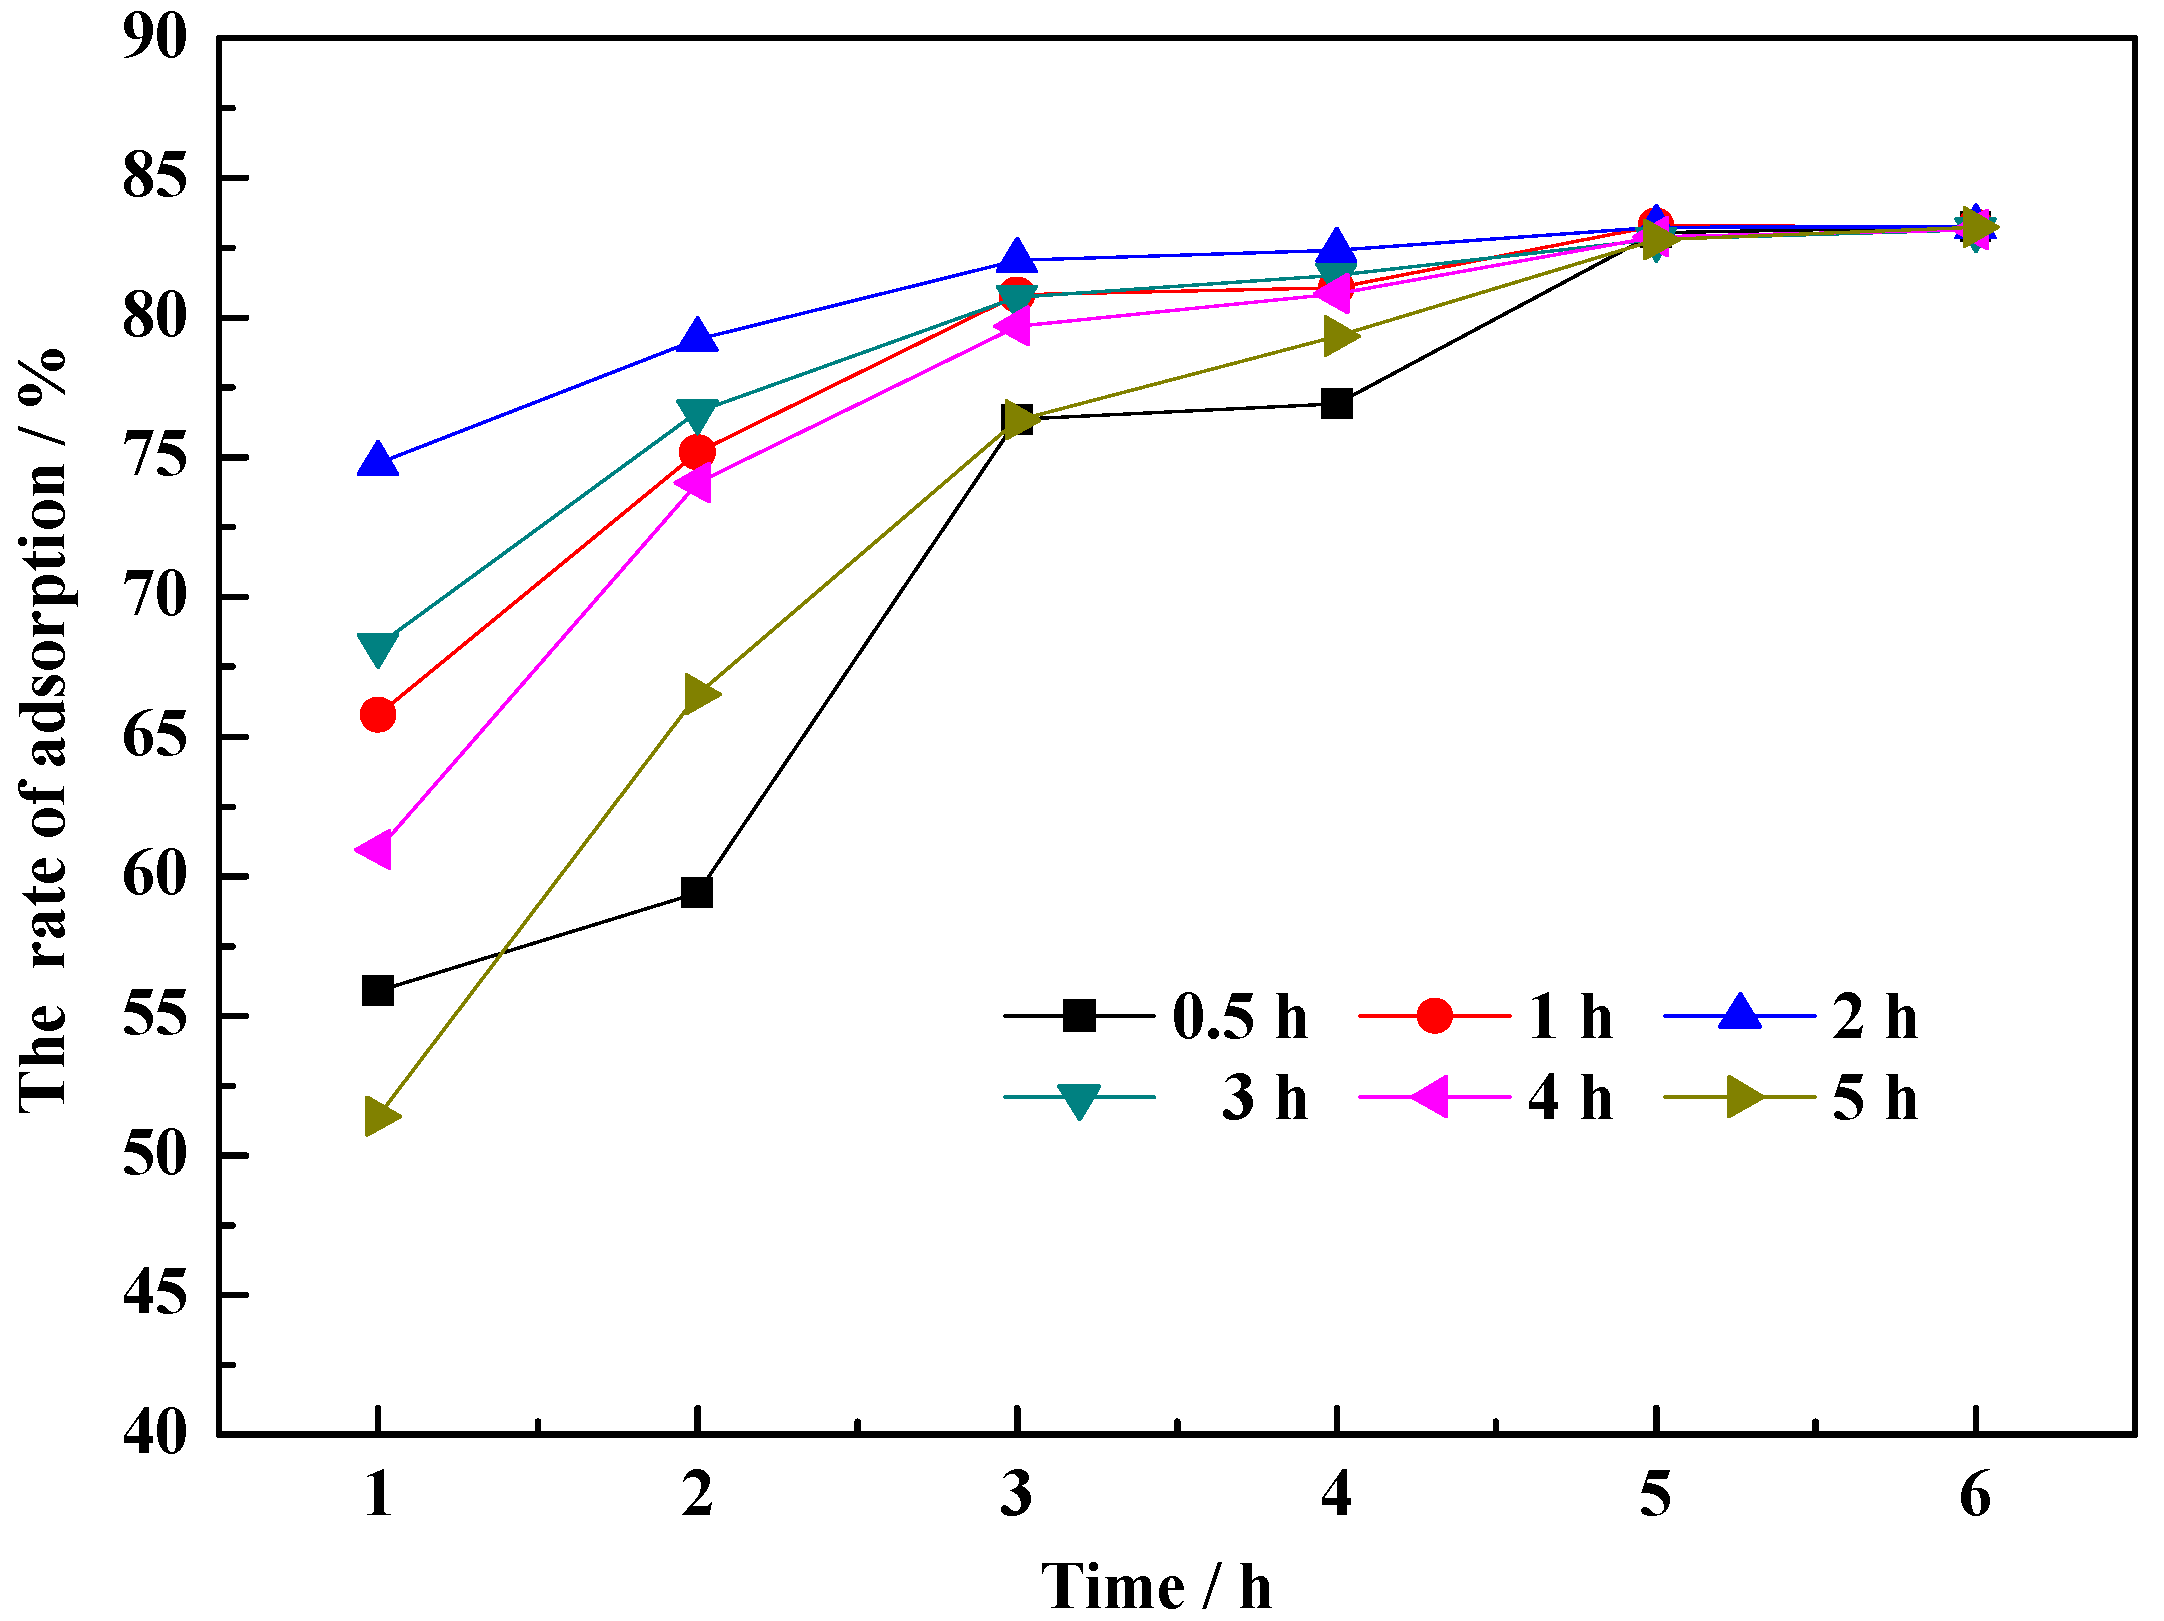
3.2.2. Time
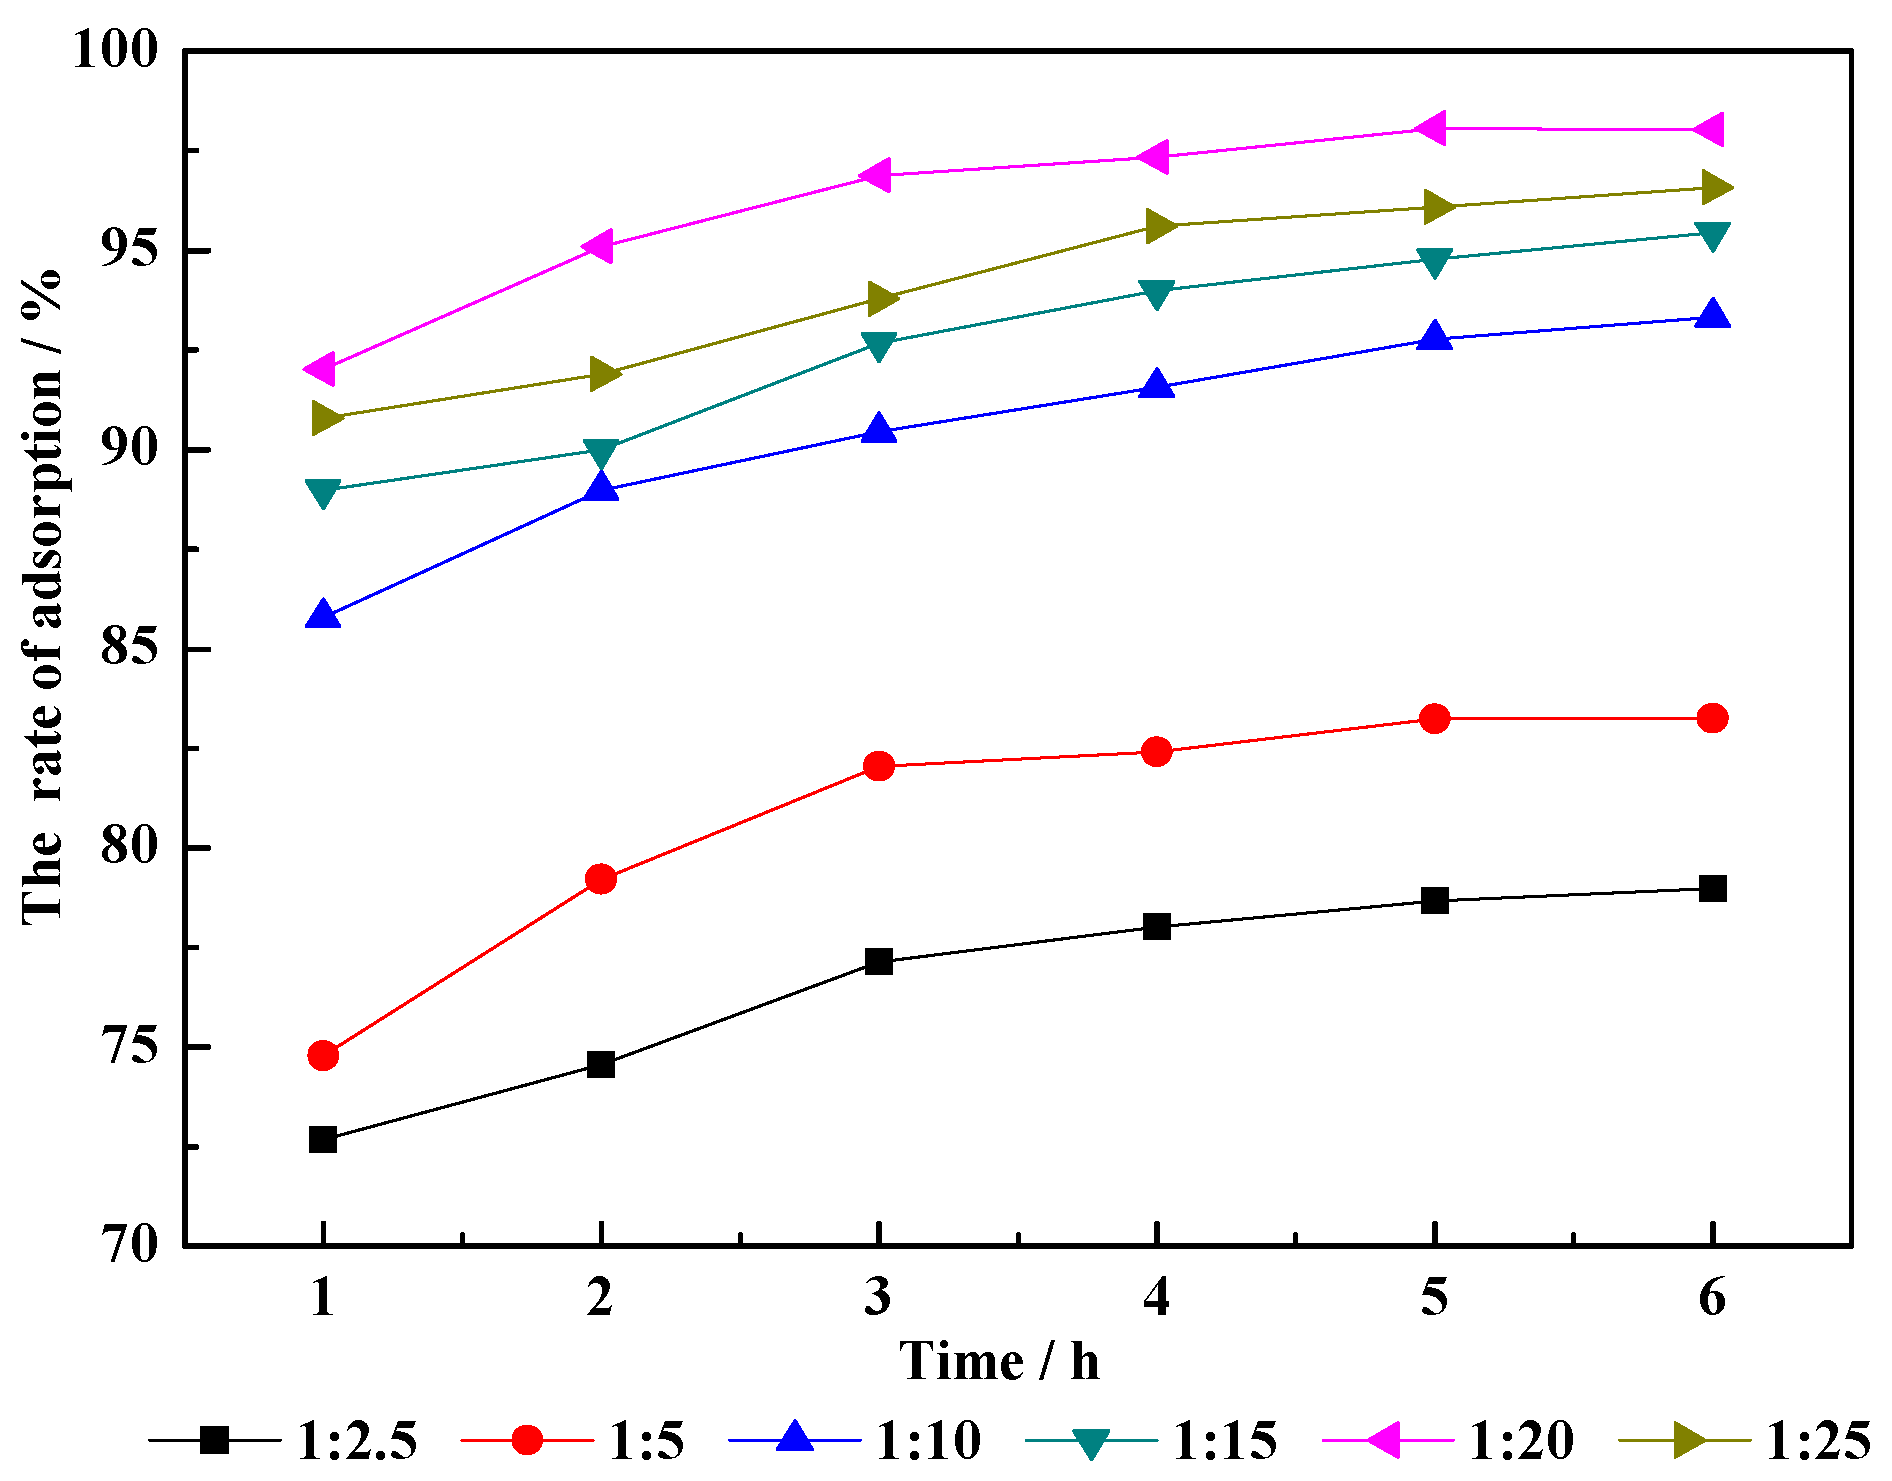
3.2.3. Liquid/Solid Ratio
3.3. Characteristics of Adsorbents
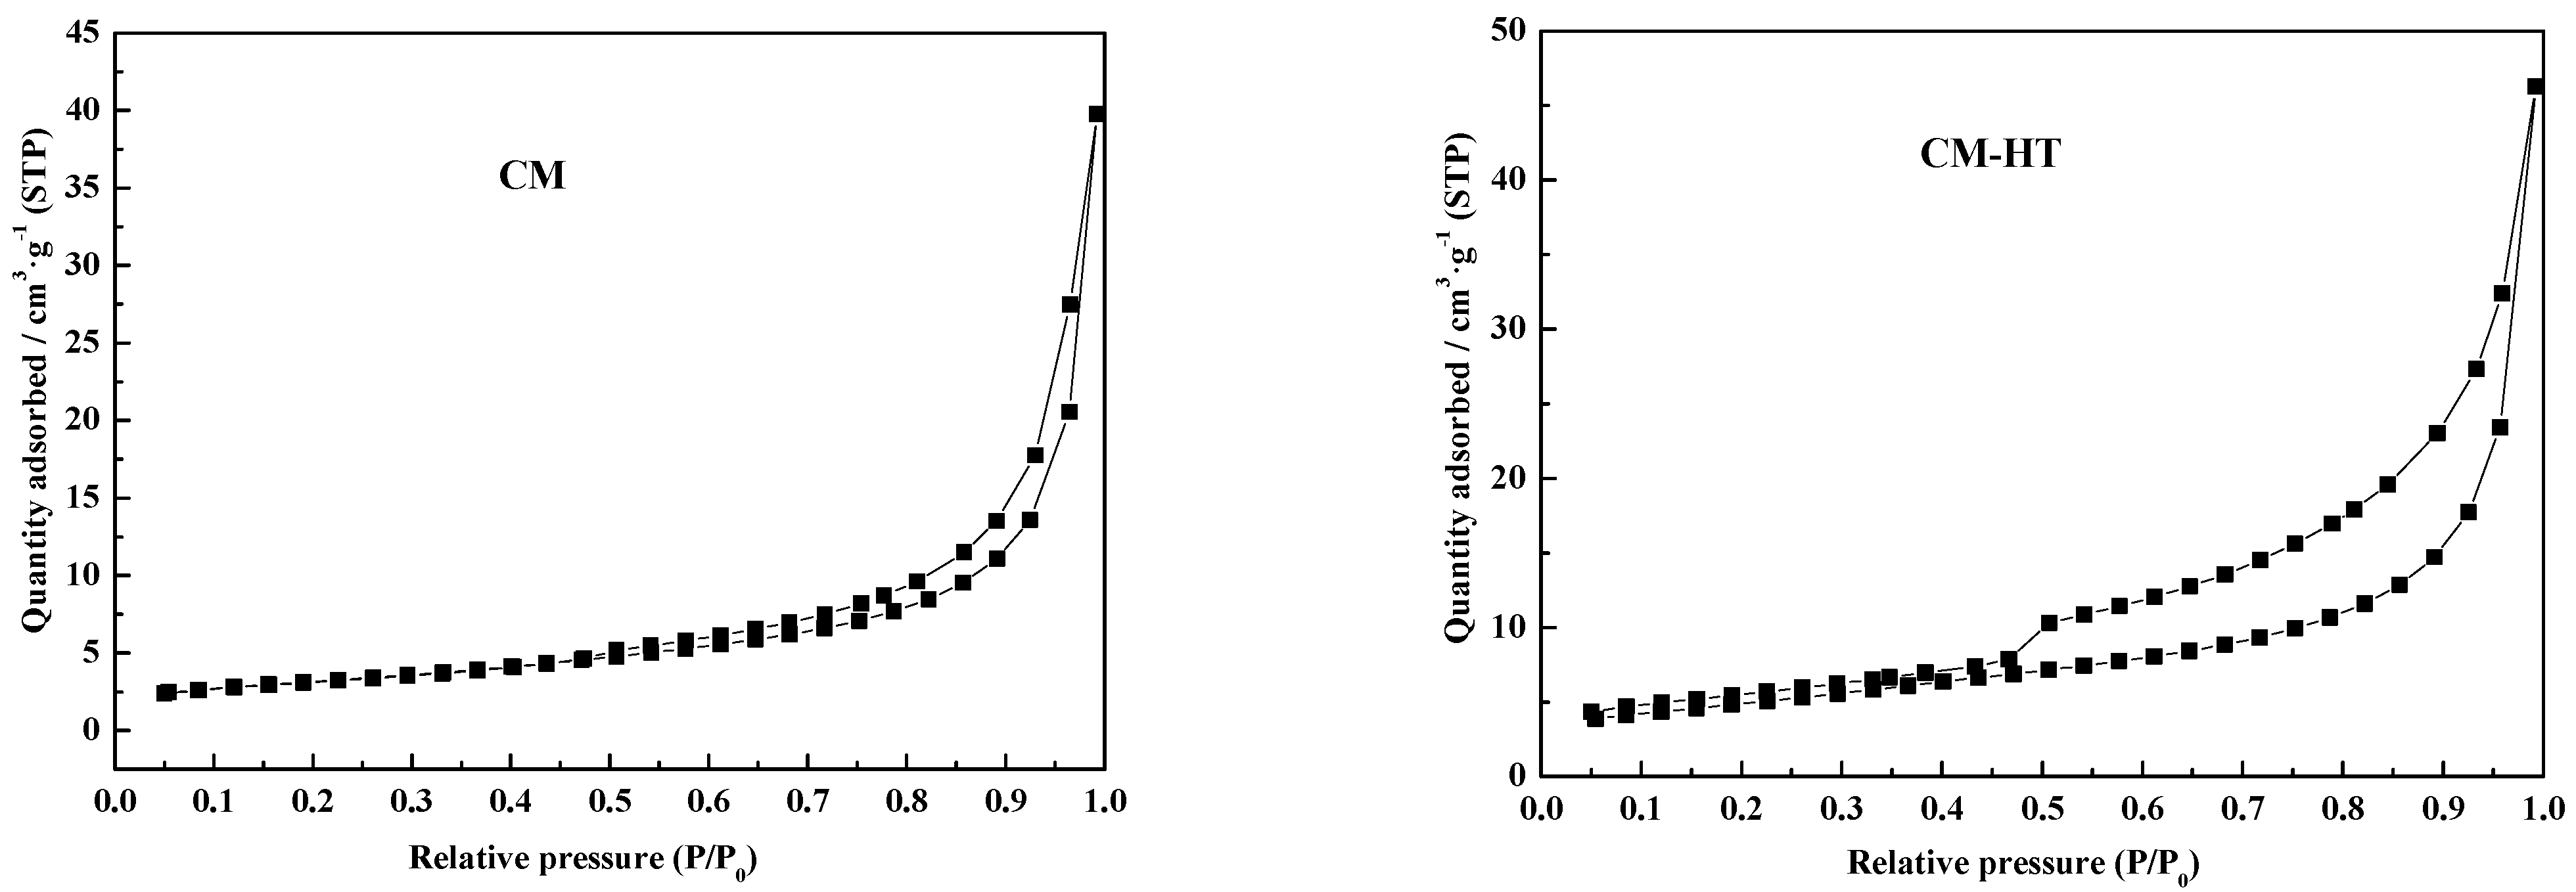
3.3.1. Physical Characteristics
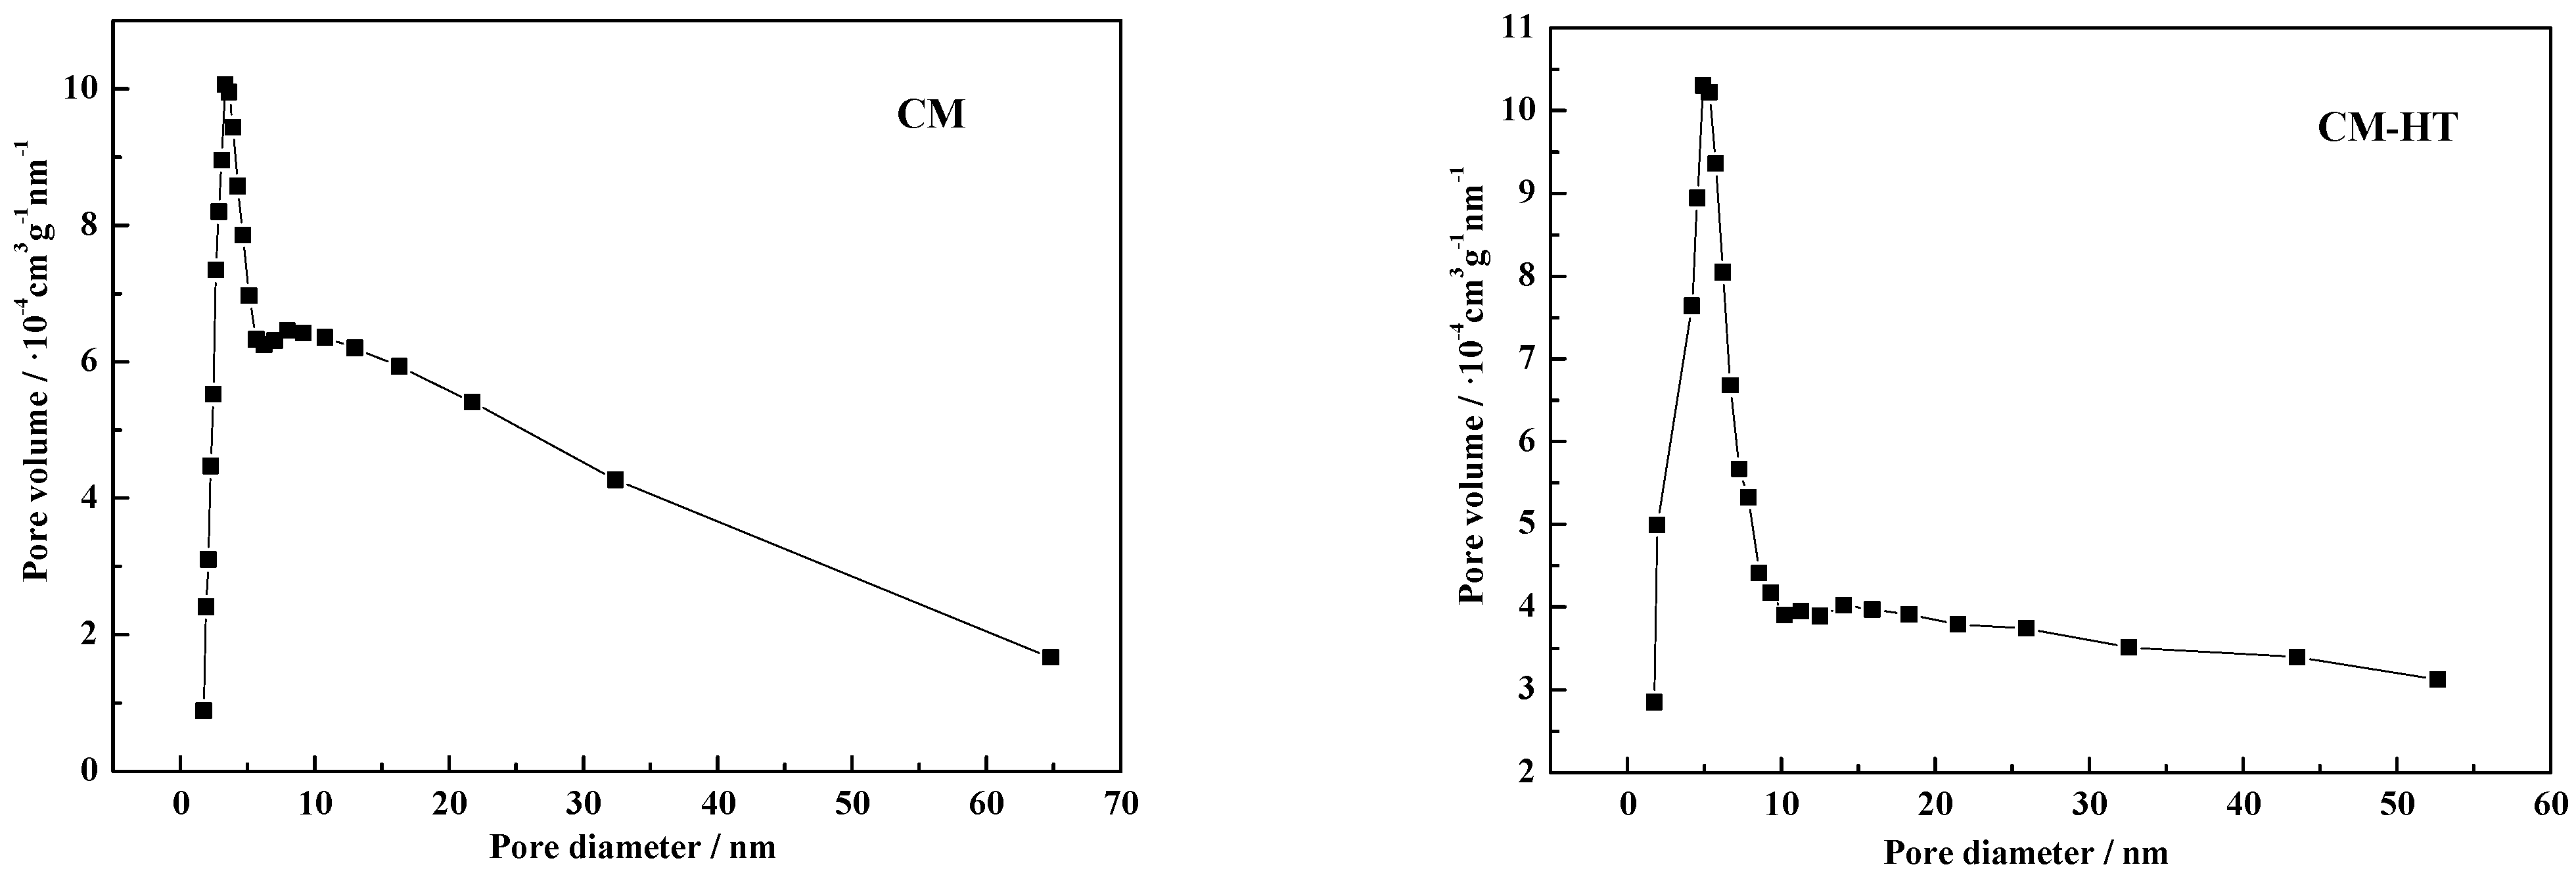
3.3.2. Change of Pore Size Distribution
3.3.3. Change of N2 adsorption/desorption isotherm
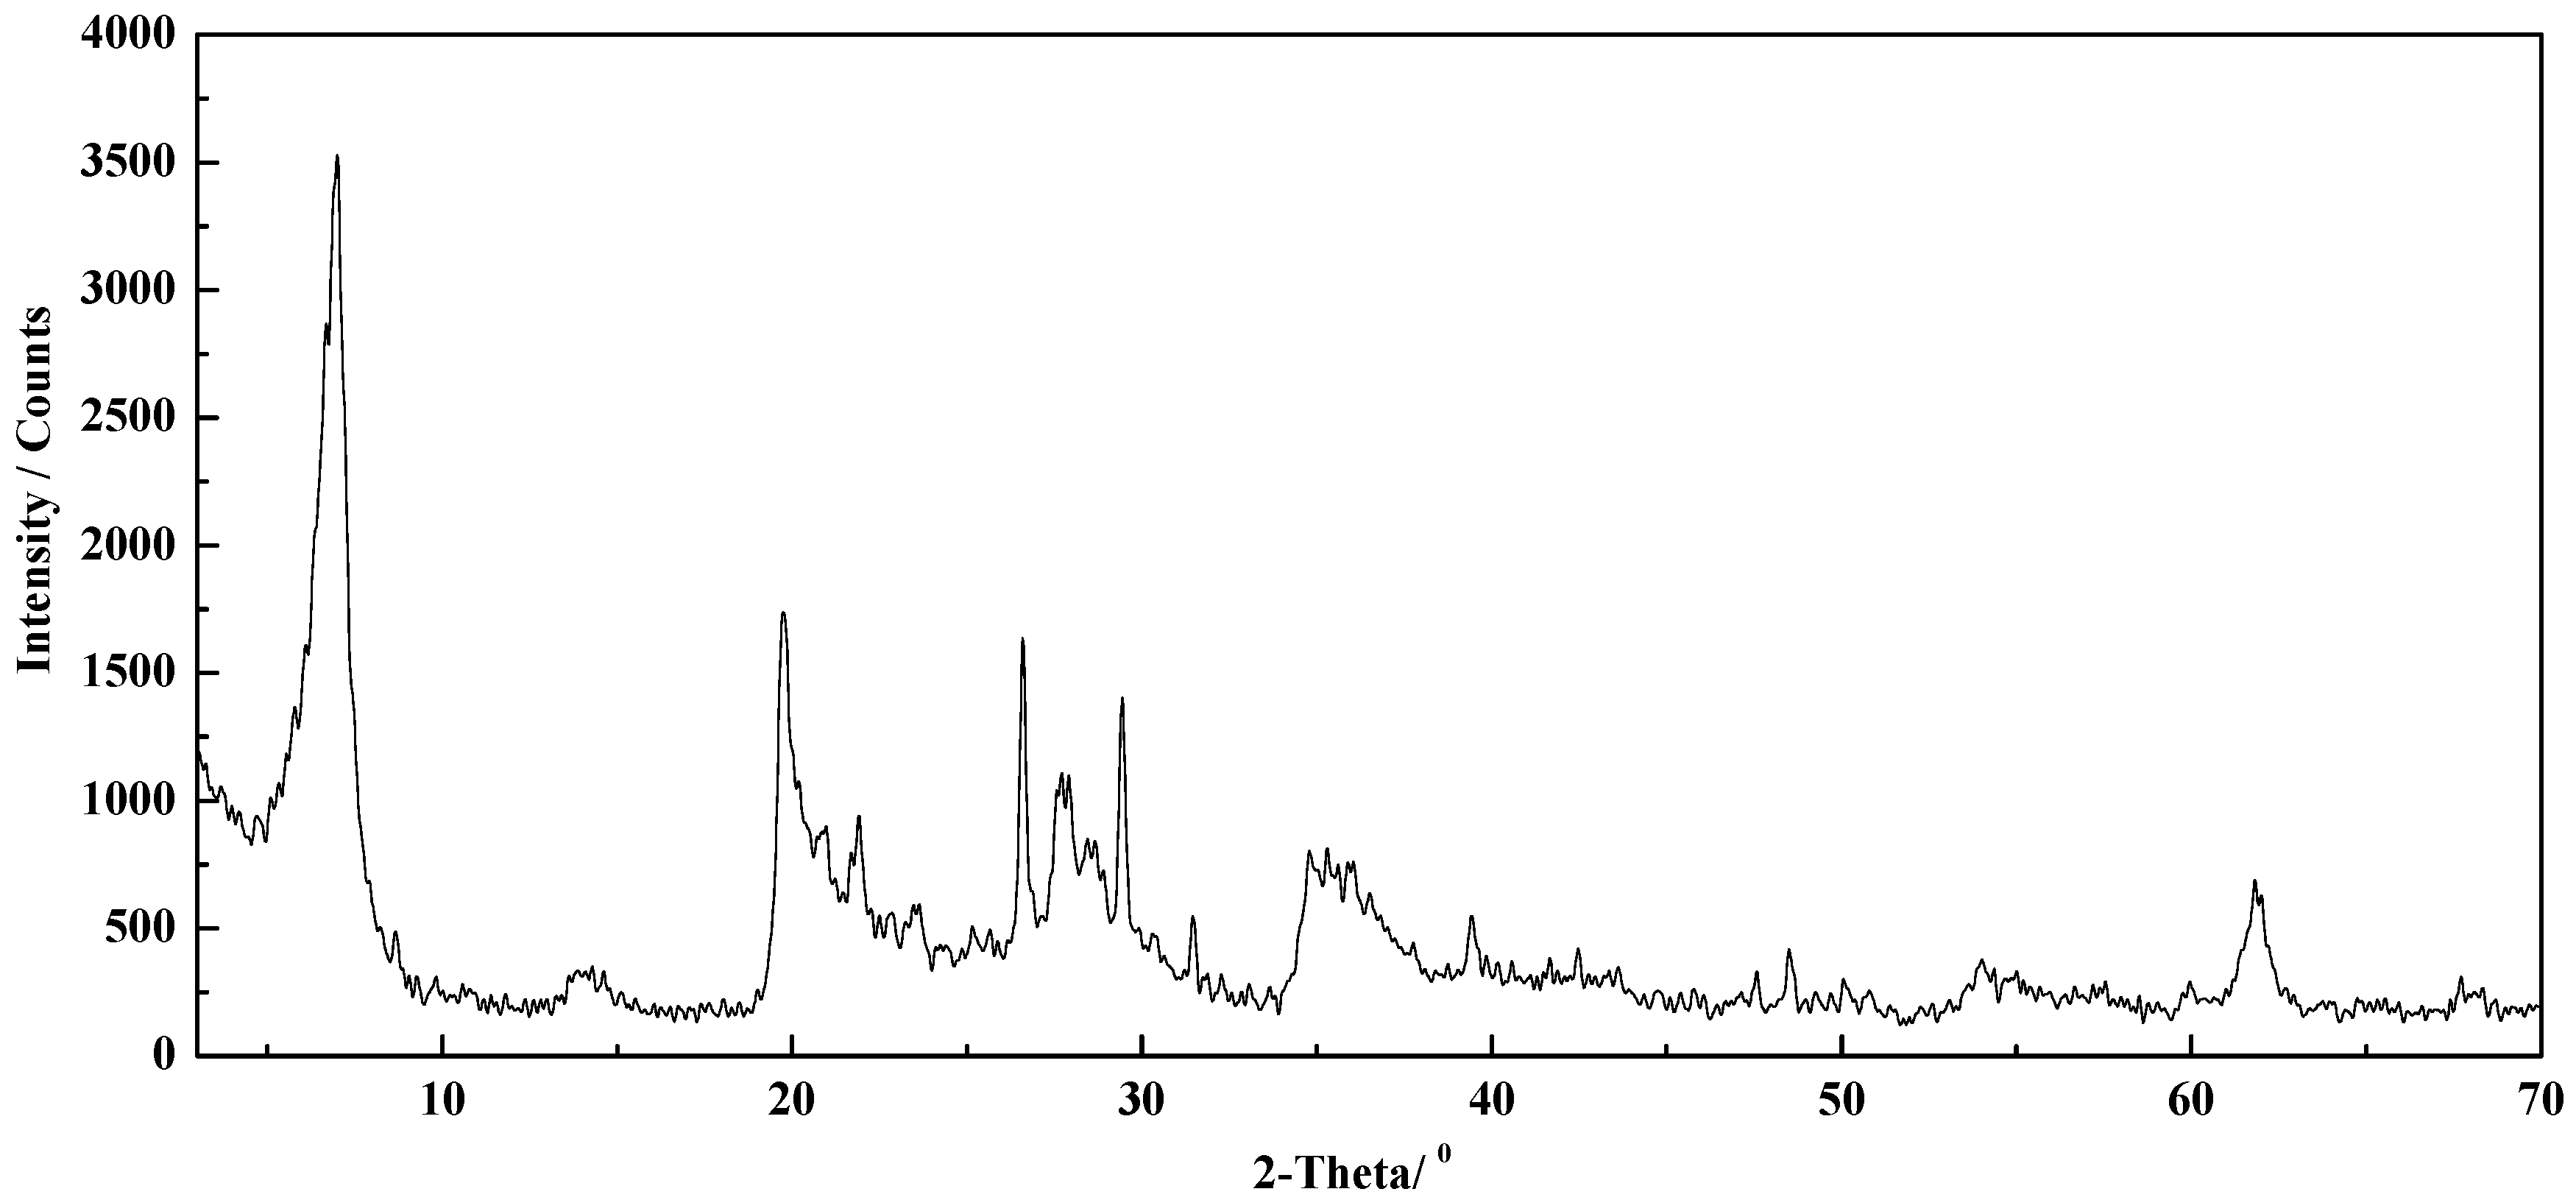
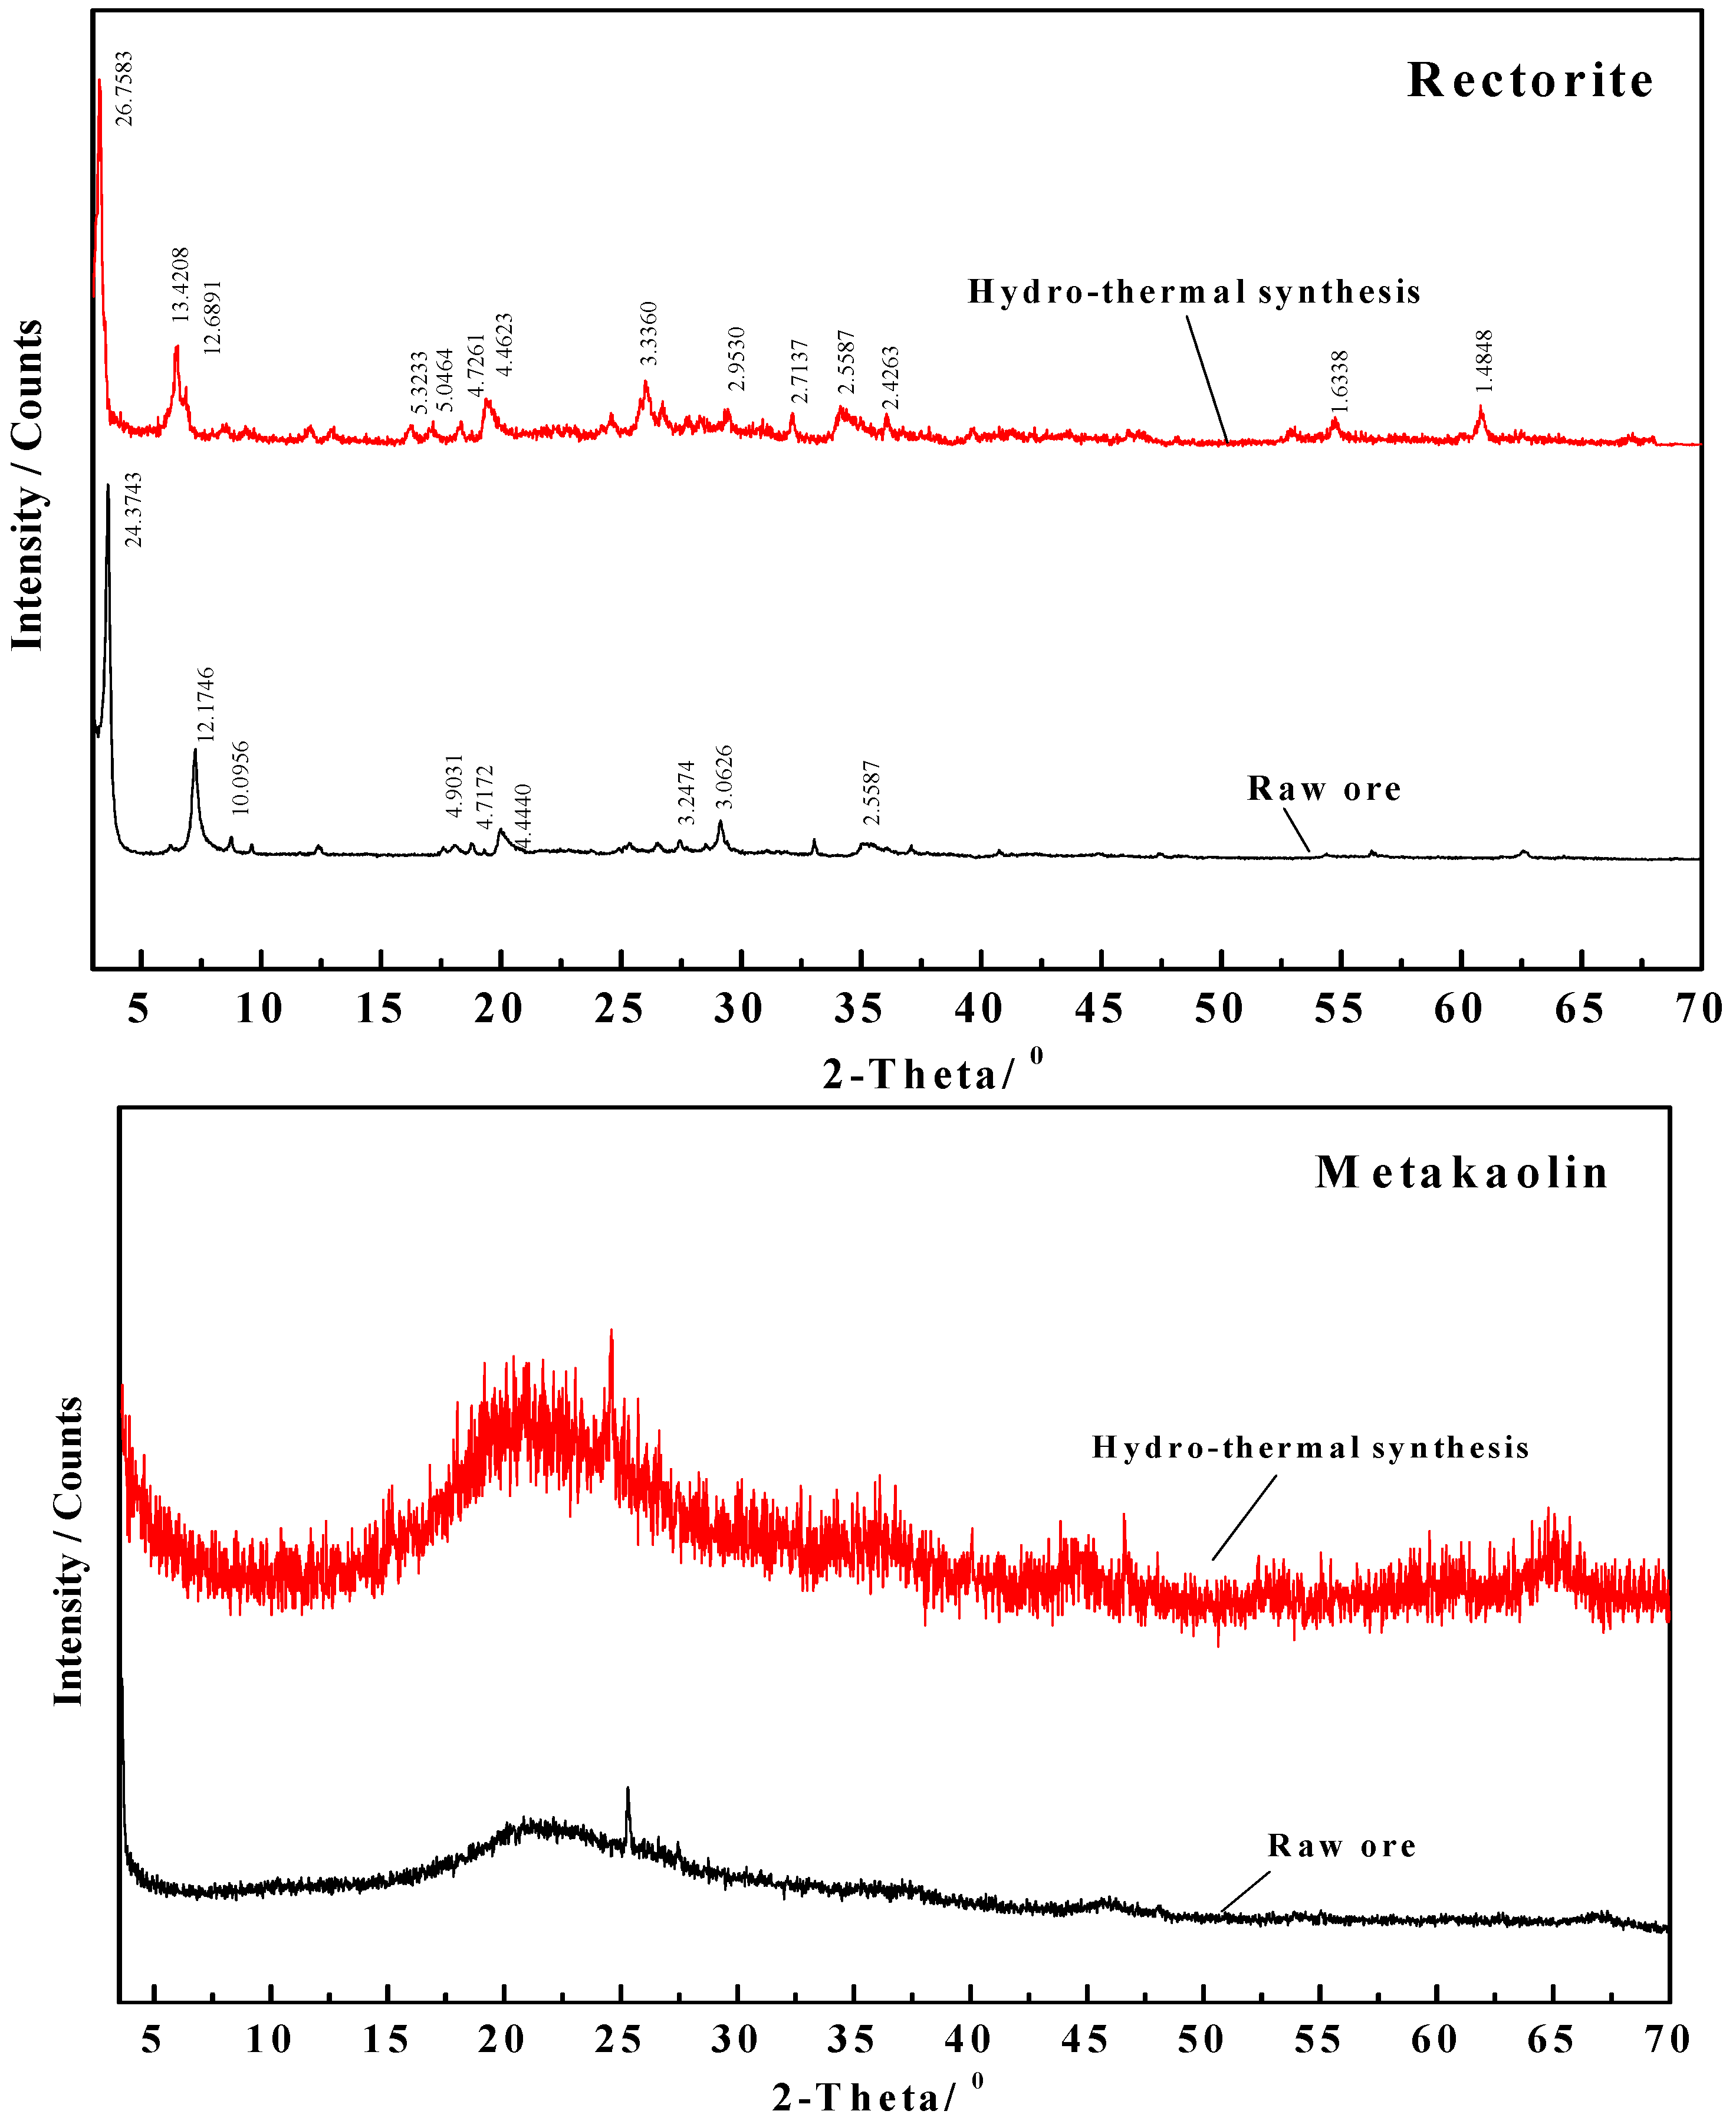
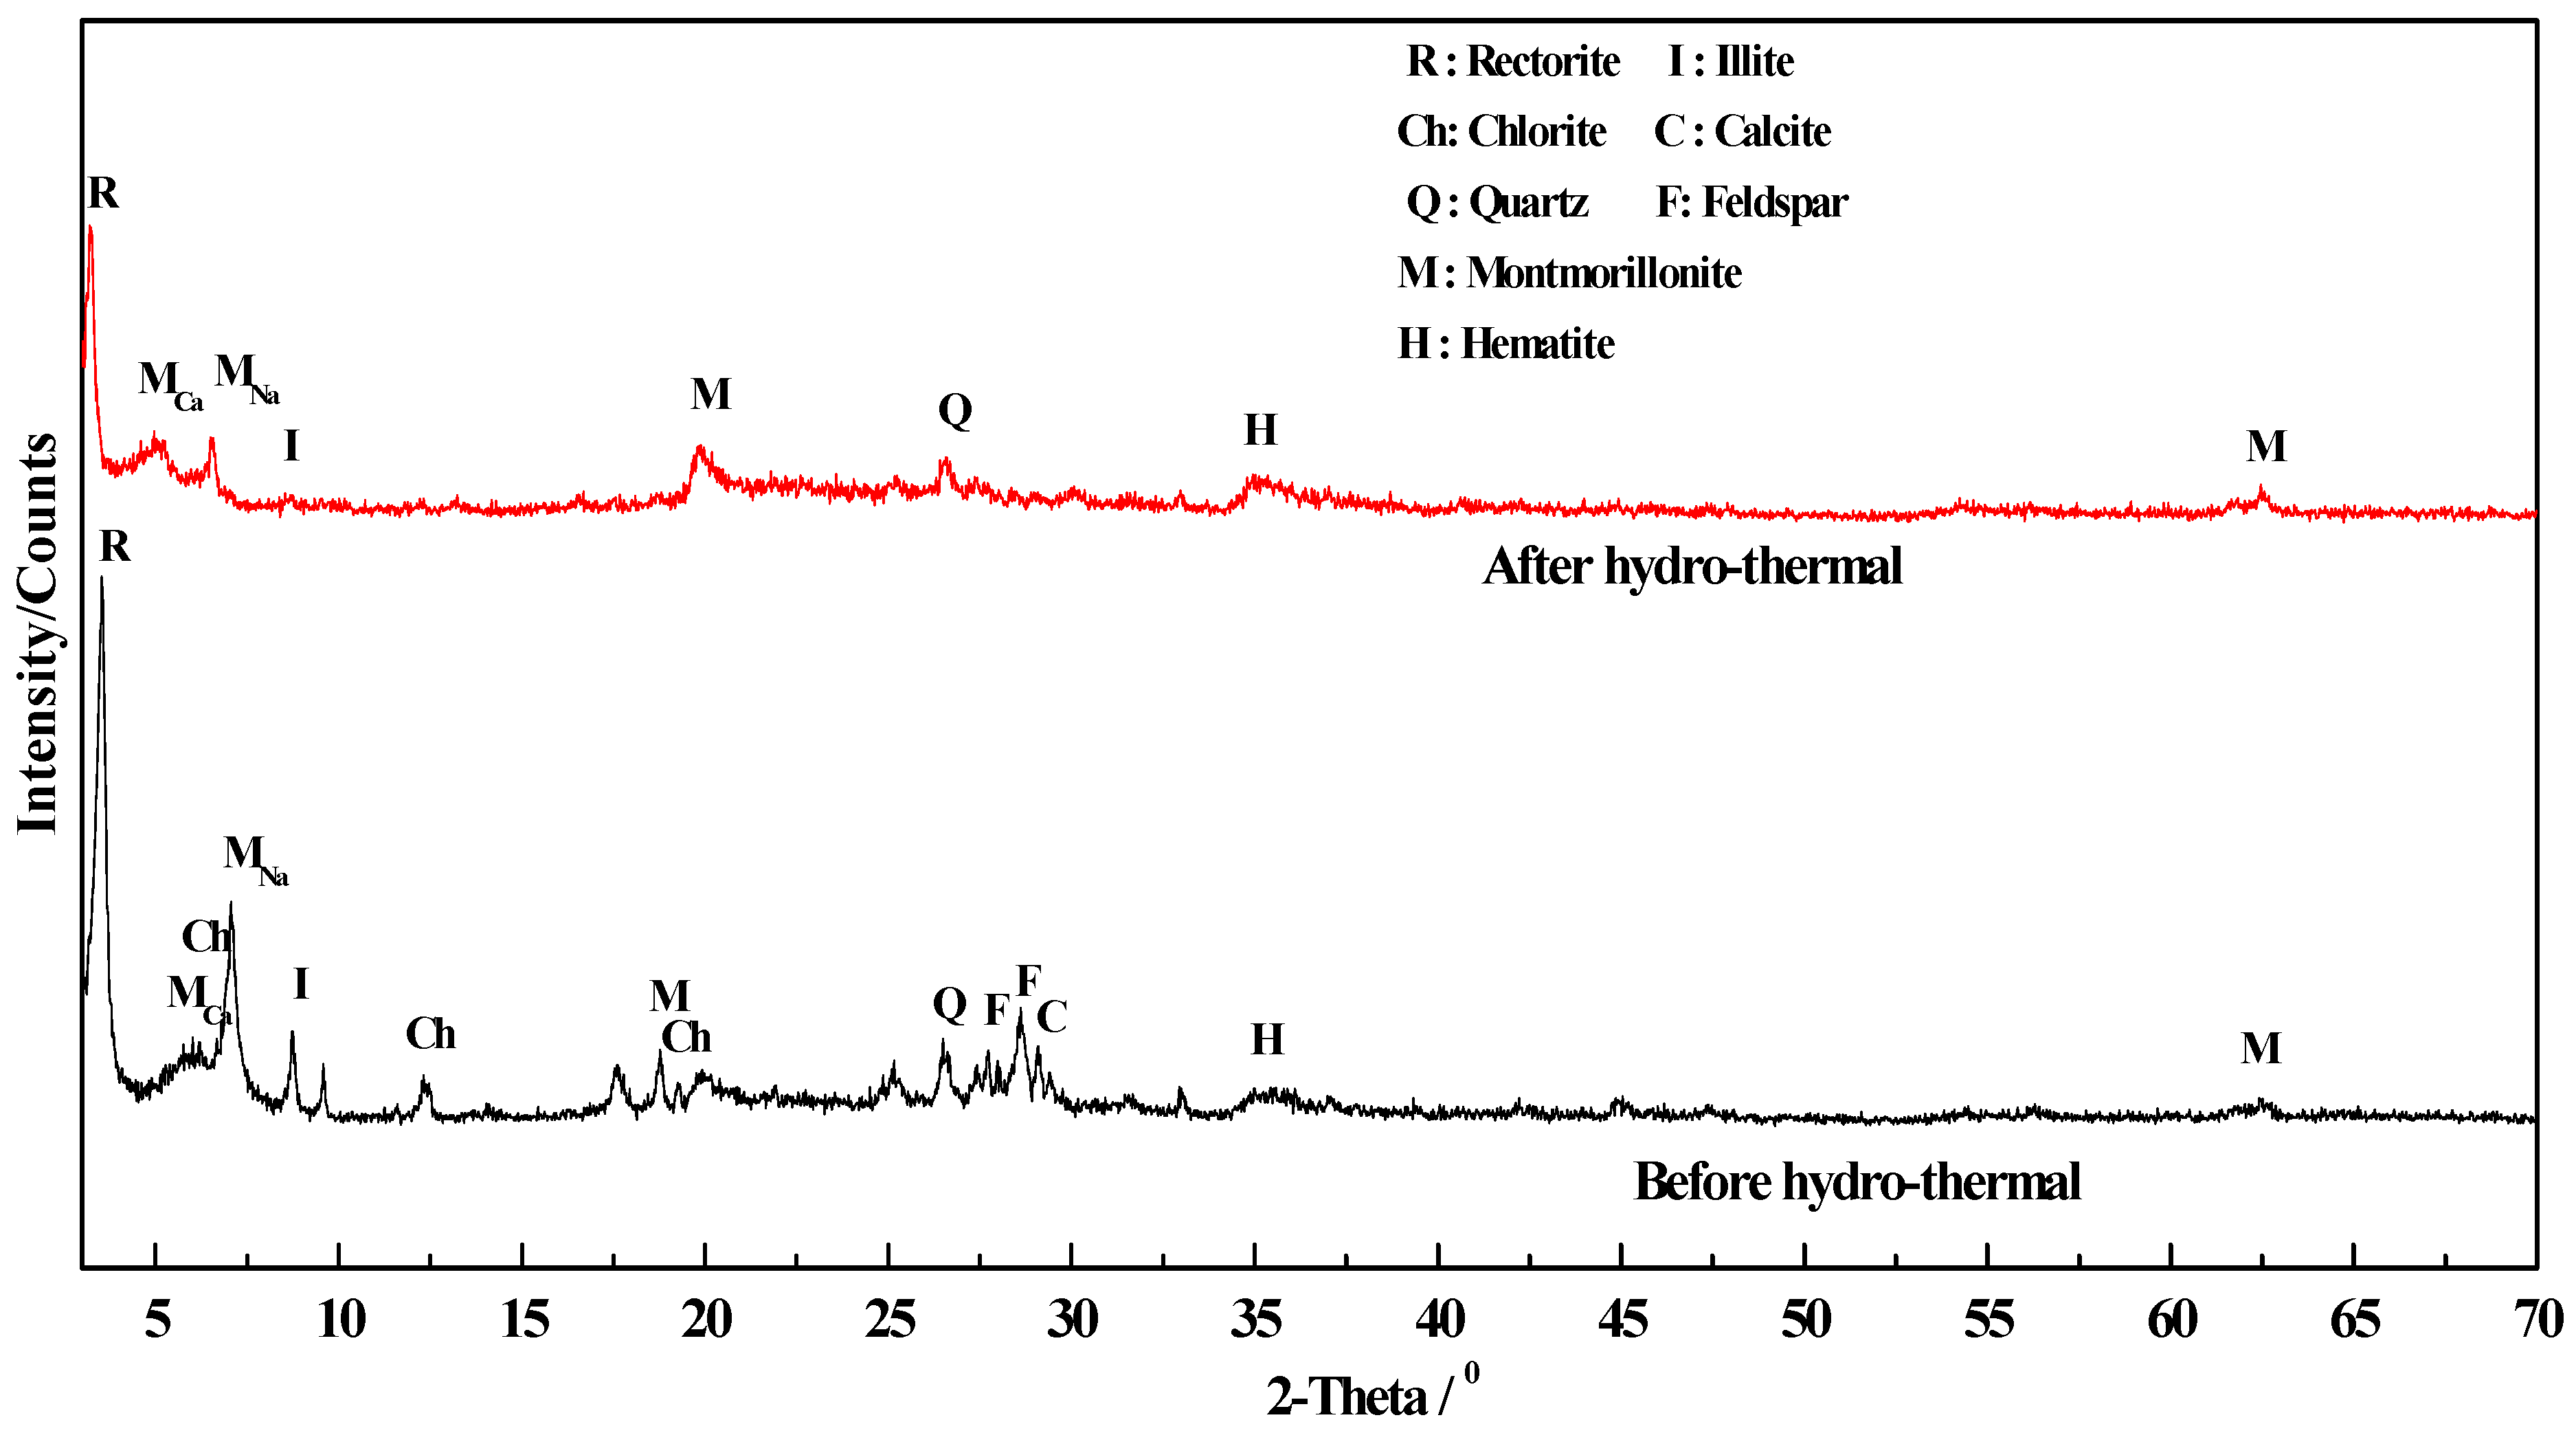
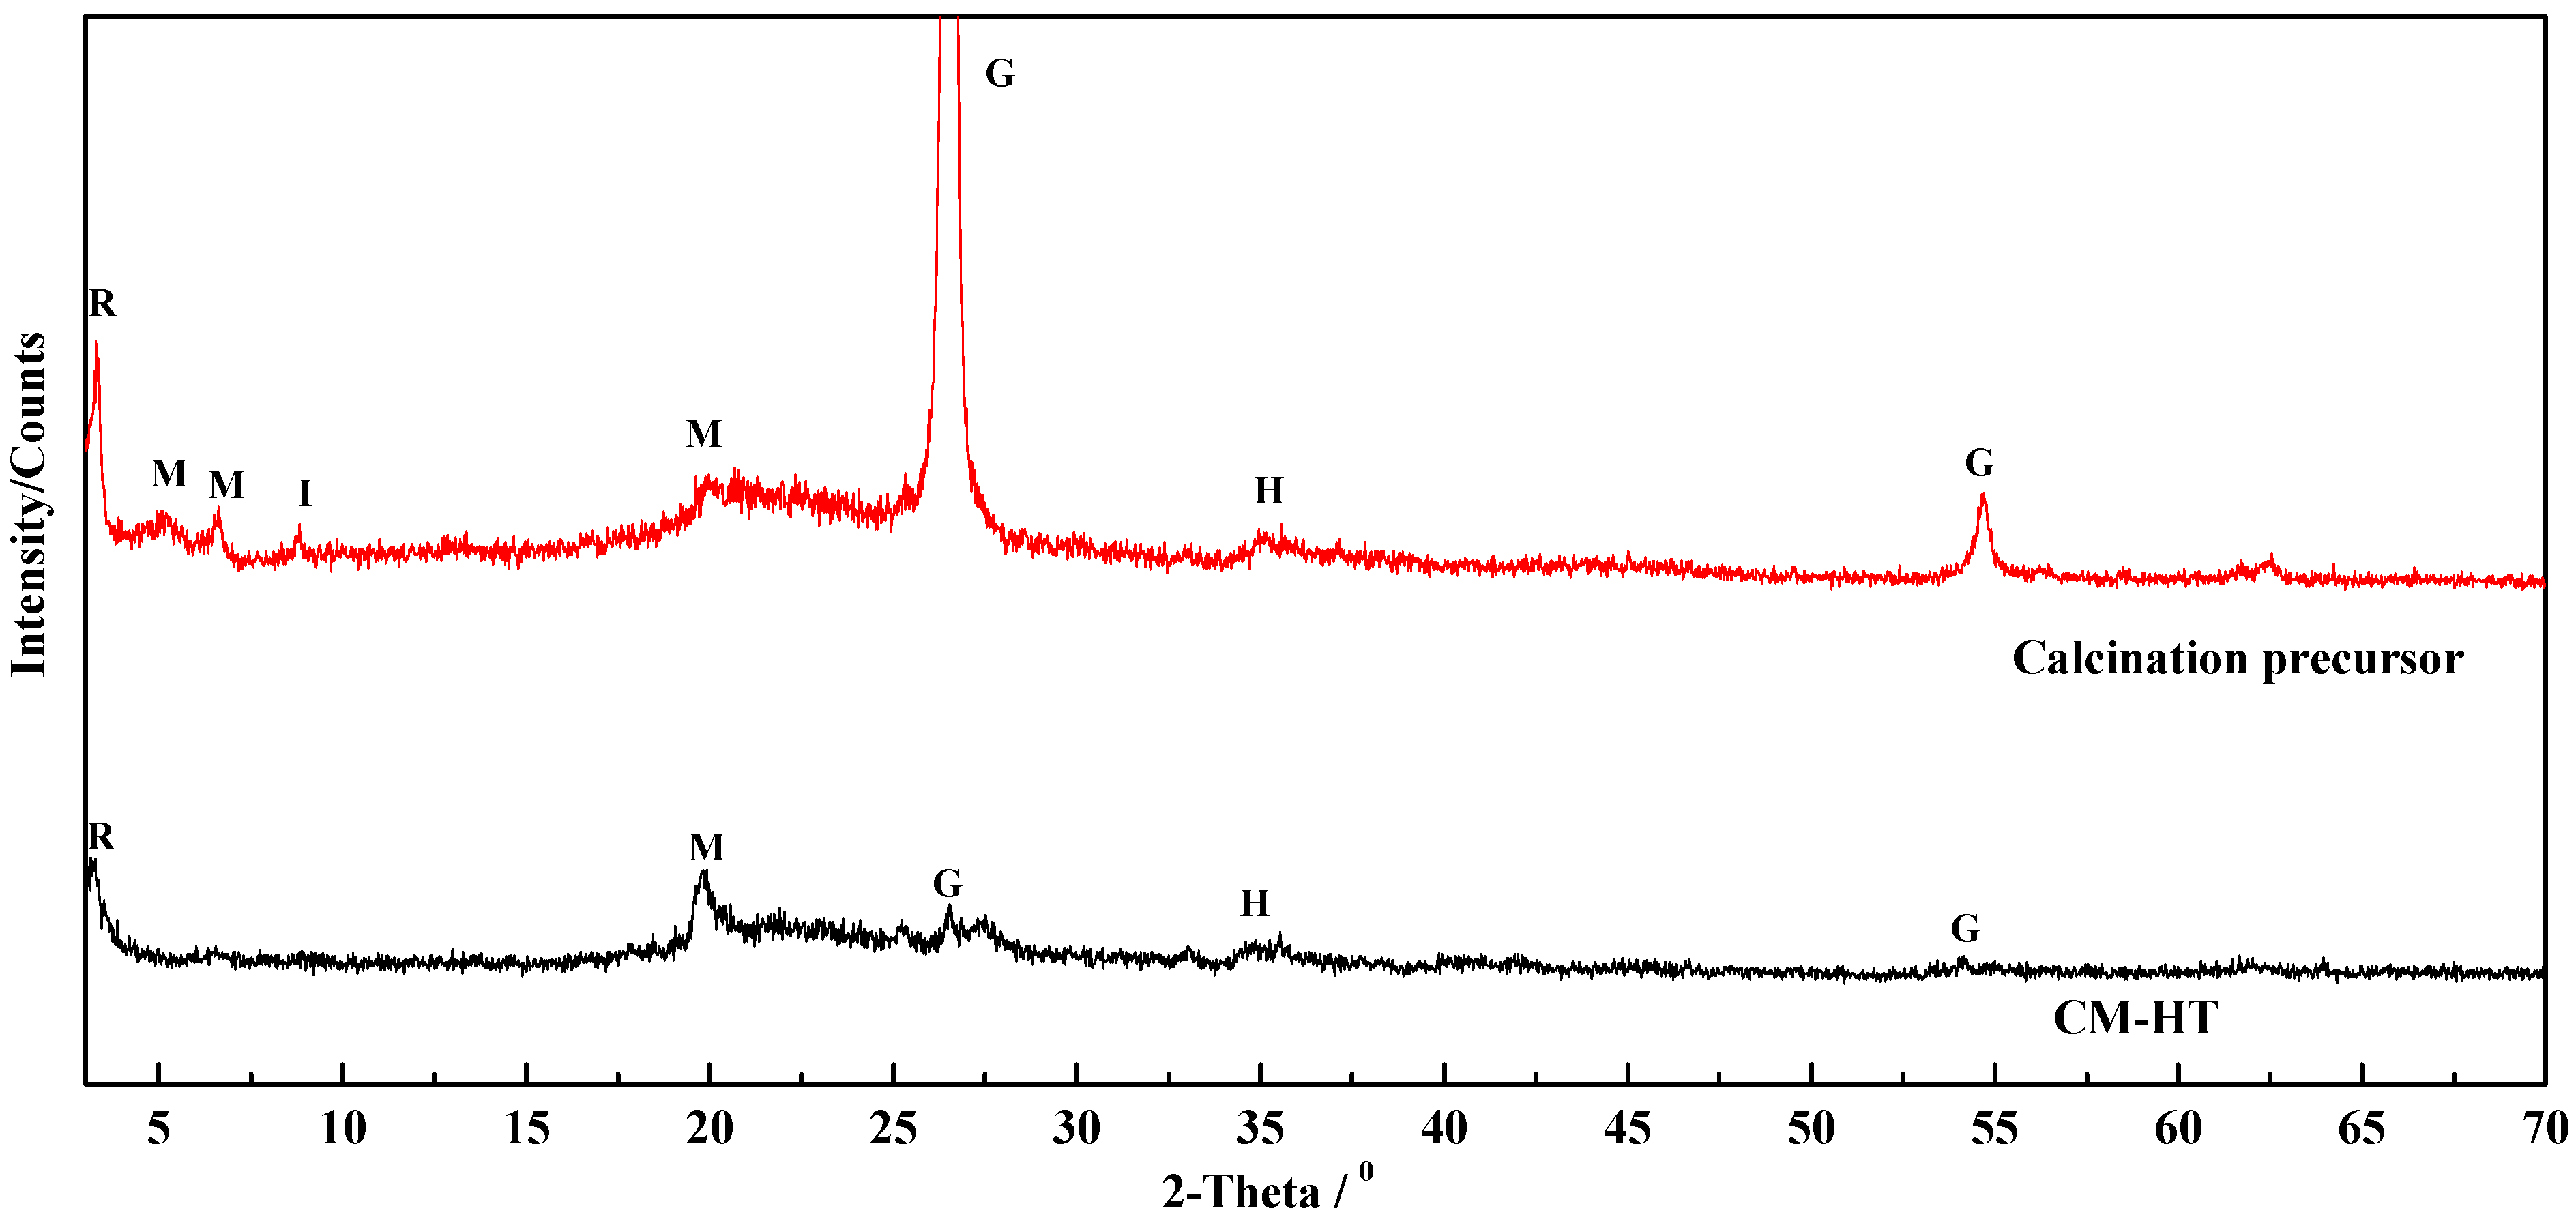
3.3.4. Change of Phase Composition and Crystal Structure
- (1)
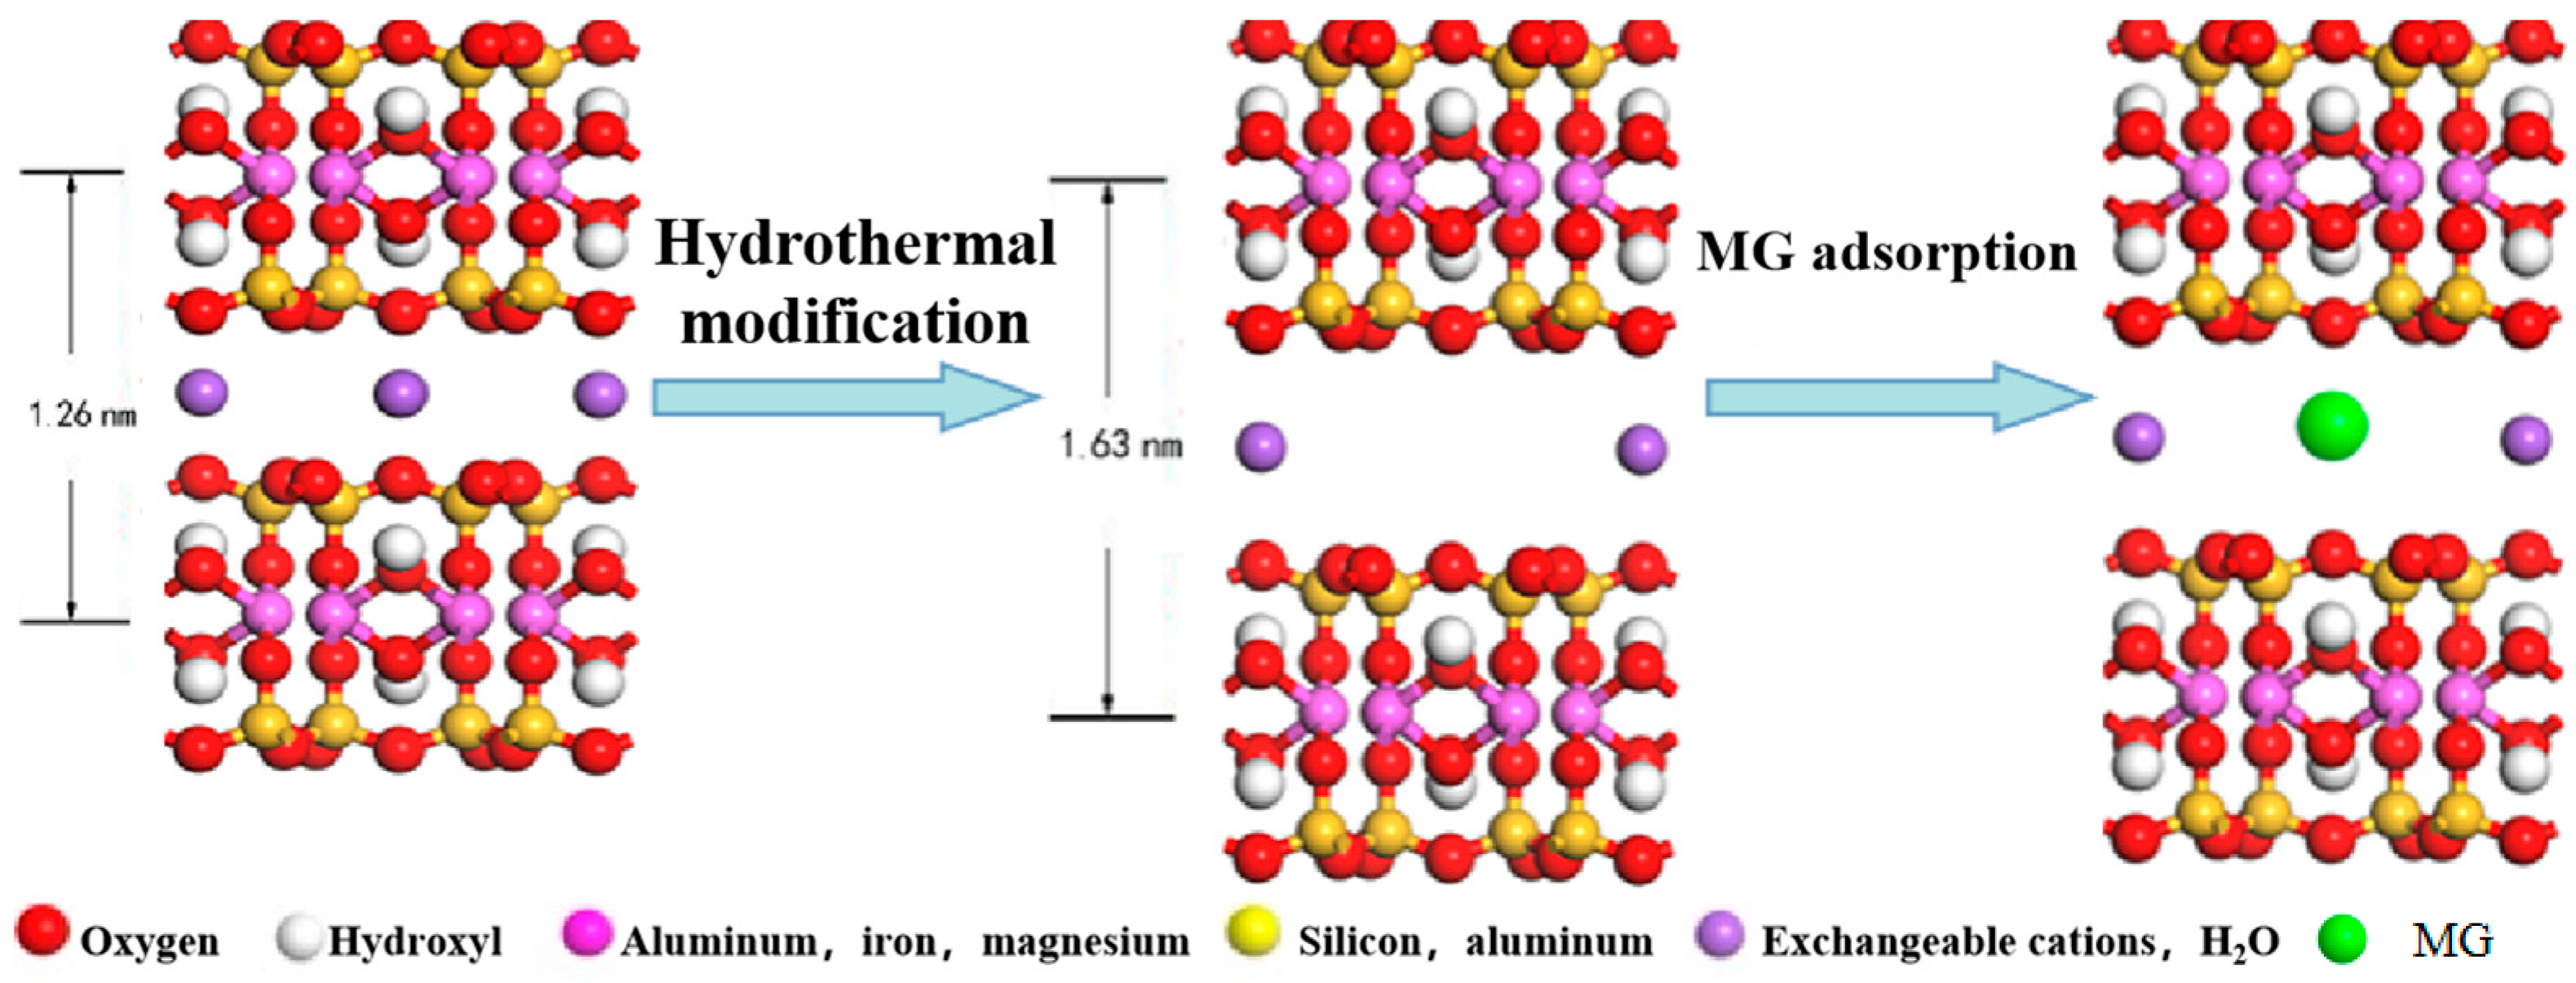
- Change in interlayer spacing of clay minerals
- (2)
- Change in phase composition and crystal structure
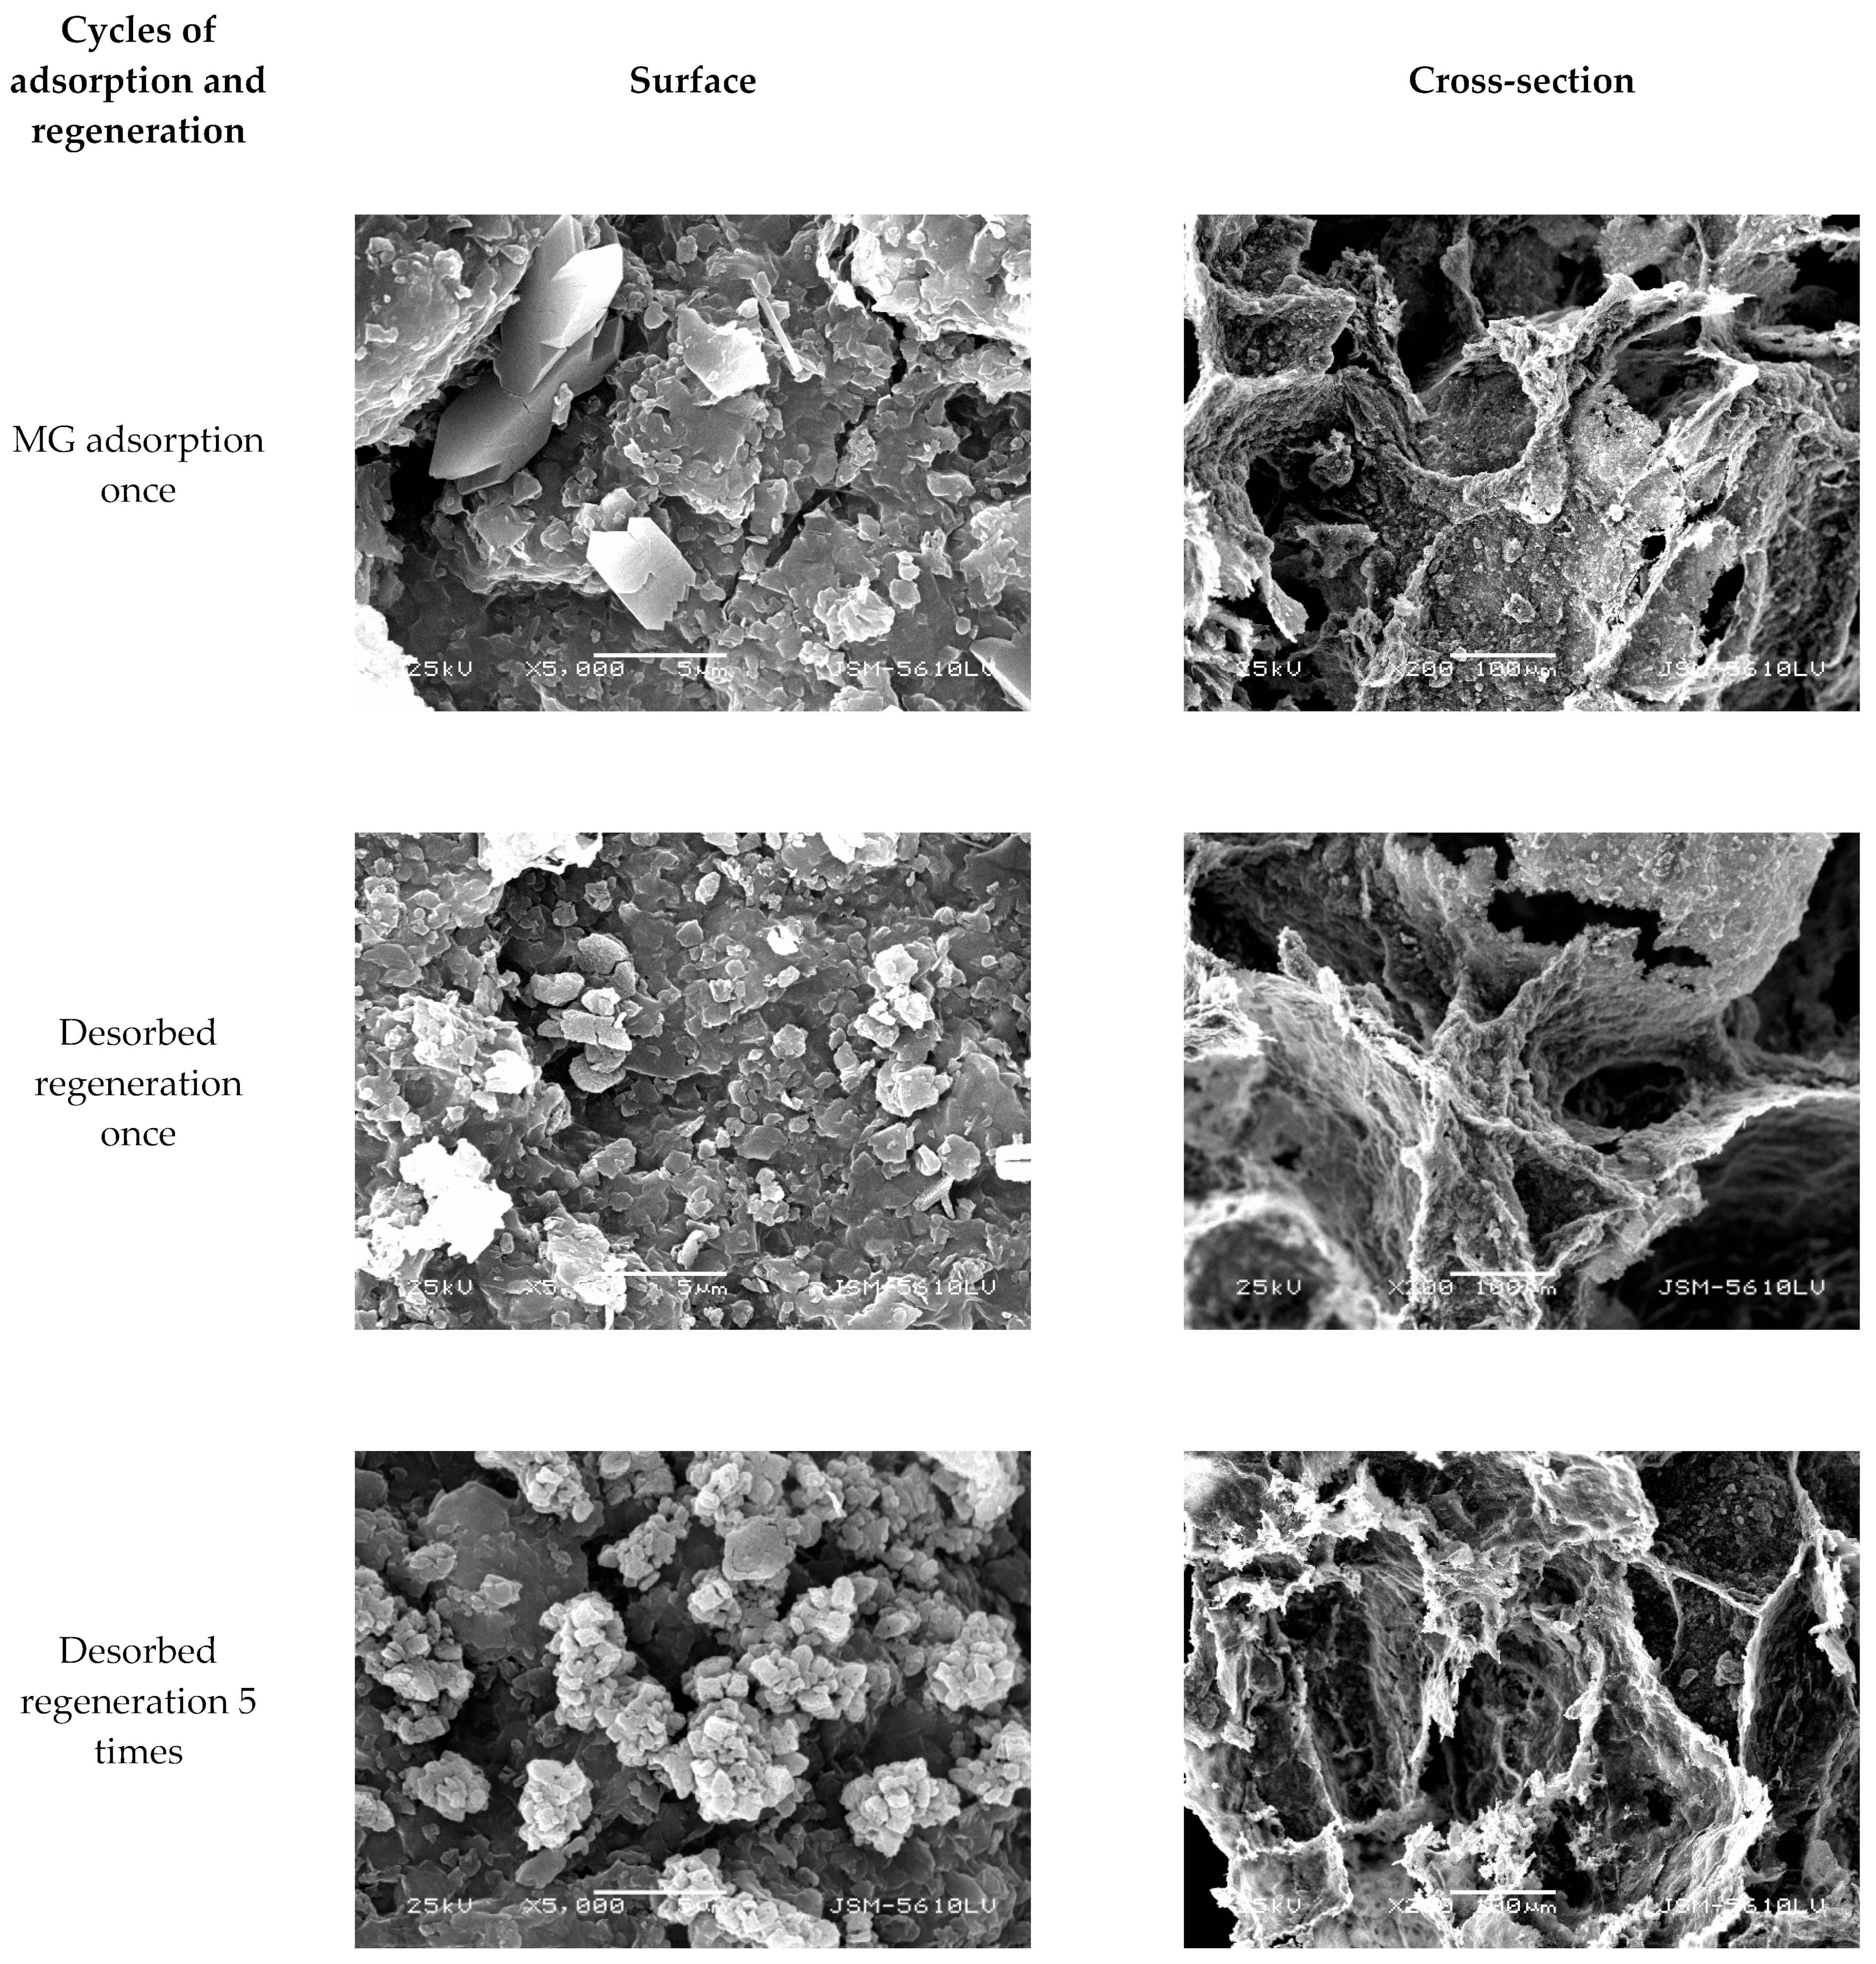
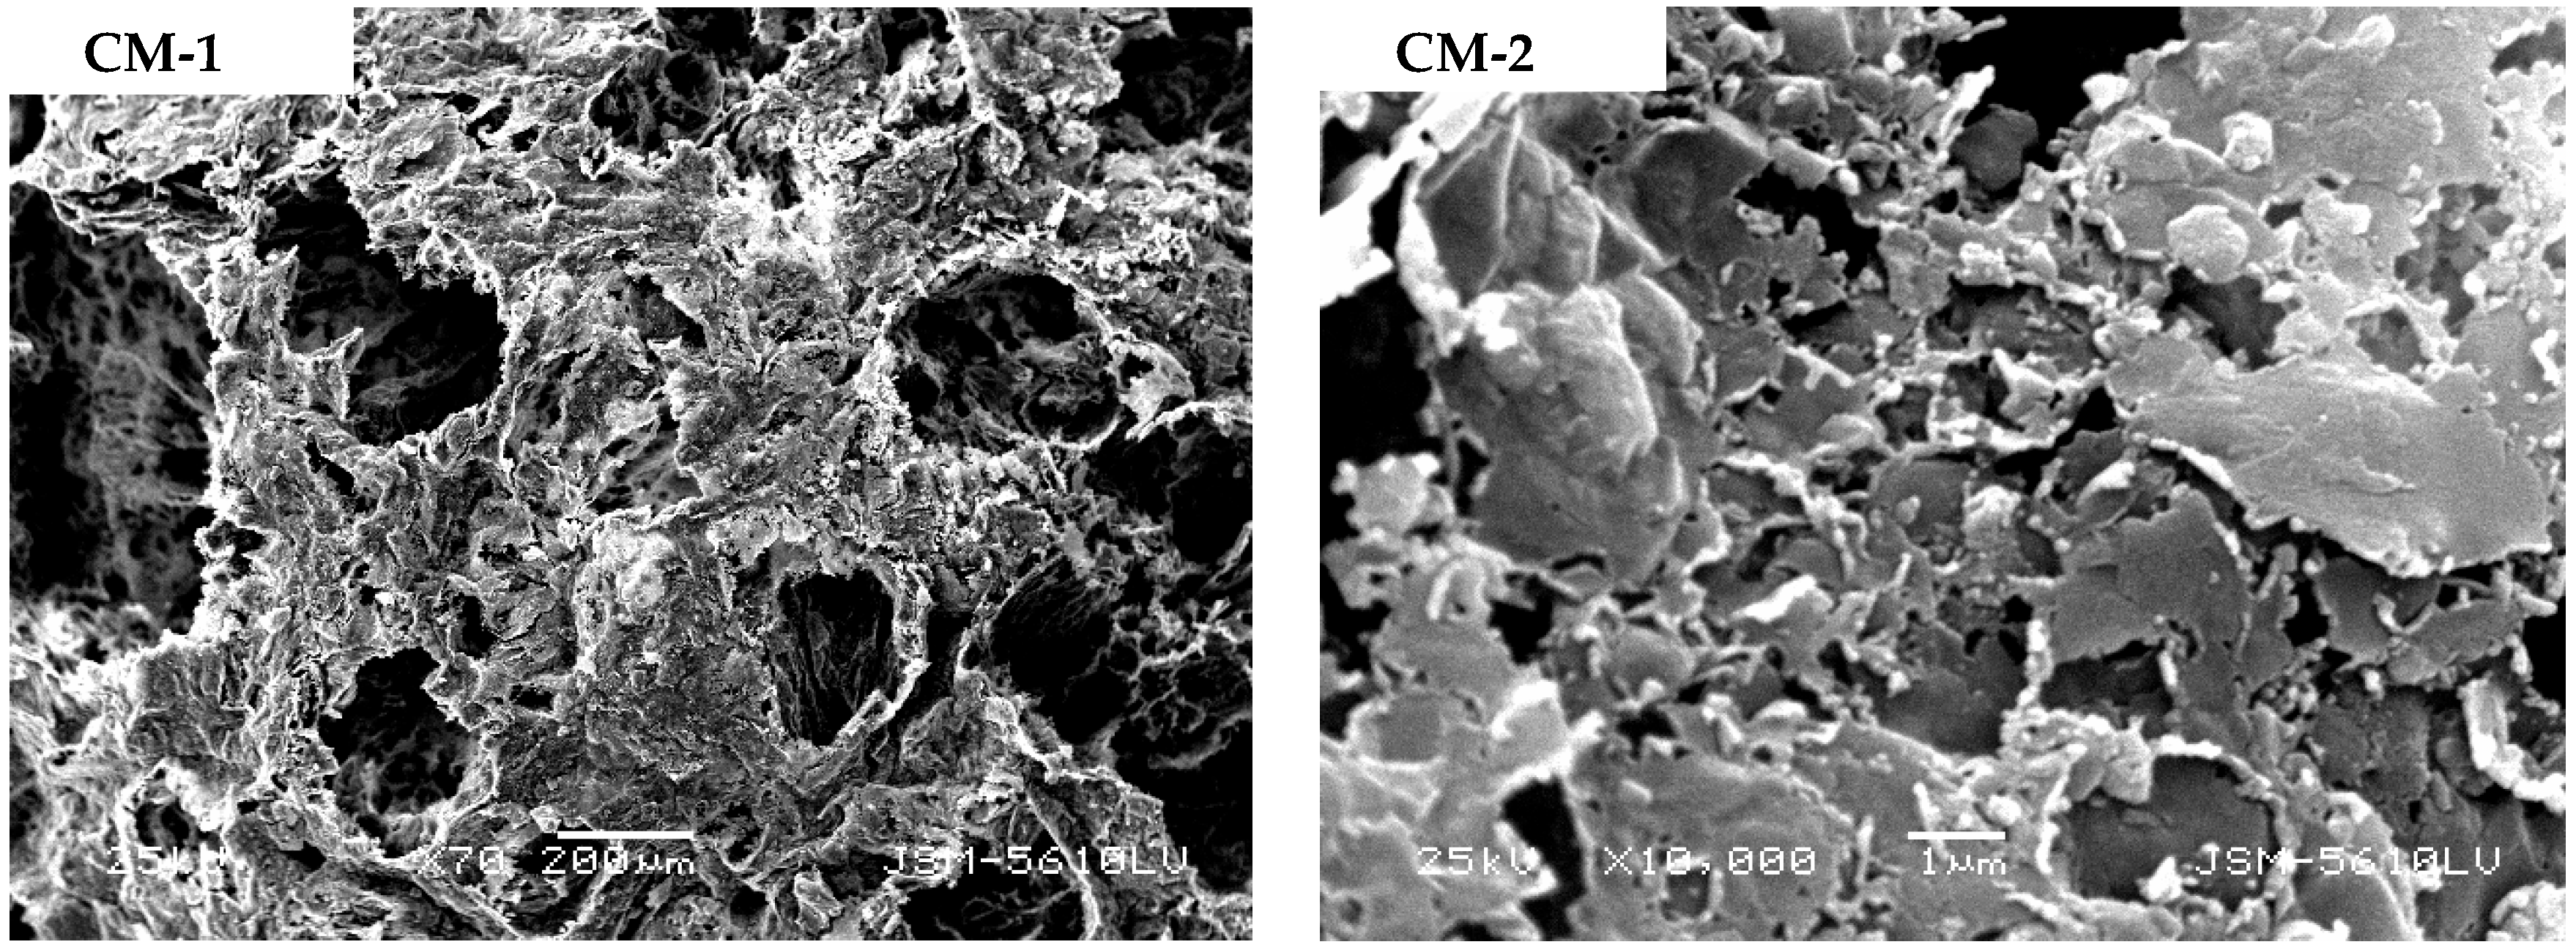
3.3.5. Analysis of Micrographic Structural Features
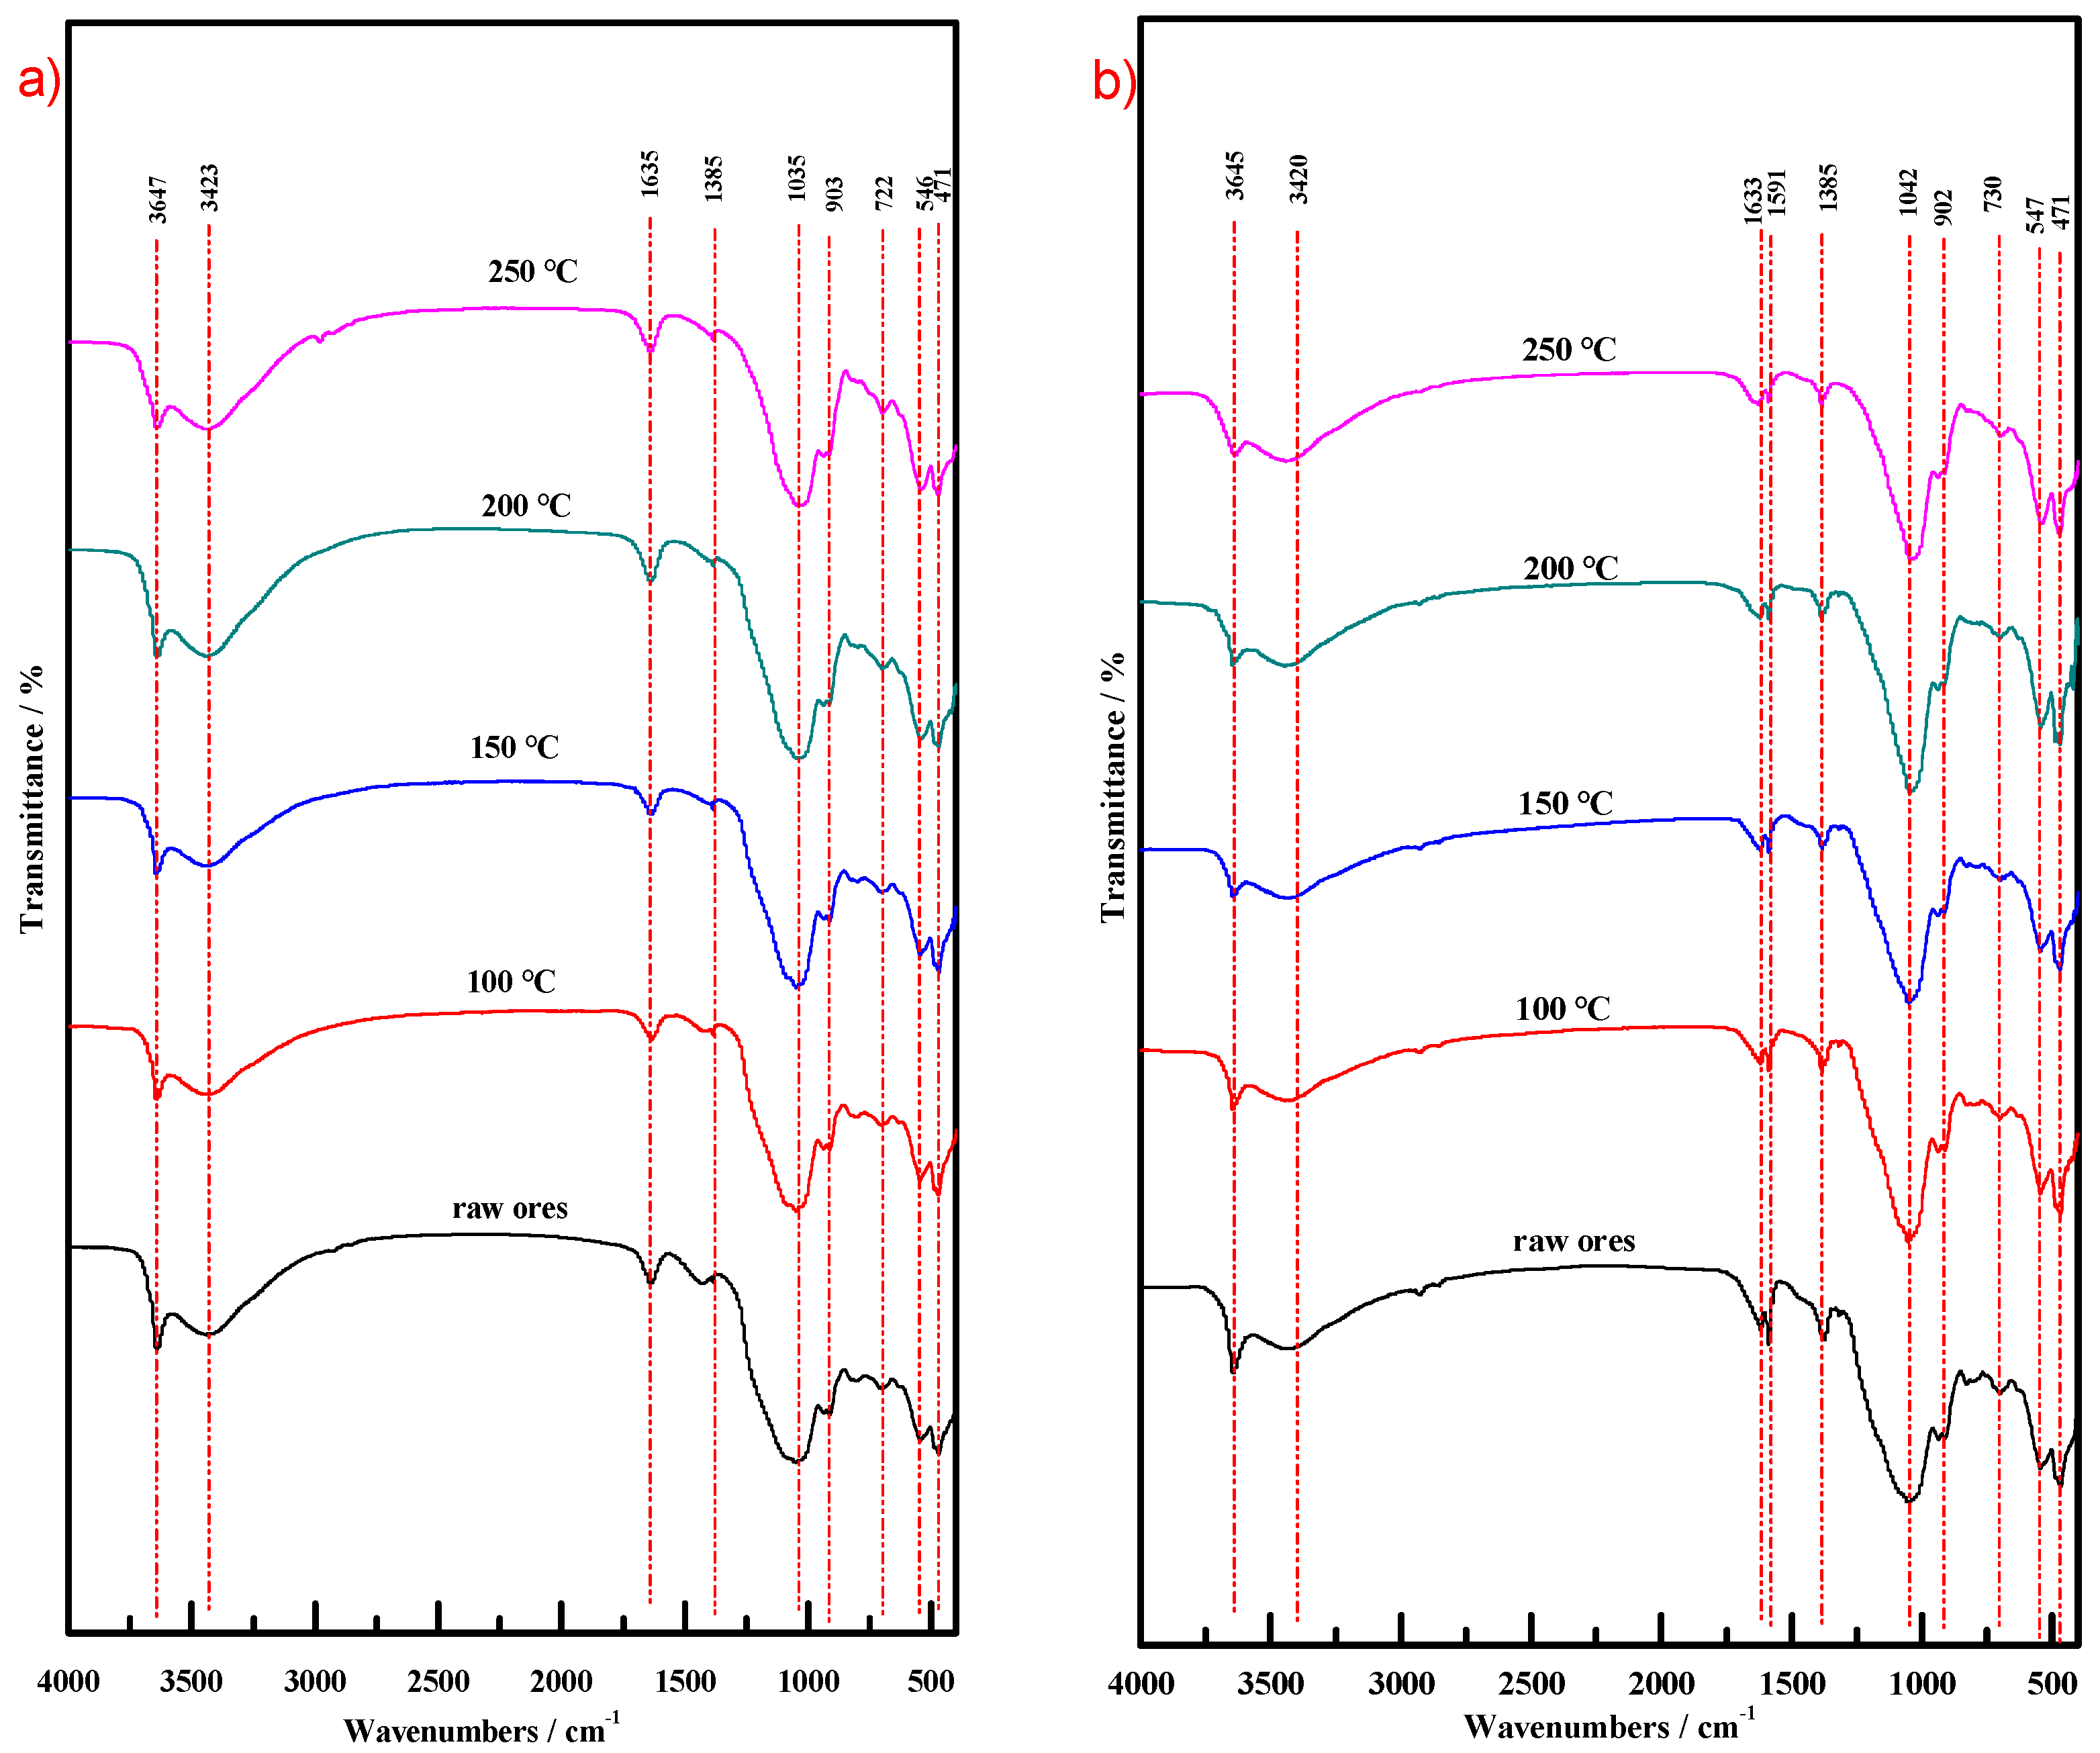
3.3.6. Fourier Transform Infrared (FT-IR) Analysis
3.4. CM-HT Adsorbing Malachite Green
3.4.1. Adsorbent Concentration
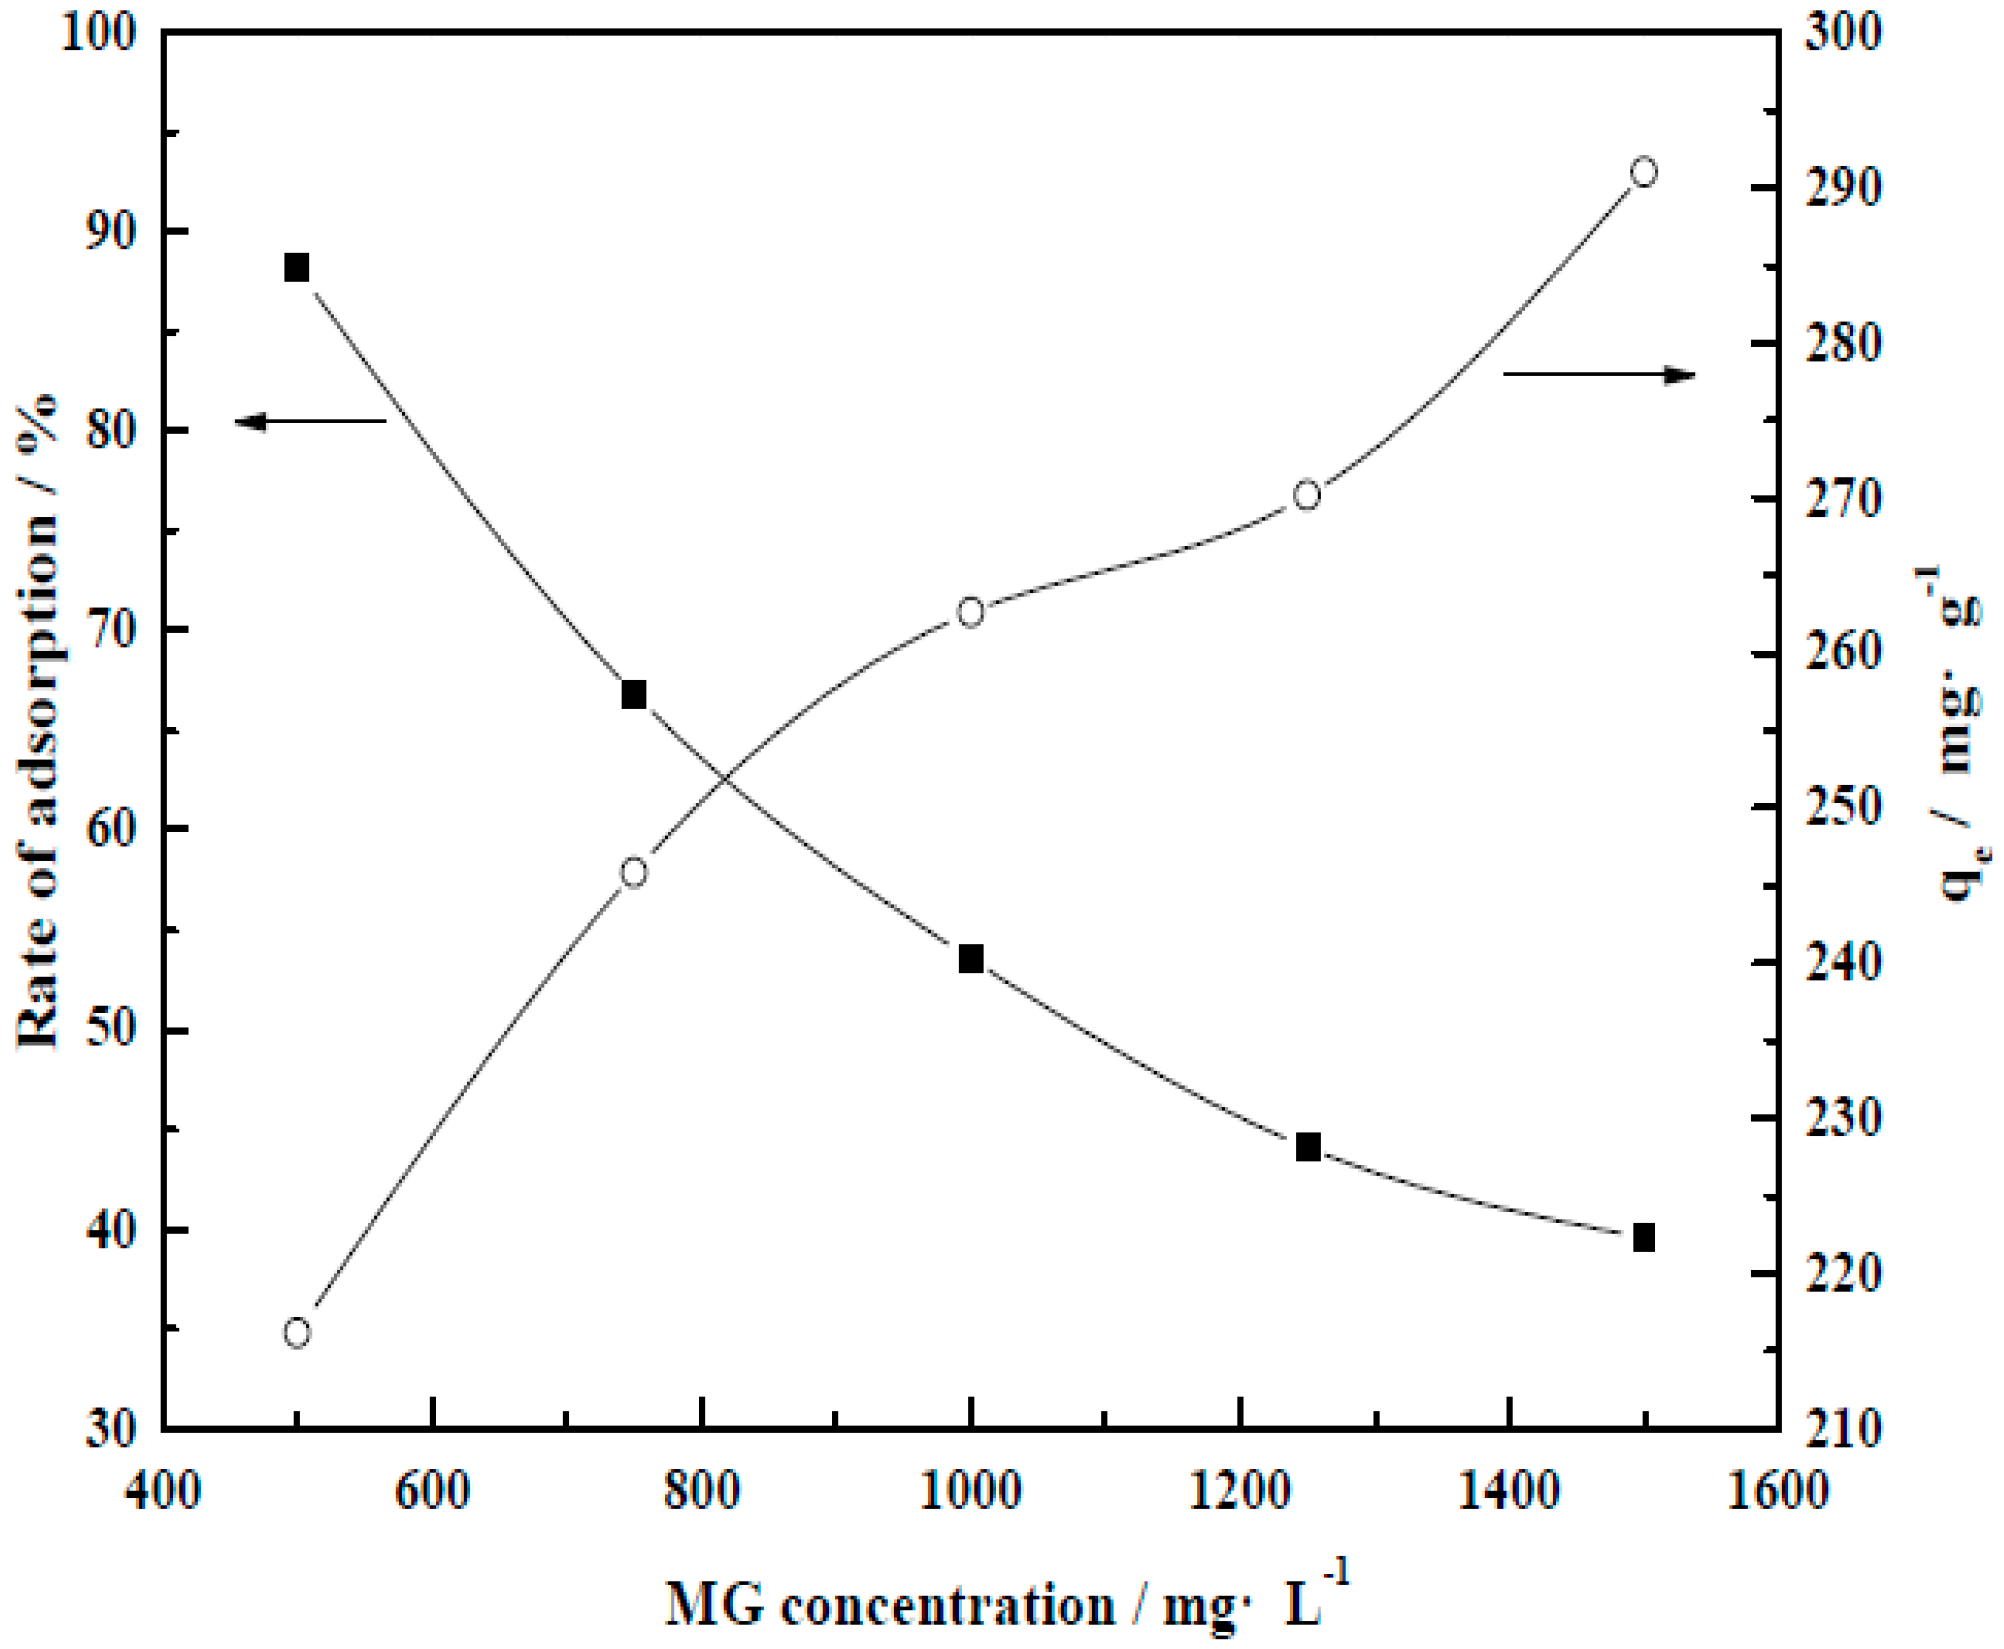
3.4.2. Initial Dye Concentration
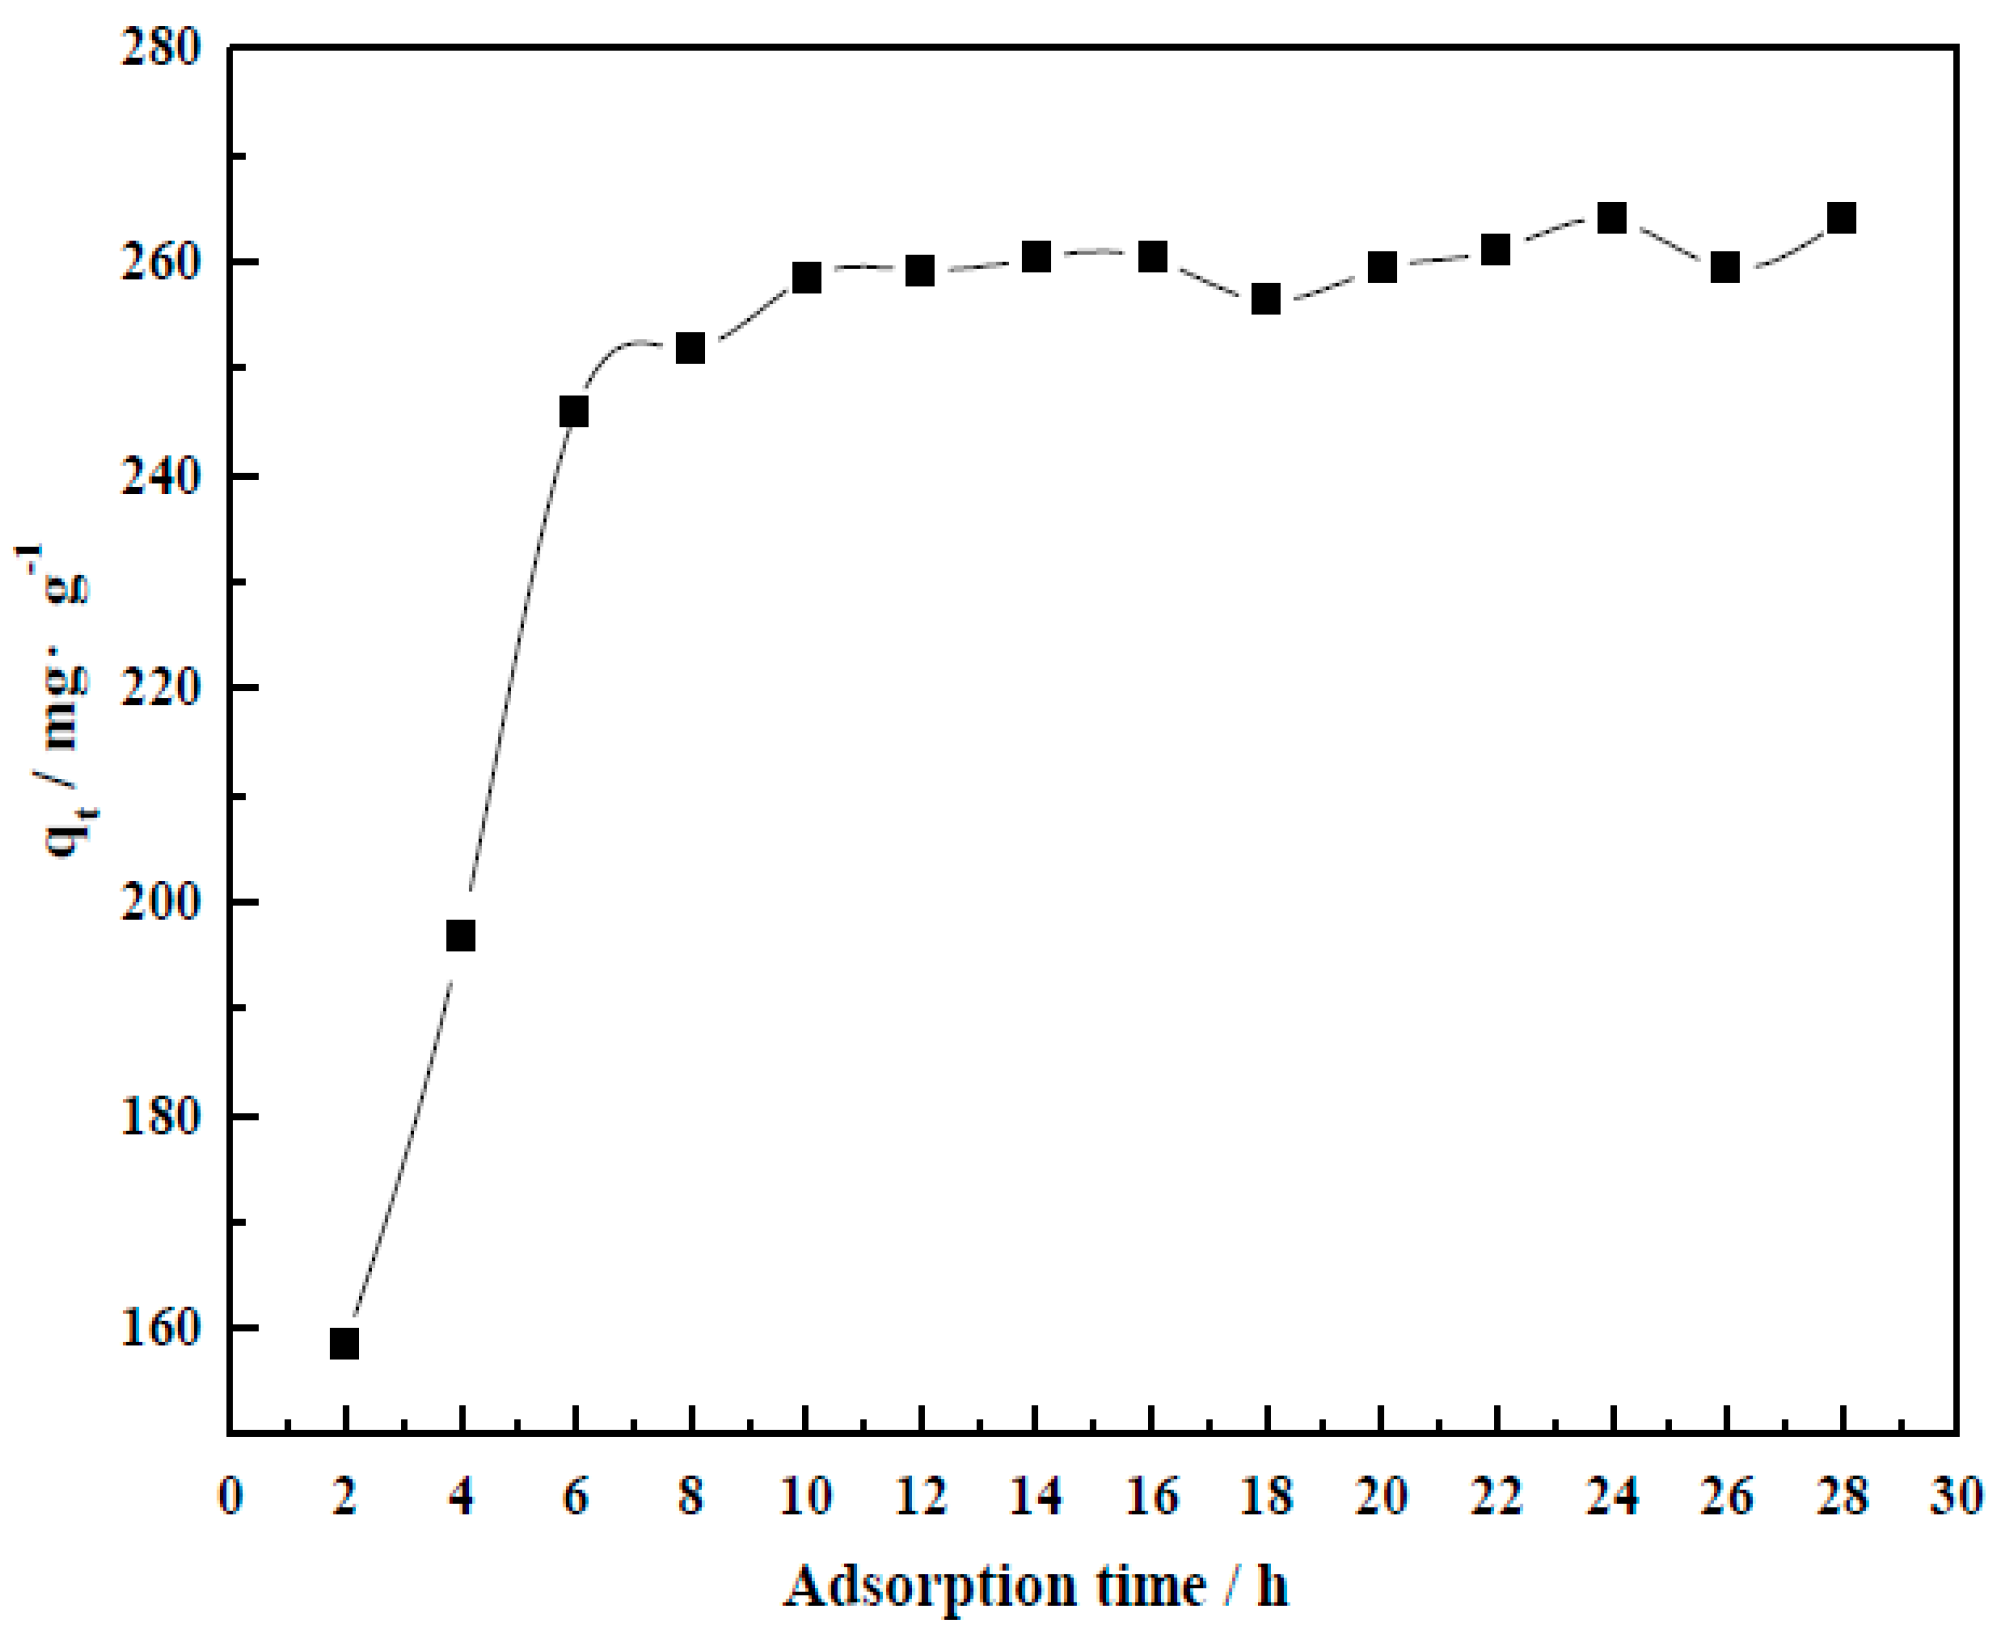
3.4.3. Adsorption Time
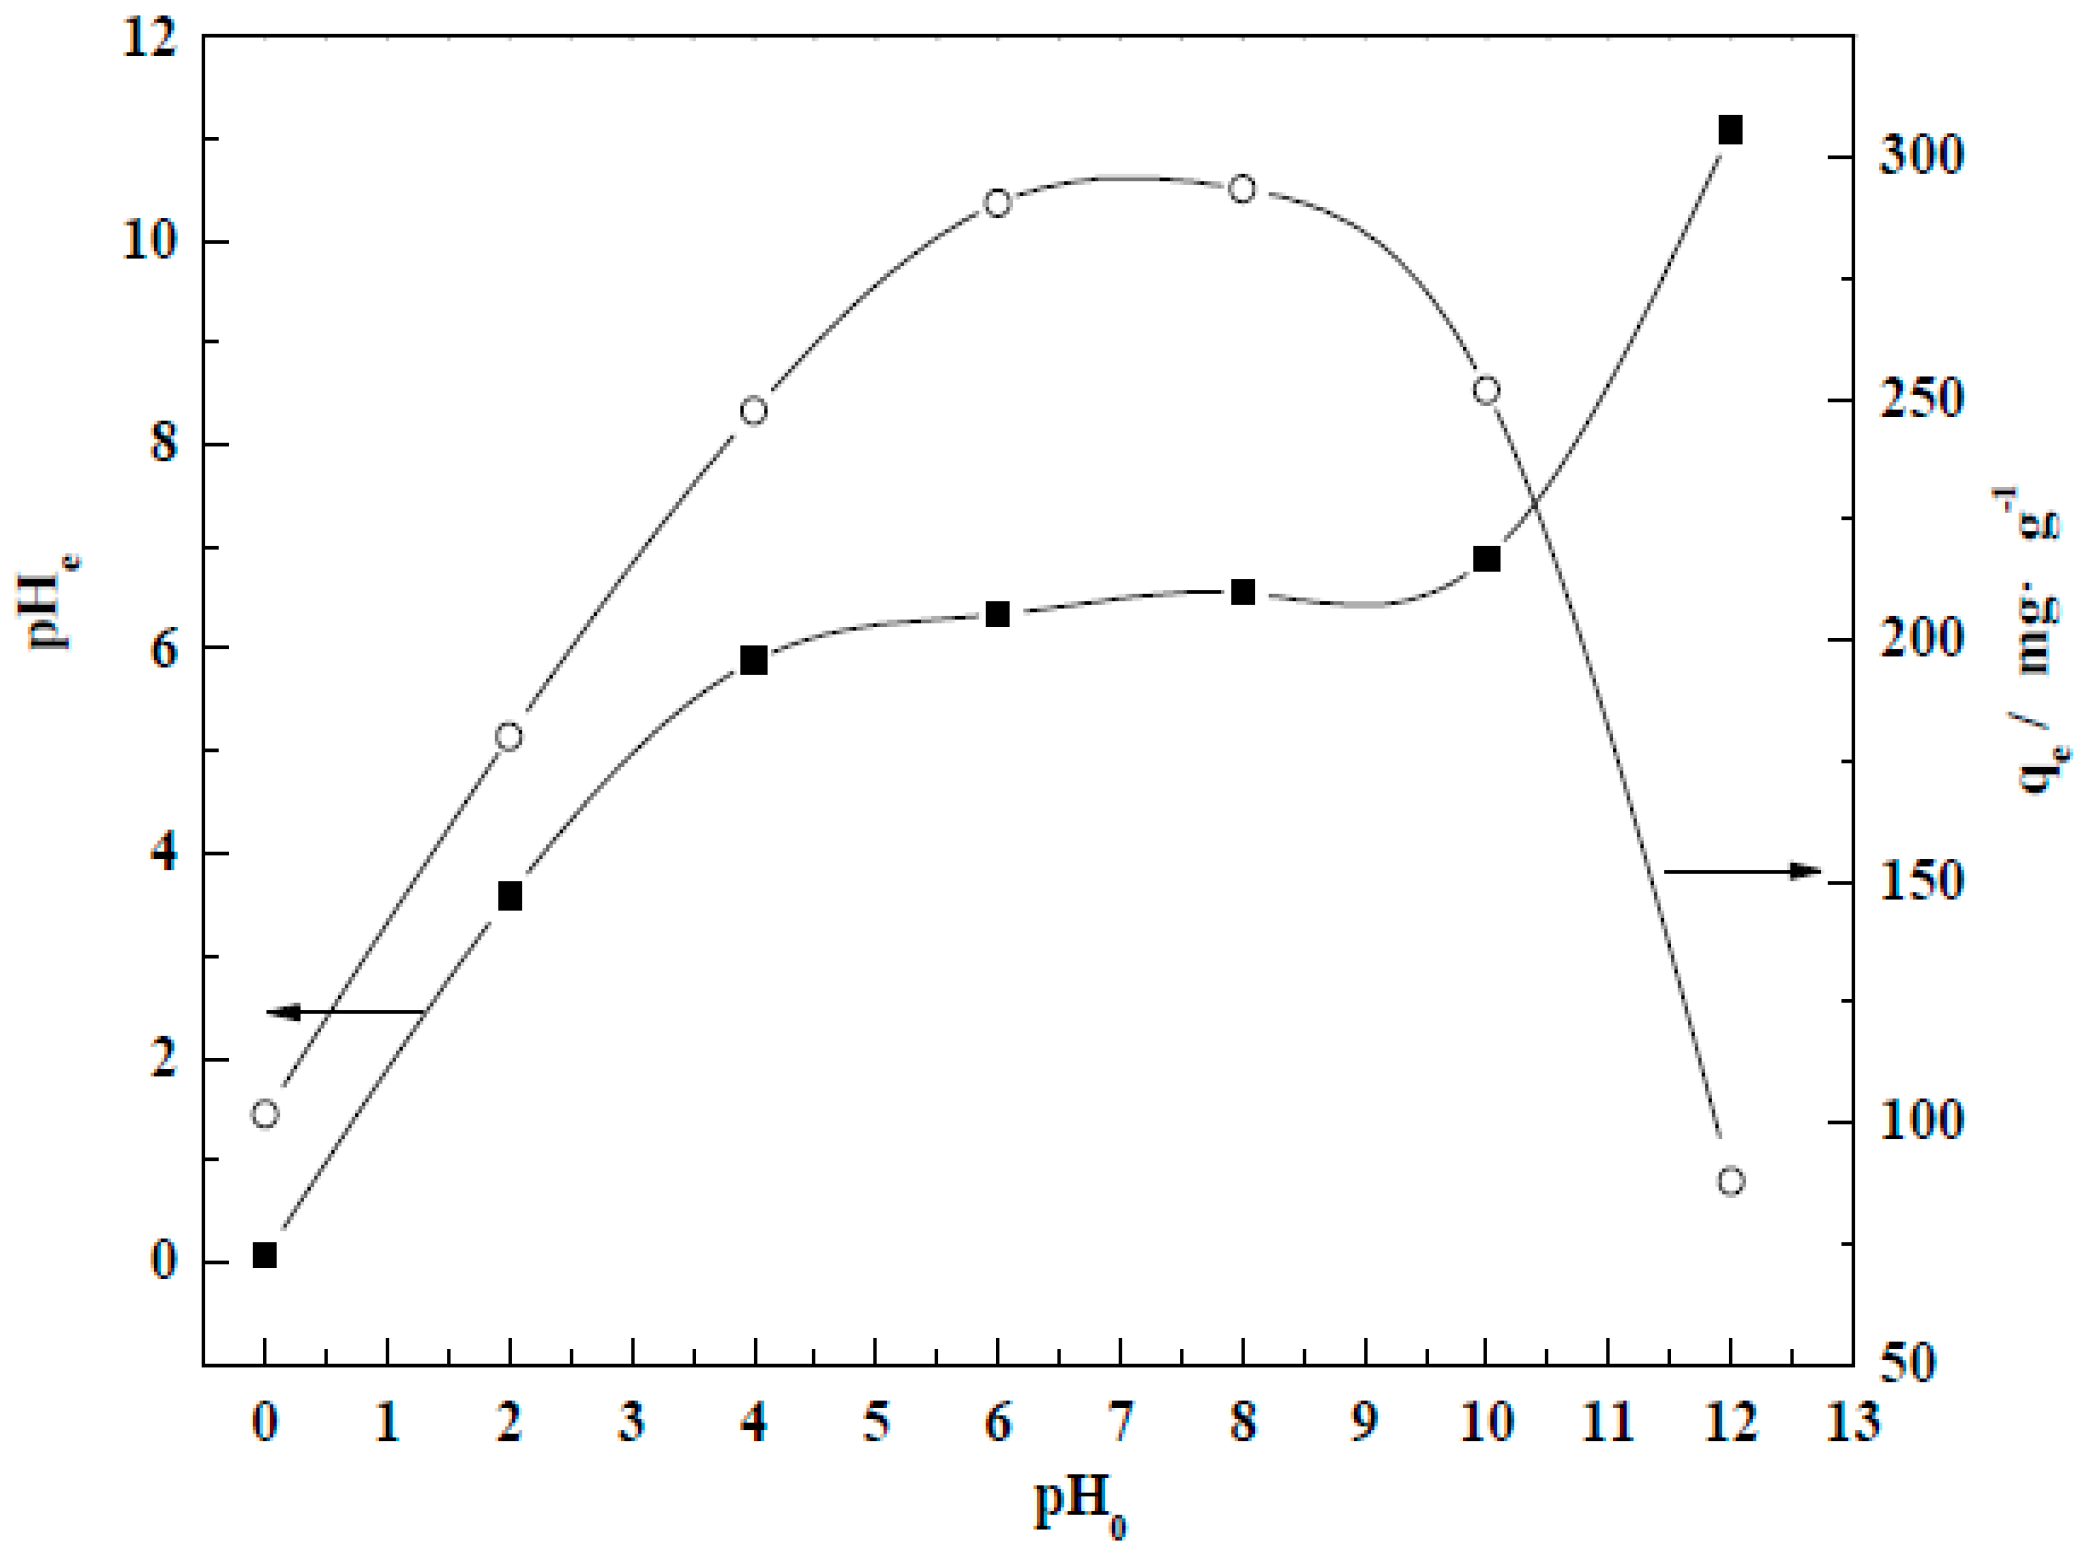
3.4.4. Initial pH
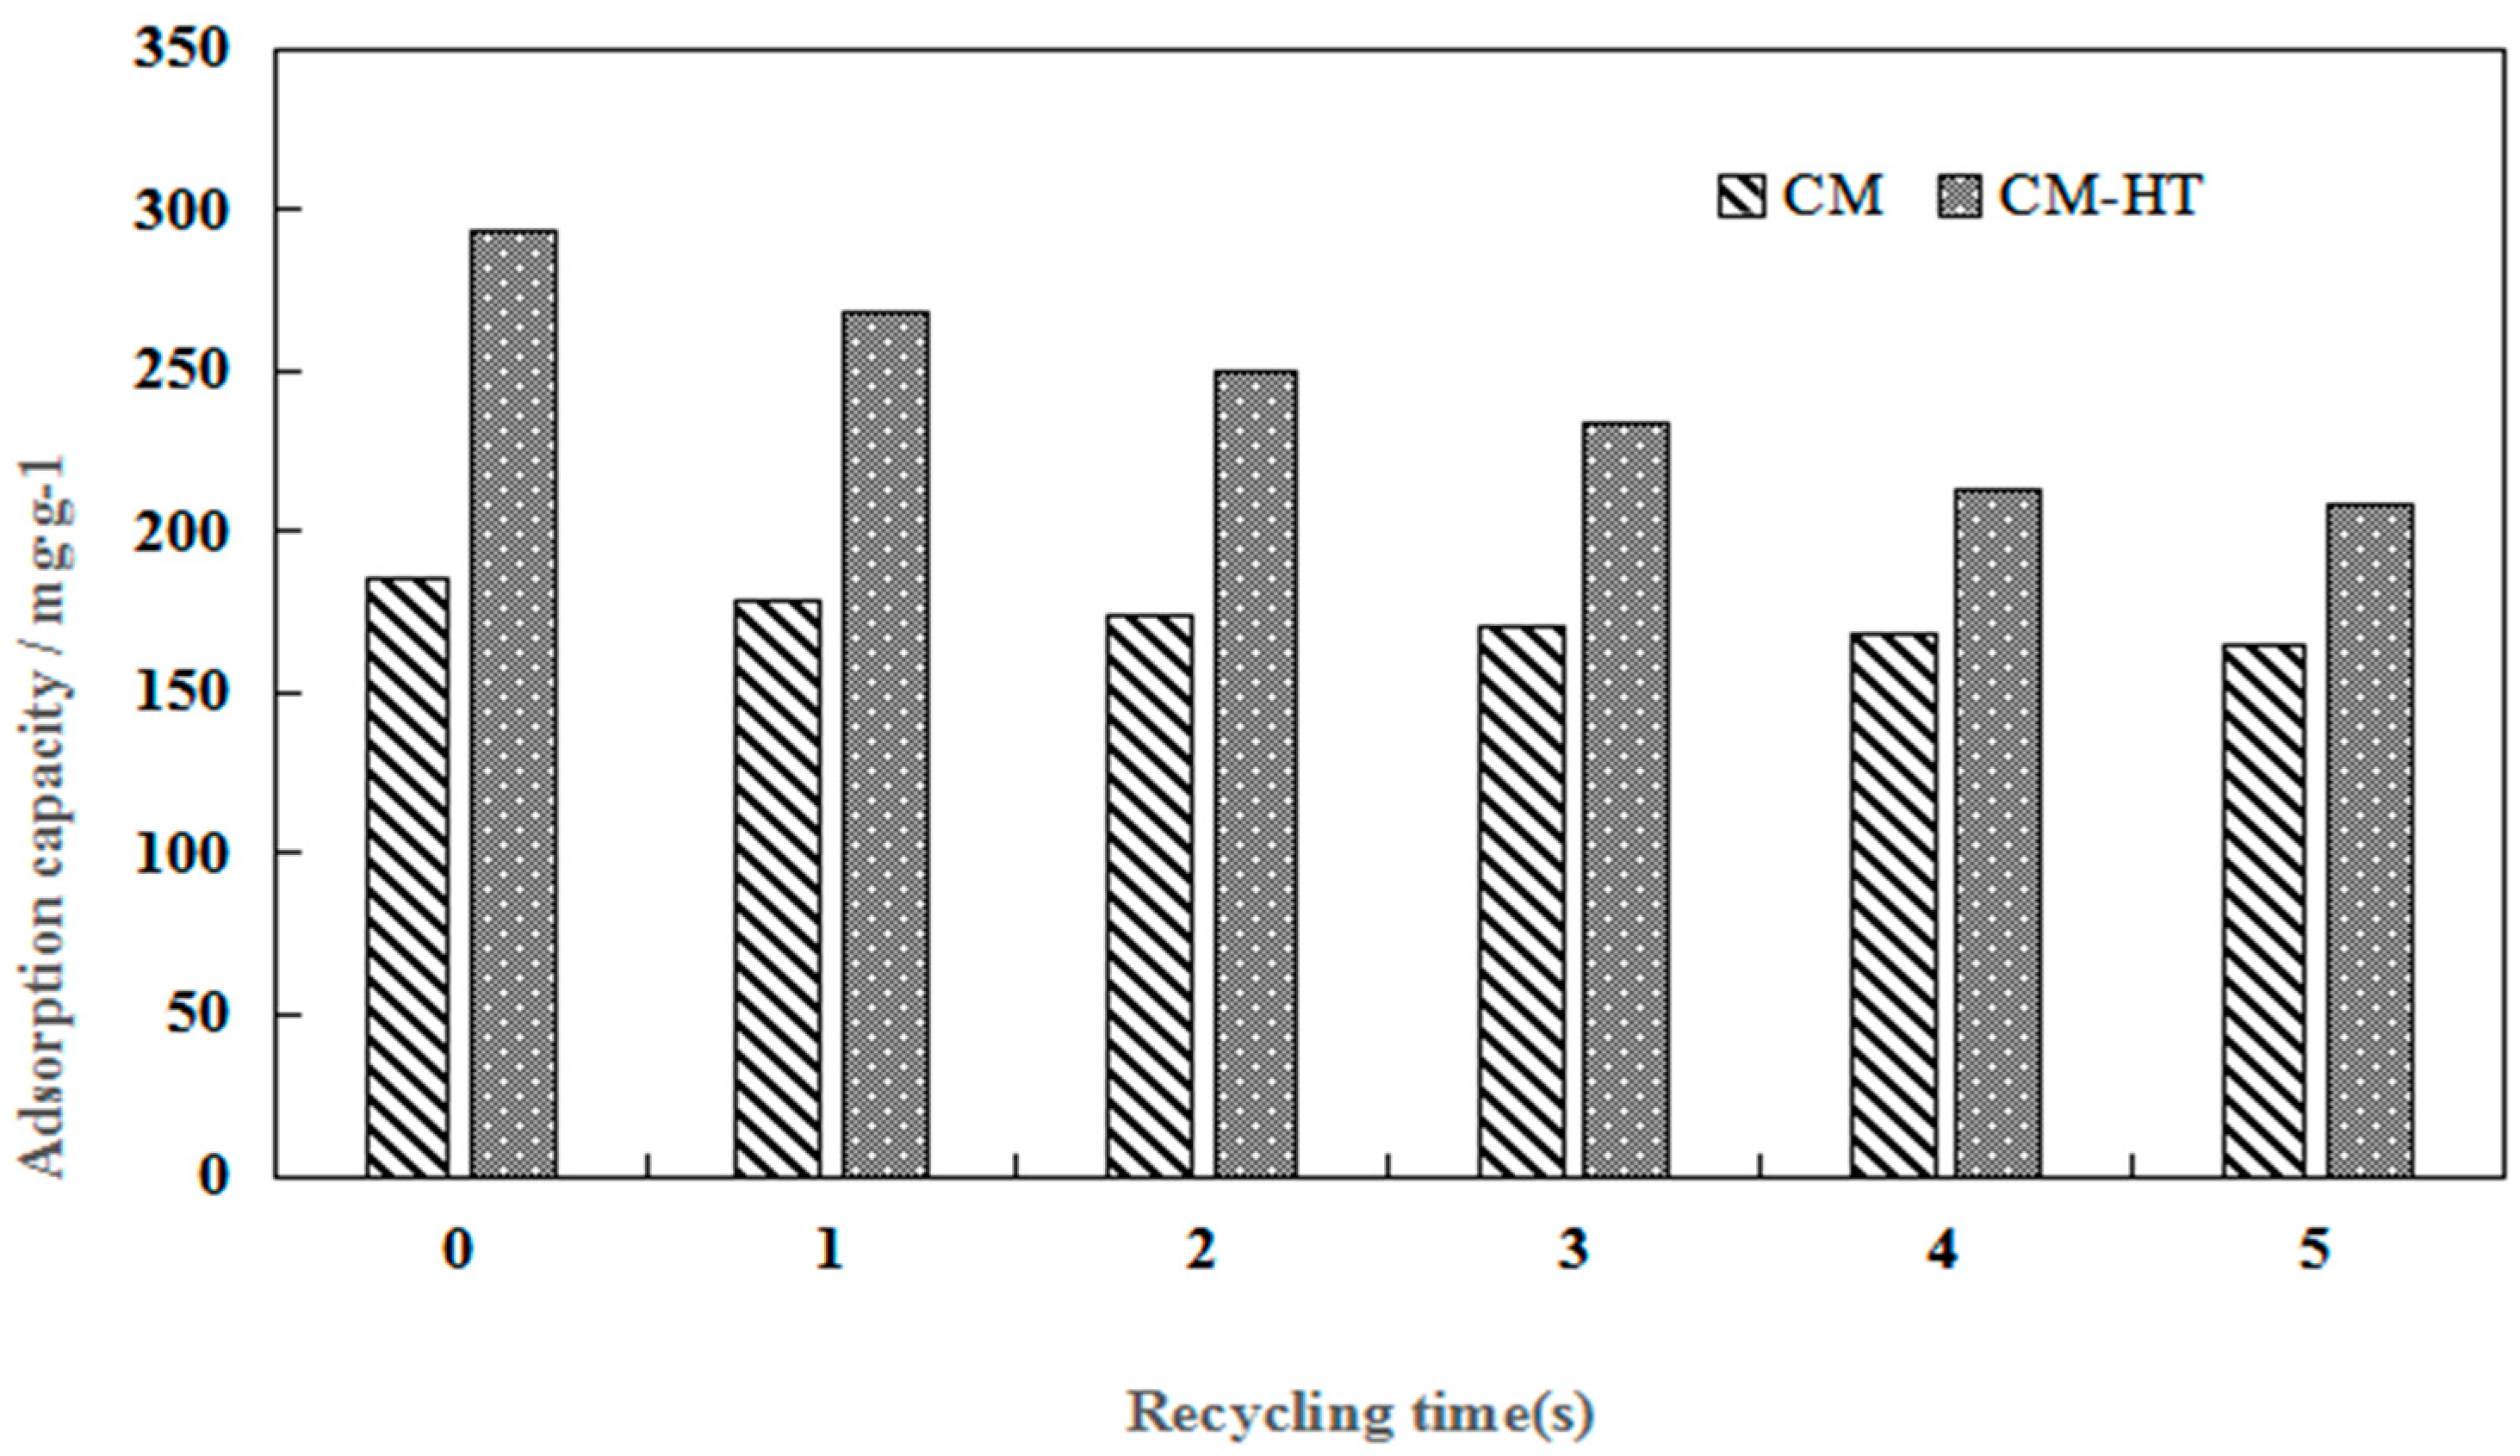
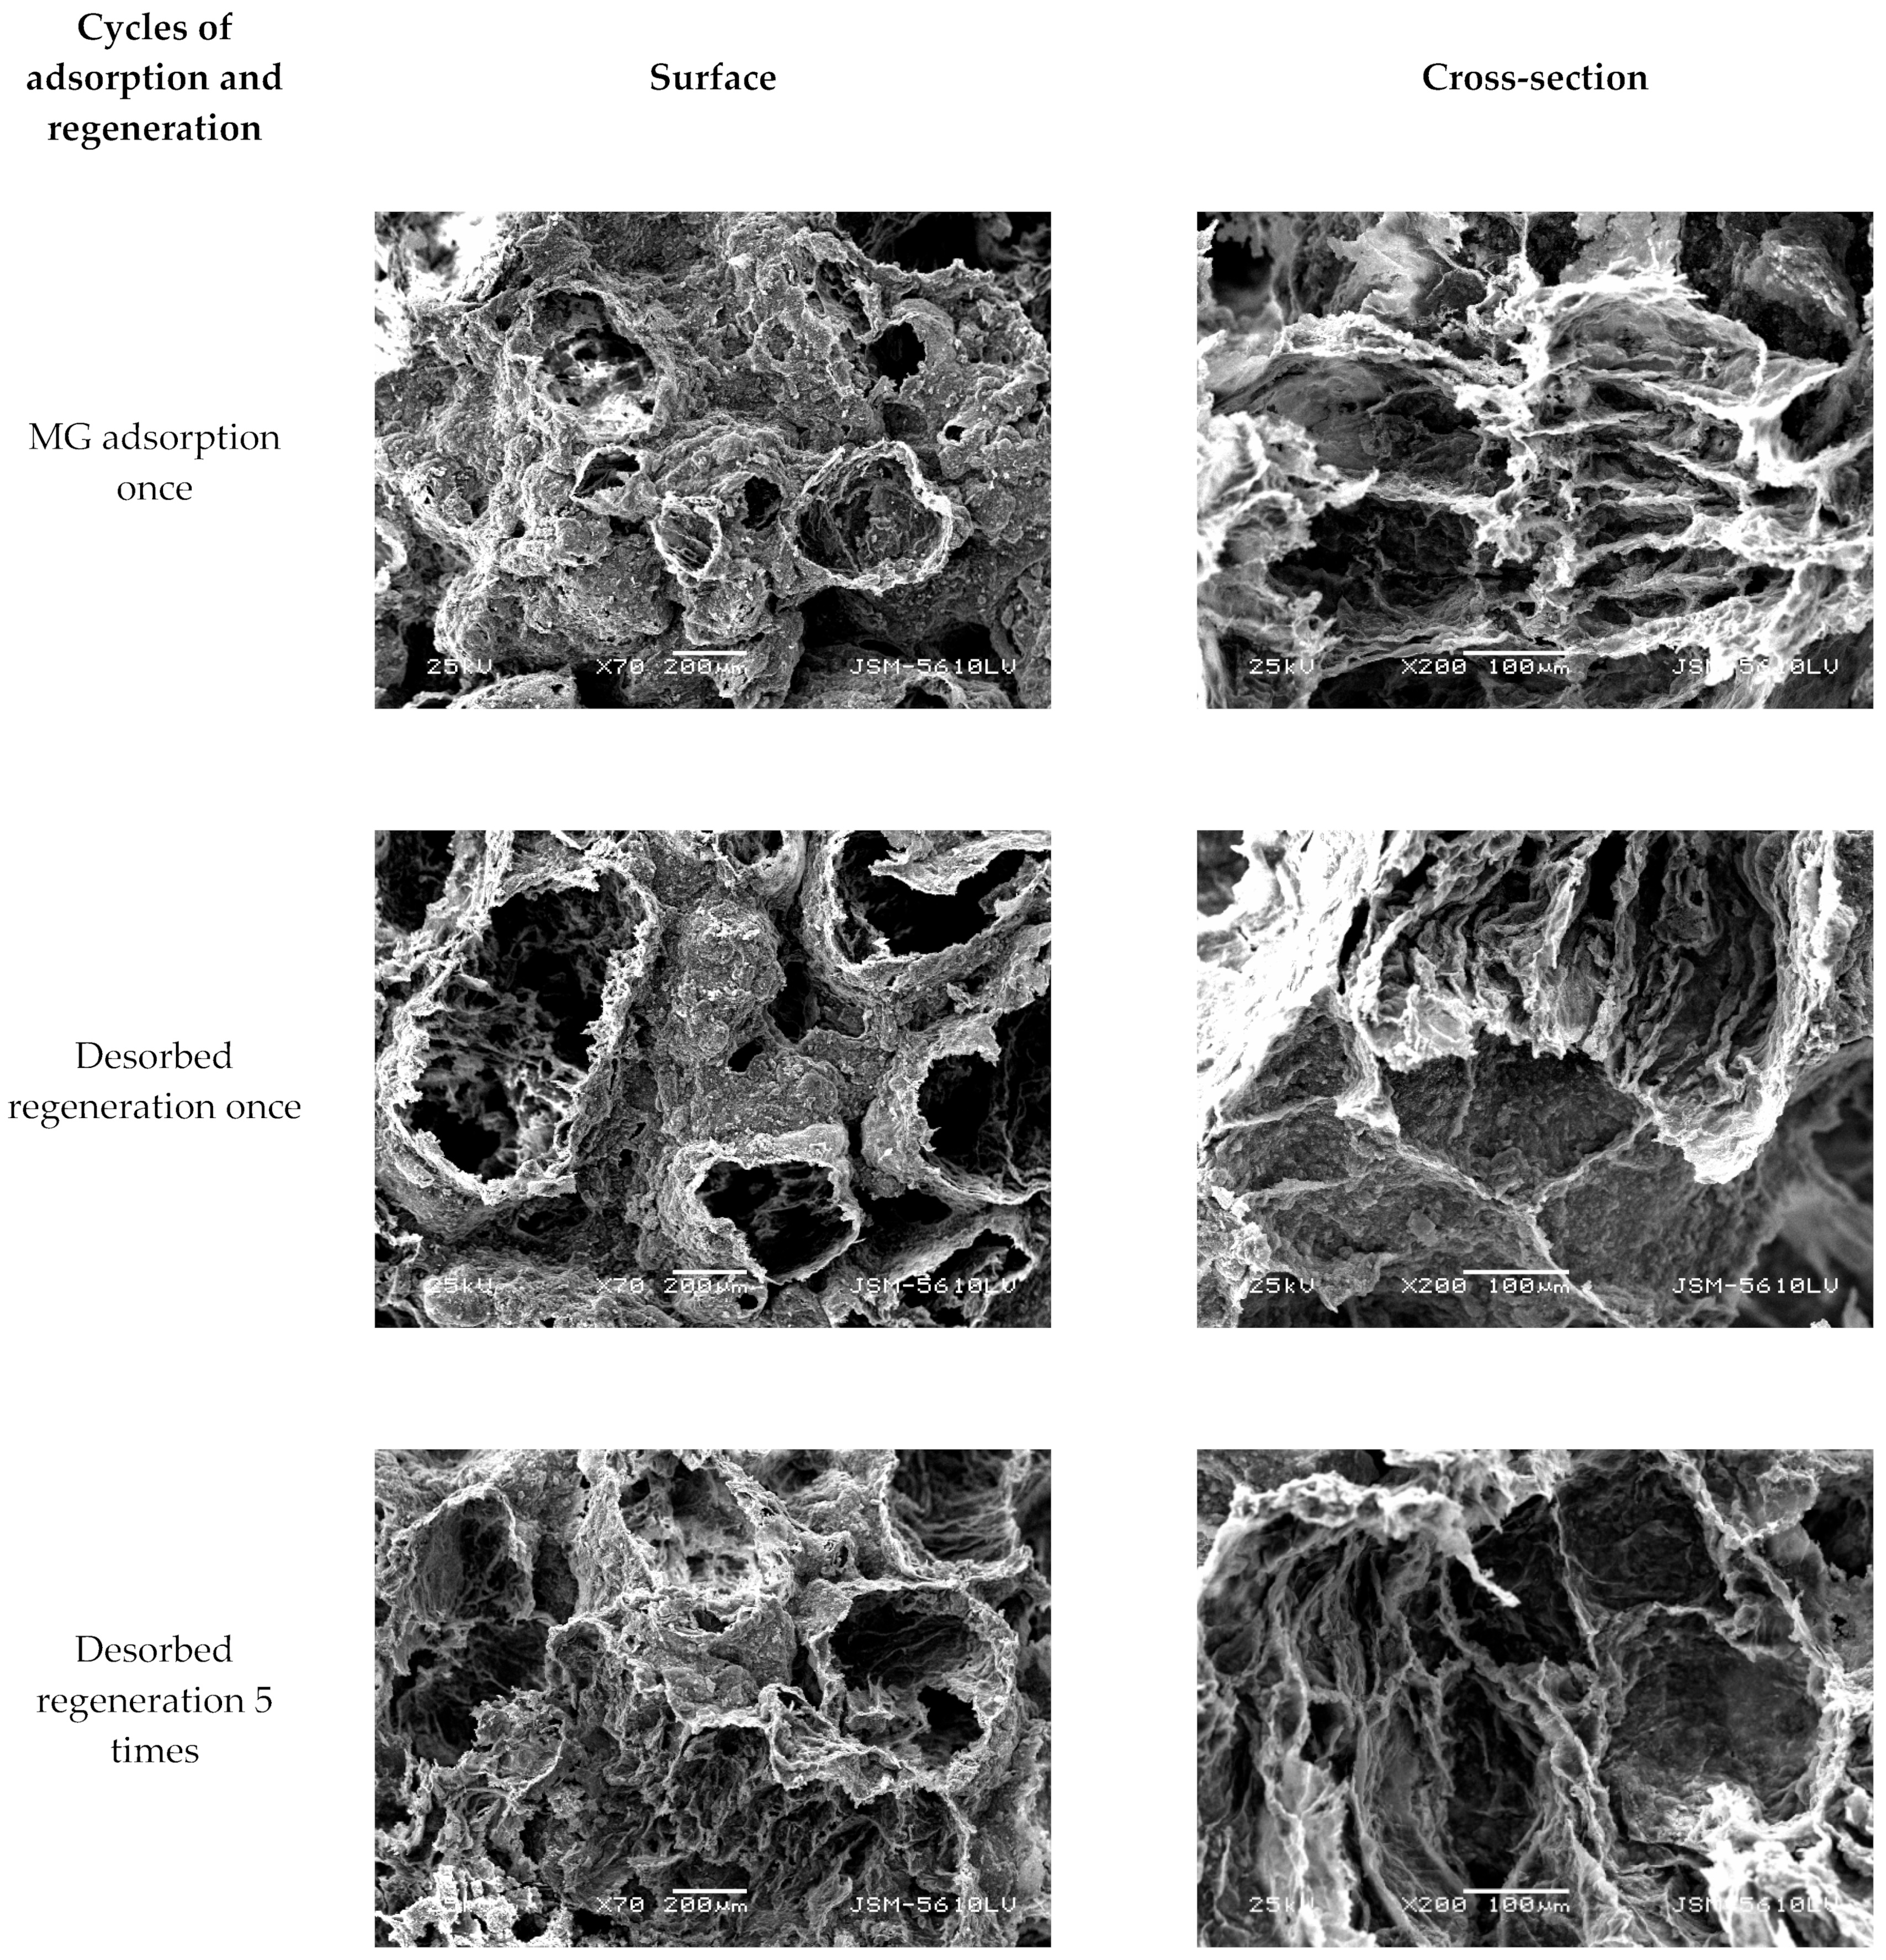
3.4.5. Desorbed Recycling of Adsorbents
3.5. Effect of Hydrothermal Modification on Adsorptive Performance of Clay-Based Minerals
3.5.1. Mechanism of CM-HT Adsorption
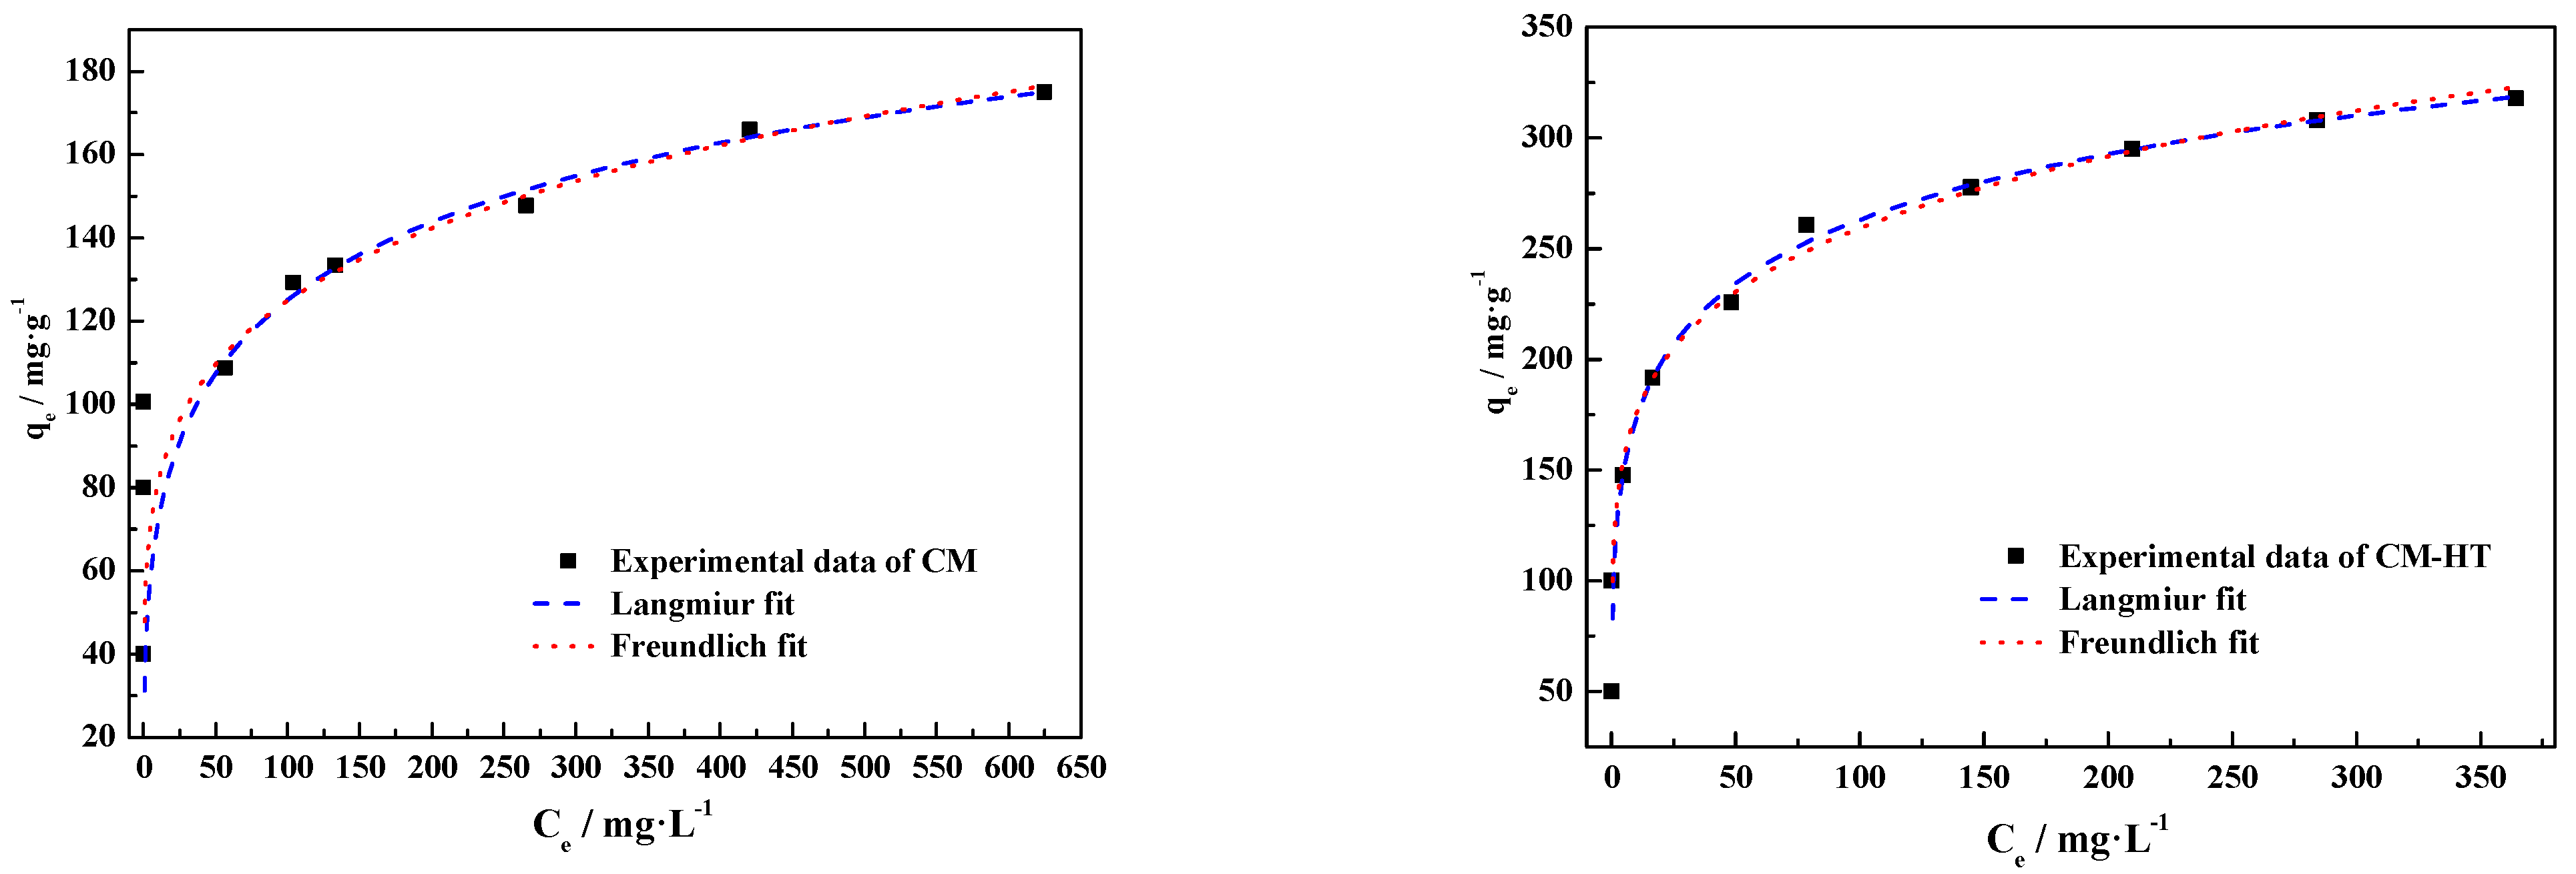
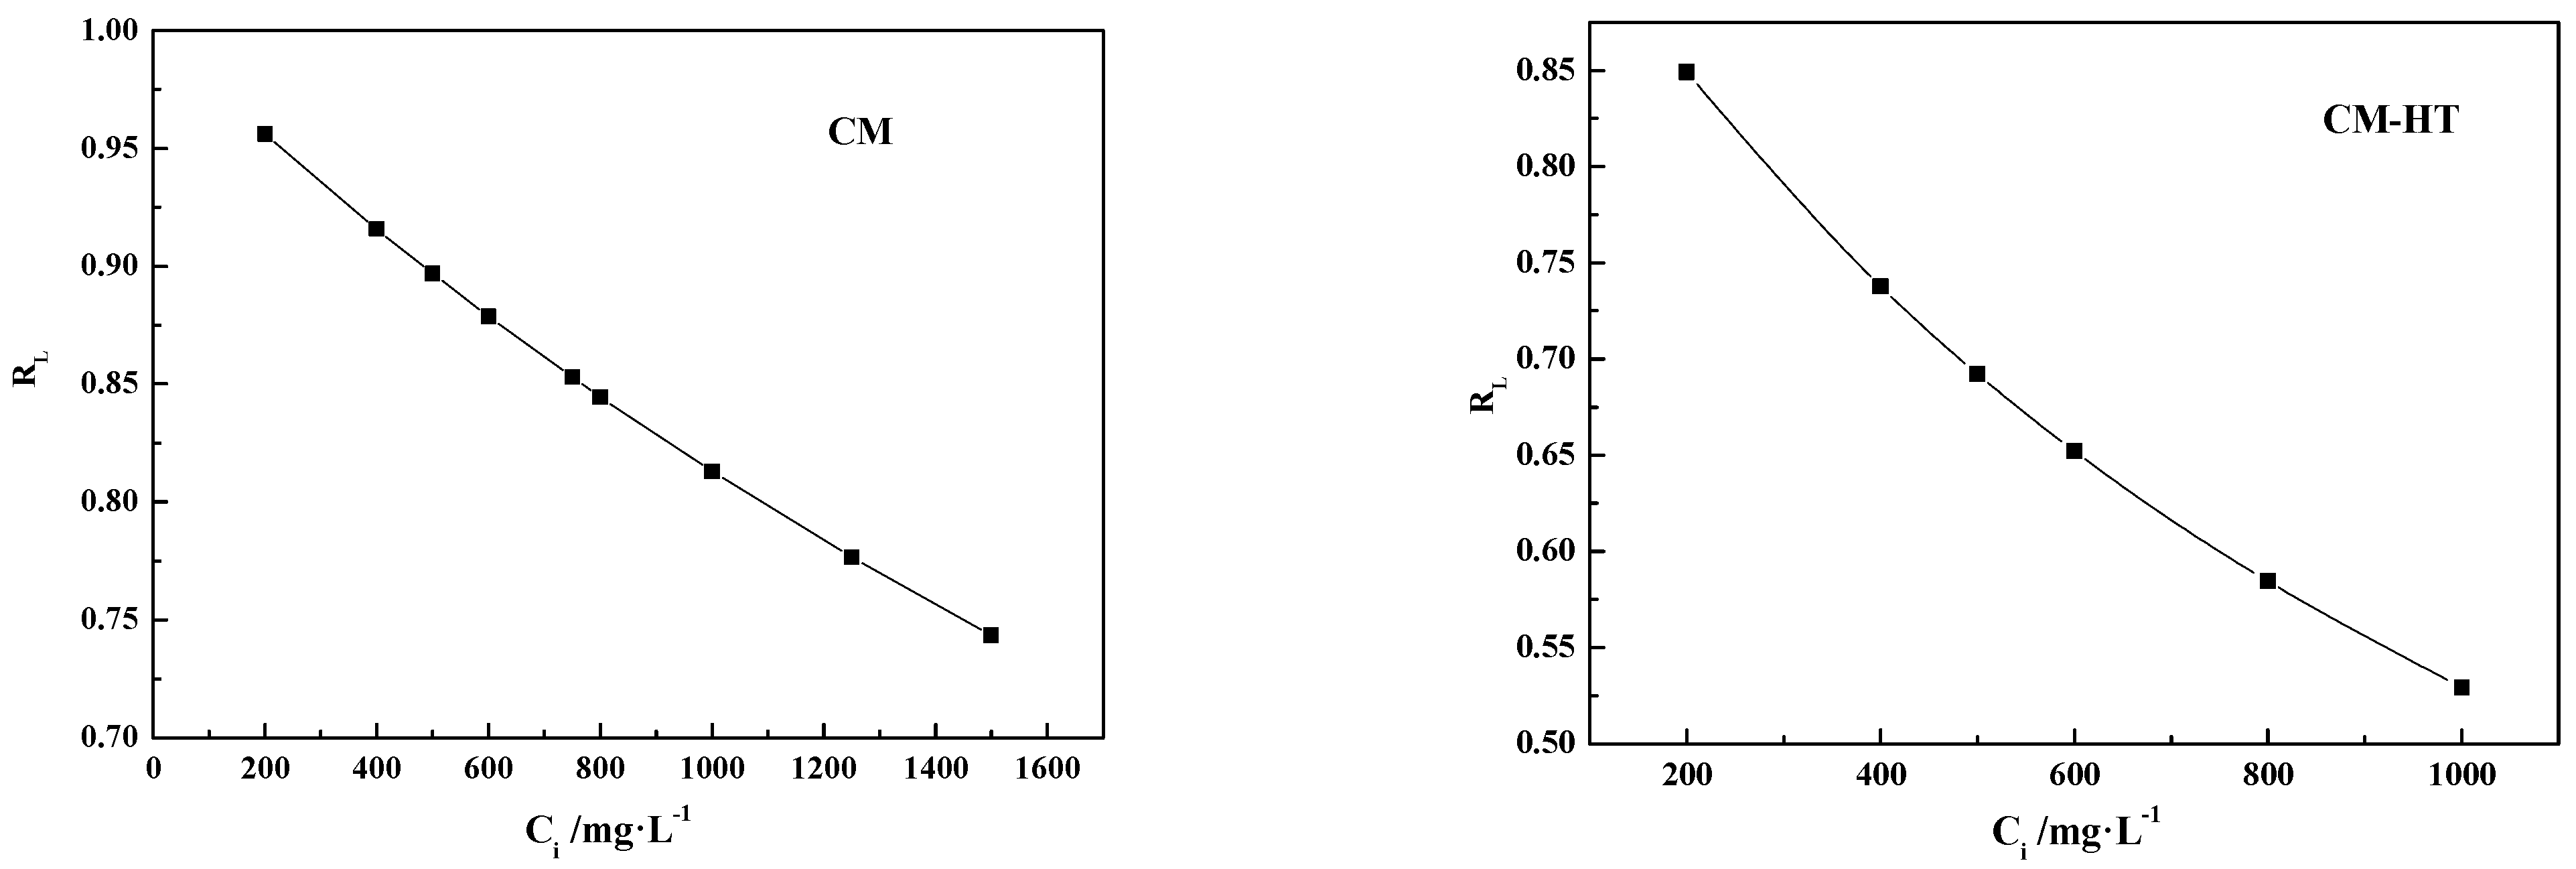
3.5.2. Isotherm Analysis
- (1)
- Langmuir adsorption isotherm model
- (2)
- Freundlich adsorption isotherm model
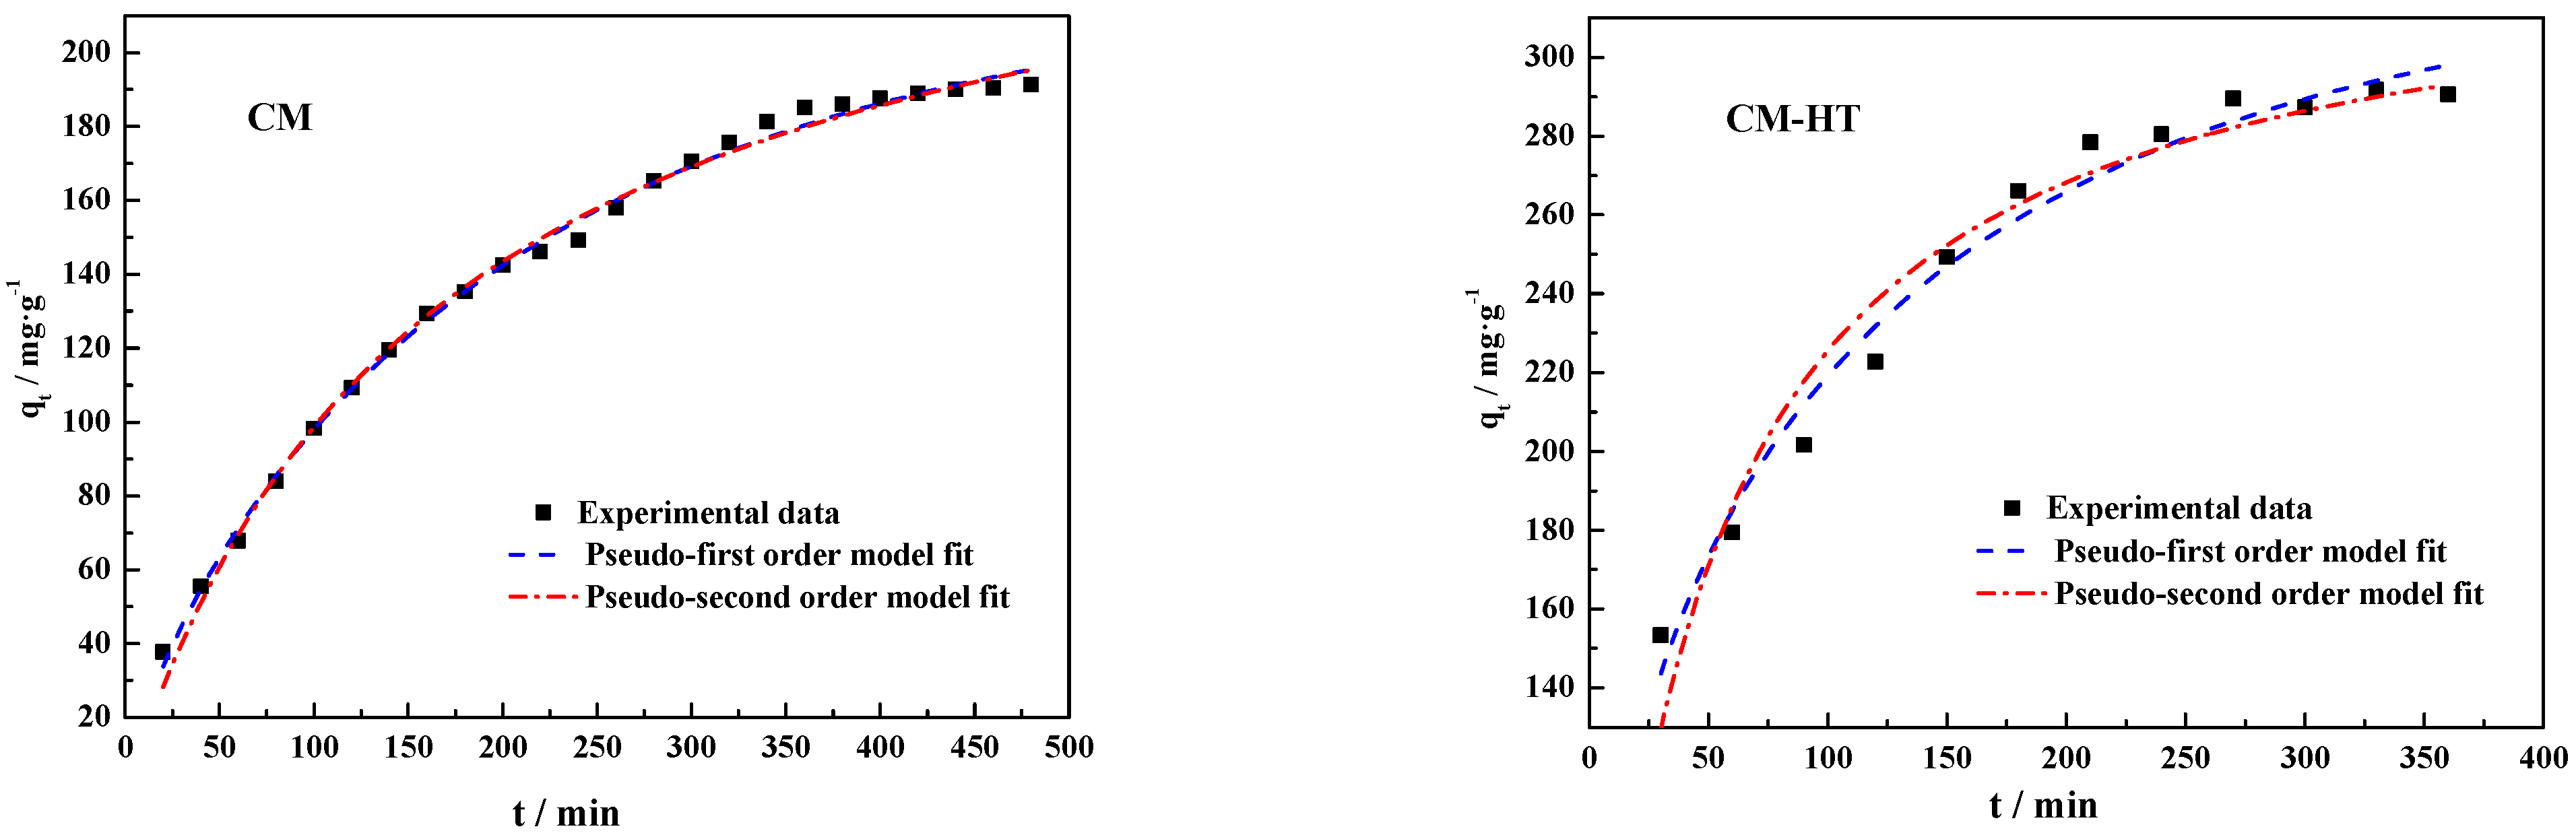
3.5.3. Kinetic Analysis
- (1)
- Pseudo-first kinetic model
- (2)
- Pseudo-secondary kinetic model
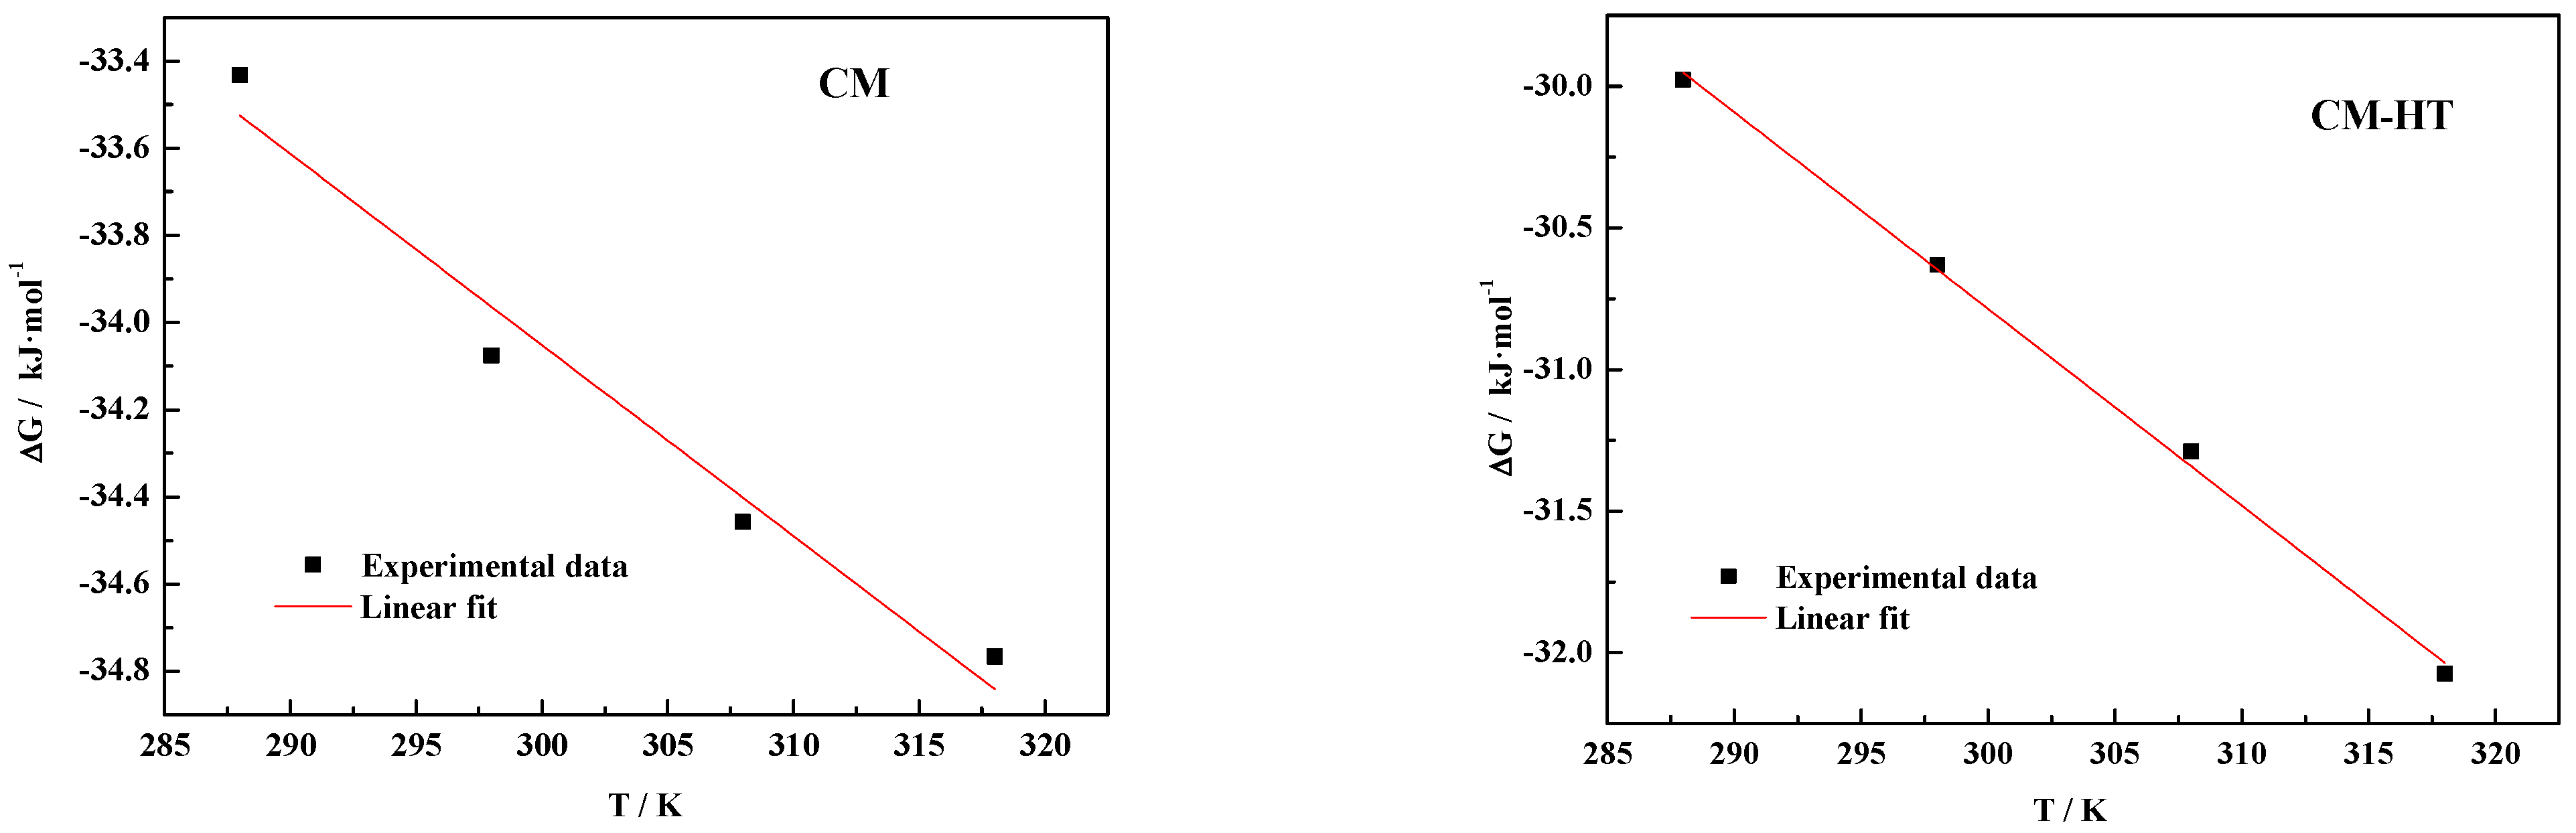
3.5.4. Thermodynamic Analysis
4. Conclusions
- Temperature of hydrothermal modification. At around 150 °C, phase transformation in the clay (which reduces the concentration of minerals with poorer adsorptive performance in the base material, such as feldspar, hematite, chlorite, calcite, illite and quartz) and hydrated expansion is promoted, increasing the adsorption capacity. As the modification temperature continues to rise, due to overpressure in the reaction kettle, excessive hydrated expansion occurs in the base material, causing the collapse of pore canals at the internal/external mineral surface, obstructing adsorbing channels, reducing the number of active adsorbing sites and decreasing adsorption efficiency.
- Duration of hydrothermal modification. As the modification time is increased from 0.5 h to 2 h, the interlayer space of the clay is increased due to the hydrated expansion, improving the adsorptive performance of CM-HT and shortening the time to reach equilibrium adsorption. With continued increase in modification time, the saturated vapor pressure is increased, making the mineral crystal structure looser, and even causing collapse, which is unfavorable for MG adsorption.
- Liquid/solid ratio. As the specific gravity of water in the hydrothermal modification system is increased, interlayer metal cations in the clay are exchanged in CM-HT, creating more active adsorbing sites. When the ratio between water and raw minerals is >20:1, since excessive metal cations are exchanged, collapse is caused in the mineral crystal structure, which is unfavorable for MG adsorption.
Author Contributions
Funding
Institutional Review Board Statement
Informed Consent Statement
Data Availability Statement
Conflicts of Interest
References
- Barakan, S.; Aghazadeh, V. The advantages of clay mineral modification methods for enhancing adsorption efficiency in wastewater treatment: A review. Environ. Sci. Pollut. Res. 2021, 28, 2572–2599. [Google Scholar] [CrossRef] [PubMed]
- Lakshmi, S.G.; Brijesh, K.; Mukesh, P.; Amudha, A.; Bhat, K.S.; Nagaraja, H.S. Enhanced electrochemical performance of low-content graphene oxide in porous Co3O4 microsheets for dual applications of lithium-ion battery anode and lithium-ion capacitor. J. Electron. Mater. 2024, 53, 1517–1529. [Google Scholar] [CrossRef]
- Vishwakarma, N.; Mashangva, T.T.; Kumar, M.; Srivastava, A.; Sharma, A. Impact of hydrothermal and solvent-thermal synthesis on the electrochemical performance of V2O5. Mater. Lett. 2024, 361, 136137. [Google Scholar] [CrossRef]
- Chen, G.Q.; Liu, Z.L.; Yang, G.J.; Zhang, Q.; Lan, T.C.; Zhang, C.M.; Ping Li, P.; Liu, K.M.; He, S.J. Synthesis of chain-like nitrogen-doped carbon for high-performance supercapacitors. Colloid Surf. A 2024, 687, 133498. [Google Scholar] [CrossRef]
- Chen, H.Y.; Yang, H.M.; Xi, Y.F. Highly ordered and hexagonal mesoporous silica materials with large specific surface from natural rectorite mineral. Micropor. Mesopor. Mat. 2019, 279, 53–60. [Google Scholar] [CrossRef]
- Li, Z.H.; Chang, P.H.; Jiang, W.T.; Liu, Y.J. Enhanced removal of ethidium bromide (EtBr) from aqueous solution using rectorite. J. Hazard. Mater. 2020, 384, 121254. [Google Scholar] [CrossRef] [PubMed]
- Sun, Z.M.; Xu, J.; Wang, G.F.; Song, A.K.; Li, C.Q.; Zheng, S.L. Hydrothermal fabrication of rectorite based biocomposite modified by chitosan derived carbon nanoparticles as efficient mycotoxins adsorbents. Appl. Clay Sci. 2020, 184, 105373. [Google Scholar] [CrossRef]
- Chen, G.B.; Li, X.; Zhao, H.Z.; Qiu, M.; Xia, S.W.; Yu, L.M. Revealing the mechanisms of mercury adsorption on metal-doped kaolinite(001) surfaces by first principles. J. Hazard. Mater. 2022, 431, 128586. [Google Scholar] [CrossRef]
- Zhang, Q.; Wang, J.B.; Zhang, Y.D.; Chen, J.T. Natural kaolinite-based hierarchical porous microspheres as effective and highly recyclable adsorbent for removal of cationic dyes. Environ. Sci. Pollut. Res. 2022, 29, 72001–72016. [Google Scholar] [CrossRef] [PubMed]
- Ain, Q.U.; Rasheed, U.; Yaseen, M.; Zhang, H.B.; Tong, Z.F. Superior dye degradation and adsorption capability of polydopamine modified Fe3O4-pillared bentonite composite. J. Hazard. Mater. 2020, 397, 122758. [Google Scholar] [CrossRef] [PubMed]
- Sahel, F.; Sebih, F.; Bellahouel, S.; Bengueddach, A.; Hamacha, R. Synthesis and characterization of highly ordered mesoporous nanomaterials Al-MCM-41 and Al-SBA-15 from bentonite as efficient catalysts for the production of biodiesel MELA and EELA. Res. Chem. Intermediat. 2020, 46, 133–148. [Google Scholar] [CrossRef]
- Yang, H.M.; Tang, A.D.; Ouyang, J.; Li, M.; Mann, S. From natural attapulgite to mesoporous materials: Methodology, characterization and structural evolution. J. Phys. Chem. B 2010, 114, 2390–2398. [Google Scholar] [CrossRef] [PubMed]
- Wu, Y.; Du, H.; Gao, Y.J.; Liu, X.Y.; Yang, T.Y.; Zhao, L.; Yue, X.Q.; Zhang, S.; Zhang, J.B. Syntheses of four novel silicate-based nanomaterials from coal gangue for the capture of CO2. Fuel 2019, 258, 116192. [Google Scholar] [CrossRef]
- Deng, Y.X.; Xu, X.D.; Wang, R.; Zhao, Y. Characterization and photocatalytic evaluation of Fe-loaded mesoporous MCM-41 prepared using iron and silicon sources extracted from iron ore tailing. Waste Biomass Valorization 2020, 11, 1491–1498. [Google Scholar] [CrossRef]
- Jiang, H.J.; Guo, H.W.; Li, P.; Li, Y.; Yan, B.J. Preparation of CaMgAl-LDHs and mesoporous silica sorbents derived from blast furnace slag for CO2 capture. RSC Adv. 2019, 9, 6054–6063. [Google Scholar] [CrossRef] [PubMed]
- Fakhar, H.; Jiang, J. A zero-waste approach to blast furnace slag by synthesis of mesoporous nanosilica with high surface area. Int. J. Environ. Sci. Technol. 2020, 17, 309–318. [Google Scholar] [CrossRef]
- Kazak, O.; Tor, A. In situ preparation of magnetic hydrochar by co-hydrothermal treatment of waste vinasse with red mud and its adsorption property for Pb(II) in aqueous solution. J. Hazard. Mater. 2020, 393, 122391. [Google Scholar] [CrossRef] [PubMed]
- Extross, A.; Waknis, A.; Tagad, C.; Gedam, V.V.; Pathak, P.D. Adsorption of congo red using carbon from leaves and stem of water hyacinth: Equilibrium, kinetics, thermodynamic studies. Int. J. Environ. Sci. Technol. 2023, 20, 1607–1644. [Google Scholar] [CrossRef]
- Liu, J.H.; Wei, X.H.; Xue, J.; Su, H.M. Preparation and adsorption properties of mesoporous material PS-MCM-41 with low-silicon content peanut shell ash as silicon source. Mater. Chem. Phys. 2020, 241, 122355. [Google Scholar] [CrossRef]
- Zhang, H.W.; Zhang, R.H.; Li, W.Y.; Ling, Z.; Shu, W.; Ma, J.Y.; Yan, Y.J. Agricultural waste-derived biochars from co-hydrothermal gasification of rice husk and chicken manure and their adsorption performance for dimethoate. J. Hazard. Mater. 2022, 429, 128248. [Google Scholar] [CrossRef] [PubMed]
- Ullah, R.; Liu, C.; Panezai, H.; Gul, A.; Sun, J.; Wu, X. Controlled crystal phase and particle size of loaded-TiO2 using clinoptilolite as support via hydrothermal method for degradation of crystal violet dye in aqueous solution. Arab. J. Chem. 2020, 13, 4092–4101. [Google Scholar] [CrossRef]
- Yuan, W.Q.; Kuang, J.Z.; Yu, M.M.; Huang, Z.Y.; Zou, Z.L.; Zhu, L.P. Facile preparation of MoS2@Kaolin composite by one-step hydrothermal method for efficient removal of Pb(II). J. Hazard. Mater. 2021, 405, 124261. [Google Scholar] [CrossRef] [PubMed]
- Wang, W.B.; Zhao, W.T.; Zhang, H.; Xu, J.; Zong, L.; Kang, Y.R.; Wang, A.Q. Mesoporous polymetallic silicate derived from naturally abundant mixed clay: A potential robust adsorbent for removal of cationic dye and antibiotic. Powder Technol. 2021, 390, 303–314. [Google Scholar] [CrossRef]
- Hao, M.Y. Ultrasound Promoted Adsorption of Anionic Dyes on Modified Zirconium Pillared Bentonite. Master’s Dissertation, Taiyuan University of Technology, Taiyuan, China, 2021; pp. 27–37. (In Chinese). [Google Scholar]
- Wang, Y. Properties of Bentonite-Derived Zeolite for Pb(II) Adsorption and Further Combination with Bi2O3 for Bisphenol a Removal. Master’s Dissertation, Guangxi University, Nanning, China, 2022; pp. 14–31. (In Chinese). [Google Scholar]
- Fatimah, I.; Purwiandono, G.; Hidayat, A.; Sagadevan, S.; Kamari, A. Mechanistic insight into the adsorption and photocatalytic activity of a magnetically separable γ-Fe2O3/Montmorillonite nanocomposite for rhodamine B removal. Chem. Phys. Lett. 2022, 792, 139410. [Google Scholar] [CrossRef]
- He, Q.D. Study on Sustainable Conversion of Rectorite@Dye Waste to Prepare New Composite Adsorbent and Its Application. Master’s Dissertation, Inner Mongolia University, Hohhot, China, 2022; pp. 35–64. (In Chinese). [Google Scholar]
- Xu, Q.Y. Distillers’ Grains-Loaded Clay Minerals in Hydrothermal Treatment Process and Products Application Research. Master’s Dissertation, Guizhou Minzu University, Guiyang, China, 2022; pp. 20–31. (In Chinese). [Google Scholar]
- Diejomaoh, O.T.A.; Onwudili, J.A.; Simons, K.E.; Maziero, P. On-purpose production of propane fuel gas from the hydrothermal reactions of n-butanol over Pt/Al2O3 catalyst: A parametric and mechanistic study. Fuel 2024, 365, 131140. [Google Scholar] [CrossRef]
- Gong, J.; Zhang, Z.Y.; Xi, S.B.; Wang, W.J.; Lu, J.M.; Chen, P. Graphene quantum dot enabled interlayer spacing and electronic structure regulation of single-atom doped MoS2 for efficient alkaline hydrogen evolution. Chem. Eng. J. 2023, 451 Pt 3, 138951. [Google Scholar] [CrossRef]
- Mao, H.; Qiu, Z.S.; Huang, W.A.; Shen, Z.H.; Yang, L.Y.; Zhong, H.Y. The effects of temperature and pressure on the hydration swelling characteristics of clay mineral. Pet. Drill. Tech. 2013, 41, 56–61. [Google Scholar]
- Wei, R.; Xia, Y.; Qu, A.; Lv, X.; Fan, Q.; Zhang, L.; Zhang, Y.; Zhao, J.; Yang, L. Dependence of thermal conductivity on the phase transition of gas hydrate in clay sediments. Fuel 2022, 317, 123565. [Google Scholar] [CrossRef]
- Muttakin, M.; Mitra, S.; Thu, K.; Ito, K.; Saha, B.B. Theoretical framework to evaluate minimum desorption temperature for IUPAC classified adsorption isotherms. Int. J. Heat. Mass. Tran. 2018, 122, 795–805. [Google Scholar] [CrossRef]
- Wang, T.H.; Yang, C.C.; Qin, K.; Chen, C.W.; Dong, C.D. Life time enhanced Fenton-like catalyst by dispersing iron oxides in activated carbon: Preparation and reactivation through carbothermal reaction. J. Hazard. Mater. 2021, 406, 124791. [Google Scholar] [CrossRef] [PubMed]
- Nie, Y.M.; Ma, H.W.; Liu, H.; Zhang, P.; Qiu, M.Y.; Wang, L. Reactive mechanism of potassium feldspar dissolution under hydrothermal condition. J. Chinese Ceramic Society 2006, 34, 846–850, 867. [Google Scholar]
- Zhu, Y.; Ding, H.R.; Li, Y.; Li, Y.Z.; Xu, X.M.; Lu, A.H. The middle-infrared spectroscopic characteristics of several common silicate minerals. Acta. Miner. Sin. 2019, 39, 173–182. (In Chinese) [Google Scholar]
- Xiao, Y.L.; Tang, W.; Peijnenburg, W.J.G.M.; Zhang, X.H.; Wu, J.; Xu, M.; Xiao, H.; He, Y.; Luo, L.; Yang, G.; et al. Aggregation, solubility and cadmium-adsorption capacity of CuO nanoparticles in aquatic environments: Effects of pH, natural organic matter and component addition sequence. J. Environ. Manag. 2022, 310, 114770. [Google Scholar] [CrossRef] [PubMed]
- Tang, H.; Zhang, S.Y.; Huang, T.L.; Cui, F.Y.; Xing, B.S. pH-Dependent adsorption of aromatic compounds on graphene oxide: An experimental molecular dynamics simulation and density functional theory investigation. J. Hazard. Mater. 2020, 395, 122680. [Google Scholar] [CrossRef] [PubMed]
- Zhong, Y.P.; Wang, K.K.; Guo, C.Y.; Kou, Y.L.; Hassan, A.; Lu, Y.; Wang, J.D.; Wang, W. Competition adsorption of malachite green and rhodamine B on polyethylene and polyvinyl chloride microplastics in aqueous environment. Water. Sci. Technol. 2022, 86, 894–908. [Google Scholar] [CrossRef] [PubMed]
- Langmuir, I. The adsorption of gases on plane surfaces of glass, mica and platinum. J. Am. Chem. Soc. 1918, 40, 1361–1403. [Google Scholar] [CrossRef]
- Hall, K.R.; Eagleton, L.C.; Acrivos, A.; Vermeulen, T. Pore- and solid-diffusion kinetics in fixed-bed adsorption under constant-pattern conditions. Ind. Eng. Chem. Res. 1966, 5, 212–223. [Google Scholar] [CrossRef]
- Ibrahim, M.N.M.; Ngah, W.S.W.; Norliyana, M.S.; Daud, W.R.W. Copper(II) biosorption on soda lignin from oil palm empty fruit bunches (EFB). Clean Soil Air Water 2009, 37, 80–85. [Google Scholar] [CrossRef]
- Zhang, J.; Zhan, S.Y.; Zhong, L.B.; Wang, X.M.; Qiu, Z.M.; Zheng, Y.M. Adsorption of typical natural organic matter on microplastics in aqueous solution: Kinetics, isotherm, influence factors and mechanism. J. Hazard. Mater. 2023, 443 (Pt A), 130130. [Google Scholar] [CrossRef]
- Han, R.P.; Zhang, L.J.; Song, C.; Zhang, M.M.; Zhu, H.M.; Zhang, L.J. Characterization of modified wheat straw, kinetic and equilibrium study about copper ion and methylene blue adsorption in batch mode. Carbohydr. Polym. 2010, 79, 1140–1149. [Google Scholar] [CrossRef]
- Ho, Y.S.; McKay, G. Pseudo-second order model for sorption processes. Process Biochem. 1999, 34, 451–465. [Google Scholar] [CrossRef]
- Xie, W.; Gan, H.; Chen, S.; Wang, H.; Vandeginste, V.; Wang, M. Thermodynamic behavior of water vapor adsorption in shale and its dependence on organic matter and clay minerals. Fuel 2023, 352, 129108. [Google Scholar] [CrossRef]
- Tian, Y.; Ma, H.; Xing, B. Preparation of surfactant modified magnetic expanded graphite composites and its adsorption properties for ionic dyes. Appl. Surf. Sci. 2021, 537, 147995. [Google Scholar] [CrossRef]


| Temperature (°C) | 100 | 150 | 200 | 250 |
|---|---|---|---|---|
| Saturated vapor pressure (×103 Pa) | 101.32 | 475.72 | 1553.60 | 3973.60 |
| Adsorbent | BET Surface Area (m2/g) | Pore Volume (cm3/g) | Average Pore Size (nm) | Porosity (%) | Scatter Ratio (%) | Ignition Loss (%) |
|---|---|---|---|---|---|---|
| CM | 11.14 | 0.0615 | 22.0837 | 63.04 | 0.74 | 28.55 |
| CM-HT | 18.64 | 0.1289 | 26.4947 | 69.54 | 2.58 | 29.39 |
| Sum of Squares | Degree of Freedom | Mean Square | F | Significance | ||
|---|---|---|---|---|---|---|
| BET surface area | With group | 84.375 | 1 | 84.375 | 758.768 | <0.01 |
| Inter group | 0.445 | 4 | 0.111 | |||
| Total | 84.820 | 5 | ||||
| Pore volume | With group | 0.007 | 1 | 0.007 | 2496.602 | <0.01 |
| Inter group | 0.000 | 4 | 0.000 | |||
| Total | 0.007 | 5 | ||||
| Average pore size | With group | 63.440 | 1 | 63.440 | 56.131 | 0.02 |
| Inter group | 4.521 | 4 | 1.130 | |||
| Total | 67.961 | 5 | ||||
| Porosity | With group | 29.185 | 1 | 29.185 | 516.191 | <0.01 |
| Inter group | 0.226 | 4 | 0.057 | |||
| Total | 29.412 | 5 | ||||
| Scatter ratio | With group | 5.078 | 1 | 5.078 | 330.840 | <0.01 |
| Inter group | 0.061 | 4 | 0.015 | |||
| Total | 5.140 | 5 | ||||
| Ignition loss | With group | 1.058 | 1 | 1.058 | 0.822 | 0.416 |
| Inter group | 5.150 | 4 | 1.288 | |||
| Total | 6.209 | 5 |
| Mineral | d001 Value/Å of Face Net | |
|---|---|---|
| Before Modification | After Modification | |
| Montmorillonite | 12.6176 | 16.2916 |
| Rectorite | 24.3743 | 26.7583 |
| Absorbent | qe,exp (mg/g) | Langmuir Equation | Freundlich Equation | ||||
|---|---|---|---|---|---|---|---|
| qmax,fitted (mg/g) | KL·(L/mg) | R2 | N | KF [mg·g−1·(mg·L−1)−1/n] | R2 | ||
| CM | 185.10 | 310.12 | 0.13217 | 0.9832 | 5.30 | 52.37 | 0.9841 |
| CM-HT | 290.45 | 625.15 | 0.20268 | 0.9938 | 5.89 | 118.68 | 0.9902 |
| Adsorbent | qe,exp (mg/g) | Pseudo-First Kinetic Model | Pseudo-Secondary Kinetic Model | ||||
|---|---|---|---|---|---|---|---|
| qe1 (mg/g) | k1 (/min) | R2 | qe2 (mg/g) | k2 (mg/g/min) | R2 | ||
| CM | 185.10 | 218.47 | 0.00408 | 0.9965 | 263.24 | 2.3 × 10⁻⁵ | 0.9943 |
| CM-HT | 290.45 | 321.17 | 0.00495 | 0.9732 | 331.10 | 6.4 × 10⁻⁵ | 0.9455 |
| Absorbent | Temperature (K) | ΔG (kJ/mol) | ΔH (kJ/mol) | ΔS (kJ/mol/K) | R2 |
|---|---|---|---|---|---|
| CM | 288 | −33.432 | −20.8906 | 0.0438 | 0.9548 |
| 298 | −34.076 | ||||
| 308 | −34.458 | ||||
| 318 | −34.767 | ||||
| CM-HT | 288 | −29.978 | −9.9373 | 0.0694 | 0.9969 |
| 298 | −30.632 | ||||
| 308 | −31.290 | ||||
| 318 | −32.075 |
Disclaimer/Publisher’s Note: The statements, opinions and data contained in all publications are solely those of the individual author(s) and contributor(s) and not of MDPI and/or the editor(s). MDPI and/or the editor(s) disclaim responsibility for any injury to people or property resulting from any ideas, methods, instructions or products referred to in the content. |
© 2024 by the authors. Licensee MDPI, Basel, Switzerland. This article is an open access article distributed under the terms and conditions of the Creative Commons Attribution (CC BY) license (https://creativecommons.org/licenses/by/4.0/).
Share and Cite
Wang, E.; Huang, T.; Wu, Q.; Huang, L.; Kong, D.; Wang, H. Influence of Hydrothermal Modification on Adsorptive Performance of Clay Minerals for Malachite Green. Molecules 2024, 29, 1974. https://doi.org/10.3390/molecules29091974
Wang E, Huang T, Wu Q, Huang L, Kong D, Wang H. Influence of Hydrothermal Modification on Adsorptive Performance of Clay Minerals for Malachite Green. Molecules. 2024; 29(9):1974. https://doi.org/10.3390/molecules29091974
Chicago/Turabian StyleWang, Enwen, Teng Huang, Qian Wu, Lanchun Huang, Desong Kong, and Hai Wang. 2024. "Influence of Hydrothermal Modification on Adsorptive Performance of Clay Minerals for Malachite Green" Molecules 29, no. 9: 1974. https://doi.org/10.3390/molecules29091974
APA StyleWang, E., Huang, T., Wu, Q., Huang, L., Kong, D., & Wang, H. (2024). Influence of Hydrothermal Modification on Adsorptive Performance of Clay Minerals for Malachite Green. Molecules, 29(9), 1974. https://doi.org/10.3390/molecules29091974