Article

Channel Expansion in the Ligand-Binding Domain of the Glucocorticoid Receptor Contributes to the Activity of Highly Potent Glucocorticoid Analogues

by
Wesley B. Seaton
1,
Susan J. Burke
2,
Alexander R. Fisch
1,†,
William A. Schilletter
1,
Mary Grace A. Beck
2,
Gabrielle A. Cassagne
2,
Innocence Harvey
2,
Molly S. Fontenot
2,
J. Jason Collier
2 and
Shawn R. Campagna
1,*
1
Department of Chemistry, University of Tennessee, Knoxville, TN 37996, USA
2
Pennington Biomedical Research Center, Baton Rouge, LA 70808, USA
*
Author to whom correspondence should be addressed.
Current address: Biosciences Division, Oak Ridge National Laboratory, Oak Ridge, TN 37831, USA.
Molecules 2024, 29(7), 1546; https://doi.org/10.3390/molecules29071546
Submission received: 15 March 2024 / Revised: 27 March 2024 / Accepted: 27 March 2024 / Published: 29 March 2024

Abstract

:
Glucocorticoids (GCs) act through the glucocorticoid receptor (GR) and are commonly used as anti-inflammatory and immunosuppressant medications. Chronic GC use has been linked with unwanted complications such as steroid-induced diabetes mellitus (SIDM), although the mechanisms for these effects are not completely understood. Modification of six GC parent molecules with 2-mercaptobenzothiazole resulted in consistently less promoter activity in transcriptional activation assays using a 3xGRE reporter construct while constantly reducing inflammatory pathway activity. The most selective candidate, DX1, demonstrated a significant reduction (87%) in transactivation compared to commercially available dexamethasone. DX1 also maintained 90% of the anti-inflammatory potential of dexamethasone while simultaneously displaying a reduced toxicity profile. Additionally, two novel and highly potent compounds, DX4 and PN4, were developed and shown to elicit similar mRNA expression at attomolar concentrations that dexamethasone exhibits at nanomolar dosages. To further explain these results, Molecular Dynamic (MD) simulations were performed to examine structural changes in the ligand-binding domain of the glucocorticoid receptor in response to docking with the top ligands. Differing interactions with the transcriptional activation function 2 (AF-2) region of the GR may be responsible for lower transactivation capacity in DX1. DX4 and PN4 lose contact with Arg611 due to a key interaction changing from a stronger hydrophilic to a weaker hydrophobic one, which leads to the formation of an unoccupied channel at the location of the deacylcortivazol (DAC)-expanded binding pocket. These findings provide insights into the structure–function relationships important for regulating anti-inflammatory activity, which has implications for clinical utility.

1. Introduction

Glucocorticoids (GCs) are a class of anti-inflammatory and immunosuppressive steroid ligands that reduce or attenuate the immune response and are thus used to treat various diseases of inflammation [1]. Physiologically, these ligands are synthesized and released from the adrenal cortex and function by binding to the glucocorticoid receptor (GR; NR3C1) [2,3]. Commonly prescribed GCs, such as dexamethasone (DX) and hydrocortisone (HC), are used pharmacologically in clinical settings despite their risk to induce cardiovascular diseases, obesity, osteoporosis, and diabetes when used long term [4]. Chronic GC use can lead to steroid-induced diabetes mellitus (SIDM), and therefore discovery of a GC capable of reducing these side effects is highly desired [4].
Around 1.2% of the US population use GCs for approximately 1600 days [5]. This clinically prescribed chronic steroid use enhances the risk of developing SIDM. For example, 40% of prednisolone-treated renal transplant patients develop post-transplant diabetes mellitus (PTDM) [6]. Possible mechanisms for diabetes onset include GCs enhancing the gluconeogenesis pathway in the liver, which increases the synthesis of glucose [7]. Additionally, excess GC promotes insulin resistance in liver, white adipose tissue, and skeletal muscle. Attenuating immunosuppression by limiting GC administration has proven difficult due to an increased risk of graft rejection, and thus, GC therapy continues to be one of the best options for transplant patients [8].
The activated GR–GC complex has two main modes of action after translocating to the nucleus. First, GR homodimers that form following ligand binding selectively associate with glucocorticoid-responsive genomic elements (GREs) in the nucleus and regulate gene transcription through transactivation (TA) [9]. Furthermore, TA also induces genes that code for phosphoenolpyruvate carboxykinase (PCK1), which helps maintain glucose homeostasis via gluconeogenesis [7]. The second mode, thought to be responsible for part of the anti-inflammatory activity of GCs, is termed transrepression (TR) and results from the interaction of the monomer ligand-bound GR complex with transcription factors (TFs) that normally respond to inflammatory cytokines such as IL-1β [10]. TR can lead to direct anti-inflammatory activity. However, this paradigm is more nuanced as TA of genes such as Dusp1/Mkp1, Rgs2, and Tsc22d3 have positive therapeutic impact-inducing broncho protection and decreased CCL2 expression, respectively [11,12,13].
Despite the structural diversity of commercially available GCs, none are presently capable of dissociating the two modes of transcription. However, a significant effort has been made with the aim of developing such a selective glucocorticoid receptor modulator (SGRM). For example, substitution of the C-21 hydroxyl group on HC with 2-mercaptobenzothiazole (MBT) has been shown to reduce impact on islet β-cell insulin secretion while maintaining anti-inflammatory activity [14]. Such thiazole moieties are known to exhibit unique medicinal properties as they contain both electron-accepting and -donating groups [15]. Interestingly, further modification of this compound through esterification of C-17 with 2-furoyl chloride decreased selectivity due to enhanced TA. This result was expected as furoate ester has proven to dramatically increase potency of several GCs used in treating asthma such as fluticasone furoate (FF), mometasone furoate (MF), and drug candidates such as VSGC12 [16]. Specifically, VSGC12 induced TR activity at one-fourth the concentration of FF while reducing insulin resistance. Accessing this “dosage window”, wherein concentrations are low enough to induce TR but not TA, is a unique approach to selectively modulate the GR. Thus, a specific combination of these functional groups has the potential to produce a powerful SGRM.
Herein, a total of 24 compounds were synthesized by derivatizing seven common GC scaffolds currently prescribed for human inflammatory conditions (Figure 1A). To understand how these structural modifications altered activity, a series of biological assays were performed to evaluate promoter activity, gene expression, and cellular toxicity. Molecular dynamic (MD) simulations and subsequent computational analyses were performed on the top structures to understand their structure–activity relationships (SARs) within the GR ligand-binding domain. Importantly, a highly selective GC, DX1, demonstrated a significant reduction (87%) in TA compared to commercially available DX while maintaining TR capacity. Furthermore, two novel, highly potent GCs, DX4 and PN4, elicited GR activity in the attomolar range similar to that of their parent scaffolds, DX and PN, at the nanomolar and micromolar ranges, respectively. Possible explanations for their altered activity were provided by molecular docking and dynamic simulations. Collectively, these compounds and their unique modes of action could prove useful in understanding how to improve GC-based therapies.

2. Results

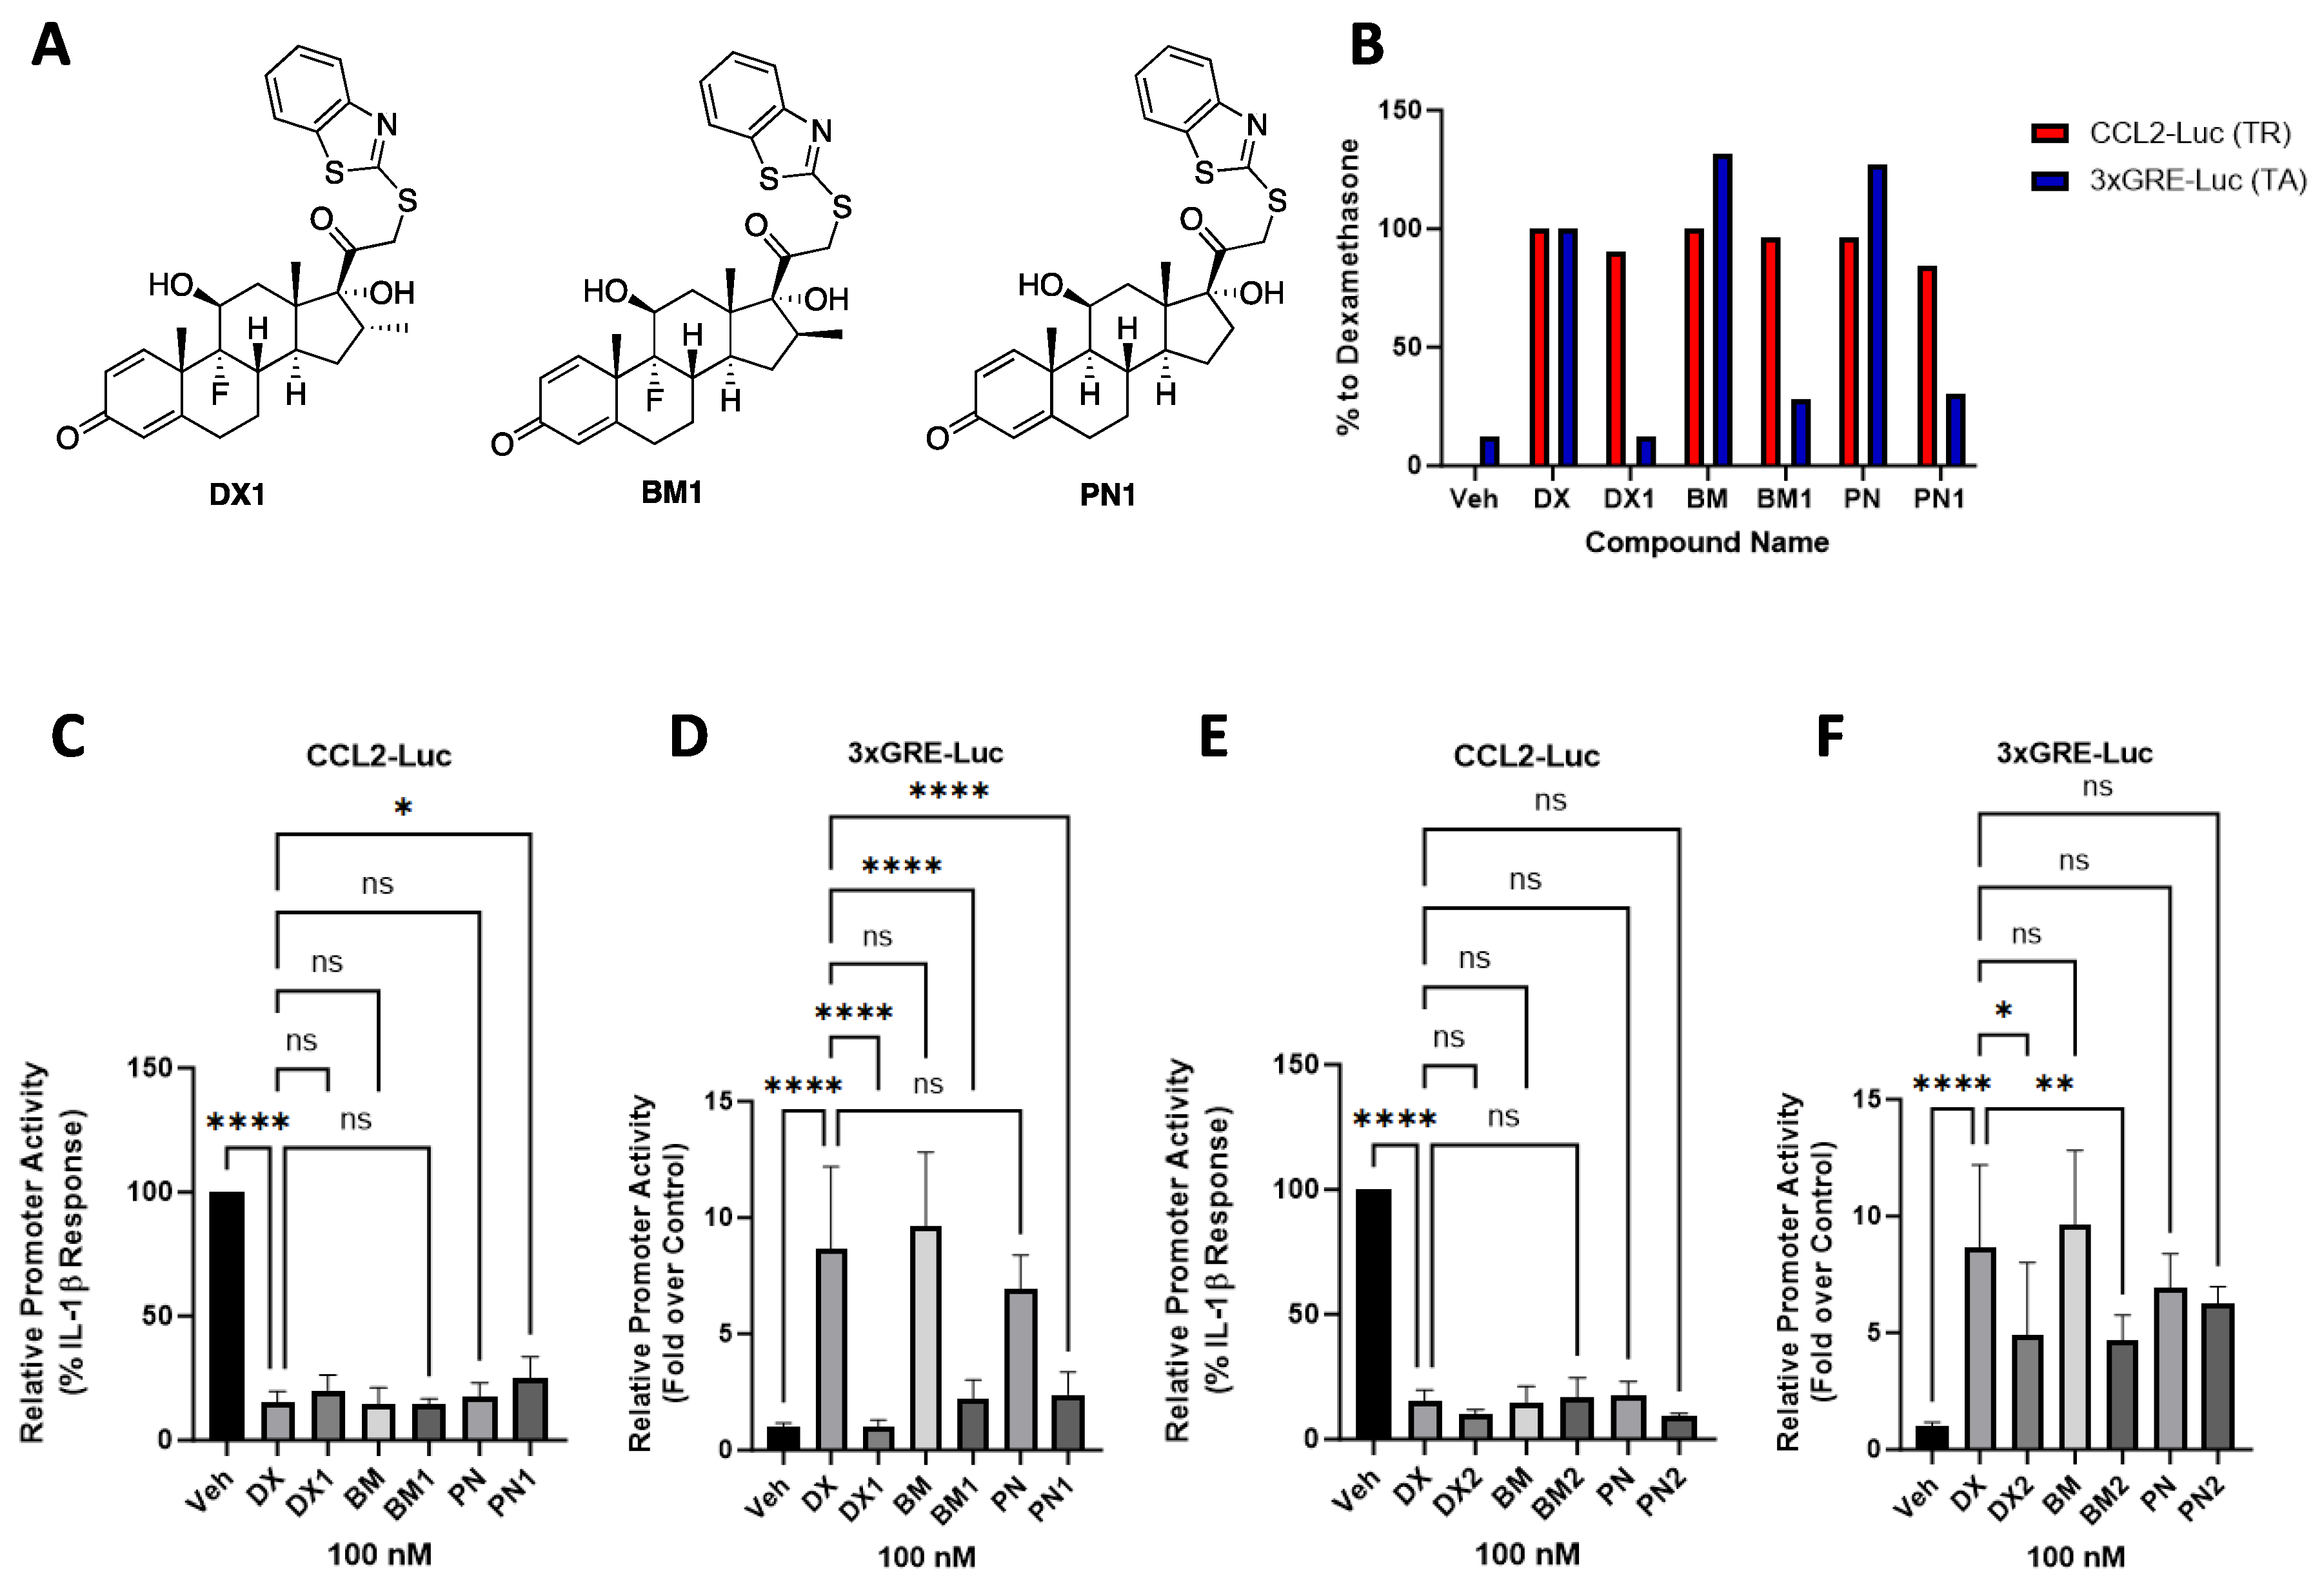
2.1. Series 1 GC Analogues Selectively Repress Ccl2 Promoter Activity without Inducing Transactivation

A promoter–luciferase construct containing three copies of the glucocorticoid-response element (3xGRE-Luc) was transfected into 832/13 rat insulinoma cells to assess TA of each compound. Concurrently, the ability of all compounds to repress IL-1β-mediated activation of a promoter–luciferase construct containing 3.6 kb of the CCL2 promoter (CCL2-Luc), was investigated to determine the TR capability of each compound. pIC50 and pEC50 values were calculated for all compounds that exhibited a dose-dependent response (Table 1). The most selective compound, DX1, showed only 13% transcriptional activity of the 3xGRE-Luc when compared with DX while maintaining 90% of its TR activity (Table 1). However, furoylation to DX2 restored 50% TA response in 3xGRE-Luc when compared to DX. Repression of IL-1β-induced CCL2 promoter activity by DX2 was virtually unchanged when compared with DX1. Diminished TA of the 3xGRE-Luc and greater discrimination between TR and TA was noted across all steroid scaffolds in series 1 (Figure 2B). For example, at 100 nM, BM and BM1 reduced IL-1β response by 88.7% and 85.7%, respectively (Figure 2C), while only BM1 selectively reduced 3xGRE activation by 4.6-fold when compared with BM (Figure 2D). PN1 displayed similar selectivity but did lose overall potency in the CCL2-Luc assay with only a 75% response at 100 nM (Figure 2C,D). Furoylation reinstated TA potential across all series 2 compounds, giving them similar activity to their parent steroidal compounds (Figure 2E,F).

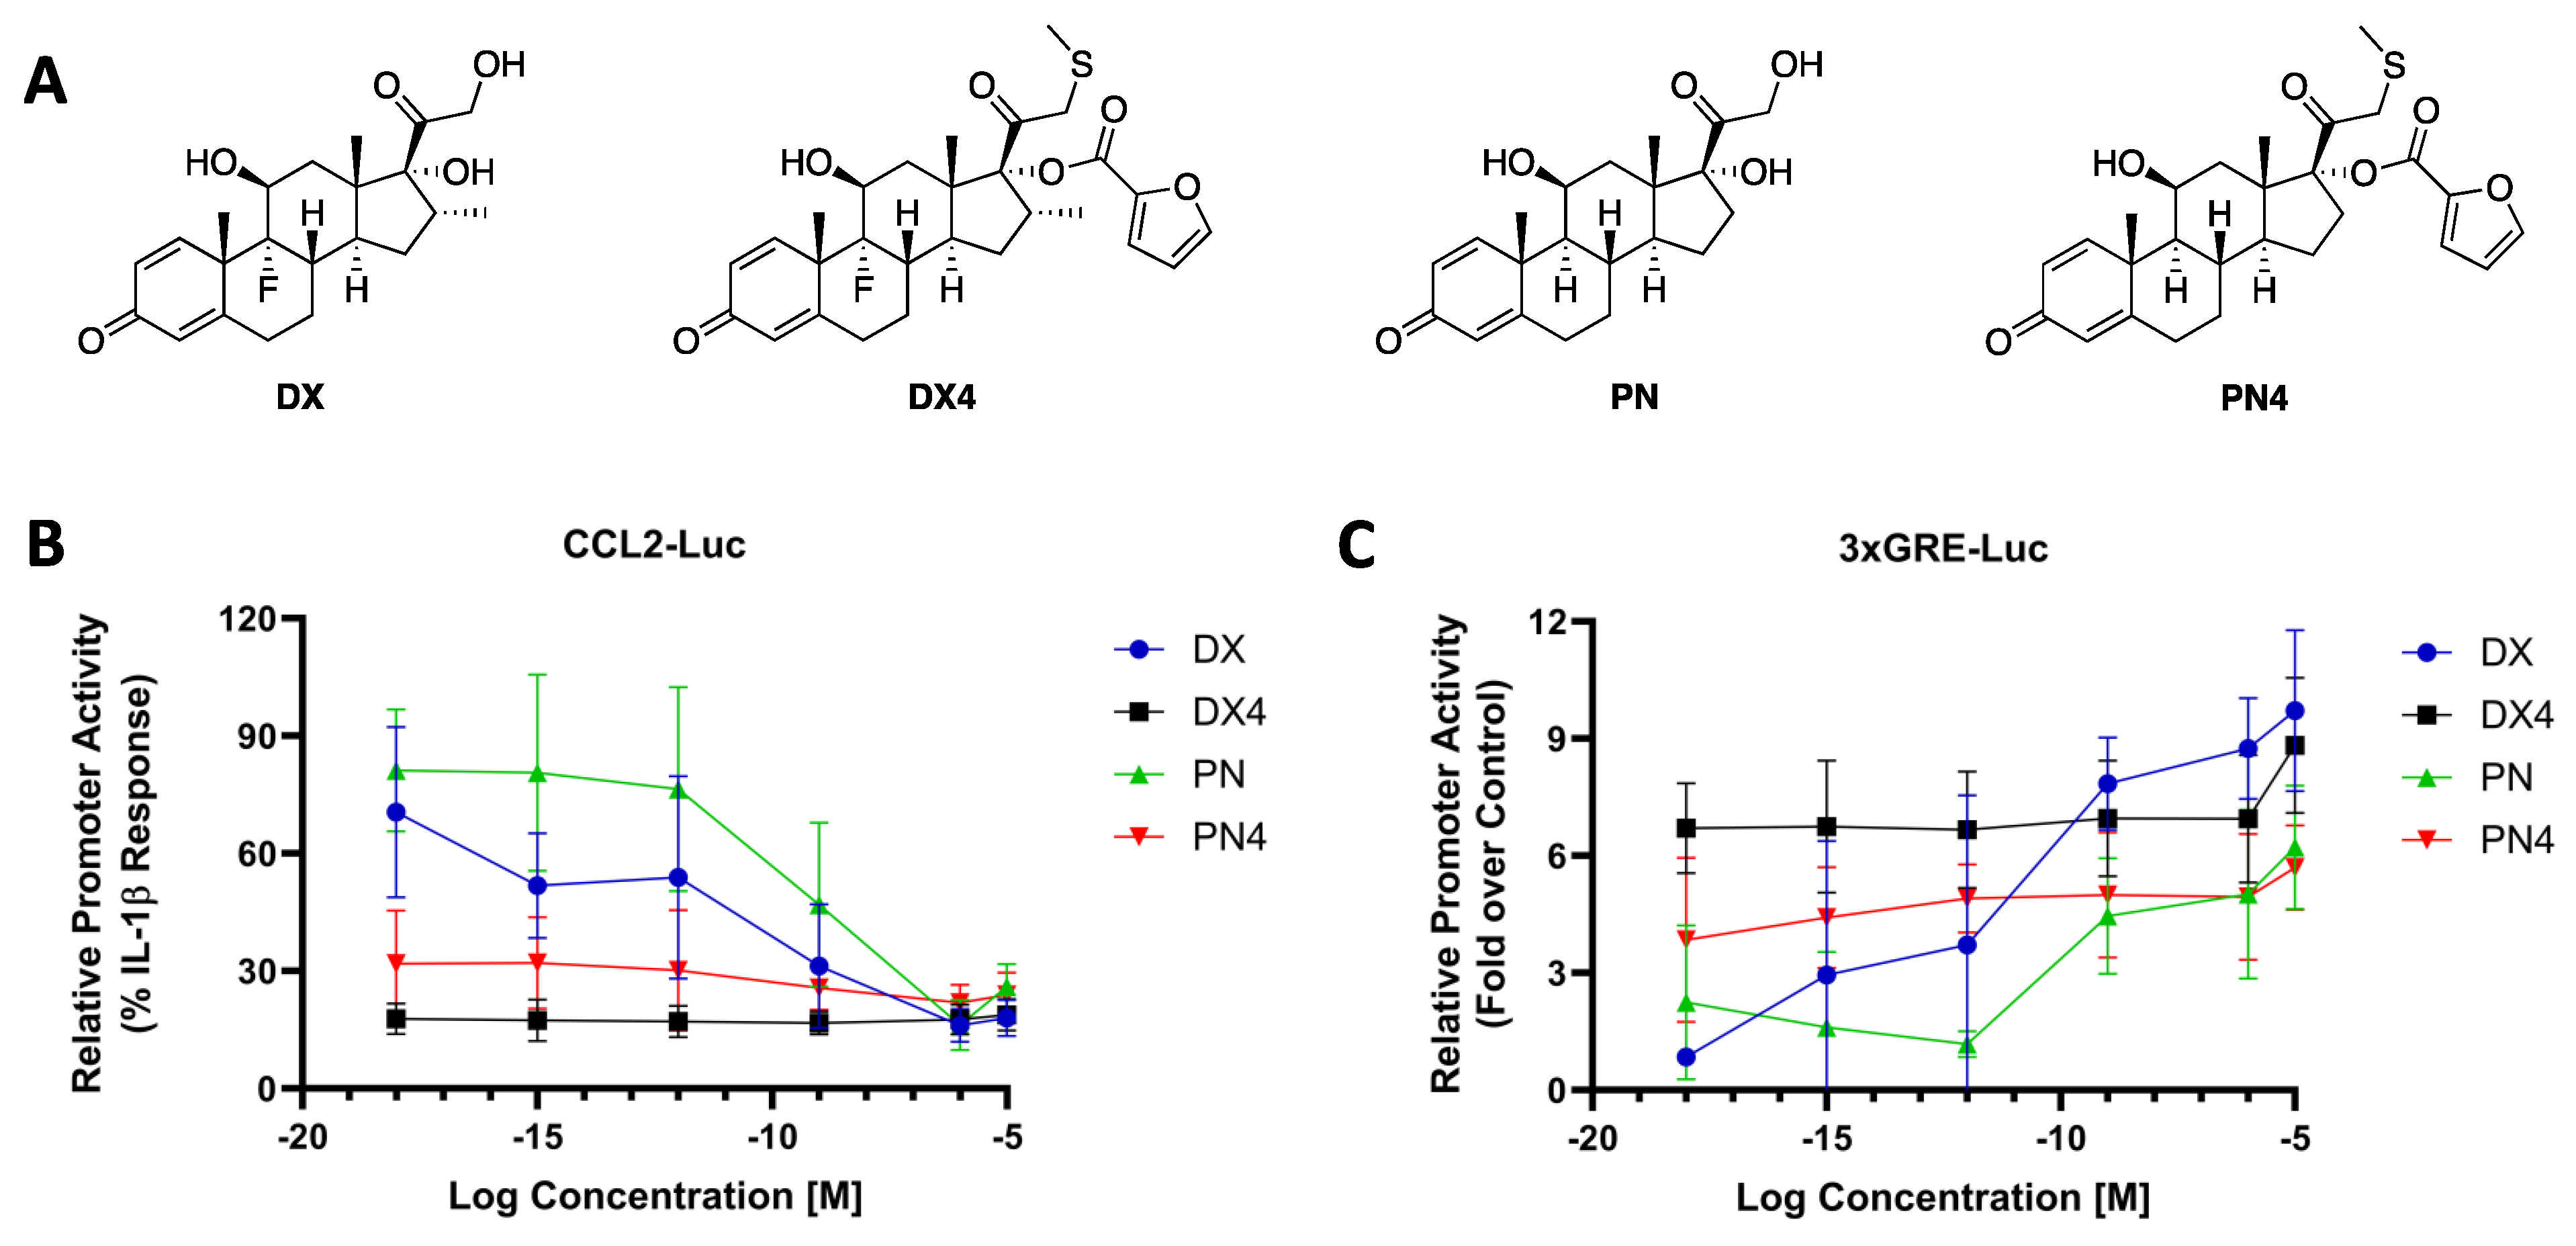
2.2. DX4 and PN4 Display Attomolar Potency versus Nanomolar Potency for Parent Scaffolds

The addition of an SMe group to the parent steroids instead of MBT led to analogues in series 3. These served to illuminate the isolating effects sulfur has on potency in the absence of benzothiazole. Furthermore, the addition of this smaller, less nucleophilic group at C-21 allowed for further investigation into the properties of the furoyl group in series 4. All SMe analogues in series 3 demonstrated a moderate decrease in anti-inflammatory potential when compared with their parent molecules, and the impact on TA potential was negligible in most cases (Table 1). For example, DX3 induced only 84% suppression of the CCL2-Luc when compared with DX while maintaining 94% of its TA activity in 3xGRE-Luc. Trends between series 3 and 4 were not as consistent as anticipated based on the activity of compounds from series 1 and 2. Some compounds were more active in both luciferase assays, with DX4 and PN4 both inducing more TR and TA when compared with DX3 and PN3, respectively. Specific compounds showed an increase in anti-inflammatory activity and decrease in potential side effects upon furoylation of the SMe derivate. For example, at 0.1 nM, the CCL2-Luc assays of PN4 and DX4 showed a 74% and 81% anti-inflammatory response, respectively, along with a lowering of the pIC50 to greater than 10. For comparison, at the same concentration, PN and DX elicited only 13% and 45% response with pIC50 values of 8.4 and 8.3, respectively (Table 1). Additionally, PN4 displayed reduced activation with an Emax of 5.4 in the 3xGRE-Luc assay compared to PN with an Emax of 10 (Table 1).
Intrigued by these results, DX4 and PN4 were further diluted to 10−18 M (1 aM) and tested in both CCL2 and 3xGRE luciferase assays and compared with their parent compounds, DX and PN (Figure 3A). DX and PN induced little to no significant reduction in CCL2 promoter activity at 1 aM with 29% and 19% anti-inflammatory activity, respectively (Figure 3B). By contrast, DX4 and PN4 maintained consistently high TR capabilities, demonstrating an 82% and 68% reduction at the same concentration, respectively. Furthermore, DX4 and PN4 displayed high potency as they prompted a 6.7- and 3.8-fold increase in the 3xGRE assay at 1 aM (Figure 3C). Interestingly, DX4 and PN4 did not exhibit a typical dose-dependent response. When plotting TR and TA promoter activity over the concentrations tested, DX and PN exhibited a gradual increase in activity that was dependent on the concentration, while DX4 and PN4 displayed less dependence on concentration.

2.3. DX1 and DX4 Exhibit Reduced Toxicity When Compared with DX

GCs can promote cellular toxicity in pancreatic β-cells [17]. To determine the impact on cellular viability during exposure to these compounds, ADK release and MTS reduction were measured as previously described [18]. Release of ADK was measured to determine losses in cellular membrane integrity, and MTS reduction measures cellular respiration activity, which could be taken as an index of proliferation, viability, or both. At 100 nM, nearly all modified GCs displayed a reduced toxicity profile in both assays. For example, DX generated a 1.6-fold increase in ADK release, while DX1, DX2, and DX4 produced a 1.25, 1.31, and 1.38 increase, respectively, indicating decreased cytotoxicity compared to DX (Figure 4A). Further, DX promoted a 37% reduction in the MTS assay, DX1, DX2, and DX4 induced only a 7%, 19%, and 19% reduction, respectively (Figure 4B). No ADK release was detected for BM4 when compared with the control vehicle DMSO; note that this is a 60.7% improvement over BM toxicity. BM2 outperformed BM4 in the MTS assay with only 20.3% reduction against BM4′s 27.6% reduction (Figure 4B). Only HC4 and FM3 showed potential impacts on viability comparable to the parent scaffolds, and these molecules elicited MTS reduction responses within 2.9% and 8.7% of those measured for the unmodified steroids, respectively (Table S4). Finally, PN induced the greatest change of all steroids with a 1.72-fold increase in ADK release and 25.4% MTS reduction. In contrast, the addition of MBT to the PN structure (PN1) reduced ADK release to 1.25-fold and only decreased MTS reduction by 8.3%.

2.4. Sgk1 and Rgs2 Gene Expression Induced at Low Concentrations in Response to DX4 and PN4, but Decreased upon MBT Addition

To determine GC impact on GR target genes, relative mRNA levels of Sgk1 and Rgs2 were measured. Upregulation of serum- and glucocorticoid-inducible kinase-1 (Sgk1) has been linked to GC-mediated impairment of insulin secretion [19]. At 100 nM concentrations, the expression of Sgk1 is strongly activated by DX in 832/13 cells (7.9-fold). By contrast, DX1 and DX2 demonstrated no significant induction of Sgk1-relative mRNA abundance relative to vehicle control (Figure 5A). The largest activity change between any analogues and their parent molecule was observed for BM and BM1 with Sgk1 mRNA abundance in BM increased by 8-fold and with no induction of Sgk1 mRNA abundance observed in response to treatment with BM1 (Table S7A). The regulator of G-protein signaling 2 (Rgs2) gene encodes the Rgs2 protein, and its increased abundance is linked with cardiac hypertrophy [11]. At a concentration of 100 nM, the relative mRNA abundance of Rgs2 in response to DX1 treatment was 2.2% that of DX (Figure 5B), and DX2 prompted 4.3% of the response seen with DX. Of note, the most dissociated compound in this assay was PN1, demonstrating no significant induction of Sgk1 mRNA abundance and only 1.9% of the activity when compared with PN increases in Rgs2 transcript levels (Figure 5C,D).
DX, DX4, PN, and PN4 were diluted to 10−18 M and tested for their capacity to induce transcription of Sgk1 and Rgs2. At 1 aM concentrations, DX4 and PN4 induced Sgk1 mRNA abundance by 3.7- and 3.4-fold, respectively (Figure 5E). Significantly, Rgs2 mRNA abundance was 6.6-fold greater for DX4 than for DX at 1 aM and nearly 75-fold greater for PN4 than PN (Figure 5F). Clear dose-dependent responses can once again be observed in both TA assays for DX and PN, while DX4 and PN4 gene expression profiles stay relatively constant at all concentrations tested.

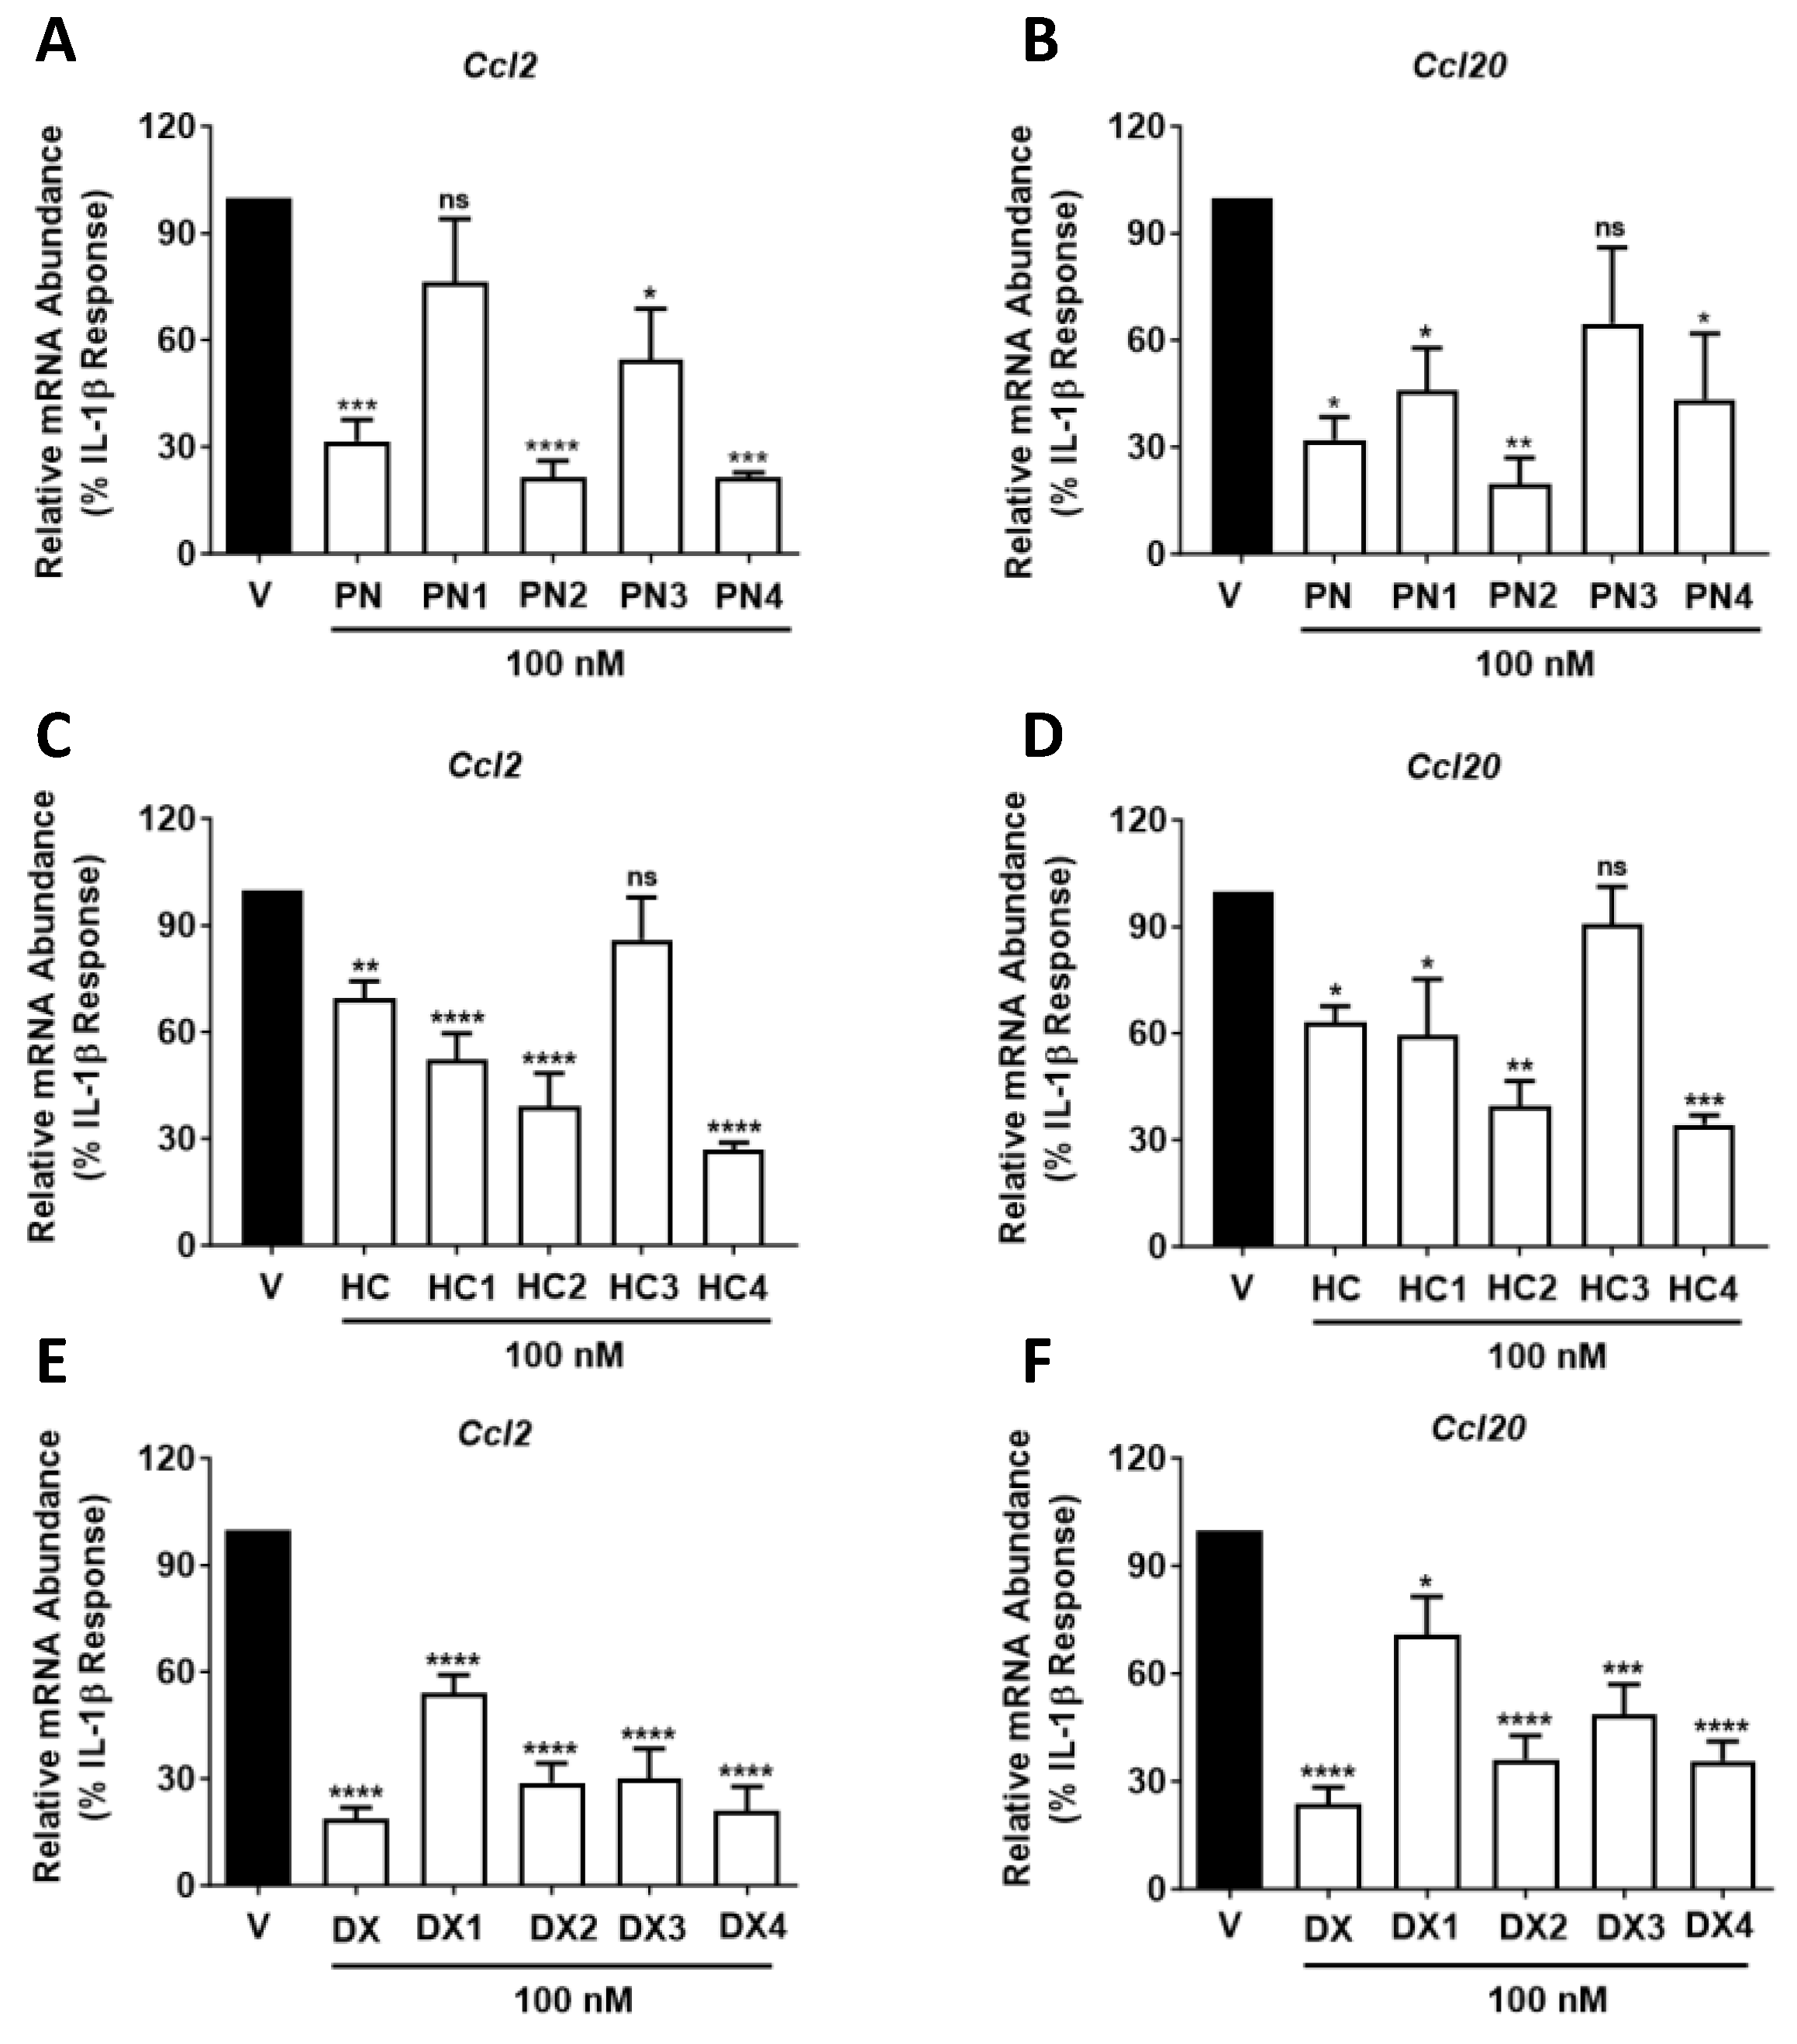
2.5. All GC Analogues, Except HC3, Reduce Ccl2 or Ccl20 Transcript and Protein Abundance

Ccl2 and Ccl20 are both chemokines responsible for recruiting immune cells to sites of inflammation [13,20,21]. The ability of each derivatized compound to repress cytokine-induced expression of the Ccl2 and Ccl20 genes was therefore evaluated. The IL-1β-mediated increase in Ccl2 mRNA was diminished by all compounds except HC3 and PN1 at 100 nM, with PN2 having the largest impact with an 87% decrease compared to vehicle control (Figure 6A). In addition to PN2, HC4 was the only compound to display increased anti-inflammatory activity compared to its parent molecule at this concentration, with a 73% reduction in Ccl2 expression compared with the 31% decrease observed in response to HC (Figure 6C). DX4 and PN4 each decreased Ccl2 mRNA at 100 nM by 79% (Figure 6E), while HC3 was the least effective compound, reducing Ccl2 mRNA by only 14%. Furthermore, the effects of all compounds on Ccl20 transcript levels were also assessed. The chemokine Ccl20 is of particular interest due to its known upregulation in non-obese diabetic mice (NOD) [22], a T1D model, and db/db mice, a T2D model [18,20]. PN2, HC4, and BM2 all displayed stronger anti-inflammatory activity than their parent molecules by suppressing Ccl20 mRNA abundance by 81%, 66%, and 79%, respectively, at 100 nM concentrations (Figure 6B,D). By contrast, PN, HC, and BM only suppressed Ccl20 mRNA abundance at the same concentration by 68%, 63%, and 21%, respectively. No analogues of DX outperformed their parent compounds (Figure 6F), and, once again, HC3 displayed significantly reduced potency with only a 9% decrease in Ccl20 mRNA levels compared to the vehicle control (Figure 6D).

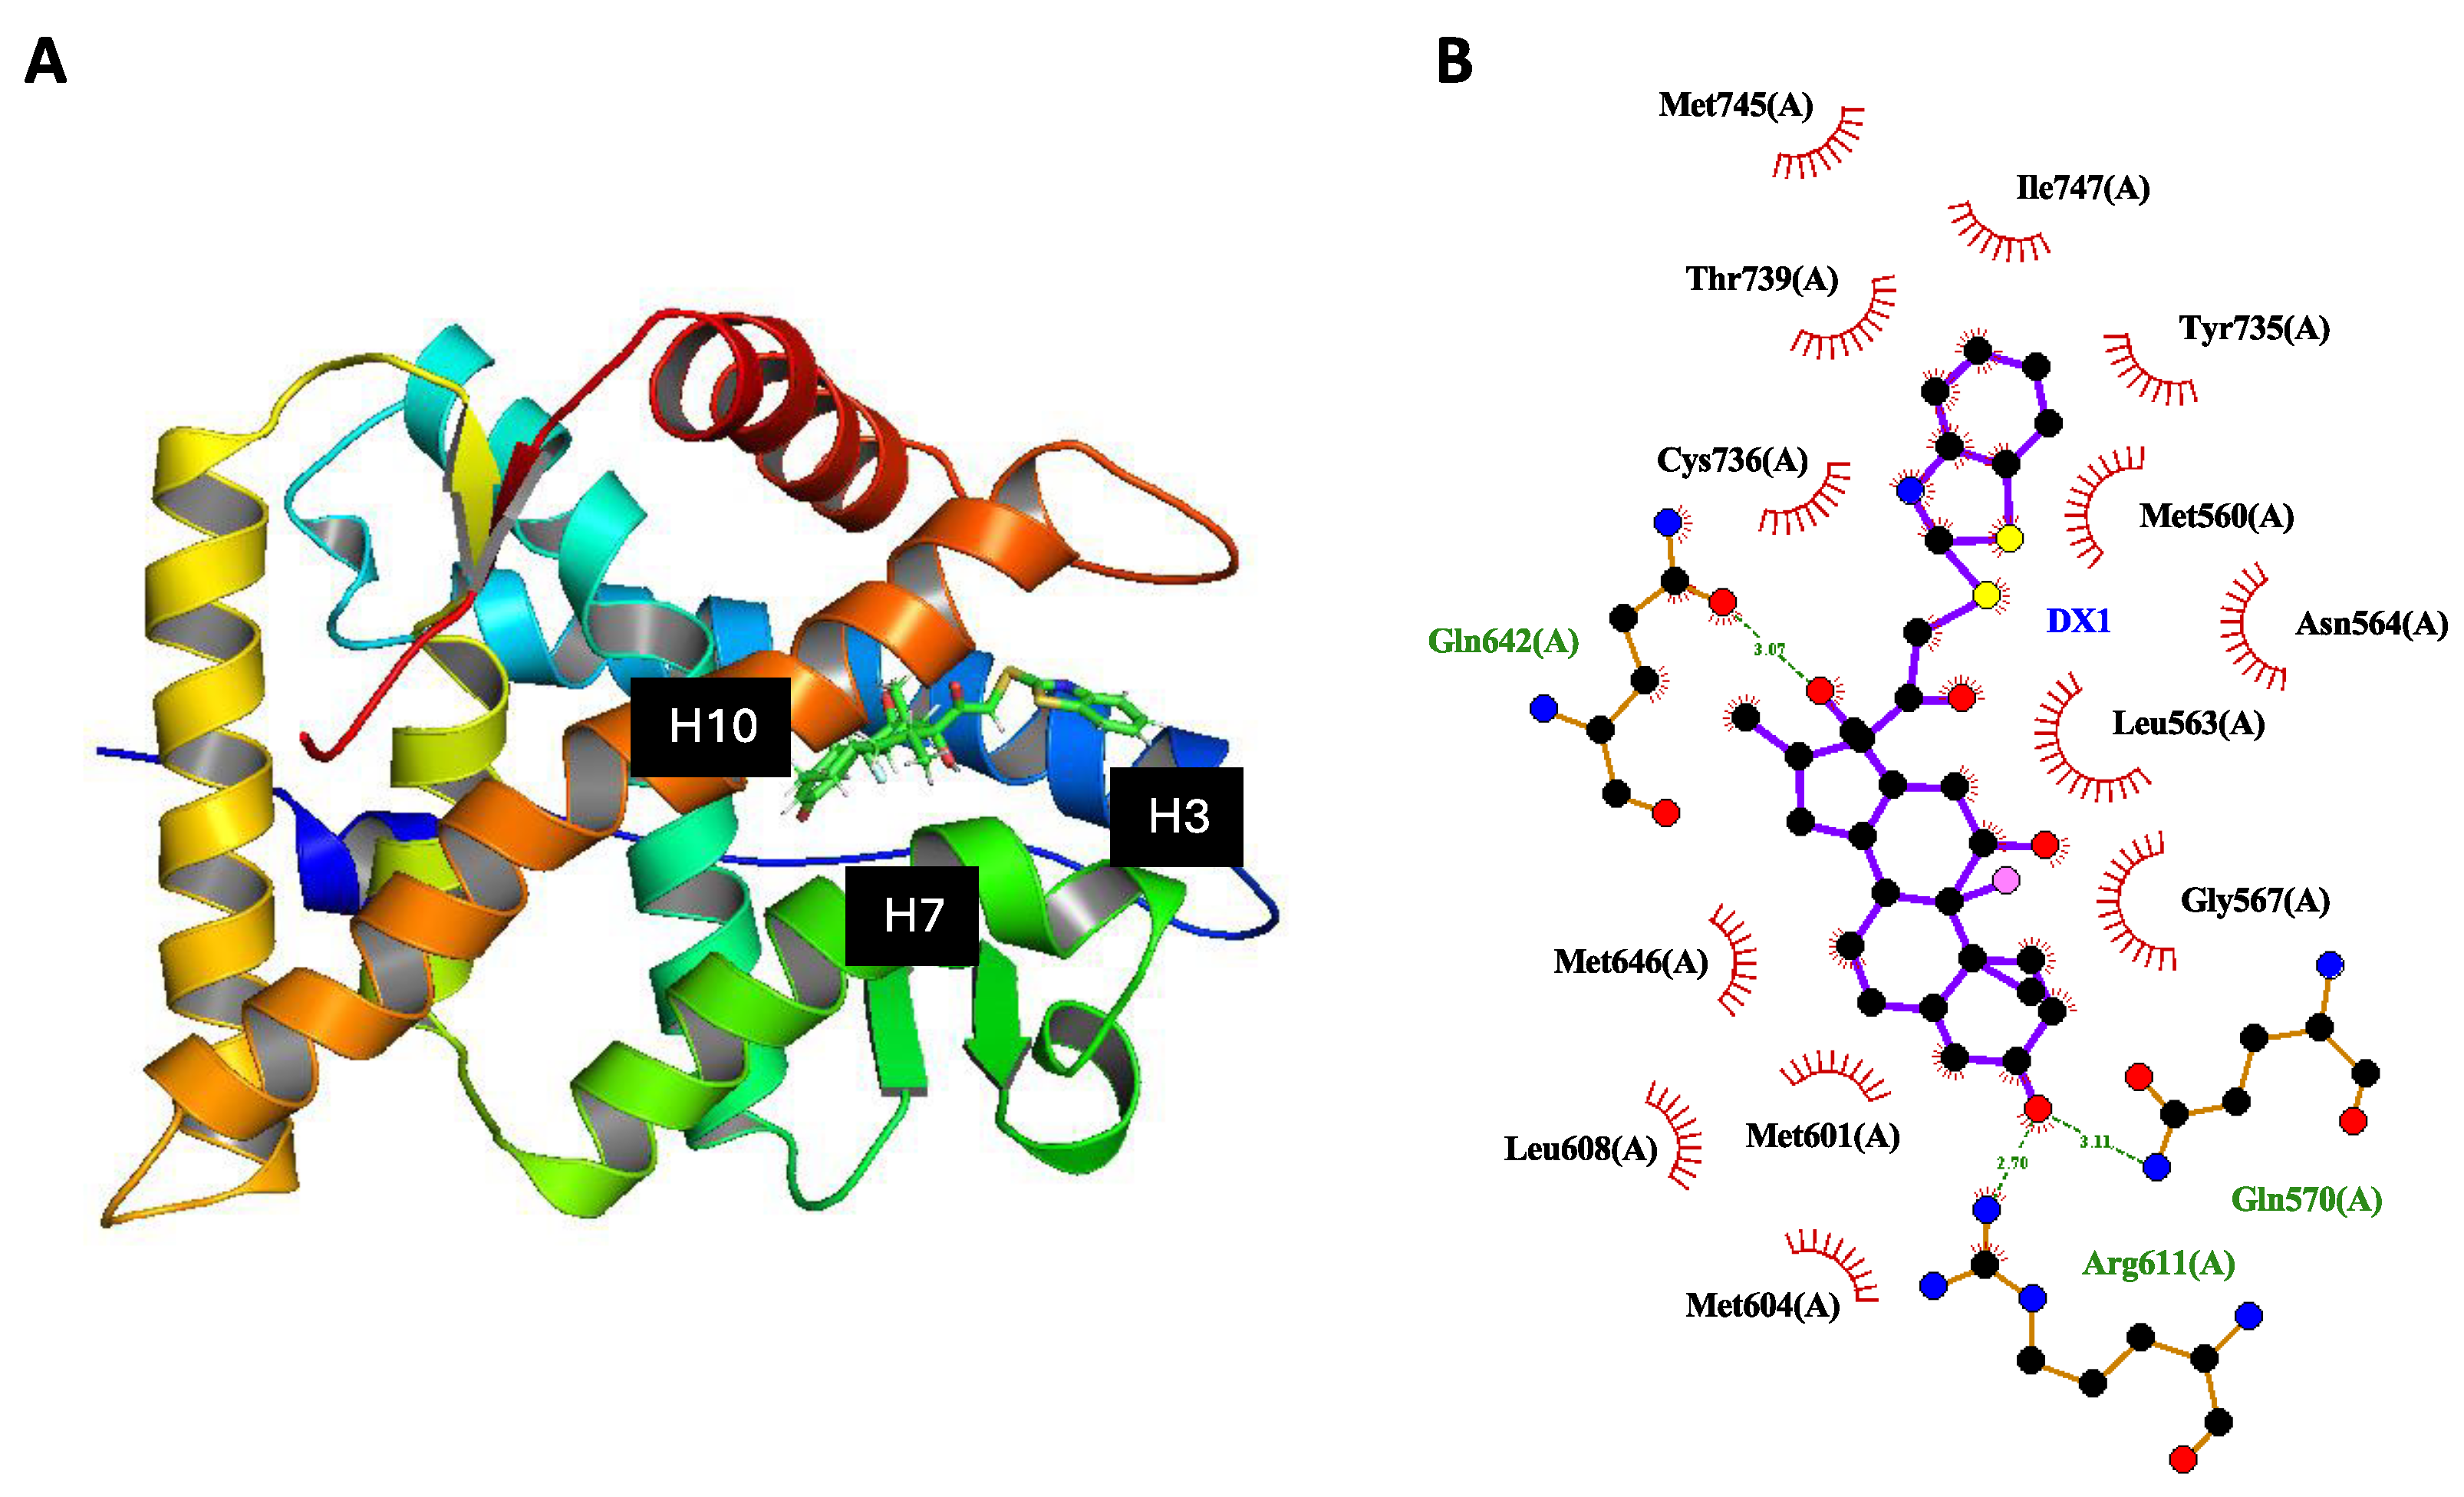
2.6. Weakened Interaction between DX1 and AF-2 Domain of GR

In total, DX1 displayed 13 hydrophobic and 3 polar interactions. The MBT moiety of DX1 extended into a region between helix 3 (H3), helix 7 (H7), and helix 10 (H10) of the LBD which is not occupied by DX (Figure 7A). Despite entering this new space, many of the interactions previously reported for crystal structures of DX were retained by DX1 [23,24]. Indeed, when comparing the amino acid interactions of DX1 with DX (PDB ID: 4udc), 13 out of 16 total interactions were identical (Figure 7B). Interestingly, DX1 displayed 3 additional hydrophobic interactions with Met745, Met646, and Leu608. Furthermore, residues of H3, helix 4 (H4), and helix 12 (H12) of the LBD together form a mostly hydrophobic area termed the ligand-dependent transcriptional activation function 2 (AF-2), which has been associated with conformational changes in the GR [25]. Within H3, Asn564 stabilizes the AF-2 domain [26,27]. This interaction is weakened upon addition of MBT as it changes from polar to hydrophobic, which may contribute to the improved selectivity in DX1.

2.7. MBT Structure Selectively Modulates the GR

Because the present results did not fully explain the selective nature of DX1, the presence of the MBT moiety was further probed through the synthesis and biological evaluation of 4 additional dexamethasone analogues (Table 2). DX5DX8 were synthesized utilizing mercaptobenzimidazole (MBI), mercaptobenzoxazole (MBO), mercaptoimidazole (MI), and mercaptothiazole (MT) (Table 2). This slight modification proved to generate a wide range of activity in the 3xGRE-luciferase and CCL2-luciferase assays. To begin, DX5DX8 all displayed reduced anti-inflammatory activity when compared with DX and DX1. DX5 and DX6 exhibited little selectivity inducing TA with an Emax of 3.2 and 4.9, respectively. Interestingly, at lower concentrations, DX7 induced TA preferentially over TR with a pIC50 of 7.1 and pEC50 of 7.7. DX8 did display discrimination between modes of activity with 30% transcriptional activity of the 3xGRE-Luc when compared with DX. However, the overall potency of the compound dropped along with the loss of the benzene ring.

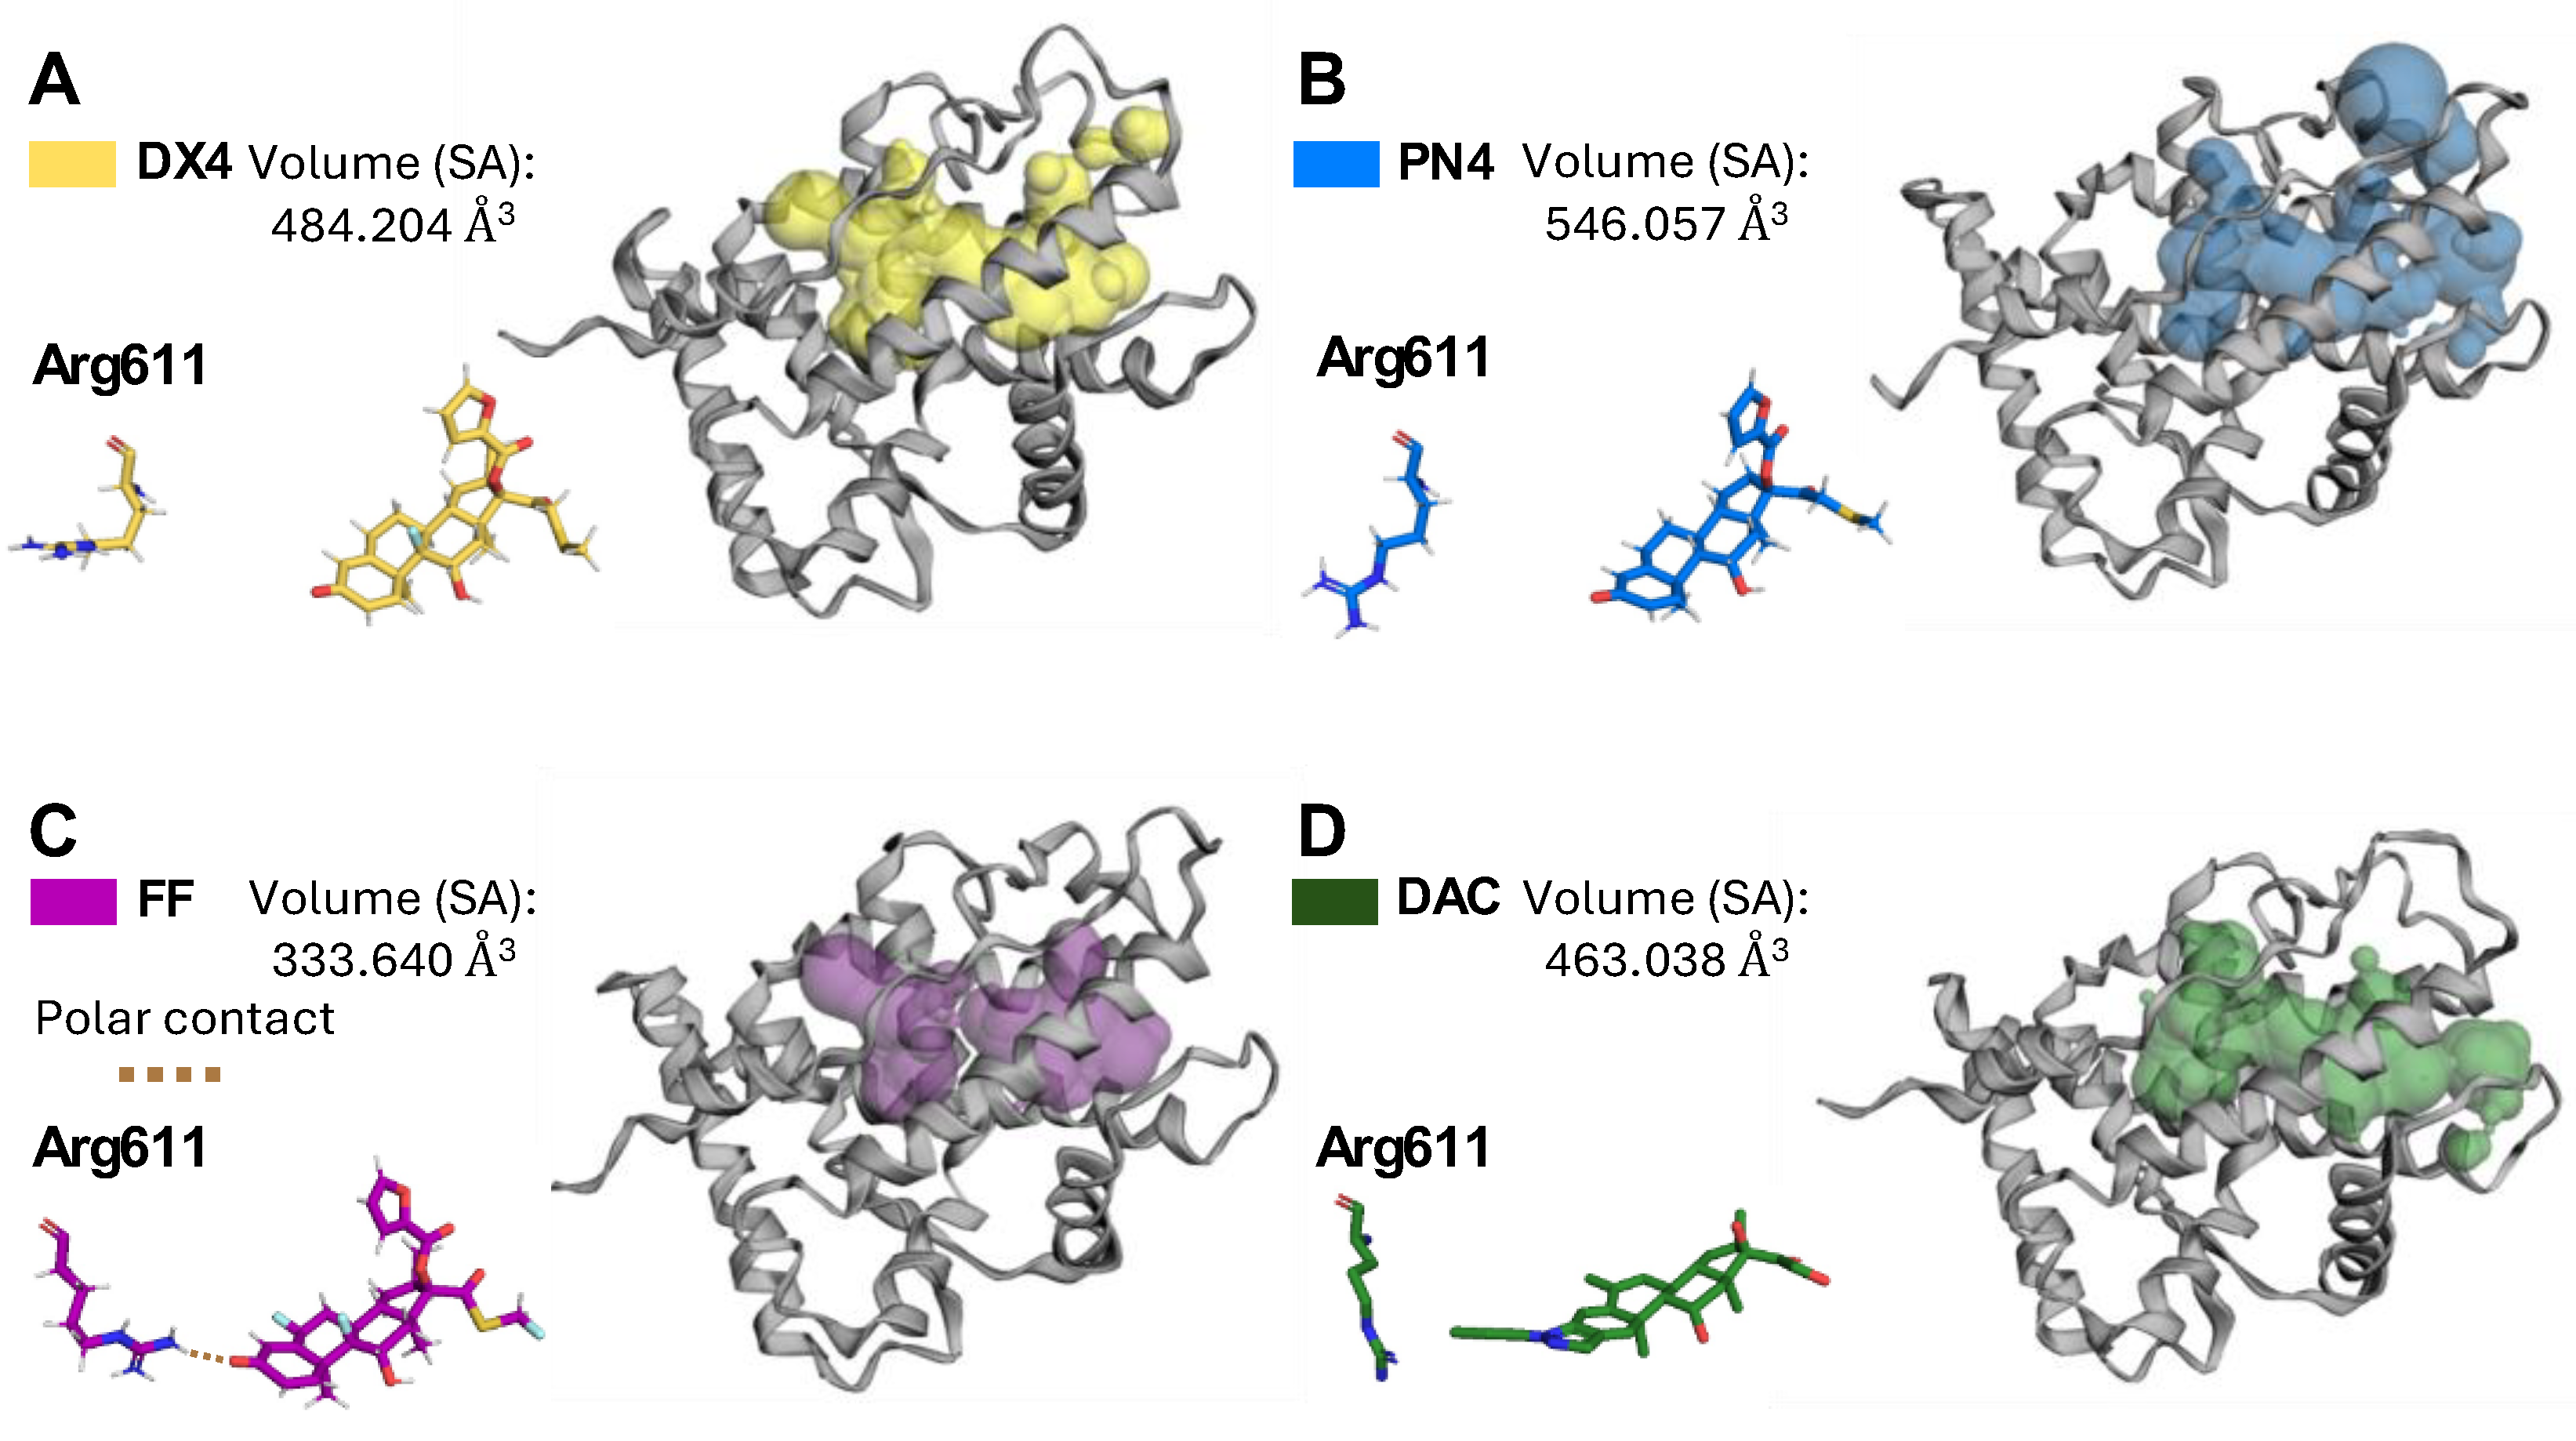
2.8. DX4 and PN4 Expand the Glucocorticoid Receptor Ligand-Binding Pocket

DX4 displayed a total of 13 interactions, all of which were hydrophobic (Supplementary Materials, Section S3). This resulted in a decrease in binding affinity from −12.2 to −10.2 kcal/mol (Table S9). PN4 displayed the exact same interactions but with three additional hydrophobic interactions. The furoyl group present in FF, DX4, and PN4 expanded the LBP and occupied the hydrophobic cavity, as previously described in the literature [16]. Furthermore, the interaction with Asn564 changed from hydrophobic to polar with PN4. Two of the most common polar interactions among GCs, the 3-keto group with Arg611 and Gln570, are absent for DX4 and PN4. Arg611 rotates away over time in response to DX4 and PN4, and the interaction never returns (Figure 8A,B). As a result, there is a continuous binding pocket channel formed in response to DX4 and PN4 that expands beyond what is typical for FF (Figure 8A–C). Indeed, FF’s calculated solvent-accessible (SA) pocket volume was ~334 Å3, while DX4 and PN4 expanded the pocket’s volume to ~484 Å3 and ~546 Å3, respectively. Increased potency associated with this type of binding pocket expansion along with loss of polar contact with Arg611 has been previously observed with agonist deacylcortivazol (DAC), which exhibited a calculated SA pocket volume of ~463 Å3 (Figure 8D) [28]. The results of these volume calculations are consistent with prior research, although the magnitudes of the pocket volumes are smaller. Differences can be rationalized due to the use of larger radius probes, different software, and lack of manual refinements to the protein structure. Calculated molecular and SA surface volumes for compounds are available in Table S10.

3. Discussion

Glucocorticoids represent a large class of lipophilic steroid molecules frequently used in clinical settings for their anti-inflammatory and immunosuppressive activity [29]. However, their prolonged use leads to a vast array of side effects due to their impact on glucose and lipid homeostasis [4]. A group of MBT-modified glucocorticoids were synthesized and evaluated for their ability to distinguish between TA and TR modes of action. This work reports data for analogues of seven commercially available steroids. All of the MBT compounds, DX1, BM1, PN1, FM1, BD1, and DN1, displayed greater signs of selectivity with reduced TA activity. The top-performing compound, DX1, maintained ~90% TR activity of DX with only ~13% of the TA activity while simultaneously displaying diminished toxicity in both the MTS and ADK assays.
BM1, PN1, FM1, BD1, and DN1 all showed similar, though less profound, distinctions between modes of activity when compared with their parent molecules. The addition of MBT to all parent scaffolds markedly increased their tolerability in both toxicity assays while decreasing their TA potential. Specifically, PN1 became the second most tolerable compound in the MTS assay and did not induce expression of the Sgk1 or Rgs2 genes. Whether a decrease in Rgs2 mRNA abundance may counteract the therapeutic effects associated with PN, such as improved broncho-protection [11], remains to be established. Additionally, the C-16 stereoisomer of DX1, BM1, displayed 96% of the TR activity of DX with only ~28% TA, making it a potentially valuable alternative to DX1. Interestingly, further modification with a furoyl moiety on all the compounds with a C-17 hydroxyl resulted in decreased discrimination between TA and TR while increasing the TR activity in the CCL2-Luc assays of all compounds, except for BM2.
The combination of molecular docking and dynamics was used to obtain a more precise picture of ligand–protein interaction between DX1 and the GR. The MBT moiety expanded into an open region of the GR between H3, H7, and H10 not occupied by DX. Despite entering this new space, DX1 maintained many of the same amino acid interactions as DX. However, 2D analysis revealed that DX1 displayed a hydrophobic interaction with a key amino acid associated with the AF-2 domain, Asn564, while DX displays a stronger polar interaction. The weakening of this contact may lower the TA capacity of DX1 and be partly responsible for changing the ligand activity profile. Further, by synthesizing new analogues and selectively exchanging the various heteroatoms of MBT, as well as removing the benzene ring, we were able to determine that the sulfur in the thiazole ring of DX1 may help alter modes of action (TA vs. TR) while the benzene ring contributes to its anti-inflammatory potential. However, these results would require further testing to prove definitively.
Despite the decrease in efficacy from series 1 to series 2, the addition of the furoyl moiety increased the efficacy of all compounds when added to series 3 analogues. Specifically, DX4 and PN4 displayed the most profound activity as they induced the expression of two separate genes, Sgk1 and Rgs2, at attomolar concentrations. To our knowledge, this is the first study to document the uniquely potent transcriptional potential of DX4 and PN4, which, in general, were able to induce the same activity as DX at one billion- and one millionfold lower concentrations, respectively. It is also the first to report a change in the channel formation of the GR LBP in the absence of a bulky group adjacent to the A ring. However, these new findings are supported by previous work that has shown that ligands, such as DAC, which expand the binding pocket, often show activity greater than endogenous steroidal hormones [28]. For DX4 and PN4, an open channel through the binding pocket near the A ring is observed. This channel, combined with the hydrophobic cavity occupied by the furoyl moiety, allows DX4 and PN4 to occupy a greater total volume than both DAC and FF. Thus, this enhanced agonist activity, combined with a newly proposed mode of action, makes these results potentially useful in developing and designing better GR agonists.

4. Materials and Methods
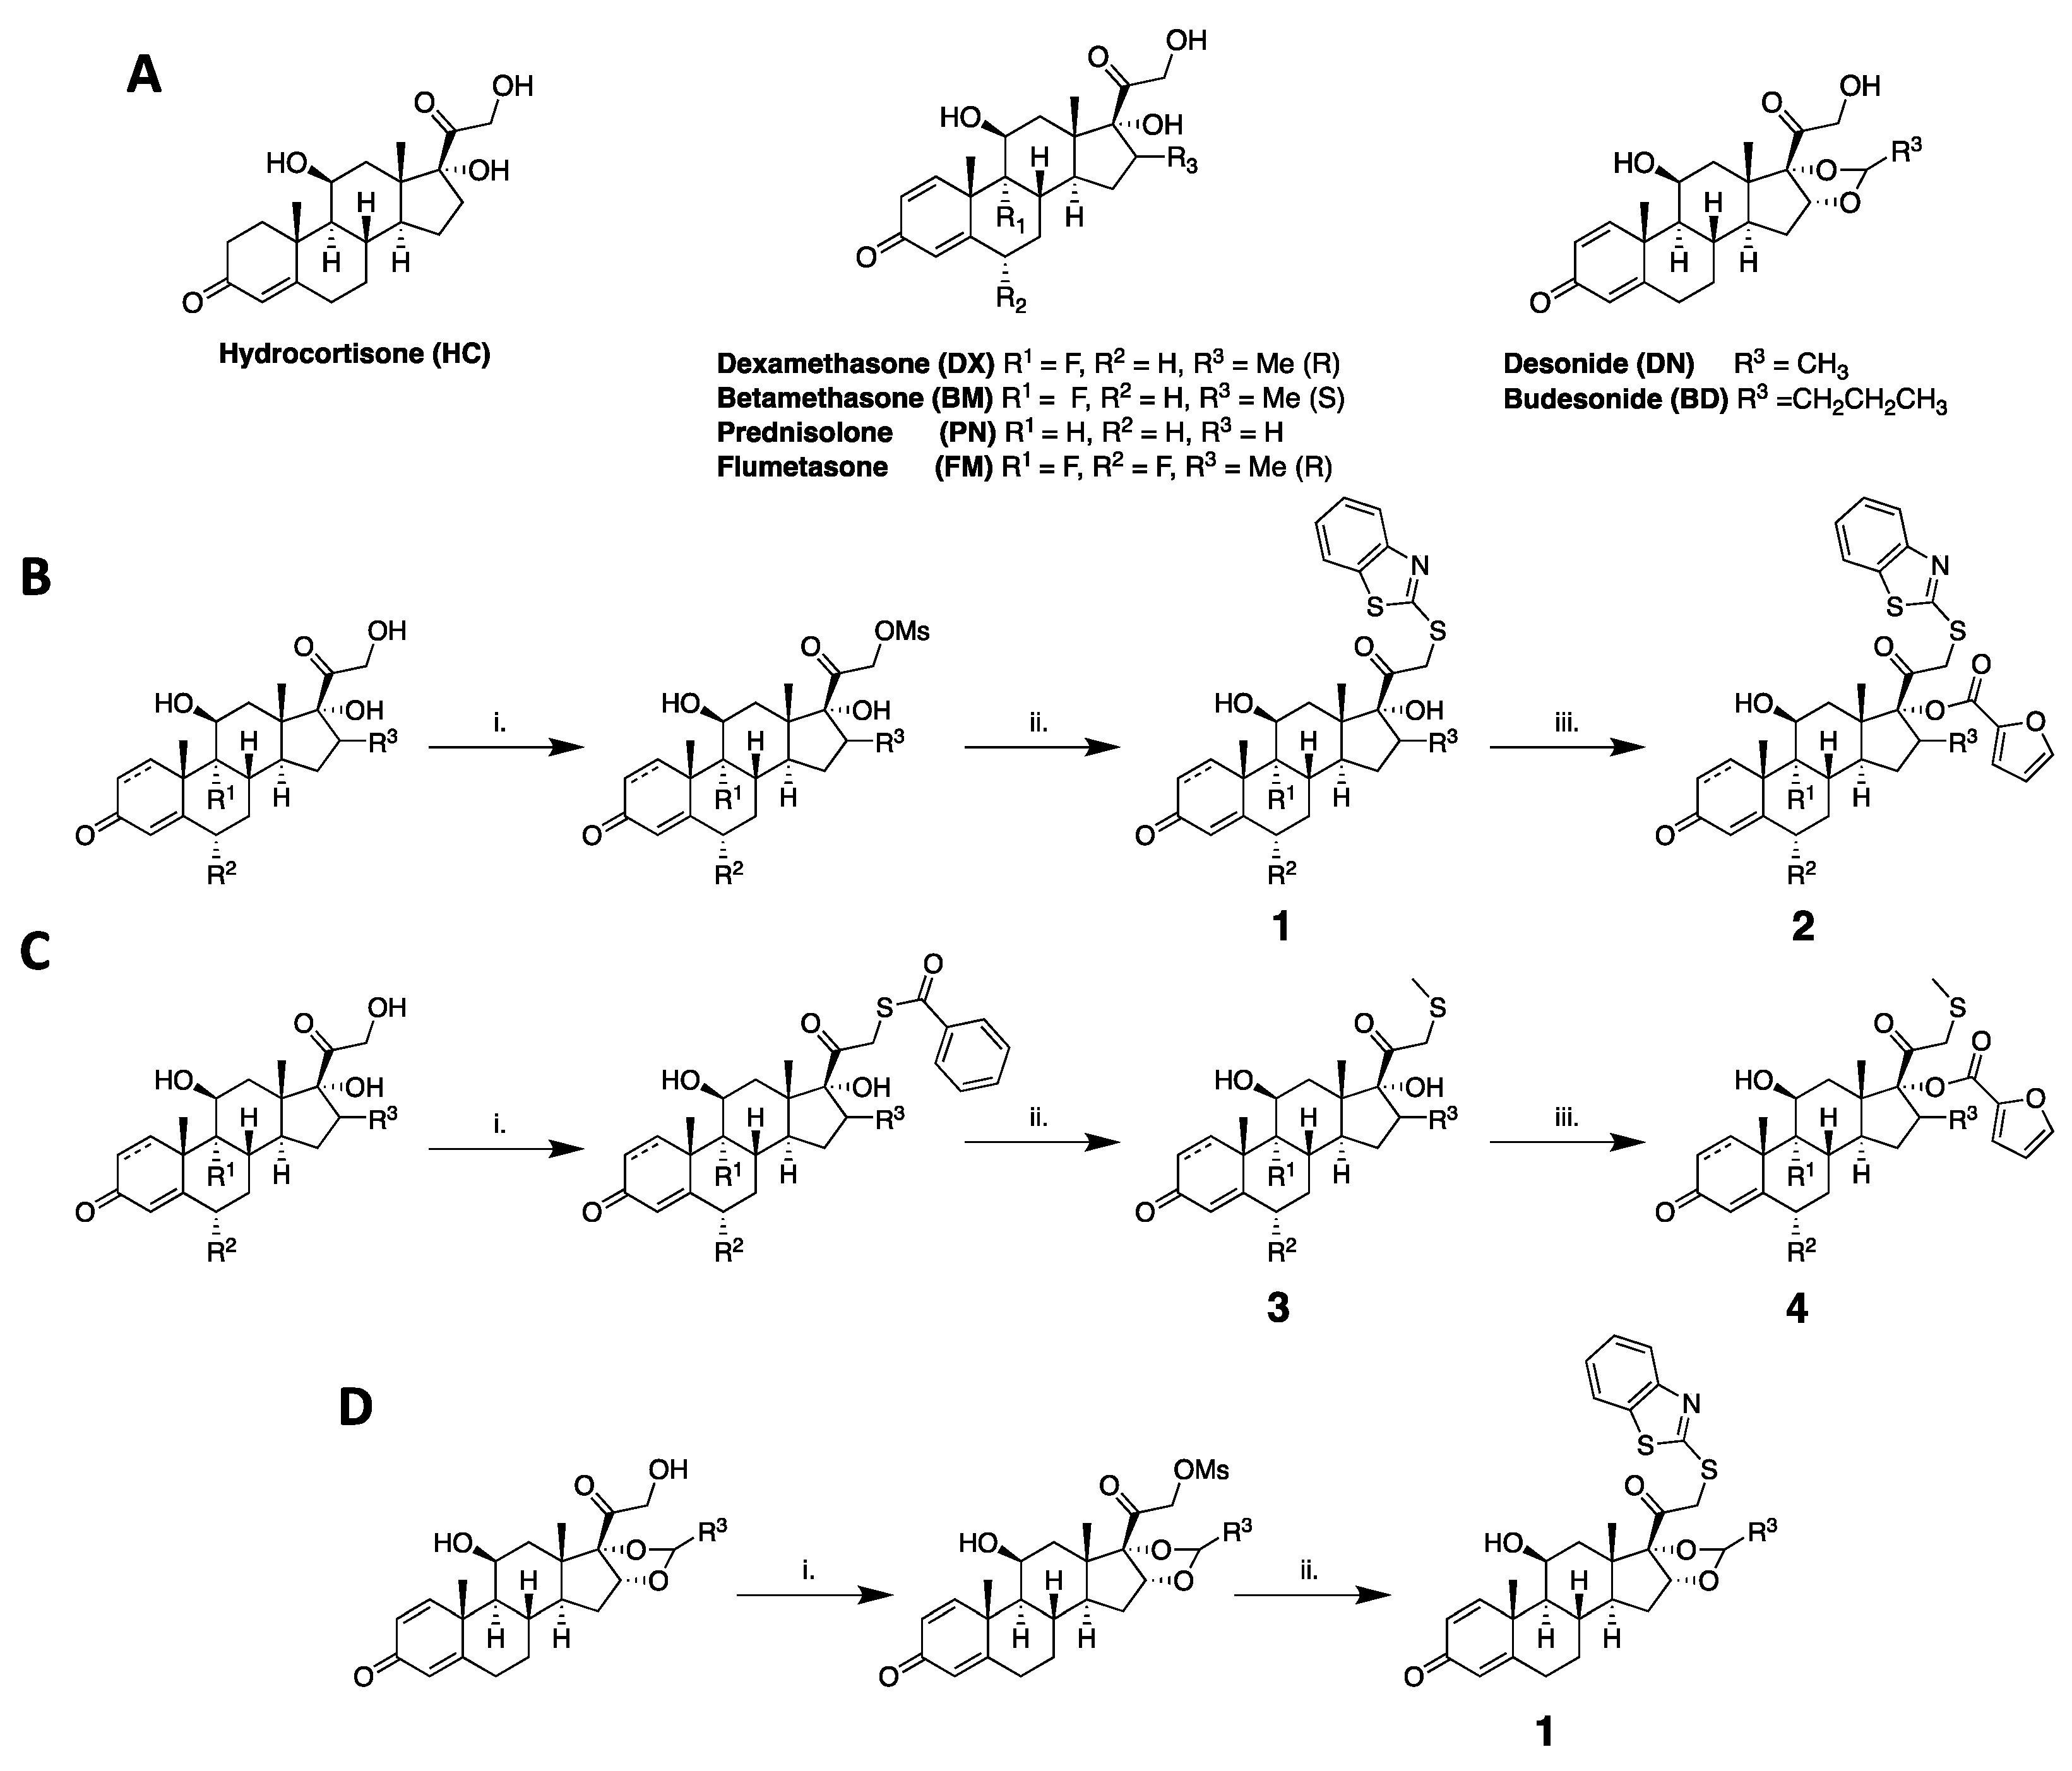
4.1. Synthesis

Compounds 14 were synthesized with slight modifications to previously published methods (Figure 1B–D) [14,30,31]. Six different GCs (Figure 1A) were chosen to be derivatized with MBT and both MBT and furoyl to explore how these modifications to the steroidal core impact activity (series 1 and 2). Unfortunately, the addition of furoyl moiety alone proved synthetically difficult due to cleavage of the furoyl moiety upon removal of C-21 protecting groups, which is potentially promoted by the unmasked oxygen on the side chain that is five atoms away from the furoyl ester carbonyl. Therefore, to investigate the impact of furoyl ester alone, a thiomethyl (SMe) group was introduced at C21 on HC, DX, BM, PN, and FM, affording series 3. Subsequent furoylation of these analogues with a catalytic amount of DMAP to activate the furoyl chloride yielded series 4. DX5DX8 were synthesized with the appropriate mercapto reagent using the same procedure as series 1. Complete synthetic procedures and characterizations for all compounds can be found in Supplementary Materials, Sections S1 and S2.

4.2. Biological Assays

All in vitro assays were performed using the 832/13 rat insulinoma cell line, which was confirmed to be free of mycoplasma [32]. Cells were cultured in either 12- or 24-well plates, and treated at 80–95% confluence. The 832/13 cells were exposed to the steroidal compounds for 24 h at concentrations indicated in the figure legends. Using both 3-(4,5-dimethylthiazol-2-yl)-5-(3-carboxymethoxyphenyl)-2-(4-sulfophenyl)-2H-tetrazolium (MTS) and adenylate kinase (ADK) assays, cell viability was assessed as described previously [18]. The ability of compounds to repress IL-1β-mediated increases in pro-inflammatory promoter activity was examined using the previously reported CCL2-promoter–luciferase plasmid construct (CCL2-Luc) [13]. The 832/13 cells were transfected with the CCL2-Luc plasmid. At 24 h post-transfection, cells were treated with the concentrations of each compound shown in the figure legends for 1 h, followed by stimulation with 1 ng/mL of IL-1β for 4 h. Furthermore, transactivation activity of the synthesized compounds was determined using plasmid constructs containing three copies of a glucocorticoid-responsive element (3xGRE-Luc) [14]. The 832/13 cells were transfected with the 3xGRE luciferase reporter plasmid. At 24 h post-transfection, the cells were exposed to each synthetic compound at the concentrations shown in the figure legends for 4 h. At the end of each respective treatment period, the cells were harvested using passive lysis buffer (Promega, Madison, WI) and luciferase activity measured in a Glomax luminometer (Promega, Madison, WI, USA). Luciferase activity was normalized to total protein to account for differences in cell numbers between experiments. The ability of each compound to suppress transcription induced by IL-1β was also assessed by examining gene expression of Ccl2 and Ccl20, two distinct chemokine genes known to be upregulated in mouse and human islets exposed to cytokines [20]. The 832/13 cells were cultured in 12-well plates and were treated for 1 h with each compound, then stimulated for a further 3 h with 1 ng/mL IL-1β. To investigate expression of GR target genes, 832/13 cells were treated with each compound for 6 h. Cells were lysed with TRI Reagent (Sigma, St. Louis, MO, USA) and RNA-extracted, cDNA-synthesized, and mRNA expression levels were determined as previously described [33]. Transcript levels were normalized to the housekeeping gene, Ribosomal S9 (Rs9). Primer sequences of Rs9, Ccl2, Ccl20, Rgs2, and Sgk1 are available upon request. Parental compounds were purchased from Sigma Aldrich (St. Louis, MO, USA). For low-dose experiments, Dexamethasone and Prednisolone were purchased from two vendors (Sigma Aldrich and Selleck Chemicals LLC; Houston, TX, USA), and an equal number of replicates were performed with compounds from each vendor.

4.3. Molecular Docking and PDB Rational

Computational experiments and analysis tools were used to probe the interactions between the top 3 ligands, DX1, DX4, and PN4, and the GR. Using the GR LBD bound to FF (PDB ID: 7prv), molecular docking was performed. This crystal structure was chosen because its native ligand, FF, is highly similar to two of the three compounds of interest, DX4 and PN4. FF, DX4, and PN4 all have three atoms after the C-18 carbonyl, and all possess the furoate ester group branching off C-17. Together, this increased the accuracy of docking results. Furthermore, 7prv is one of the newest crystal structures of the GR and is the first to show the quaternary structure of the GR [34]. The first LBD (LBD1) of this structure was isolated in PyMol (Schrödinger) and used for molecular docking (residues 528–776) [35]. Docking was performed using AutoDock Vina (The Scripps Research Institute) [36]. Excess water molecules and the starting compound were removed from the GR LBD1 in order to prepare the complex for the docking study. The energy of the ligands was optimized in Chem3D prior to docking between the flexible ligand and the rigid 7prv LBD1 protein. LigPlot+ (European Molecular Biology Laboratory) was used to analyze and compare ligand–residue interactions [37]. This procedure was repeated with DAC in its native receptor (PDB ID: 3bqd), and initial docking results of native ligands, FF and DAC, in LBD1 and 3bqd, respectively, validated the docking procedure as the ligands maintained their position within the receptor (Figure S1).

4.4. Molecular Dynamic Simulations

Our previous efforts used AutoDock Vina (The Scripps Research Institute) exclusively [36]. However, AutoDock Vina only allows movement of ligand position and atoms inside a static protein. This resulted in relatively weak and potentially unrealistic positioning and low binding affinities of DX1 due to an inability to accommodate the added steric bulk (Table S9). Therefore, AutoDock Vina was only used to insert the ligands into the receptor and to calculate binding energies before and after MD simulations, while GROMACS [38] was used to obtain more accurate models that were constructed with allowances for protein backbone flexibility. The resulting changes in amino acid positions in response to the synthesized compounds resulted in an optimally positioned ligand within the GR. DX1, DX4, and PN4 protein–ligand complexes underwent 100 ns molecular dynamic (MD) simulations using GROMACS software version 2021.5-gcc and CHARMM36 force field [38,39]. FF and DAC were also simulated in their native receptors (PDB ID: 7prv and 3bqd, respectively) in order to validate results and draw conclusions. Only LBD1 of 7prv was used for the simulations of synthesized ligands and FF. The hinge region (residues 489–527) is unresolved, and connectivity between each LBD and DBD of the crystal structure 7prv is based on proximity alone [34]. Between generating force fields for unresolved amino acids, assuming connectivity between domains, and allocating the required amount of computational resources required to simulate the entire structure, we elected to use only this single LBD for analysis. Additionally, full protein changes were out of scope due to interest primarily in the ligand–protein active site and ligand-binding pocket (LBP).
Simulations allowed for the evaluation of the various complexes’ thermodynamic and structural stability in the presence of salts and solvents. After preparation of the ligand and protein topology, a cubic box was defined as the unit cell, and the complex was placed at least 1 nm distance from its edges. The system was solvated with TIP3P water model, and Na+ or Cl ions were added to maintain neutrality [40]. Energy minimization was achieved on the system after it was subjected to 50,000 steps and was stopped when a maximum force of 10.0 kJ/mol was achieved. Following this, NVT (amount of substance, volume, and temperature) and NPT (amount of substance, pressure, and temperature) equilibration were run for 50,000 steps each to ensure that the average temperature and pressure of the system were stable. Temperature and pressure were kept constant at 300 K and 1 bar, respectively. Finally, a 100 ns MD simulation was performed to optimize the structure of each complex. Stability of the system was analyzed and ensured using time vs. RMSD (root-mean-square deviation) plots (Supplementary Materials Sections S10–S12). The resulting trajectories were clustered based on the protein active site. This active site was identified as all protein residues within 10 Angstroms of the starting position of each ligand in VMD [38,41,42]. Gromos clustering was used based on the RMSD of the C-alpha atoms within the active site, and the most central member of the most populated cluster was chosen for 2D analysis in LigPlot+ (European Molecular Biological Laboratory) [37]. FF was subjected to the same procedure and analysis as the top ligands to validate these methods. The clustered frame of FF in 7prv LBD1 retained all hydrogen bonding interactions with Asn564, Gln570, and Arg611, as well as 8 of the 11 hydrophobic interactions described in the existing literature (Supplementary Materials, Section S3) [43]. Finally, pocket volume calculations were performed on the clustered frame of each ligand–protein complex using CASTp default parameters which included a 1.4 Å radius probe [44]. These settings were used for all calculations to produce consistent results.

5. Conclusions

In summary, all series 1 compounds that were modified with MBT exhibited a decrease in TA, with DX1 showing the most profound selectivity, including retention of ~90% of its anti-inflammatory properties, while reducing transcription of GR target genes, such as Sgk1, nearly 8-fold. Series 2 compounds also retained anti-inflammatory activity, but TA potential increased upon furoylation. Finally, while series 3 compounds containing an SMe group lost overall potency, the addition of the furoyl moiety in series 4 restored or even increased TR and TA properties at low concentrations for compounds DX4 and PN4.
DX1, DX4, and PN4 have been identified as anti-inflammatory molecules that have a greater selectivity and increased anti-inflammatory activity when compared with dexamethasone and prednisolone. Additionally, molecular dynamics simulations were performed to determine accurate binding positions of ligands in the GR and revealed an expanded GR LBP in response to DX4 and PN4. Further, this expansion caused an unoccupied channel in the region of the GR LBP similar to that created upon DAC binding needed to accommodate the bulk of the arylpyrrazole group. We hypothesize that creation of this channel leads to an overall GR conformation that alters the activity of the protein. Forthcoming in vivo studies and further modifications to the various standard of care glucocorticoids will provide a deeper understanding of the mechanism of GC/GR function and improve the understanding of both clinically available anti-inflammatory compounds as well as novel molecules that have improved side effects profiles.

Supplementary Materials

The following supporting information can be downloaded at: https://www.mdpi.com/article/10.3390/molecules29071546/s1, Figure S1: Confirming the reliability of the docking process; Table S1A: CCL2-Luc Assay Raw Data, Table S1B: Low-Dose CCL2-Luc Assay Raw Data, Table S2A: 3xGRE-Luc Assay Raw Data, Table S2B: Low-Dose 3xGRE-Luc Assay Raw Data, Table S3: ADK Assay Raw Data, Table S4: MTS Assay Raw Data, Table S5: Ccl2 Assay Raw Data, Table S6: Ccl20 Assay Raw Data, Table S7A: Sgk1 Assay Raw Data, Table S7B: Low-Dose Sgk1 Assay Raw Data, Table S8A: Rgs2 Assay Raw Data, Table S8B: Low-Dose Rgs2 Assay, Table S9: Relative Binding Affinities of Docked Compounds, Table S10: Pocket Volume Calculations.

Author Contributions

Conceptualization, W.B.S., J.J.C. and S.R.C.; methodology, W.B.S., S.J.B., J.J.C. and S.R.C.; validation, W.B.S., S.J.B. and S.R.C.; formal analysis, W.B.S., S.J.B., J.J.C. and S.R.C.; investigation, W.B.S., S.J.B., A.R.F., W.A.S., M.G.A.B., G.A.C., I.H. and M.S.F.; resources, J.J.C. and S.R.C.; writing—original draft preparation, W.B.S. and S.J.B.; writing—review and editing, J.J.C. and S.R.C.; visualization, W.B.S. and S.J.B.; supervision, J.J.C. and S.R.C.; funding acquisition, J.J.C. and S.R.C. All authors have read and agreed to the published version of the manuscript.

Funding

This work was funded by NIH grants R01 DK123183 and R21 AI138136 (to J.J.C.).

Institutional Review Board Statement

Not applicable.

Informed Consent Statement

Not applicable.

Data Availability Statement

Data are contained within the article.

Acknowledgments

The Infrastructure for Scientific Applications and Advanced Computing (ISAAC) of the University of Tennessee provided computational resources. W.B.S. acknowledges support by the National Institute of Diabetes and Digestive and Kidney Diseases of the National Institutes of Health under award number R01DK123183 to J.J.C.

Conflicts of Interest

The authors declare no conflicts of interest.

References

  1. Hwang, J.L.; Weiss, R.E. Steroid-induced diabetes: A clinical and molecular approach to understanding and treatment. Diabetes/Metab. Res. Rev. 2014, 30, 96–102. [Google Scholar] [CrossRef] [PubMed]
  2. Van Staa, T.P.; Leufkens, H.G.M.; Abenhaim, L.; Begaud, B.; Zhang, B.; Cooper, C. Use of Oral Corticosteroids in the United Kingdom. QJM Mon. J. Assoc. Physicians 2000, 93, 105–111. [Google Scholar] [CrossRef] [PubMed]
  3. Ramamoorthy, S.; Cidlowski, J.A. Corticosteroids: Mechanisms of action in health and disease. Rheum. Dis. Clin. 2016, 42, 15–31. [Google Scholar] [CrossRef] [PubMed]
  4. Schäcke, H.; Döcke, W.-D.; Asadullah, K. Mechanisms involved in the side effects of glucocorticoids. Pharmacol. Ther. 2002, 96, 23–43. [Google Scholar] [CrossRef] [PubMed]
  5. Overman, R.A.; Yeh, J.Y.; Deal, C.L. Prevalence of oral glucocorticoid usage in the United States: A general population perspective. Arthritis Care Res. 2013, 65, 294–298. [Google Scholar] [CrossRef] [PubMed]
  6. Onwubalili, J.; Obineche, E. High incidence of post-transplant diabetes mellitus in a single-centre study. Nephrol. Dial. Transplant. 1992, 7, 346–349. [Google Scholar] [CrossRef] [PubMed]
  7. Kuo, T.; McQueen, A.; Chen, T.-C.; Wang, J.-C. Regulation of glucose homeostasis by glucocorticoids. Glucocorticoid Signal. 2015, 872, 99–126. [Google Scholar]
  8. Steiner, R.W.; Awdishu, L. Steroids in kidney transplant patients. In Seminars in Immunopathology; Springer: Berlin/Heidelberg, Germany, 2011; pp. 157–167. [Google Scholar]
  9. Lim, H.-W.; Uhlenhaut, N.H.; Rauch, A.; Weiner, J.; Hübner, S.; Hübner, N.; Won, K.-J.; Lazar, M.A.; Tuckermann, J.; Steger, D.J. Genomic redistribution of GR monomers and dimers mediates transcriptional response to exogenous glucocorticoid in vivo. Genome Res. 2015, 25, 836–844. [Google Scholar] [CrossRef]
  10. Reichardt, H.M.; Tuckermann, J.P.; Göttlicher, M.; Vujic, M.; Weih, F.; Angel, P.; Herrlich, P.; Schütz, G. Repression of inflammatory responses in the absence of DNA binding by the glucocorticoid receptor. EMBO J. 2001, 20, 7168–7173. [Google Scholar] [CrossRef]
  11. Holden, N.S.; Bell, M.J.; Rider, C.F.; King, E.M.; Gaunt, D.D.; Leigh, R.; Johnson, M.; Siderovski, D.P.; Heximer, S.P.; Giembycz, M.A. β2-Adrenoceptor agonist-induced RGS2 expression is a genomic mechanism of bronchoprotection that is enhanced by glucocorticoids. Proc. Natl. Acad. Sci. USA 2011, 108, 19713–19718. [Google Scholar] [CrossRef]
  12. Flamini, S.; Sergeev, P.; Viana de Barros, Z.; Mello, T.; Biagioli, M.; Paglialunga, M.; Fiorucci, C.; Prikazchikova, T.; Pagano, S.; Gagliardi, A. Glucocorticoid-induced leucine zipper regulates liver fibrosis by suppressing CCL2-mediated leukocyte recruitment. Cell Death Dis. 2021, 12, 421. [Google Scholar] [CrossRef] [PubMed]
  13. Burke, S.J.; Goff, M.R.; Updegraff, B.L.; Lu, D.; Brown, P.L.; Minkin Jr, S.C.; Biggerstaff, J.P.; Zhao, L.; Karlstad, M.D.; Collier, J.J. Regulation of the CCL2 gene in pancreatic β-cells by IL-1β and glucocorticoids: Role of MKP-1. PLoS ONE 2012, 7, e46986. [Google Scholar] [CrossRef] [PubMed]
  14. Burke, S.J.; May, A.L.; Noland, R.C.; Lu, D.; Brissova, M.; Powers, A.C.; Sherrill, E.M.; Karlstad, M.D.; Campagna, S.R.; Stephens, J.M.; et al. Thiobenzothiazole-modified Hydrocortisones Display Anti-inflammatory Activity with Reduced Impact on Islet beta-Cell Function. J. Biol. Chem. 2015, 290, 13401–13416. [Google Scholar] [CrossRef] [PubMed]
  15. Iqbal, Y.; Haroon, M.; Akhtar, T.; Ashfaq, M.; Tahir, M.N.; Rasheed, L.; Yousuf, M.; Zia, M.A. Synthesis, spectroscopic characterization, single crystal XRD, Hirshfeld Surface analysis and theoretical studies (DFT) of 4-adamantyl-(2-(substitutedbenzylidene) hydrazinyl) thiazoles. J. Mol. Struct. 2022, 1267, 133620. [Google Scholar] [CrossRef]
  16. He, Y.; Shi, J.; Yi, W.; Ren, X.; Gao, X.; Li, J.; Wu, N.; Weaver, K.; Xie, Q.; Khoo, S.K. Discovery of a highly potent glucocorticoid for asthma treatment. Cell Discov. 2015, 1, 15035. [Google Scholar] [CrossRef] [PubMed]
  17. Roma, L.P.; Oliveira, C.A.; Carneiro, E.M.; Albuquerque, G.G.; Boschero, A.C.; Souza, K.L. N-acetylcysteine protects pancreatic islet against glucocorticoid toxicity. Redox Rep. 2011, 16, 173–180. [Google Scholar] [CrossRef] [PubMed]
  18. Smoak, P.; Burke, S.J.; Martin, T.M.; Batdorf, H.M.; Floyd, Z.E.; Collier, J.J. Artemisia dracunculus L. Ethanolic Extract and an Isolated Component, DMC2, Ameliorate Inflammatory Signaling in Pancreatic β-Cells via Inhibition of p38 MAPK. Biomolecules 2022, 12, 708. [Google Scholar] [CrossRef] [PubMed]
  19. Ullrich, S.; Berchtold, S.; Ranta, F.; Seebohm, G.; Henke, G.; Lupescu, A.; Mack, A.F.; Chao, C.-M.; Su, J.; Nitschke, R. Serum-and glucocorticoid-inducible kinase 1 (SGK1) mediates glucocorticoid-induced inhibition of insulin secretion. Diabetes 2005, 54, 1090–1099. [Google Scholar] [CrossRef]
  20. Burke, S.J.; Karlstad, M.D.; Regal, K.M.; Sparer, T.E.; Lu, D.; Elks, C.M.; Grant, R.W.; Stephens, J.M.; Burk, D.H.; Collier, J.J. CCL20 is elevated during obesity and differentially regulated by NF-κB subunits in pancreatic β-cells. Biochim. Et Biophys. Acta (BBA)-Gene Regul. Mech. 2015, 1849, 637–652. [Google Scholar] [CrossRef]
  21. Mishra, V.; Yadav, N.; Saraogi, G.K.; Tambuwala, M.M.; Giri, N. Dendrimer based nanoarchitectures in diabetes management: An overview. Curr. Pharm. Des. 2019, 25, 2569–2583. [Google Scholar] [CrossRef]
  22. Cardozo, A.K.; Proost, P.; Gysemans, C.; Chen, M.-C.; Mathieu, C.; Eizirik, D.L. IL-1β and IFN-γ induce the expression of diverse chemokines and IL-15 in human and rat pancreatic islet cells, and in islets from pre-diabetic NOD mice. Diabetologia 2003, 46, 255–266. [Google Scholar] [CrossRef] [PubMed]
  23. Stojceski, F.; Buetti-Dinh, A.; Stoddart, M.J.; Danani, A.; Della Bella, E.; Grasso, G. Influence of dexamethasone on the interaction between glucocorticoid receptor and SOX9: A molecular dynamics study. J. Mol. Graph. Model. 2023, 125, 108587. [Google Scholar] [CrossRef]
  24. Bridgham, J.T.; Ortlund, E.A.; Thornton, J.W. An epistatic ratchet constrains the direction of glucocorticoid receptor evolution. Nature 2009, 461, 515–519. [Google Scholar] [CrossRef]
  25. Veleiro, A.S.; Alvarez, L.D.; Eduardo, S.L.; Burton, G. Structure of the glucocorticoid receptor, a flexible protein that can adapt to different ligands. ChemMedChem 2010, 5, 649–659. [Google Scholar] [CrossRef]
  26. Frank, F.; Ortlund, E.A.; Liu, X. Structural insights into glucocorticoid receptor function. Biochem. Soc. Trans. 2021, 49, 2333–2343. [Google Scholar] [CrossRef]
  27. Liu, X.; Wang, Y.; Gutierrez, J.S.; Damsker, J.M.; Nagaraju, K.; Hoffman, E.P.; Ortlund, E.A. Disruption of a key ligand-H-bond network drives dissociative properties in vamorolone for Duchenne muscular dystrophy treatment. Proc. Natl. Acad. Sci. USA 2020, 117, 24285–24293. [Google Scholar] [CrossRef]
  28. Suino-Powell, K.; Xu, Y.; Zhang, C.; Tao, Y.-g.; Tolbert, W.D.; Simons, S.S., Jr.; Xu, H.E. Doubling the size of the glucocorticoid receptor ligand binding pocket by deacylcortivazol. Mol. Cell. Biol. 2008, 28, 1915–1923. [Google Scholar] [CrossRef]
  29. Vandevyver, S.; Dejager, L.; Tuckermann, J.; Libert, C. New insights into the anti-inflammatory mechanisms of glucocorticoids: An emerging role for glucocorticoid-receptor-mediated transactivation. Endocrinology 2013, 154, 993–1007. [Google Scholar] [CrossRef]
  30. Biju, P.; McCormick, K.; Aslanian, R.; Berlin, M.; Solomon, D.; Chapman, R.; McLeod, R.; Prelusky, D.; Eckel, S.; Kelly, G. Steroidal C-21 mercapto derivatives as dissociated steroids: Discovery of an inhaled dissociated steroid. Bioorganic Med. Chem. Lett. 2011, 21, 6343–6347. [Google Scholar] [CrossRef]
  31. Wuest, F.; Carlson, K.E.; Katzenellenbogen, J.A. Expeditious synthesis of steroids containing a 2-methylsulfanyl-acetyl side chain as potential glucocorticoid receptor imaging agents. Steroids 2008, 73, 69–76. [Google Scholar] [CrossRef]
  32. Hohmeier, H.E.; Mulder, H.; Chen, G.; Henkel-Rieger, R.; Prentki, M.; Newgard, C.B. Isolation of INS-1-derived cell lines with robust ATP-sensitive K+ channel-dependent and-independent glucose-stimulated insulin secretion. Diabetes 2000, 49, 424–430. [Google Scholar] [CrossRef]
  33. Collier, J.J.; Batdorf, H.M.; Merrifield, K.L.; Martin, T.M.; White, U.; Ravussin, E.; Burk, D.H.; Cooley, C.R.; Karlstad, M.D.; Burke, S.J. Pioglitazone Reverses Markers of Islet Beta-Cell De-Differentiation in db/db Mice While Modulating Expression of Genes Controlling Inflammation and Browning in White Adipose Tissue from Insulin-Resistant Mice and Humans. Biomedicines 2021, 9, 1189. [Google Scholar] [CrossRef] [PubMed]
  34. Postel, S.; Wissler, L.; Johansson, C.A.; Gunnarsson, A.; Gordon, E.; Collins, B.; Castaldo, M.; Köhler, C.; Öling, D.; Johansson, P. Quaternary glucocorticoid receptor structure highlights allosteric interdomain communication. Nat. Struct. Mol. Biol. 2023, 30, 286–295. [Google Scholar] [CrossRef] [PubMed]
  35. Schrödinger, L. The PyMOL Molecular Graphics System, Version 2.0; Schrödinger LLC.: New York, NY, USA, 2017. [Google Scholar]
  36. Trott, O.; Olson, A.J. AutoDock Vina: Improving the speed and accuracy of docking with a new scoring function, efficient optimization, and multithreading. J. Comput. Chem. 2010, 31, 455–461. [Google Scholar] [CrossRef] [PubMed]
  37. Laskowski, R.A.; Swindells, M.B. LigPlot+: Multiple ligand–protein interaction diagrams for drug discovery. J. Chem. Inf. Model. 2011, 51, 2778–2786. [Google Scholar] [CrossRef]
  38. Abraham, M.J.; Murtola, T.; Schulz, R.; Páll, S.; Smith, J.C.; Hess, B.; Lindahl, E. GROMACS: High performance molecular simulations through multi-level parallelism from laptops to supercomputers. SoftwareX 2015, 1, 19–25. [Google Scholar] [CrossRef]
  39. Yu, Y.; Kramer, A.; Venable, R.M.; Simmonett, A.C.; MacKerell Jr, A.D.; Klauda, J.B.; Pastor, R.W.; Brooks, B.R. Semi-automated optimization of the CHARMM36 lipid force field to include explicit treatment of long-range dispersion. J. Chem. Theory Comput. 2021, 17, 1562–1580. [Google Scholar] [CrossRef]
  40. Jorgensen, W.L.; Chandrasekhar, J.; Madura, J.D.; Impey, R.W.; Klein, M.L. Comparison of simple potential functions for simulating liquid water. J. Chem. Phys. 1983, 79, 926–935. [Google Scholar] [CrossRef]
  41. Abraham, M.; Alekseenko, A.; Bergh, C.; Blau, C.; Briand, E.; Doijade, M.; Fleischmann, S.; Gapsys, V.; Garg, G.; Gorelov, S. Gromacs 2023.2 Manual; Zenodo, CERN European Organization for Nuclear Research: Geneve, Switzerland, 2023. [Google Scholar] [CrossRef]
  42. Humphrey, W.; Dalke, A.; Schulten, K. VMD: Visual molecular dynamics. J. Mol. Graph. 1996, 14, 33–38. [Google Scholar] [CrossRef]
  43. Biggadike, K.; Bledsoe, R.K.; Hassell, A.M.; Kirk, B.E.; McLay, I.M.; Shewchuk, L.M.; Stewart, E.L. X-ray crystal structure of the novel enhanced-affinity glucocorticoid agonist fluticasone furoate in the glucocorticoid receptor−ligand binding domain. J. Med. Chem. 2008, 51, 3349–3352. [Google Scholar] [CrossRef]
  44. Tian, W.; Chen, C.; Lei, X.; Zhao, J.; Liang, J. CASTp 3.0: Computed atlas of surface topography of proteins. Nucleic Acids Res. 2018, 46, W363–W367. [Google Scholar] [CrossRef] [PubMed]
Figure 1. (A) Starting glucocorticoid structures. (B) Synthetic route for benzothiazole analogues 1 and 2. Reagents and conditions: (i) methanesulfonyl chloride, DIPEA, CH2Cl2, 0 °C to rt, 15 h, (ii) 2-mercaptobenzothiazole, K2CO3, acetone, reflux, (iii) furoyl chloride, DMAP, CH2Cl2, 0 °C to rt. (C) Synthetic route for thiomethyl analogues 3 and 4. Reagents and conditions: (i) diisopropyl azodicarboxylate, PPh3, thiobenzoic acid, THF, 0 °C to rt, 2.5 h, (ii) 1 N NaOH, iodomethane, MeOH, 3.5 h, (iii) furoyl chloride, DMAP, CH2Cl2, 0 °C to rt. (D) Synthetic route for desonide and budesonide analogues 1. Reagents and conditions: (i) methanesulfonyl chloride, DIPEA, CH2Cl2, 0 °C to rt, 15 h, (ii) 2-mercaptobenzothiazole, K2CO3, acetone, reflux.
Molecules 29 01546 g001
Figure 2. Bioassay data showing relative steroid activity of selected series 1 and 2 compounds. (A) Structure of compounds DX1, BM1, and PN1. (B) GR-ligand activity in CCL2-Luc (TR) and 3xGRE-Luc (TA) assays as a percent response against dexamethasone at 100 nM for selected compounds. (C) CCL2-promoter-luciferase-reporter activity assay; x-axis, selected series 1 and their respective parent compound activity at 100 nM; y-axis, %-maximal IL-1β response (relative promoter activity). (D) 3xGRE-promoter-luciferase-reporter activity assay; x-axis, selected series 1 and their respective parent compound activity at 100 nM; y-axis, fold over control. (E) CCL2-promoter-luciferase-reporter activity assay; x-axis, selected series 2 and their respective parent compound activity at 100 nM; y-axis, %-maximal IL-1β response (relative promoter activity). (F) 3xGRE-promoter-luciferase-reporter activity assay; x-axis, selected series 2 and their respective parent compound activity at 100 nM; y-axis, fold over control. Data are means ± S.D. (error bars). Not significant (ns), p > 0.05 vs. vehicle (DMSO); *, p < 0.05 vs. vehicle (DMSO); **, p < 0.01 vehicle (DMSO); ****, p < 0.0001 vs. vehicle (DMSO). Note: Statistical analyses for all pairwise comparisons among the concentrations and vehicle can be found in Supplementary Materials, Sections S4 and S5. This is a figure. Schemes follow the same formatting.
Molecules 29 01546 g002
Figure 3. Dose-response curve of the transcription activities of GCs. (A) Structures of highly potent compounds DX4 and PN4 and their respective parent compounds. (B) CCL2-promoter-luciferase-reporter activity assay; x-axis, log concentration (molar); y-axis, %-maximal IL-1β response (relative promoter activity). (C) 3xGRE-promoter-luciferase-reporter activity assay; x-axis, log concentration (molar); y-axis, fold over control.
Molecules 29 01546 g003
Figure 4. Toxicity assays of 832/13 cells treated with 100 nM concentrations of GC. (A) Adenylate kinase release into culture medium after exposure to indicated GC. (B) MTS reduction after exposure to indicated GC. *, p < 0.05 vs. vehicle (DMSO); **, p < 0.01 vs. vehicle (DMSO); ***, p < 0.001 vs. vehicle (DMSO); ****, p < 0.0001 vs. vehicle (DMSO). Note: For this analysis, all steroids were included in the analysis, and intergroup comparisons were performed using simple one-way ANOVA comparison of each steroid against vehicle control. Data in the Supplementary Materials for this assay only include intragroup comparisons; and therefore, the p-values differ among the statistical treatments available in Supplementary Materials, Sections S6 and S7.
Molecules 29 01546 g004
Figure 5. 832/13 cells treated with 100 nM concentrations of GCs. (A) Sgk1 and (B) Rgs2 gene expression associated with transactivation after exposure to dexamethasone and its analogues. (C) Sgk1 and (D) Rgs2 gene expression associated with transactivation after exposure to prednisolone and its analogues. Dose-response curve of the transcription activities of highly potent GCs. Not significant (ns), p > 0.05 vs. vehicle (DMSO); *, p < 0.05 vs. vehicle (DMSO); **, p < 0.01 vs. vehicle (DMSO); ***, p < 0.001 vs. vehicle (DMSO); ****, p < 0.0001 vs. vehicle (DMSO). (E) Sgk1 gene expression; x-axis, log concentration (molar); y-axis, relative mRNA Abundance (fold over control). (F) Rgs2 gene expression; x-axis, log concentration (molar); y-axis, relative mRNA Abundance (fold over control).
Molecules 29 01546 g005
Figure 6. 832/13 cells treated with 100 nM concentrations of GCs. (A) Ccl2 and (B) Ccl20 relative mRNA release into medium in response to PN-PN4 versus DMSO (black bar). (C) Ccl2 and (D) Ccl20 relative mRNA release into medium in response to HC-HC4. (E) Ccl2 and (F) Ccl20 relative mRNA release into medium in response to DX-DX4. Not significant (ns), p > 0.05 vs. vehicle (DMSO); *, p < 0.05 vs. vehicle (DMSO); **, p < 0.01 vs. vehicle (DMSO); ***, p < 0.001 vs. vehicle (DMSO); ****, p < 0.0001 vs. vehicle (DMSO).
Molecules 29 01546 g006
Figure 7. (A) Molecular docking experiment with DX1 inserted into LBD1 of 7prv. (B) 2D representations of the ligand–receptor interactions. Red half-circles represent hydrophobic interactions, and the green dotted line represents a hydrogen bond.
Molecules 29 01546 g007
Figure 8. Ligand-binding pocket created in response to GR agonists. Wire represents the protein, and the solid surface represents the ligand-binding pocket area. The red line is placed in the same spot for all structures for scale and reference. (A) Ligand-binding pocket and interaction between Arg611 for DX4 (yellow), (B) PN4 (blue), (C) FF (purple), and (D) DAC (green).
Molecules 29 01546 g008
Table 1. General Biological Analysis of CCL2 (TR) and 3xGRE (TA) Promoter Activity.
Compd CCL2 3xGRE
pIC50Emaxb %DXpEC50Emaxb %DX
DX8.388.6100.06.87.9100.0
a HC16.977.094.05.31.824.6
a HC26.272.882.27.48.2104.8
HC3NDR37.141.8NDR1.417.2
HC47.178.688.7AAC3.645.9
DX17.280.090.3NDR1.012.6
DX28.389.7101.36.74.962.2
DX3AAC75.184.7NDR7.494.4
DX4AAC84.795.6AAC8.9113.0
BM8.388.7100.19.810.3131.3
BM17.285.796.77.22.228.0
BM27.883.394.07.84.759.9
BM38.983.594.37.34.860.6
BM47.281.692.17.54.962.0
PN8.485.196.19.410.0127.2
PN15.975.084.76.12.430.5
PN2AAC90.9102.68.87.595.9
PN37.149.656.06.63.443.3
PN4AAC80.891.2AAC5.469.2
FMAAC90.4102.1AAC10.2129.5
FM17.585.997.08.84.860.4
FM2AAC88.399.67.911.7149.1
FM3AAC82.292.8AAC5.671.6
FM4AAC75.985.7AAC4.962.6
DN8.883.293.9AAC9.6121.7
DN17.965.674.17.02.531.8
BDAAC83.494.1AAC7.088.7
BD16.657.665.06.02.025.3
a Selected values taken from previously published work [14]. b Values represented as percentage of maximal response of dexamethasone. AAC = Active at all concentrations. NDR = No dose-dependent response. Note: All tabulated raw values and standard deviations are available in Supplementary Materials, Sections S4–S9.
Table 2. General Biological Analysis of CCL2 (TR) and 3xGRE (TA) Promoter Activity of DX Analogues.
Molecules 29 01546 i001
Compd CCL2 3xGRE
pIC50Emaxa %DXpEC50Emaxa %DX
DX8.388.6100.06.87.9100.0
DX17.280.090.3NDR1.012.6
DX56.267.275.85.83.240.5
DX67.165.073.47.54.961.7
DX77.166.775.37.76.582.4
DX86.354.060.96.92.329.5
a Values represented as percentage of maximal response of dexamethasone. NDR = No dose-dependent response.
Disclaimer/Publisher’s Note: The statements, opinions and data contained in all publications are solely those of the individual author(s) and contributor(s) and not of MDPI and/or the editor(s). MDPI and/or the editor(s) disclaim responsibility for any injury to people or property resulting from any ideas, methods, instructions or products referred to in the content.

