Abstract
Lactic acid bacteria (LAB) play an important role in the ripening of cheeses and contribute to the development of the desired profile of aroma and flavor compounds. Therefore, it is very important to monitor the dynamics of bacterial proliferation in order to obtain an accurate and reliable number of their cells at each stage of cheese ripening. This work aimed to identify and conduct a quantitative assessment of the selected species of autochthonous lactic acid bacteria from raw cow’s milk cheese by the development of primers and probe pairs based on the uniqueness of the genetic determinants with which the target microorganisms can be identified. For that purpose, we applied real-time quantitative PCR (qPCR) protocols to quantify Lactobacillus delbrueckii subsp. bulgaricus, Streptococcus thermophilus, and Lactococcus lactis subsp. cremoris cells in cheese directly after production and over three-month and six-month ripening periods. While L. lactis subsp. cremoris shows good acidification ability and the ability to produce antimicrobial compounds, L. delbrueckii subsp. bulgaricus has good proteolytic ability and produces exo-polysaccharides, and S. thermophilus takes part in the formation of the diacetyl flavor compound by metabolizing citrate to develop aroma, they all play an important role in the cheese ripening. The proposed qPCR protocols are very sensitive and reliable methods for a precise enumeration of L. delbrueckii subsp. bulgaricus, S. thermophilus, and L. lactis subsp. cremoris in cheese samples.
1. Introduction
Raw-milk cheese contains a microbiota that significantly contributes to the multiple varieties of the characteristics of ripened products through the variable dynamics of growth during processing. Different microorganisms, including bacteria, yeast, and mold, are simultaneously present in milk microbiota and many dairy products, especially those manufactured from raw milk. The problem lies in the fact that with such a wide variety of microorganisms present in cheese made from unpasteurized milk, there is a need to know which of these microorganisms make the greatest contribution to the quality of the finished product, which ones have the best growth rate, which of these microorganisms produce substances that inhibit the growth of potentially undesirable microorganisms from unpasteurized milk, and which of them are responsible for producing metabolites in the form of volatile compounds that give cheese the organoleptic characteristics highly desired by consumers. Lactic acid bacteria (LAB) constitute the indigenous and unique microflora of raw-milk cheeses and provide the organoleptic properties that distinguish such cheeses from their industrially mass-produced counterparts. This is the reason why it is worth studying the population growth dynamics of the selected lactic acid bacteria that ensure a high quality of ripened cheeses [1,2,3]. While Lactococcus lactis subsp. cremoris shows a good acidification ability and the ability to produce antimicrobial compounds, Lactobacillus delbrueckii subsp. bulgaricus has a good proteolytic ability and produces exo-polysaccharides, and Streptococcus thermophilus takes part in the formation of diacetyl flavor compounds by metabolizing citrate to develop aroma, they all play a huge role in cheese ripening [4]. Such characteristics of these microorganisms mean that it is reasonable to monitor the growth dynamics of the selected species of bacterial population during cheese ripening in order to understand the role of each microbial population [4,5].
Up to now, there are no precise methods to detect the selected species of LAB. The actual plate-counting methods give only a total amount of LAB, and they do not discern them by species. Plate-counting methods are methods that use microbiological media containing suitable nutrient compounds that enable the growth and multiplication of many different types of LAB. Thus, they do not provide a reliable qualitative and quantitative identification of specific LAB species. The plate-colony-counting methods have large operating errors, are usually time-consuming, and are characterized by low sensitivity [3,6]. In food matrices such as cheese, culture-independent methods have been rapidly recognized as a valuable alternative to culture-dependent methods [6,7,8,9,10]. Among culture-independent methods, quantitative real-time PCR (qPCR) represents a powerful tool for quantifying microbial populations. This molecular method allows simultaneous amplification and detection of specific DNA sequences. This method is recognized as rapid, specific, sensitive, and reliable. It enables the enumeration of microbial populations through the measurement of targeted gene copies. The method involves the extraction of nucleic acids and the amplification of the target region with specific primers/probe sets. The qPCR technology is based on the quantification of a target amplicon and one of the most precise variants when it is marked with a specific fluorescent probe [11,12,13,14].
In order to be able to know which strains are present in raw-milk cheese, we herein present a new method of quantification based on qPCR with primers/probe sets. The qPCR methods allow the specific quantification of different bacterial strains.
The aim of this study was to identify and conduct a quantitative assessment of the selected species of autochthonous lactic acid bacteria from artisanal raw cow’s milk cheese. The novelty of this study relies on the development of primers/probe sets based on the uniqueness of the genetic determinants with which the target microorganisms can be identified. For that purpose, we applied qPCR assays for the quantification of L. delbrueckii subsp. bulgaricus, S. thermophilus, and L. lactis subsp. cremoris, which actively participate in milk fermentation and cheese ripening, to examine their growth and their ability to grow in cheese. The qPCR approach has not been previously used to study the proliferation dynamics of key lactic acid bacteria with extremely valuable properties that shape the appropriate aroma and flavor of ripened cheeses. As the number of publications on this issue is severely limited, the present study aims to fill this gap.
2. Results
2.1. Assessing the Primers/Probe Sets Specificity
The specificity of the primers/probe sets was carried out with DNA hat was isolated from L. delbrueckii subsp. bulgaricus, S. thermophilus, and L. lactis subsp. cremoris strains and other bacteria to check if the newly designed primers/probe sets were specific only towards the examined lactic acid bacteria. The specificity of the primers and probes was tested with the other lactic acid bacteria as well as with less related species listed in Table 1. A more detailed informations can be found in Table A1. At first, the specificity of the primers/probe design was checked using the NCBI Primer-BLAST tool. Then, the specificity of the primers/probe sets was analyzed experimentally with gDNA that was isolated from different bacterial strains (Table 1). The sensitivity of the qPCR assays was conducted by preparing a serial tenfold dilution of the locus_tag=“LB080_06090”gene fragments of L. delbrueckii subsp. bulgaricus, the locus_tag “B1761_07395” gene fragments of S. thermophilus, and the locus_tag=“kw2_2318” gene fragments of L. lactis subsp. cremoris, which were treated as the positive controls. The dilutions were examined by qPCR, and the number of DNA copies contained in each dilution was used to calculate the limit of detection (LOD) and the linearity of the qPCR assay. The standard curve was created by plotting the Ct values of all dilutions as a function of the concentration of DNA copies and calculating the linear regression in R2. qPCR efficiency was assessed using standard curves with an equation PCR efficiency of (10−1/slope) − 1. L. delbrueckii subsp. bulgaricus genomes available in the GenBank database were searched for the dipeptidase production gene. All genomes were found to possess a single copy of this gene. S. thermophilus genomes available in the GenBank database were searched for the ATPase V production gene. All genomes were found to possess a single copy of this gene. L. lactis subsp. cremoris genomes available in the GenBank database were searched for the cation-transporting P-type ATPase gene. All genomes were also found to possess a single copy of this gene. The data obtained indicated that there was one copy of the genes in the genomes of the target microorganisms used for the quantitative detection.

Table 1.
The Cq values achieved from qPCR protocols using DNA isolated from L. delbrueckii subsp. bulgaricus, S. thermophilus, and L. lactis subsp. cremoris (constituting the positive controls) and the closely related bacterial species (constituting negative controls).
L. delbrueckii subsp. bulgaricus DSM 20080, S. thermophilus APC 151, and L. lactis subsp. cremoris JM2 strains indicated average Cq (cycle threshold) values ± standard deviation amounting to 16.42 ± 0.09, 15.73 ± 0.09, and 15.77 ± 0.19, respectively (Table 1). The primer melting temperature (Tm) indicated values equal to 77.31 ± 0.09 °C for L. delbrueckii subsp. bulgaricus, 77.29 ± 0.14 °C for S. thermophilus, and 77.26 ± 0.11 °C for L. lactis subsp. cremoris, respectively (Table 2).
Table 2.
Nucleotide sequences of the primers/probe sets used for the detection of L. delbrueckii subsp. bulgaricus, S. thermophilus, and L. lactis subsp. cremoris.
2.2. The qPCR Protocol Validation
The standard curves were received from tenfold serial dilutions of recombinant standard specific genes from L. delbrueckii subsp. Bulgaricus DSM 20080, S. thermophilus APC 151, and L. lactis subsp. Cremoris JM2, respectively. There was a good linear correlation between the Cq values and gene copy number/µL received for standard curves with R2 values that ranged from 0.998 to 1.000 for L. delbrueckii subsp. Bulgaricus (Figure 1A–C); from 0.998 to 1.000 for S. thermophilus (Figure 2A–C), and from 0.998 to 0.999 for L. lactis subsp. Cremoris (Figure 3A–C).
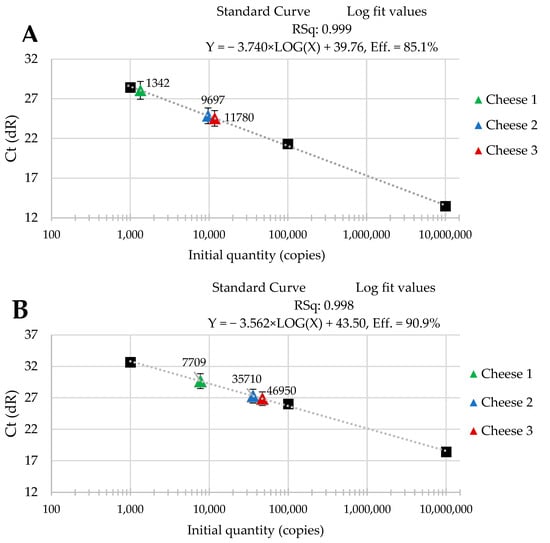
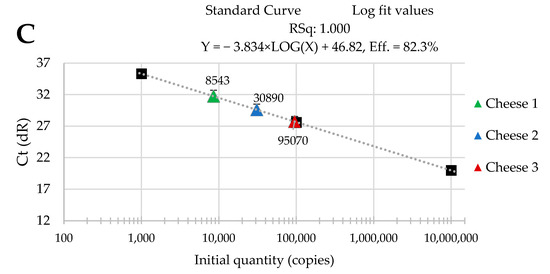
Figure 1.
Performance of the qPCR protocol for quantitative detection of L. delbrueckii subsp. Bulgaricus in raw cow’s milk cheese (A) directly after production; (B) after 3-month ripening; (C) after 6-month ripening. A black square—content of gene copy present in 100-fold dilutions delineating the standard curve.
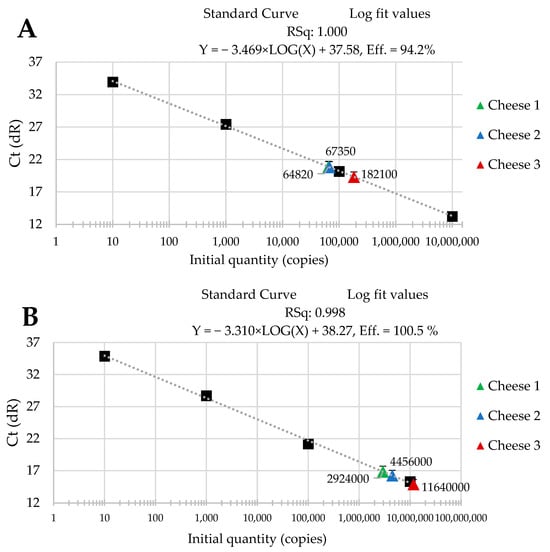
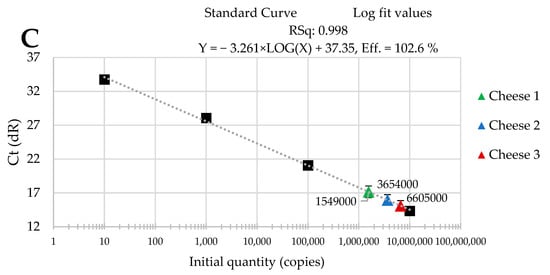
Figure 2.
Performance of the qPCR protocol for quantitative detection of S. thermophilus in raw cow’s milk cheese (A) directly after production; (B) after 3-month ripening; (C) after 6-month ripening. A black square—content of gene copy present in 100-fold dilutions delineating the standard curve.
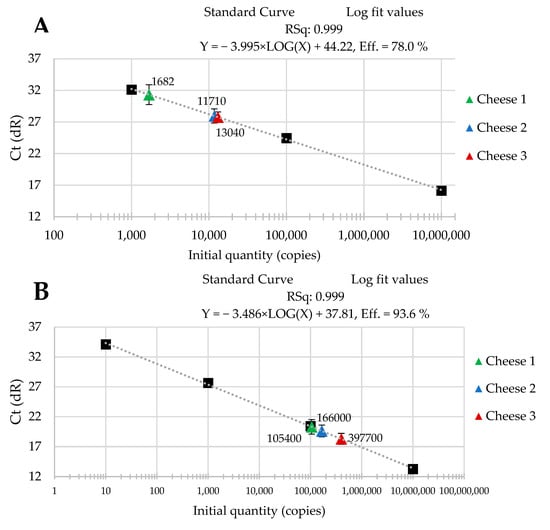
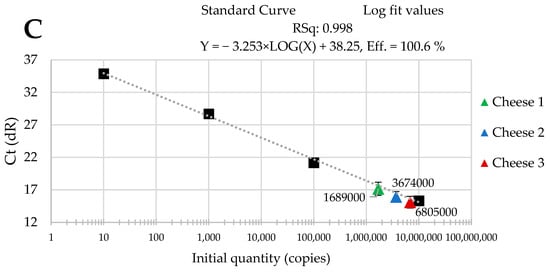
Figure 3.
Performance of the qPCR protocol for quantitative detection of L. lactis subsp. Cremoris in raw cow’s milk cheese (A) directly after production; (B) after 3-month ripening; (C) after 6-month ripening. A black square—content of gene copy present in 100-fold dilutions delineating the standard curve.
2.3. Enumeration of L. delbrueckii subsp. bulgaricus, S. thermophilus, and L. lactis subsp. cremoris in Cheese Samples by qPCR Method
Three batches of cheese produced from raw cow’s milk were examined to evaluate the usefulness of qPCR method for the enumeration of L. delbrueckii subsp. bulgaricus, S. thermophilus, and L. lactis subsp. cremoris. Cheese samples were analyzed immediately after cheese production and after three- and six-month ripening periods. Three qPCR protocols targeting specific genes were designed for the enumeration of L. delbrueckii subsp. bulgaricus, S. thermophilus, and L. lactis subsp. cremoris cells. New sets of primers/probe were developed, and their specificity was validated. The qPCR assays showed a high quantification capacity characterized by their linearity (R2 > 0.998) and PCR efficiencies were within the range 82.3–90.9% for L. delbrueckii subsp. bulgaricus (Figure 1A–C), 94.2–102.6% for S. thermophilus (Figure 2A–C), and 78.0–100.6% for L. lactis subsp. cremoris (Figure 3A–C). A properly designed assay, in the absence of interfering substances in the sample matrix, amplifies target DNA with at least 90% efficiency. In some reactions, the efficiency of the qPCR protocols was 85.1% (Figure 1A), 82.3 (Figure 1C), and 78% (Figure 3A). We isolated DNA from three different cheese batches. Cheese is a very difficult food matrix for DNA isolation due to its high fat content and high calcium ion content, which can inhibit the efficiency of the qPCR. This is probably the reason for the lower efficiency of qPCR in the three samples tested. In the remaining samples, qPCR efficiency was high and exceeded 90%.
The data that we obtained during our study are presented in Figure 1, Figure 2 and Figure 3. They reveal the performance of the qPCR protocol for quantitative detection of the target microorganisms. The numbers of the colony-forming units in 1 g of cheese are expressed as a number of copies of the particular gene characteristic for a given target microorganism. The data presented in Figure 1, Figure 2 and Figure 3 show how the numbers of the three target microorganisms, namely L. delbrueckii subsp. bulgaricus, S. thermophilus, and L. lactis subsp. cremoris, changed during ripening in three different batches of cheese starting from production and after three- and six-months periods of ripening. The data are presented as the number of copies of a given gene specific only to a given species per gram of cheese. In order to check how many copies of a specific gene were present in the genome of the target microorganisms, we used the NCBI Blast Nucleotide database. All the genomes of the target microorganisms were found to possess a single copy of a specific gene. Thus, the data obtained proved that there was one copy of the genes in the genomes of the target microorganisms used for the quantitative detection, which means that the number of copies of a particular gene is actually the number of colony-forming units of a particular target species present in 1 g of cheese, which resulted from searching genomes using the NCBI Blast Nucleotide database. In order to make the results shown in Figure 1, Figure 2 and Figure 3 easier to read, we present them graphically in Figure 4A–C, where we show the dynamics of proliferation of the target microorganisms in the cheeses from the time the cheeses were produced and after three- and six-months periods of ripening. We converted CFU/g to log CFU/g for better clarity.
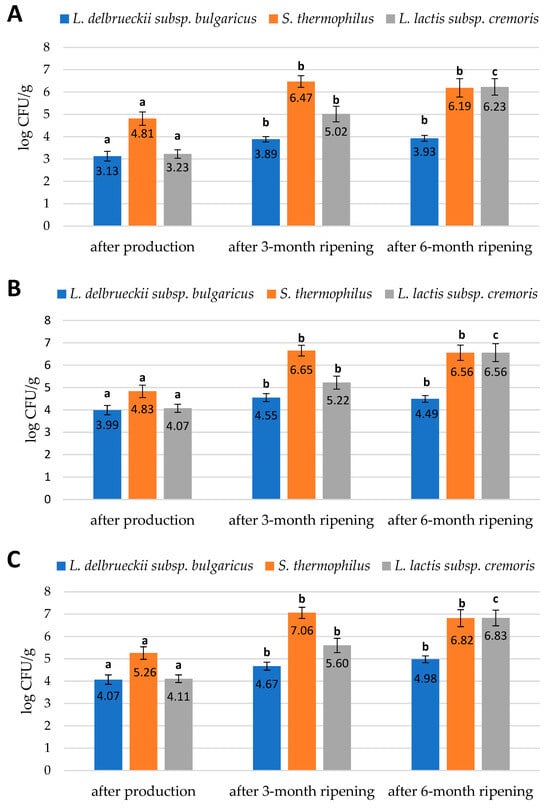
Figure 4.
Numbers of L. delbrueckii subsp. bulgaricus, S. thermophilus, and L. lactis subsp. cremoris cells in (A) the first batch of cheese; (B) the second batch of cheese; (C) the third batch of cheese; expressed in log CFU/g obtained by qPCR method. The bars of the same color marked with different letters are significantly different (p < 0.05).
Three batches of cheese made from unpasteurized cow’s milk were tested in three repetitions. The research was conducted using the qPCR method to quantify a number of selected lactic acid bacteria present in three batches of cheese immediately after production and after 3 and after 6 months of ripening. The three batches of cheese were characterized by slightly differentiated numbers of the target species. The numbers of target bacteria belonging to the species L. delbrueckii subsp. bulgaricus, S. thermophilus, and L. lactis subsp. cremoris found in the cheeses at different ripening stages are shown in Figure 4A–C. The error bars in Figure 4A–C are a graphical representation of the variability in the data, and they are used in graphs to indicate an error or uncertainty in the reported measurement. They give a general idea of how accurate a measurement is or, conversely, how far from the reported value the true value can be.
The study showed that immediately after the production of the cheese batches, bacteria belonging to the L. delbrueckii subsp. bulgaricus species were present in the lowest numbers in relation to S. thermophilus and L. lactis subsp. cremoris bacteria. The first batch of cheese tested immediately after production had the lowest number of L. delbrueckii subsp. bulgaricus and L. lactis subsp. cremoris bacteria compared to the second and third batches. In contrast, the population size of S. thermophilus was the highest in the third batch of cheese after production. Nevertheless, these differences were not significant. Milk for the production of these three batches of cheese came from three different farms in the Podlasie region; hence, there were some differences in the population size of the microorganisms studied. After three months of ripening, the number of S. thermophilus and L. lactis subsp. cremoris bacteria in all three cheese batches tested increased significantly. A less significant increase was observed for the L. delbrueckii subsp. bulgaricus population. After six months of ripening, there was a significant increase in the population of L. lactis subsp. cremoris and a nonsignificant increase in the population of L. delbrueckii subsp. bulgaricus, while the population of S. thermophilus was slightly reduced (Figure 4A–C).
3. Discussion
Our aim was to evaluate the number of the selected species of LAB in the ripened cheese by applying the qPCR method because the existing plate-colony-counting methods have some problems, as they do not provide an accurate assessment of the number of a particular type of LAB, and they are time-consuming [10]. Thus, we focused our efforts on the search and assessment of new genetic determinants for target LAB screening. We applied the qPCR method, providing the rapid qualitative and quantitative detection of three very important LAB that have a significant influence on the cheese-ripening process.
It is important to know what types of bacteria are present in cheeses made from unpasteurized milk and what role they have. Cheeses made from unpasteurized milk can potentially contain undesirable microorganisms [15]. Cheeses, due to their high nutrient content, high water content, use of low-temperature heat treatment, and lack of preservative additives, may be a good environment for the growth of various microorganisms, including potentially dangerous pathogens that may pose a health risk to consumers. It should be emphasized that lactic acid bacteria constitute the indigenous microflora of cheeses made from unpasteurized milk [16,17,18,19,20,21]. Lactic acid bacteria have very good acidifying and flavor-forming properties. Furthermore, some LAB strains have been recognized as potentially probiotic microorganisms. Some LAB counteract the proliferation of pathogenic bacteria by producing lactic acid and producing antimicrobial peptides such as bacteriocins [22,23]. Given that lactic acid bacteria are capable of producing aromatic and unique metabolic compounds, cheeses made with them are particularly preferred by consumers due to the presence of a large amount of volatile compounds responsible for the palatability of the final product. There is also a tendency to isolate specific indigenous strains of LAB from cheeses made from unpasteurized milk for the production of starters used for the manufacture of cheeses made from pasteurized milk in dairy plants [24,25,26,27,28].
Lactic acid bacteria that have very good acidification and aroma-forming properties and inhibit the growth of undesirable microflora in raw-milk cheeses include L. delbrueckii subsp. bulgaricus, S. thermophilus, and L. lactis subsp. cremoris. They are Gram-positive lactic acid bacteria and play a significant role in dairy fermentation. Coppola et al. [15] investigated the numbers of S. thermophilus in cheese during ripening. The number of live cells decreased during ripening. Blaiotta et al. [16] examined lactobacilli (L. helveticus and L. delbrueckii ssp. and lactis) that were present in industrial starter cultures for processing hard cheese (e.g., Emmental, Comté, Italian Grana, and Argentinean hard cheeses). Coppola et al. [17] examined a number of L. delbrueckii ssp. bulgaricus in Pasta filata cheeses (mozzarella) and Italian hard cheeses (Canestrato Pugliese and Parmigiano Reggiano) [16,18]. Chamba [19] found that the number of lactobacilli decreased during ripening of Emmental cheese. The decrease was dependent on the sensitivity of lactobacilli to salt, on the water activity, and on the autolysis power of the strains.
Some lactobacilli were also investigated as bacteria present in the dairy products produced from raw cow’s milk [16,20]. They were found to exist initially in small numbers (102 to 103/g directly after pressing in cheddar cheese); then, they increased to significantly high numbers in cheeses that need long ripening times (107 to 108 bacteria/g after 3-month ripening in cheddar cheese) [21]. Coppola et al. [17] examined the microflora of raw milk, natural whey starter, and cheese during the first months of ripening of Parmigiano Reggiano. It was found that thermophilic lactobacilli rapidly decreased in number during one month of ripening. On the other hand, mesophilic facultatively heterofermentative lactobacilli progressively increased in number during five months of ripening [22,23,24,25].
Previous studies have shown that the use of different strains of lactic acid bacteria resulted in differences in the quantity and quality of flavor and aroma compounds, which is of particular importance in the production of traditional products [26]. The quality and repeatability of cheeses and the process of their production is guaranteed in the industry by the use of starter cultures; however, consumers prefer products produced in a traditional way, e.g., by natural methods of milk acidification, which ensure that better sensory characteristics are obtained as a result [27]. The cheese owes its unique and specific characteristics to the type of raw material used in its production, the microbiological quality of raw material, the degree of acidification of milk, the production technology, and the ripening conditions [28]. Raw-milk cheeses are considered to be rich in taste and are part of the cultural heritage of many countries. Different microorganisms, including bacteria, yeast, and mold, are simultaneously present in milk microbiota and many dairy products, especially those manufactured from raw milk [25]. This microbiota greatly contributes to the broad diversity of the characteristics of similar ripened products through variable dynamics during processing. These dynamics are largely influenced by interactions between microorganisms, e.g., microbial co-operation and antagonism, and have a marked impact on the survival, growth, and activity of the different microbial populations during the cheese production process [26]. It is therefore of primary importance to reliably quantify physiologically active populations, in terms of dynamic changes, in order to understand the role of each microbial population. LABs are the most commonly used bacteria in the production of fermented products. They not only have the ability to produce lactic acid but also produce specific compounds responsible for shaping the flavor, aroma, and texture characteristics of cheese. They carry out proteolysis and lipolysis by metabolizing proteins and fats [28]. The LABs undergo the autolysis and release intracellular enzymes involved in the transformation of various compounds during the ripening of cheese. LABs also produce antimicrobial compounds such as organic acids, diacetyl, acetoin, hydrogen peroxide, and bacteriocin. Bacteriocins are peptides with antimicrobial properties [29]. The positive effect of the LABs on the quality of cheese is due to the synthesis of compounds that give it a specific, identifying aroma. The most important volatile compounds formed by lactic fermentation bacteria are diacetyl, acetaldehyde, acetic acid, and ethanol. Other compounds such as fatty acids, alcohols, acetone, and esters are produced in much smaller quantities. The presence of such compounds in cheese improves safety, controls the fermentation process, accelerates ripening, and extends the shelf life of the product [30,31]. Thus, monitoring the number of selected lactic acid bacterial species during cheese ripening makes it possible to obtain a final product with excellent flavor and aroma characteristics as well as a product of high microbiological quality [20,31]. The results of our study indicated that the lowest numbers of the three different target microorganism cells of L. delbrueckii subsp. bulgaricus, S. thermophilus, and L. lactis subsp. cremoris were found in three batches of cheese immediately after production. Bacteria belonging to the S. thermophilus species were most abundant in all three batches of cheese immediately after production. Their number increased significantly after three months of ripening and remained at a comparable level for a further three months of ripening, showing a slightly decreasing trend. The number of bacteria of the L. lactis subsp. cremoris species remained at a similar level to that of the L. delbrueckii subsp. bulgaricus species immediately after production. The number of bacteria belonging to the L. lactis subsp. cremoris species increased moderately after three months of ripening and still increased after six months of ripening, becoming equal to the population of S. thermophilus after six months of ripening. Our results showed the lowest log increase in the L. delbrueckii subsp. bulgaricus bacterial population after six months of ripening. The results show a moderate logarithmic increase in the L. lactis subsp. cremoris bacterial population after three months of ripening in the three cheese batches tested and a dynamic logarithmic increase in the population of these bacteria after six months of ripening in relation to the initial amount immediately after production. The bacterial population belonging to the S. thermophilus species had the highest growth rate in the first three months of ripening (Figure 4A–C). Our study showed no significant differences in the evaluation results of the three cheese batches. The similar trends in the proliferation rate of target microorganisms in each of the three cheese batches tested probably result from the fact that milk for the production of these cheeses came from three neighboring farms with the same breed of cows and using a very similar feeding program for their cows.
The efficiency of our qPCR assays is not always the same. We are aware that the most common reasons for lower efficiencies are bad primers–probe design and non-optimal reaction conditions. Secondary structures like dimers and hairpins or inappropriate melting temperatures (Tm) might affect primer–template annealing, which results in poor amplification. In order to prevent such a situation, we used the Beacon Designer software (http://www.premierbiosoft.com/qpcr/) to analyze the secondary structure of the designed probe and primers. We checked the accuracy of the designed probe in terms of melting temperature, percentage of cytosine and guanine, and formation of cross dimers, self-dimers, and hairpins. We checked the specificity of the probe and primers in the NCBI BLAST database. We obtained satisfactory results. We also analyzed the purity of the isolated DNA samples with spectrophotometric measurements prior to qPCR. Purity was measured as the ratio of absorbance values at 260 and 280 nm, which correspond to the ratio of nucleic acids to other molecules. Despite the fact that the purity score did not fall below 1.8 for DNA, we obtained too low a qPCR efficiency in some reactions. The material from which we isolated DNA consisted of three different batches of cheese. Cheese is a difficult material for DNA isolation due to its high fat content and high calcium ion content, which can inhibit the efficiency of the PCR reaction. Thus, the higher the fat content of the examined material, the more difficult the DNA extraction procedure. The composition of dairy products greatly influences the efficiency of DNA extraction. The likely reason for obtaining too low a qPCR efficiency in some reactions was the necessity to isolate DNA from a very difficult material such as cheese, with its high fat content.
4. Materials and Methods
4.1. Cheese Production
For experimental purposes, three batches of artisanal cheese were made based on the traditional method using unpasteurized cow’s milk of very high microbiological quality. Milk used to make the cheese came from the selected organic farms of Podlasie region in Poland. Full-fat, unpasteurized cow’s milk with a fat content of 4.8% was heated to a temperature of 32 °C, and then, salt and rennet were added, causing the milk to coagulate within thirty minutes. The resulting curd was cut into cubes of about 5 cm thick and reheated to 42 °C. The cheese mass thus formed was placed in colanders to drain off the whey and carry out the acidification process of the cheese mass at 22 °C for 48 h. After 2 days of maturing, we obtained fresh cheese, after which we removed it from the colanders, rubbed the mass with salt, and placed the shaped cheeses on shelves in a maturing chamber at 12 °C. After maturing for 10 days, the cheese turned yellow in color and became slightly firmer on the surface and considerably drier. Its flavor was distinctive, with a slightly nutty note. The ripened form of the artisanal cheese was obtained after 6 months of ripening. We studied the multiplication rate of the selected three strains of lactic acid bacteria immediately after production as well as after 3 and 6 months of ripening in a ripening chamber at a temperature of 12 °C and air humidity of 80–85%.
4.2. DNA Extraction from the Cheese Samples
The study material was microbial DNA from cheese made from unpasteurized milk, which was isolated immediately after production and after three and six months of ripening. DNA was isolated from cheese by using Syngen Food DNA Mini Kit (Syngen Biotech, Wrocław, Poland). A 200 mg sample of cheese was weighed out. The AXIS ATA220 electronic laboratory balance with the precision of 0.001 g (Superwagi, Warsaw, Poland) with an internal calibration was used for precise cheese weighing. Cheese in an amount of 200 mg of the homogenized sample was placed in 2 mL tube; then, 1 mL of buffer DLF (2% cetyl trimethylammonium bromide (CTAB) (w/v), 1% polyvinylpyrrolidone-40 (PVP40) (w/v), 2% β-mercaptoethanol (v/v)) was added. The tube was closed and mixed by vortexing. Next, 30 µL of proteinase K (Bioron GmbH, Römerberg, Germany) was added; the tube was closed and mixed by vortexing and then incubated at 60 °C for 30 min. Then, it was centrifuged, and 700 µL of the supernatant was transferred to a new 2 mL tube. In some food samples, the three phases can be formed, which is due to the presence of various proteins contained in the cheese matrix, including casein and whey proteins. Then, 500 µL of chloroform was added, and the tube was closed and vortexed. Next, 350 µL of the upper phase was transferred to a new 2 mL tube, and then, 350 µL of buffer DWF (3 M guanidine chloride, 70% isopropyl alcohol (v/v)) was added. The column DF was placed in a 2 mL tube. All the material was transferred into the column DF. The tube was then centrifuged. The supernatant was discarded, and the column was transferred back to the tube. Next, 700 μL of buffer DPF (70% ethanol (v/v)) was added to the column. The column was centrifuged. The supernatant was discarded, and the column was transferred back to the tube. The column was centrifuged and transferred to a new 1.5 mL tube. Then, 100–200 μL of pre-warmed DE elution buffer (0.1 M Tris-ethylenediaminetetraacetic acid (EDTA), pH 7.5) was added at the center of the membrane and incubated at room temperature for 1 min. DE elution buffer helps protect resuspended DNA against degradation caused by pH changes that occur during freeze–thaw cycles. The lid was closed, and the tube was centrifuged for 1 min at maximum speed (18,000× g). The variation in DNA extraction efficiency was checked by the measurement of concentrations of extracted DNA. DNA concentrations were assessed by measuring absorbance using the spectrophotometer (Evolution 220, Thermo Fisher Scientific, Waltham, MA, USA), and the purity was evaluated based on its absorbance at 260–280 nm. An A260/A280 ratio of 1.8–2.0 characterizes high DNA quality. The extracted DNA had an A260/A280 ratio amounting to 1.8–2.0, which means it had high quality and purity, and the high efficiency of the DNA extraction procedure from the produced cheese was confirmed.
4.3. Designing Probes and Primers for Real-Time PCR Assays
GSMer software https://github.com/qichao1984/GSMer (accessed on 15 November 2023) was used to identify genome-specific markers (GSMs) from currently sequenced microbial genomes using a k-mer-based approach. A link to a file with the characteristic nucleotide sequences of the target microorganisms was downloaded from this program http://ieg.ou.edu/GSMer/allgsm_species.zip (accessed on 15 November 2023) and then opened with the tool http://glogg.bonnefon.org/download.html (accessed on 15 November 2023). The Excel file (http://ieg.ou.edu/GSMer/strain.xlsx (accessed on 15 November 2023)) was used to find the target species with their assigned signatures. The sequence file was then used to find the characteristic nucleotide sequences of the target microorganisms’ genes using their assigned signatures. NCBI Blast Nucleotide software (https://blast.ncbi.nlm.nih.gov/Blast.cgi (accessed on 15 November 2023)) was then used to find the sequence region of the characteristic gene, and then, primers and a probe were designed based on this region. Nucleotide sequences of the primers/probes sets used for the detection of L. delbrueckii subsp. bulgaricus, S. thermophilus, and L. lactis subsp. cremoris are shown in Table 2. The nucleotide primers/probe sets’ sequences for each lactic acid bacterial species are also provided in Table A1. The sequence of the genes were provided by GenBank (www.ncbi.nlm.nih.gov/Genbank/ accessed on 15 November 2023; Accession Numbers: CP019120.1, CP019935.1, and CP015900.1). The nucleotide sequences of the locus_tag=“LB080_06090” gene (localized from the nucleotide position 1,188,025 to 1,189,443 in the complete genome) that encodes the dipeptidase production unique to L. delbrueckii subsp. bulgaricus were compared with those of closely related strains. The nucleotide sequences of the locus _tag “B1761_07395” gene (localized from the nucleotide position 1,349,595 to 1,350,980 in the complete genome) that encodes the ATPase V production unique to Streptococcus thermophilus were compared with those of closely related strains. The nucleotide sequences of the locus_tag=“kw2_2318” gene (localized from the nucleotide position 2,391,233 to 2,393,926 in the complete genome) that encodes the “cation-transporting P-type ATPase” production unique to Lactococcus lactis subsp. cremoris were compared with those of closely related strains. These are the genes from which the amplicons were obtained.
The primers/probe sets were designed using Beacon Designer Software v8.0 (Premier Biosoft International, San Francisco, CA, USA). The sets were validated using NCBI BLAST (Basic Local Alignment Search Tool: www.ncbi.nlm.nih.gov/blast/ (accessed on 15 November 2023)). Thereby, the 60 bp region from the nucleotide position 1,188,781 to 1,188,841 within the locus_tag=“LB080_06090” gene was found to be a potential target site because it was identical in all examined L. delbrueckii subsp. bulgaricus strains but indicated variability in other LAB species.
The 60 bp region from the nucleotide position 1,349,701 to 1,349,761 within the locus _tag “B1761_07395” gene was found to be a potential target site because it was identical in all examined S. thermophilus strains but indicated variability in other LAB species.
The 60 bp region from the nucleotide position 2,393,641 to 2,393,701 within the locus _tag “LLJM2_2339” gene was found to be a potential target site because it was identical in all examined L. lactis subsp. cremoris strains but indicated variability in other LAB species. The TagMan probes had a FAM reporter dye at its 5′ end and an MGB-NFQ quencher dye at its 3′ end. The Beacon Designer v. 8 software was used to check the characterization of the probe designs in terms of Tm, GC content, and the free enthalpy of the decay reaction of the most stable II-row structure (deltaG).
The oligonucleotides were synthesized and bought from Eurofins Genomics (Germany). The fluorescence was detected using an optical detection system incorporated in the thermocycler of Stratagene Mx3005P (Real-Time PCR Detection System, Agilent Technologies, Santa Clara, CA, USA).
4.4. Bacterial Strains and Culture Conditions
The primer specificity test was carried out with the bacterial strains presented in Table 1. The concentration of bacterial cell culture was measured by spectrophotometer (Evolution 220, Thermoscientific, Waltham, MA, USA). L. delbrueckii subsp. bulgaricus was propagated in 10 mL of MRS broth at 42 °C, and S. thermophilus and L. lactis subsp. cremoris were propagated in 10 mL of M17 broth at 42 °C. Cells coming from a 2 mL late exponential growth-phase culture (A650 nm = 0.7–0.8) were collected by centrifugation at 3000× g for 5 min at 4–6 °C and stored at −20 °C until DNA extraction. Then, 1 mL of enrichment culture was pipetted into a 2 mL microcentrifuge screw-cap tube and was centrifuged at 13,000× g for 5 min. Then, the supernatant was discarded using a pipette. Care was taken to not disrupt the pellet. Then, 200 µL of Fast Lysis Buffer (Syngen Biotech, Frankfurt, Germany) was added to the bacterial pellet, the tube was tightly capped, and the pellet was resuspended by vigorous vortexing. Then, the microcentrifuge tube was placed into a thermal shaker (800× g) set to 100 °C. The sample was heated for 10 min. The sample was removed and cooled to room temperature (15–25 °C) for 2 min. The tube was centrifuged at 13,000× g for 5 min. After centrifugation, the supernatant was carefully transferred to a new tube, and 2 µL of this supernatant was used as the template.
4.5. Preparation of Standard Curves on the Basis of Solutions of Gene Fragments
The sequences of the genes were provided by GenBank (www.ncbi.nlm.nih.gov/Genbank/ (accessed on 15 November 2023); Accession Numbers: CP019120.1, CP019935.1, and CP004884.1, respectively). They were used to prepare serial dilutions of gene copies coming from L. delbrueckii subsp. bulgaricus, S. thermophilus, and L. lactis subsp. cremoris, respectively. A total of 1.27 × 10¹² DNA copies were dissolved in 1270 µL of DE buffer (Syngen Biotech, Wrocław, Poland), achieving a concentration of 1 × 10⁹ DNA copies/µL of eluate. The locus_tag=“LB080_06090”gene fragments of L. delbrueckii subsp. bulgaricus, the locus _tag “B1761_07395” gene fragments of S. thermophilus, and the locus_tag=“kw2_2318” gene fragments of L. lactis subsp. cremoris were cloned into plasmids, synthesized, and purchased from Eurofins Genomics (Ebersberg, Germany). They were delivered in the lyophilized form. Standard curves were prepared with serial dilutions of the sequence of the genes of the selected lactic acid bacteria. They were dissolved in 1270 µL of DE buffer (Syngen Biotech, Wrocław, Poland), achieving a concentration of 1 × 10⁹ DNA copies/µL of eluate. This concentration was used for the preparation of standards for standard curve. The dilutions were prepared to achieve 101 DNA copies/µL of eluate in the highest dilution. A tenfold dilution series of the PCR fragment solution for each bacterial species, covering 7 logs ranging from 101 to 107 DNA copies per reaction, was used to estimate the sensitivity of the method.
4.6. The Real-Time PCR Conditions
The volume of reaction mixture amounted to 20 μL. Real-time PCR analysis was carried out using Stratagene Mx3005P thermocycler (Agilent Technologies, Santa Clara, CA, USA). The PCR reaction mixture consisted of 5 μL (10 ng/μL) of DNA template; 4 μL of Quantum Probe Mix (Syngen Biotech, Cambridge, UK); 0.8 μL (0.4 μM) of primers F and R, respectively; 0.5 μL (0.25 μM) of hydrolysis probe; and 8.9 μL of PCR water. A non-template control (NTC) contained 5 µL of water instead of DNA and was included in each run. The real-time PCR cycling parameters were as follows: 1 cycle of amplification (95 °C for 5 min) and 35 cycles of amplification (94 °C for 30 s, 60 °C for 30 s, and 72 °C for 90 s). The fluorescence of the reporter dye (FAM) was measured during the amplification at 510 nm. The real-time PCR reaction and amplification step were performed using the DNA amplification curves being the subject of analysis. The calculation of the threshold cycle (CT) value was performed with the use of the Stratagene Mx3005P software version 2.1 (Agilent Technologies, Santa Clara, CA, USA). The CT value was described as the real-time PCR cycle, at which the generated fluorescence increased exponentially and exceeded its background level. The standard curves were created by plotting the threshold cycle (CT) values as a function of the concentration of recombinant “LB080_06090”standard gene copies of L. delbrueckii subsp. bulgaricus per µL, the locus _tag “B1761_07395” standard gene copies of S. thermophilus per µL, and the locus_tag=“kw2_2318” standard gene copies of L. lactis subsp. cremoris per µL. All standard and sample reactions were run in triplicate. The qPCR inhibition was checked using two basic approaches. The first method analyzed the quantification cycle (Cq) deviation of a spiked internal positive control. The second method considered variations in reaction efficiency based on the slopes of individual amplification plots. By combining those methods, we did not observe increased Cq values together with reduced amplification efficiencies.
4.7. Statistical Analysis
All measurements were performed in triplicate. Statistical analyses such as one-way ANOVA with Tukey’s test, calibration curves, and coefficients of determination were performed using Sigma plot v. 11 software (Systat Software, San Jose, CA, USA).
5. Conclusions
The proposed qPCR protocols are highly effective methods for accurate enumeration of the key lactic acid bacteria involved in cheese ripening. The cheeses examined in this study were made from unpasteurized milk, the microflora composition of which is highly variable compared to cheeses made from pasteurized milk with the addition of starter cultures, with an always-repeatable composition. However, cheeses made from unpasteurized milk have much richer taste and aroma qualities and are therefore highly desired by consumers. Our results show that certain lactic acid bacteria increase their numbers during different cheese ripening stages, while others decrease their numbers. Compared with the existing methods, the method developed in this study allows for a quantitative assessment of the selected species of autochthonous lactic acid bacteria from raw cow’s milk cheese to be conducted by the development of primers/probe sets based on the uniqueness of the genetic determinants with which the target microorganisms can be identified. We developed new genetic determinants for target LAB screening. Our newly developed detection systems were found to be very sensitive and reliable for a precise enumeration of L. delbrueckii subsp. bulgaricus, S. thermophilus, and L. lactis subsp. cremoris in the cheese samples.
Author Contributions
Conceptualization, M.A.S. and A.E.; methodology, M.A.S.; software, M.A.S., P.K., T.Ż. and B.K.; validation, M.A.S., P.K. and B.K.; formal analysis, M.A.S. and A.E.; investigation, M.A.S., A.E. and T.Ż.; resources, P.K. and B.K.; data curation, M.A.S. and T.Ż.; writing—original draft preparation, M.A.S. and T.Ż.; writing—review and editing, A.E., M.A.S. and B.K.; visualization, B.K.; supervision, B.K. and P.K.; project administration, M.A.S. and A.E.; funding acquisition, M.A.S. All authors have read and agreed to the published version of the manuscript.
Funding
The research was funded by Polish Ministry of Science and Higher Education, project No PBw.441.11.15.
Institutional Review Board Statement
Not applicable.
Informed Consent Statement
Not applicable.
Data Availability Statement
Data are contained within the article.
Conflicts of Interest
The authors declare no conflicts of interest.
Appendix A
Table A1.
The Tm values and primers/probe sets’ sequences used for qPCR analysis results presented in Table 1.
Table A1.
The Tm values and primers/probe sets’ sequences used for qPCR analysis results presented in Table 1.
| Bacteria Sample 1 | Tm Value (°C) | Primers/ Probe | Primers/Probe Sets’ Sequences (5′→ 3′) | Accession Number Provided by GenBank |
|---|---|---|---|---|
| Lactobacillus delbrueckii subsp. bulgaricus DSM 20080 | 77.23 | Forward primer | GCTTGTTTTTGGCAACAA | CP019120.1 |
| 77.41 | Reverse primer | AGTTGACTTTACTAGTGA | ||
| 77.29 | Probe | GACTTCATGTGGAGTGCAGGGATCCAGGAC | ||
| Lactobacillus delbrueckii subsp. bulgaricus ATCC 11842 | 77.33 | Forward primer | GCTTGTTTTTGGCAACAA | CR954253.1 |
| 77.81 | Reverse primer | AGTTGACTTTACTAGTGA | ||
| 77.51 | Probe | GACTTCATGTGGAGTGCAGGGATCCAGGAC | ||
| Lactobacillus delbrueckii subsp. bulgaricus ATCC BAA-365 | 77.51 | Forward primer | GCTTGTTTTTGGCAACAA | CP000412.1 |
| 77.38 | Reverse primer | AGTTGACTTTACTAGTGA | ||
| 77.62 | Probe | GACTTCATGTGGAGTGCAGGGATCCAGGAC | ||
| Lactobacillus delbrueckii subsp. bulgaricus L99 | 78.21 | Forward primer | GCTTGTTTTTGGCAACAA | CP017235.1 |
| 78.32 | Reverse primer | AGTTGACTTTACTAGTGA | ||
| 78.29 | Probe | GACTTCATGTGGAGTGCAGGGATCCAGGAC | ||
| Lactobacillus delbrueckii subsp. bulgaricus LBA-40 | 78.12 | Forward primer | GCTTGTTTTTGGCAACAA | CP102529.1 |
| 78.24 | Reverse primer | AGTTGACTTTACTAGTGA | ||
| 78.18 | Probe | GACTTCATGTGGAGTGCAGGGATCCAGGAC | ||
| Lactococcus lactis subsp. cremoris KW2 | 77.15 | Forward primer | TTGCTTCTACGATTAAT | CP004884.1 |
| 77.26 | Reverse primer | TAGTTGTAATTCCTCTTG | ||
| 77.38 | Probe | GAAGAGAGATTCATTACTTCTAGCGTTATAG | ||
| Lactococcus lactis subsp. cremoris A76 | 77.12 | Forward primer | TTGCTTCTACGATTAAT | CP003132.1 |
| 77.29 | Reverse primer | TAGTTGTAATTCCTCTTG | ||
| 77.18 | Probe | GAAGAGAGATTCATTACTTCTAGCGTTATAG | ||
| Lactococcus lactis subsp. cremoris MG1363 | 78.49 | Forward primer | TTGCTTCTACGATTAAT | AM406671.1 |
| 77.81 | Reverse primer | TAGTTGTAATTCCTCTTG | ||
| 78.12 | Probe | GAAGAGAGATTCATTACTTCTAGCGTTATAG | ||
| Lactococcus lactis subsp. cremoris NZ9000 | 77.39 | Forward primer | TTGCTTCTACGATTAAT | CP002094.1 |
| 78.61 | Reverse primer | TAGTTGTAATTCCTCTTG | ||
| 77.32 | Probe | GAAGAGAGATTCATTACTTCTAGCGTTATAG | ||
| Streptococcus thermophilus APC 151 | 78.31 | Forward primer | TAACAAGACGTCCCATGGT | CP019935.1 |
| 78.51 | Reverse primer | GTGTGTCAGCTATTGCTAC | ||
| 78.42 | Probe | GTGTCTATGGATCTGACTTCTAGTCTTAAC | ||
| Streptococcus thermophilus ATCC 19258 | 77.62 | Forward primer | TAACAAGACGTCCCATGGT | CP038020.1 |
| 78.48 | Reverse primer | GTGTGTCAGCTATTGCTAC | ||
| 77.47 | Probe | GTGTCTATGGATCTGACTTCTAGTCTTAAC | ||
| Streptococcus thermophilus CS18 | 77.51 | Forward primer | TAACAAGACGTCCCATGGT | CP030928.1 |
| 77.42 | Reverse primer | GTGTGTCAGCTATTGCTAC | ||
| 77.27 | Probe | GTGTCTATGGATCTGACTTCTAGTCTTAAC | ||
| Streptococcus thermophilus APC 151 | 77.14 | Forward primer | TAACAAGACGTCCCATGGT | CP019935.1 |
| 77.33 | Reverse primer | GTGTGTCAGCTATTGCTAC | ||
| 77.41 | Probe | GTGTCTATGGATCTGACTTCTAGTCTTAAC | ||
| Streptococcus thermophilus CS5 | 78.23 | Forward primer | TAACAAGACGTCCCATGGT | CP028896.1 |
| 78.43 | Reverse primer | GTGTGTCAGCTATTGCTAC | ||
| 78.48 | Probe | GTGTCTATGGATCTGACTTCTAGTCTTAAC | ||
| Streptococcus thermophilus ST3 | 78.35 | Forward primer | TAACAAGACGTCCCATGGT | CP017064.1 |
| 78.28 | Reverse primer | GTGTGTCAGCTATTGCTAC | ||
| 78.38 | Probe | GTGTCTATGGATCTGACTTCTAGTCTTAAC | ||
| Lactococcus lactis subsp. lactis 14B4 | nd 2 | Forward primer | TAAAGGAACCGAAGACG | CP028160.1 |
| nd | Reverse primer | GATGATGATTCTTGTGGA | ||
| nd | Probe | TAATTACTGACGGTTCTATCGTTCACGTTT | ||
| Lactococcus lactis subsp. lactis F44 | nd | Forward primer | TAAAGGAACCGAAGACG | CP024954.1 |
| nd | Reverse primer | GATGATGATTCTTGTGGA | ||
| nd | Probe | TAATTACTGACGGTTCTATCGTTCACGTTT | ||
| Lactococcus lactis subsp. lactis UL8 | nd | Forward primer | TAAAGGAACCGAAGACG | CP015908.1 |
| nd | Reverse primer | GATGATGATTCTTGTGGA | ||
| nd | Probe | TAATTACTGACGGTTCTATCGTTCACGTTT | ||
| Lactobacillus plantarum HFC8 | nd | Forward primer | GTTGCGGACTTTCAAGTGT | CP012650.1 |
| nd | Reverse primer | TCCGTGACCAGATAACCA | ||
| nd | Probe | CGGGTCAGCGCTCTGACTAGTTGGTTGACG | ||
| Lactobacillus plantarum 022AE | nd | Forward primer | GTTGCGGACTTTCAAGTGT | CP031127.2 |
| nd | Reverse primer | TCCGTGACCAGATAACCA | ||
| nd | Probe | CGGGTCAGCGCTCTGACTAGTTGGTTGACG | ||
| Lactobacillus plantarum W2 | nd | Forward primer | GTTGCGGACTTTCAAGTGT | CP091094.1 |
| nd | Reverse primer | TCCGTGACCAGATAACCA | ||
| nd | Probe | CGGGTCAGCGCTCTGACTAGTTGGTTGACG | ||
| Lactobacillus rhamnosus ATCC 11443 | nd | Forward primer | TTGCTGGATTCGCCTACTC | CP022109.1 |
| nd | Reverse primer | AGTACCGTCTGAGGTGT | ||
| nd | Probe | ATTGAACCCAAGTAAGGGTTGTAGATTTGA | ||
| Lactobacillus rhamnosus LR5 | nd | Forward primer | TTGCTGGATTCGCCTACTC | CP017063.1 |
| nd | Reverse primer | AGTACCGTCTGAGGTGT | ||
| nd | Probe | ATTGAACCCAAGTAAGGGTTGTAGATTTGA | ||
| Lactobacillus rhamnosus LMG 23550 | nd | Forward primer | TTGCTGGATTCGCCTACTC | CP136119.1 |
| nd | Reverse primer | AGTACCGTCTGAGGTGT | ||
| nd | Probe | ATTGAACCCAAGTAAGGGTTGTAGATTTGA | ||
| Escherichia coli NCCP_14540 | nd | Forward primer | AGCTCTGAATTAAGGGCC | CP042982.1 |
| nd | Reverse primer | ACTGGCGCTGACAATTGT | ||
| nd | Probe | GCCGCGTCCGCATCTCCATTACCGTCTTAT | ||
| Escherichia coli 2014_3057 | nd | Forward primer | AGCTCTGAATTAAGGGCC | CP027387.1 |
| nd | Reverse primer | ACTGGCGCTGACAATTGT | ||
| nd | Probe | GCCGCGTCCGCATCTCCATTACCGTCTTAT | ||
| Escherichia coli EPSSH018 | nd | Forward primer | AGCTCTGAATTAAGGGCC | CP125889.1 |
| nd | Reverse primer | ACTGGCGCTGACAATTGT | ||
| nd | Probe | GCCGCGTCCGCATCTCCATTACCGTCTTAT | ||
| Escherichia coli STEC411 | nd | Forward primer | AGCTCTGAATTAAGGGCC | CP061243.1 |
| nd | Reverse primer | ACTGGCGCTGACAATTGT | ||
| nd | Probe | GCCGCGTCCGCATCTCCATTACCGTCTTAT | ||
| Pseudomonas fluorescens SBW25 | 79.45 | Forward primer | CTCTCCGTACGTCACTGTA | OV986001.1 |
| 79.23 | Reverse primer | AGCGAGGTTCGAAGAAAA | ||
| 78.67 | Probe | TCTCCCGAGAGGTACACAATCTGATCGCGGA | ||
| Pseudomonas fluorescens L321 | 78.37 | Forward primer | CTCTCCGTACGTCACTGTA | CP015637.1 |
| 79.38 | Reverse primer | AGCGAGGTTCGAAGAAAA | ||
| 78.62 | Probe | TCTCCCGAGAGGTACACAATCTGATCGCGGA | ||
| Pseudomonas fluorescens NZ007 | nd | Forward primer | CTCTCCGTACGTCACTGTA | OV986001.1 |
| nd | Reverse primer | AGCGAGGTTCGAAGAAAA | ||
| nd | Probe | TCTCCCGAGAGGTACACAATCTGATCGCGGA |
1 10 ng of DNA; 2 nd, not detected with the Cq value > 40.
References
- Andrighetto, C.; Borney, F.; Barmaz, A.; Stefanon, B.; Lombardi, A. Genetic diversity of Streptococcus thermophilus strains isolated from Italian traditional cheeses. Int. Dairy J. 2002, 12, 141–144. [Google Scholar] [CrossRef]
- Cronin, T.; Ziino, M.; Condurso, C.; McSweeney, P.L.H.; Mills, S.; Ross, R.P.; Stanton, C. A survey of the microbial and chemical composition of seven semi-ripened Provola dei Nebrodi Sicilian cheeses. J. Appl. Microbiol. 2007, 103, 1128–1139. [Google Scholar] [CrossRef] [PubMed]
- Delbès, C.; Ali-Mandjee, L.; Montel, M.C. Monitoring bacterial communities in raw milk and cheese by culture-dependent and -independent 16S rRNA gene-based analysis. Appl. Environ. Microbiol. 2007, 73, 1882–1891. [Google Scholar] [CrossRef] [PubMed]
- Terzic-Vidojevic, A.; Vukasinovic, M.; Veljovic, K.; Ostojic, M.; Topisirovic, L. Characterization of microflora in homemade semi-hard white Zlatar cheese. Int. J. Food Microbiol. 2007, 114, 36–42. [Google Scholar] [CrossRef] [PubMed]
- Postollec, F.; Falentin, H.; Pavan, S.; Combrisson, J.; Sohier, D. Recent advances in quantitative PCR (qPCR) applications in food microbiology. Food Microbiol. 2011, 28, 848–861. [Google Scholar] [CrossRef] [PubMed]
- Jany, J.L.; Barbier, G. Culture-independent methods for identifying microbial communities in cheese. Food Microbiol. 2008, 25, 839–848. [Google Scholar] [CrossRef]
- Justé, A.; Thomma, B.P.H.J.; Lievens, B. Recent advances in molecular techniques to study microbial communities in food-associated matrices and processes. Food Microbiol. 2008, 25, 839–848. [Google Scholar] [CrossRef]
- Friedrich, U.; Lenke, J. Improved enumeration of lactic acid bacteria in mesophilic dairy starter cultures by using multiplex quantitative real-time PCR and flow cytometry fluorescence in situ hybridization. Appl. Environ. Microbiol. 2006, 72, 4163–4171. [Google Scholar] [CrossRef] [PubMed]
- Randazzo, C.L.; Caggia, C.; Neviani, E. Application of molecular approaches to study lactic acid bacteria in artisanal cheeses. J. Microbiol. Methods 2009, 78, 1–9. [Google Scholar] [CrossRef]
- Singh, S.; Goswami, P.; Singh, R.; Heller, K.J. Application of molecular identification tools for Lactobacillus, with a focus on discrimination between closely related species: A review. LWT-Food Sci. Technol. 2009, 42, 448–457. [Google Scholar] [CrossRef]
- De Candia, S.; De Angelis, M.; Dunlea, E.; Minervini, F.; McSweeney, P.L.H.; Faccia, M.; Gobbetti, M. Molecular identification and typing of natural whey starter cultures and microbiological properties of related traditional Mozzarella cheeses. Int. J. Food Microbiol. 2007, 119, 182–191. [Google Scholar] [CrossRef]
- Furet, J.P.; Quénée, P.; Tailliez, P. Molecular quantification of lactic acid bacteria in fermented milk products using real-time quantitative PCR. Int. J. Food Microbiol. 2004, 97, 197–207. [Google Scholar] [CrossRef]
- Quigley, L.O.; Sullivan, O.; Beresford, T.P.; Ross, R.P.; Fitzgerald, G.F.; Cotter, P.D. Molecular approaches to analysing the microbial composition of raw milk and raw milk cheese. Int. J. Food Microbiol. 2011, 150, 81–94. [Google Scholar] [CrossRef] [PubMed]
- Sohier, D.; Jamet, E.; Le Dizes, A.S.; Dizin, M.; Pavan, S.; Postollec, F.; Coton, E. Polyphasic approach for quantitative analysis of obligately heterofermentative Lactobacillus species in cheese. Food Microbiol. 2012, 31, 271–277. [Google Scholar] [CrossRef] [PubMed]
- Coppola, S.; Fusco, V.; Andolfi, R.; Aponte, M.; Blaiotta, G.; Ercolini, D.; Moschetti, G. Evaluation of microbial diversity during the manufacture of Fior di Latte di Agerola, a traditional raw milk pasta-filata cheese of the Naples area. J. Dairy Res. 2006, 73, 264–272. [Google Scholar] [CrossRef]
- Blaiotta, G.; Fusco, V.; Ercolini, D.; Aponte, M.; Pepe, O.; Villani, F. Lactobacillus strains diversity based on partial hsp60 gene sequences and design of PCR-restriction fragment length polymorphism assays for species identification and differentiation. Appl. Environ. Microbiol. 2008, 74, 208–215. [Google Scholar] [CrossRef]
- Coppola, R.; Nanni, M.; Iorizzo, M.; Sorrentino, A.; Sorrentino, E.; Chiavari, C.; Grazia, L. Microbiological characteristics of Parmigiano Reggiano cheese during the cheese-making and the first months of the ripening. Microbiology and fermentation compounds. Lait 2000, 80, 479–490. [Google Scholar] [CrossRef]
- Coppola, R.; Nanni, M.; Succi, M.; Sorrentino, A.; Iorizzo, M.; Chiavari, C.; Grazia, L. Enumeration of thermophilic lactic bacteria in ripened cheese manufactured from raw milk. Milchwissenscaft 2001, 56, 140–142. [Google Scholar]
- Chamba, J.F. Emmental cheese: A complex microbial ecosystem. Consequences on selection and use of starters. Sci. Des Aliment. 2000, 20, 37–54. [Google Scholar] [CrossRef]
- Charlet, M.; Duboz, G.; Faurie, F.; Le Quéré, J.L.; Berthier, F. Multiple interactions between Streptococcus thermophilus, Lactobacillus helvetius and Lactobacillus delbrueckii strongly affect their growth kinetics during the making of hard cooked cheeses. Int. J. Food Microbiol. 2009, 131, 10–19. [Google Scholar] [CrossRef]
- Arizcun, C.; Barcina, Y.; Torr, P. Identification of lactic acid bacteria isolated from Roncal and Idiazabal cheeses. Lait 1997, 77, 729–736. [Google Scholar] [CrossRef]
- Berthier, F.; Beuvier, E.; Dasen, A.; Grappin, R. Origin and diversity of mesophilic lactobacilli in Comté cheese, as revealed by PCR with repetitive and species-specific primers. Int. Dairy J. 2001, 11, 293–305. [Google Scholar] [CrossRef]
- Beresford, T.P.; Fitzsimons, N.A.; Brennan, N.L.; Cogan, T.M. Recent advances in cheese microbiology. Int. Dairy J. 2001, 11, 259–274. [Google Scholar] [CrossRef]
- Carraro, L.; Maifreni, M.; Bartolomeoli, I.; Martino, M.E.; Novelli, E.; Frigo, F.; Marino, M.; Cardazzo, B. Comparison of culture-dependent and -independent methods for bacterial community monitoring during Montasio cheese manufacturing. Res. Microbiol. 2011, 162, 231–239. [Google Scholar] [CrossRef] [PubMed]
- Falentin, H.; Postollec, F.; Parayre, S.; Henaff, N.; Le Bivic, P.; Richoux, R.; Thierry, A.; Sohier, D. Specific metabolic activity of ripening bacteria quantified by real-time reverse transcription PCR throughout Emmental cheese manufacture. Int. J. Food Microbiol. 2010, 144, 10–19. [Google Scholar] [CrossRef] [PubMed]
- Penna, A.L.P.; Mirna Lucia Gigante, M.L.; Todorov, S.D. Artisanal Brazilian Cheeses—History, Marketing, Technological and Microbiological Aspects. Foods 2021, 10, 1562. [Google Scholar] [CrossRef] [PubMed]
- Castilho, A.C.B.; Stafussa, A.P.; Ribeiro, J.C.B.; dos Santos Pozza, M.S.; Tormo, H.; Madrona, G.S. Quality assessment of artisanal cheeses in the northwest region of Paraná. J. Dairy Res. 2021, 88, 95–97. [Google Scholar] [CrossRef] [PubMed]
- Campos, G.Z.; Lacorte, G.A.; Jurkiewicz, C.; Hoffmann, C.; Landgraf, M.; Franco, B.D.G.M.; Pinto, U.M. Microbiological characteristics of Canastra cheese during manufacturing and ripening. Food Control 2021, 121, 107598. [Google Scholar] [CrossRef]
- Pegoraro, K.; Sereno, M.J.; Cavicchioli, V.Q.; Viana, C.; Nero, L.A.; Bersot, L.S. Bacteriocinogenic potential of lactic acid bacteria isolated from artisanal Colonial type-cheese. Arch. Vet. Sci. 2020, 25, 35–44. [Google Scholar] [CrossRef][Green Version]
- Margalho, L.P.; Jorge, G.P.; Noleto, D.A.P.; Silva, C.E.; Abreu, J.S.; Piran, M.V.F.; Brocchi, M.; Sant’Ana, A.S. Biopreservation and probiotic potential of a large set of lactic acid bacteria isolated from Brazilian artisanal cheeses: From screening to in product approach. Microbiol. Res. 2021, 242, 126622. [Google Scholar] [CrossRef]
- Andretta, M.; Almeida, T.T.; Ferreira, L.R.; Carvalho, A.F.; Yamatogi, R.S.; Nero, L.A. Microbial safety status of Serro artisanal cheese produced in Brazil. J. Dairy Sci. 2019, 102, 10790–10798. [Google Scholar] [CrossRef] [PubMed]
Disclaimer/Publisher’s Note: The statements, opinions and data contained in all publications are solely those of the individual author(s) and contributor(s) and not of MDPI and/or the editor(s). MDPI and/or the editor(s) disclaim responsibility for any injury to people or property resulting from any ideas, methods, instructions or products referred to in the content. |
© 2024 by the authors. Licensee MDPI, Basel, Switzerland. This article is an open access article distributed under the terms and conditions of the Creative Commons Attribution (CC BY) license (https://creativecommons.org/licenses/by/4.0/).