
Exploring Geometrical, Electronic and Spectroscopic Properties of 2-Nitroimidazole-Based Radiopharmaceuticals via Computational Chemistry Methods


Abstract
1. Introduction
2. Results and Discussion
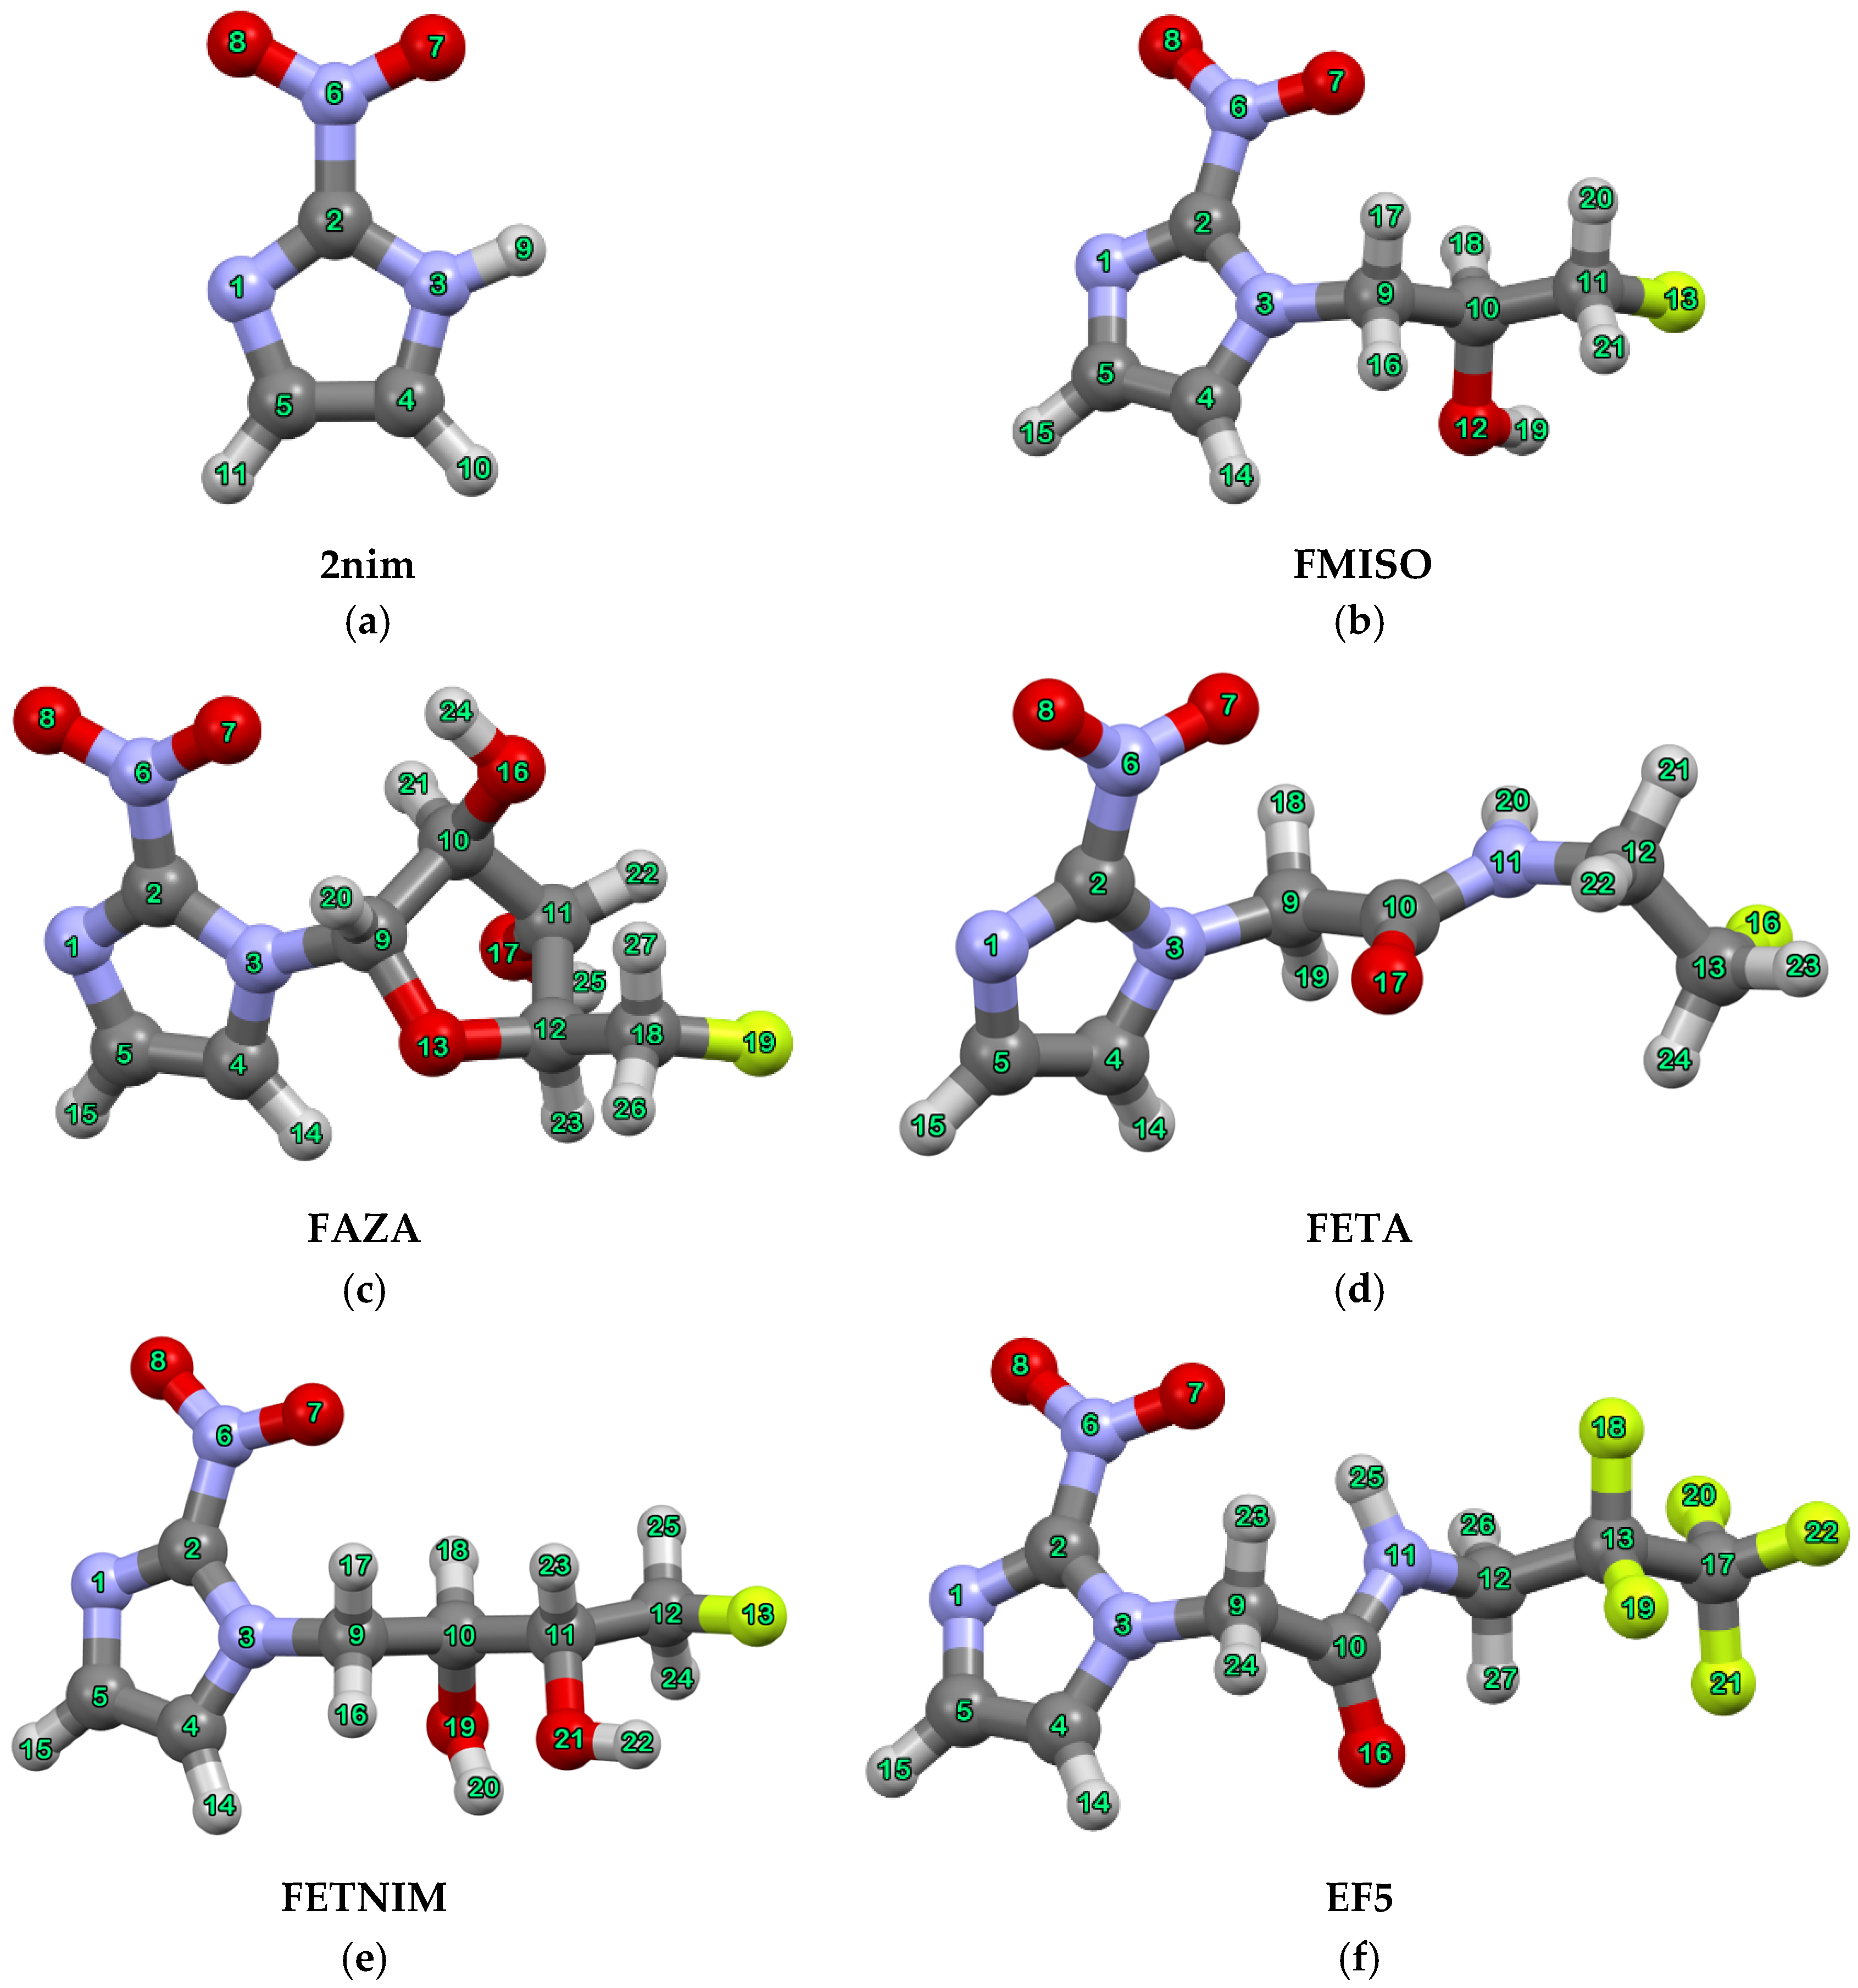
2.1. Conformers and Boltzmann Population Analysis
- FMISO: 1g ↔ 1w, 2g ↔ 3w, 3g ↔ 5w, 4g ↔ 2w, 5g ↔ 4w
- FETNIM: 1g ↔ 1w, 2g ↔ 3w, 3g ↔ 2w, 4g ↔ 4w, 5g ↔ 5w, 6g ↔ 6w, 7g ↔ 7w
- FAZA: 1g ↔ 1w, 2g ↔ 3w, 3g ↔ 2w
- FETA: 1g ↔ 2w, 2g ↔ 1w
- EF5: 1g ↔ 1w, 2g ↔ 2w
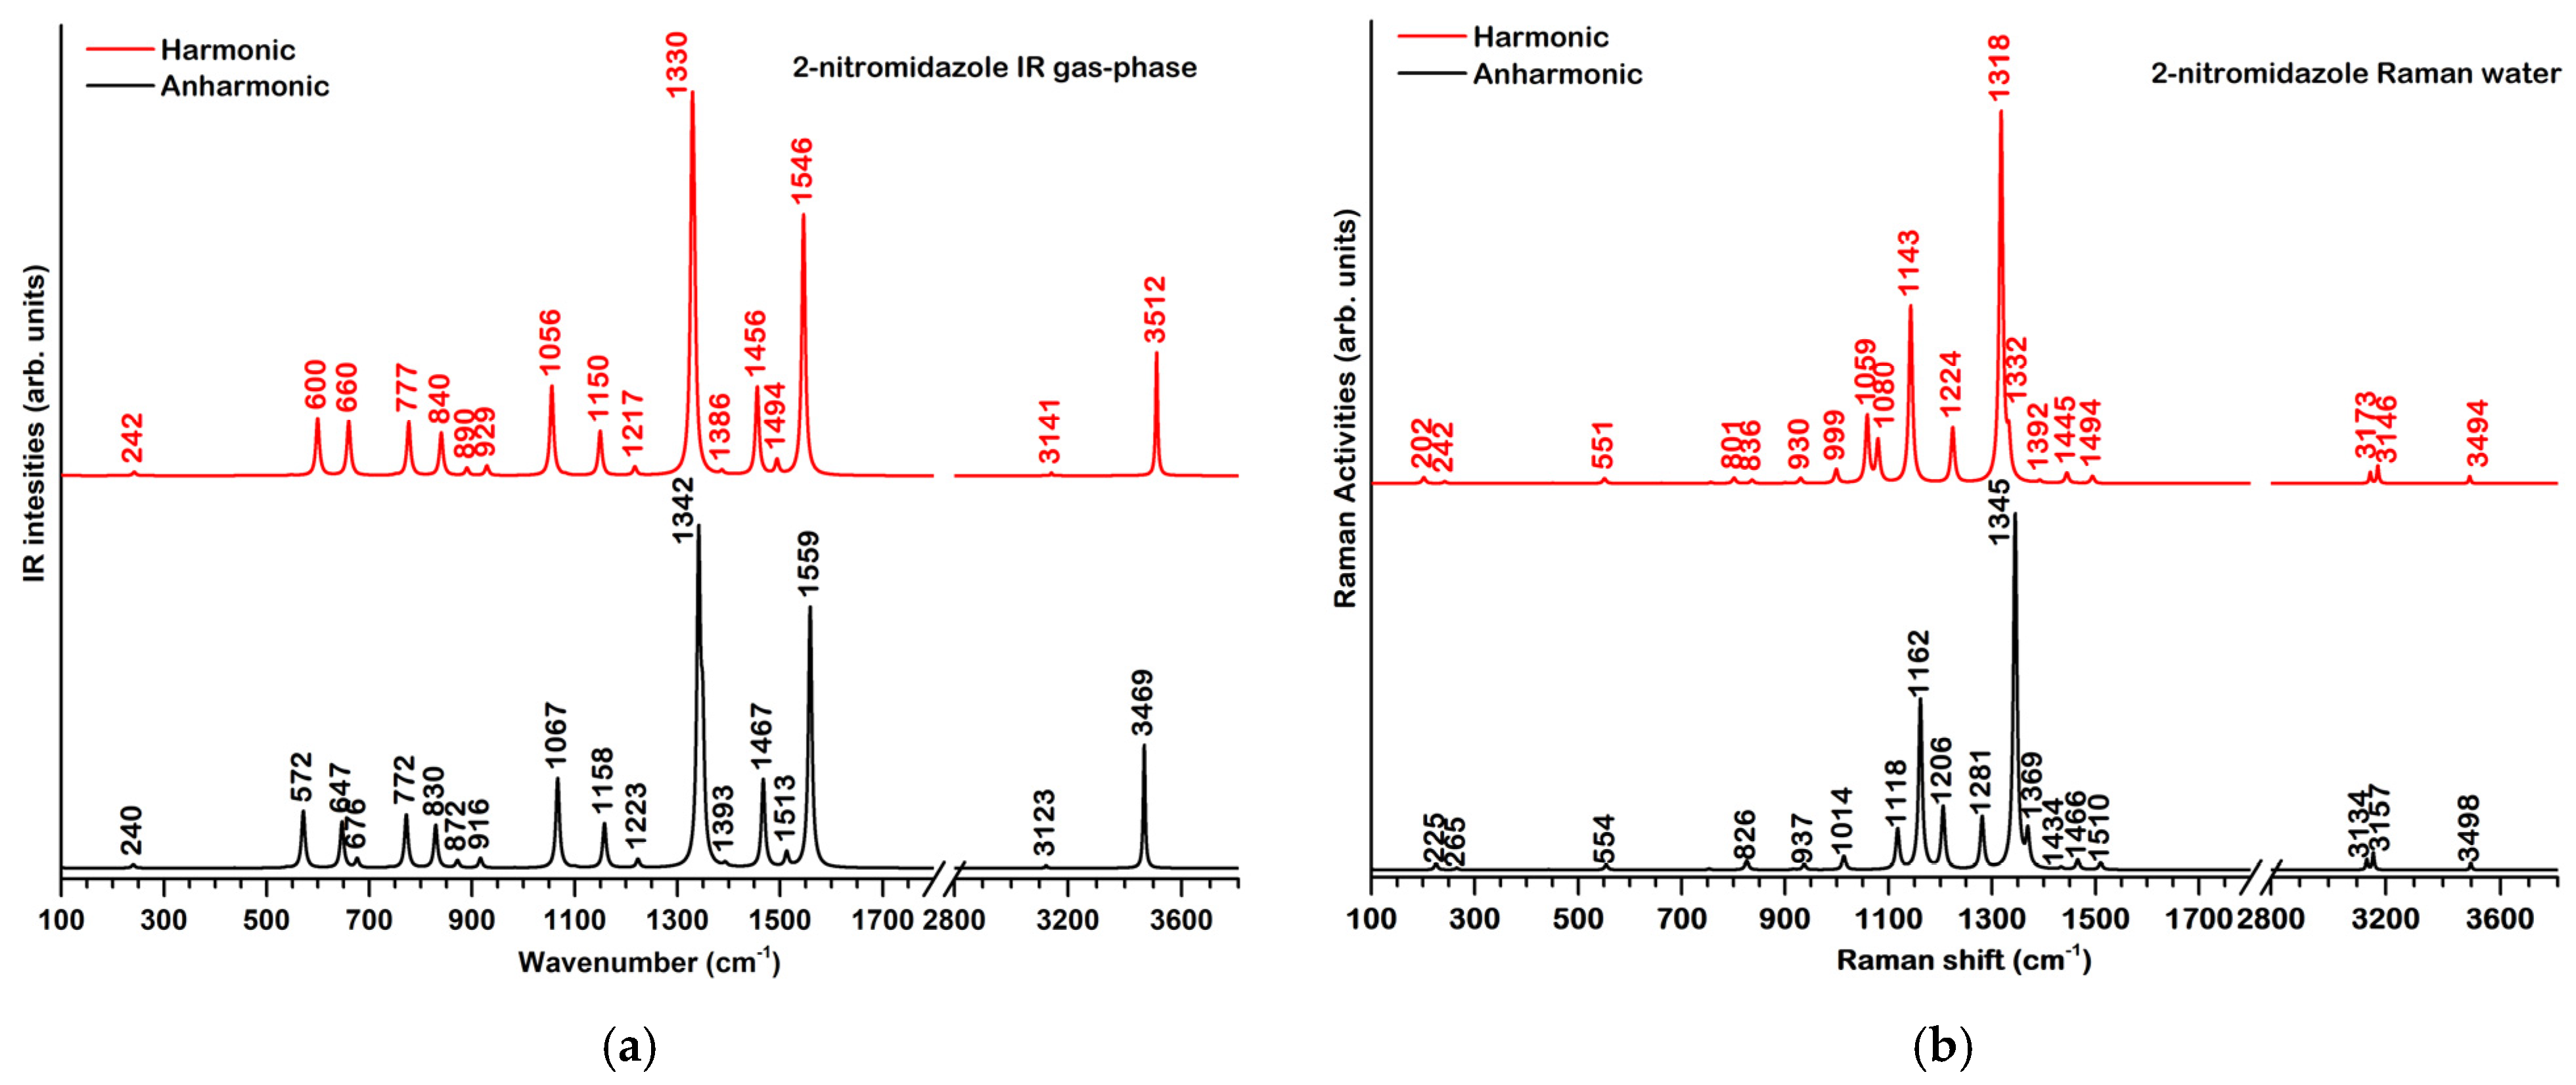
2.2. Vibrational Properties
2.2.1. 2-Nitroimidazole
2.2.2. 2-Nitroimidazole Derivatives
2.3. NMR Data

| Nucleus a | Experimental Data b | Calculated Data d | ||
|---|---|---|---|---|
| Chemical Shift (ppm) | J Coupling (Hz) | Chemical Shift (ppm) | J Coupling (Hz) | |
| H(14) H(15) | 7.64, 7.22 7.20, 7.15 | 7.44, 7.35 | - | |
| H(16) | 4.00–4.10 4.30–4.26 | n.a. c | 3.90 | - |
| H(17) | 4.65 4.77 | 13.70, 3.60 13.00, 3.00 | 4.76 | 2JH17H16 = 12.70 4JH17H19 = 2.32 |
| H(18) | 4.48–4.58 4.54–4.57 | n.a. | 4.55 | - |
| H(19) | 5.64 5.30 | n.a. | 2.17 | - |
| H(20) H(21) | 4.32–4.46 4.32–4.52 | n.a. | 4.94, 4.89 | - |
| C(2) | 144.91 | n.a. | 154.60 | - |
| C(4) C(5) | 128.52, 127.35 | n.a. | 140.81, 136.10 | - |
| C(9) | 51.41 | 7.60 | 55.40 | 3JC9H19 = 8.26 |
| C(10) | 67.70 | 19.30 | 76.19 | 3JC10F13 = 15.15 |
| C(11) | 84.58 | 169.10 | 93.08 | 1JC11H21 = 147.9 |
| F(13) | −230.70 | 46.00 19.00 | −266.16 | 2JF13H20 = 46.46 2JF13H21 = 49.90 3JF13H18 = 12.79 |
| Nucleus a | Experimental Data b | Calculated Data d | ||
|---|---|---|---|---|
| Chemical Shift (ppm) | J Coupling (Hz) | Chemical Shift (ppm) | J Coupling (Hz) | |
| H(14) | 7.79/7.68 | 1.00/1.00 | 7.72 | 3JH14H15 = 0.86 |
| H(15) | 7.28/7.14 | 1.00/1.00 | 7.43 | 3JH15H14 = 0.86 |
| H(20) | 6.48/6.44 | 1.00/1.50 | 6.40 | 3JH20H21 = 1.92 |
| H(21) | 4.13/4.66 | 2.10/n.a. c | 4.39 | 3JH21H22 = 3.48 |
| H(22) | 4.62/4.50 | n.a./6.00, 2.00 1.50 | 4.79 | 3JH22H23 = 8.06 3JH22H21 = 4.13 4F16H22 = 2.50 |
| H(23) | 4.56/4.60 | n.a./n.a. | 4.30 | - |
| H(26) | 4.66/4.20 | n.a./57.00 | 5.09 | JF19H26 = 51.17 |
| H(27) | 4.66/4.20 | n.a./57.00 | 4.87 | JF19H27 = 47.22 |
| C(4) | 123.80/125.22 | n.a./125.22 | 130.62 | - |
| C(5) | 126.90/128.25 | n.a./128.25 | 137.12 | - |
| C(9) | 95.50/96.80 | n.a./n.a. | 104.38 | - |
| C(10) | 82.20/83.63 | n.a./n.a. | 94.92 | - |
| C(11) | 75.80/77.21 | 5.60/4.70 | 82.28 | 3JF19C11 = 6.54 |
| C(12) | 87.70/89.04 | 20.60/20.60 | 88.67 | 2JF19C12 = 13.61 |
| C(18) | 82.20/83.63 | 170.00/169.70 | 85.30 | 1JF19C18 = −212.43 |
| F(19) | −227.20 d/ −147.72 e | n.a./n.a. | −273.48 d/ −180.55 e | - |
| Nucleus a | Experimental Data b | Calculated Data d | ||
|---|---|---|---|---|
| Chemical Shift (ppm) | J Coupling (Hz) | Chemical Shift (ppm) | J Coupling (Hz) | |
| H(14) | 7.40 | 1.30 | 7.42 | 3JH14H15 = 0.81 |
| H(15) | 7.14 | 1.30 | 7.43 | 3JH15H14 = 0.81 |
| H(18) | 4.83 | n.a. c | <5.07> | - |
| H(19) | ||||
| H(21) | 3.50 | 26.75 | <3.75> | <3JFH>trans = 27.09 |
| H(22) | 4.80 | <3JHH>cis = 5.71 | ||
| H(23) | 4.44 | 47.50 | <4.70> | <2JFH> = 49.25 |
| H(24) | 4.80 | <3JHH> = 5.71 | ||
| Nucleus a | Experimental Data b | Calculated Data d | ||
|---|---|---|---|---|
| Chemical Shift (ppm) | J Coupling (Hz) | Chemical Shift (ppm) | J Coupling (Hz) | |
| H(14) | 7.54 | n.a. c | 7.63 | - |
| H(15) | 7.15 | n.a. | 7.43 | - |
| H(23) | 5.37 | n.a. | <5.22> | - |
| H(24) | ||||
| H(25) | 8.22 | n.a. | 7.14 | - |
| H(26) | 4.06 | n.a. | <3.97> | - |
| H(27) | ||||
| F(21,22) | −81.70 | n.a. | −102.33 | - |
| F(18,19) | −118.76 | 16.00 | −145.50 | 3JFF = 19.15 |
| Nucleus a | Experimental Data b | Calculated Data d | ||
|---|---|---|---|---|
| Chemical Shift (ppm) | J Coupling (Hz) | Chemical Shift (ppm) | J Coupling (Hz) | |
| H(9) | n.a. | n.a. c | 10.14 | - |
| H(10) H11 | 7.41 7.26 | n.a. | 7.54 | - |
| C(2) | 146.10 | n.a. | 154.95 | - |
| C(4) C(5) | 126.35 | n.a | <134.78> | - |
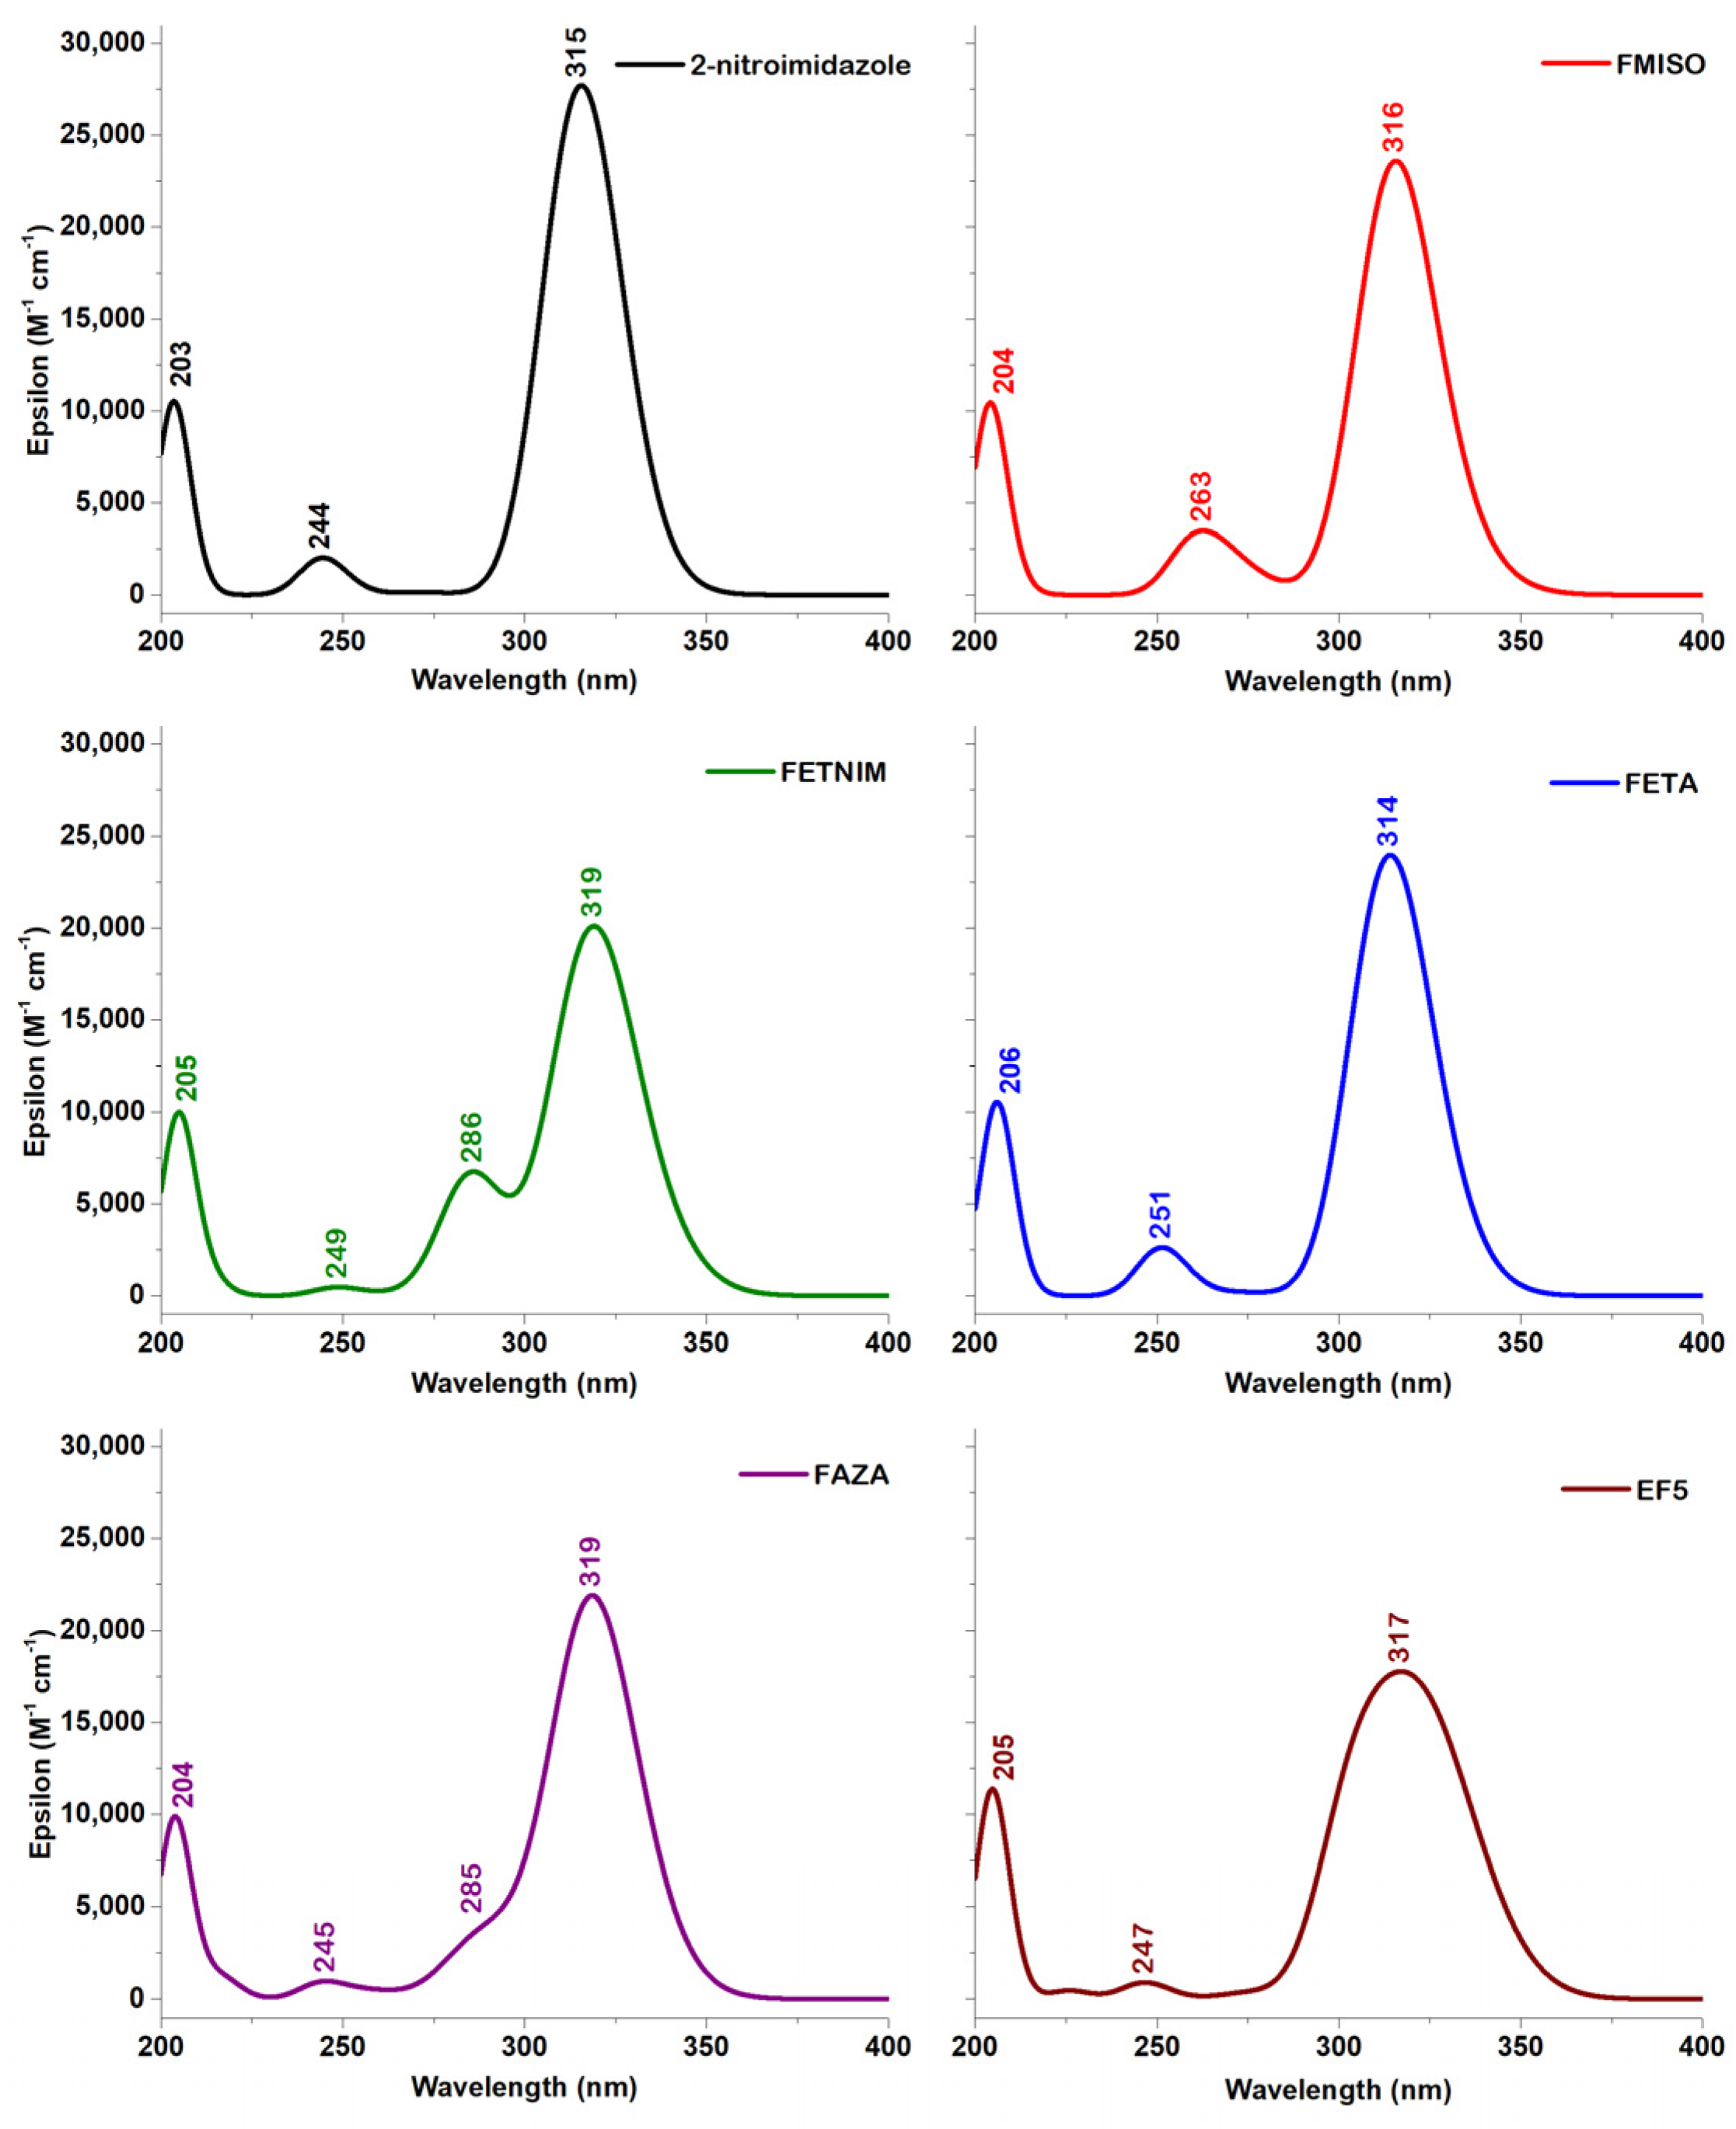
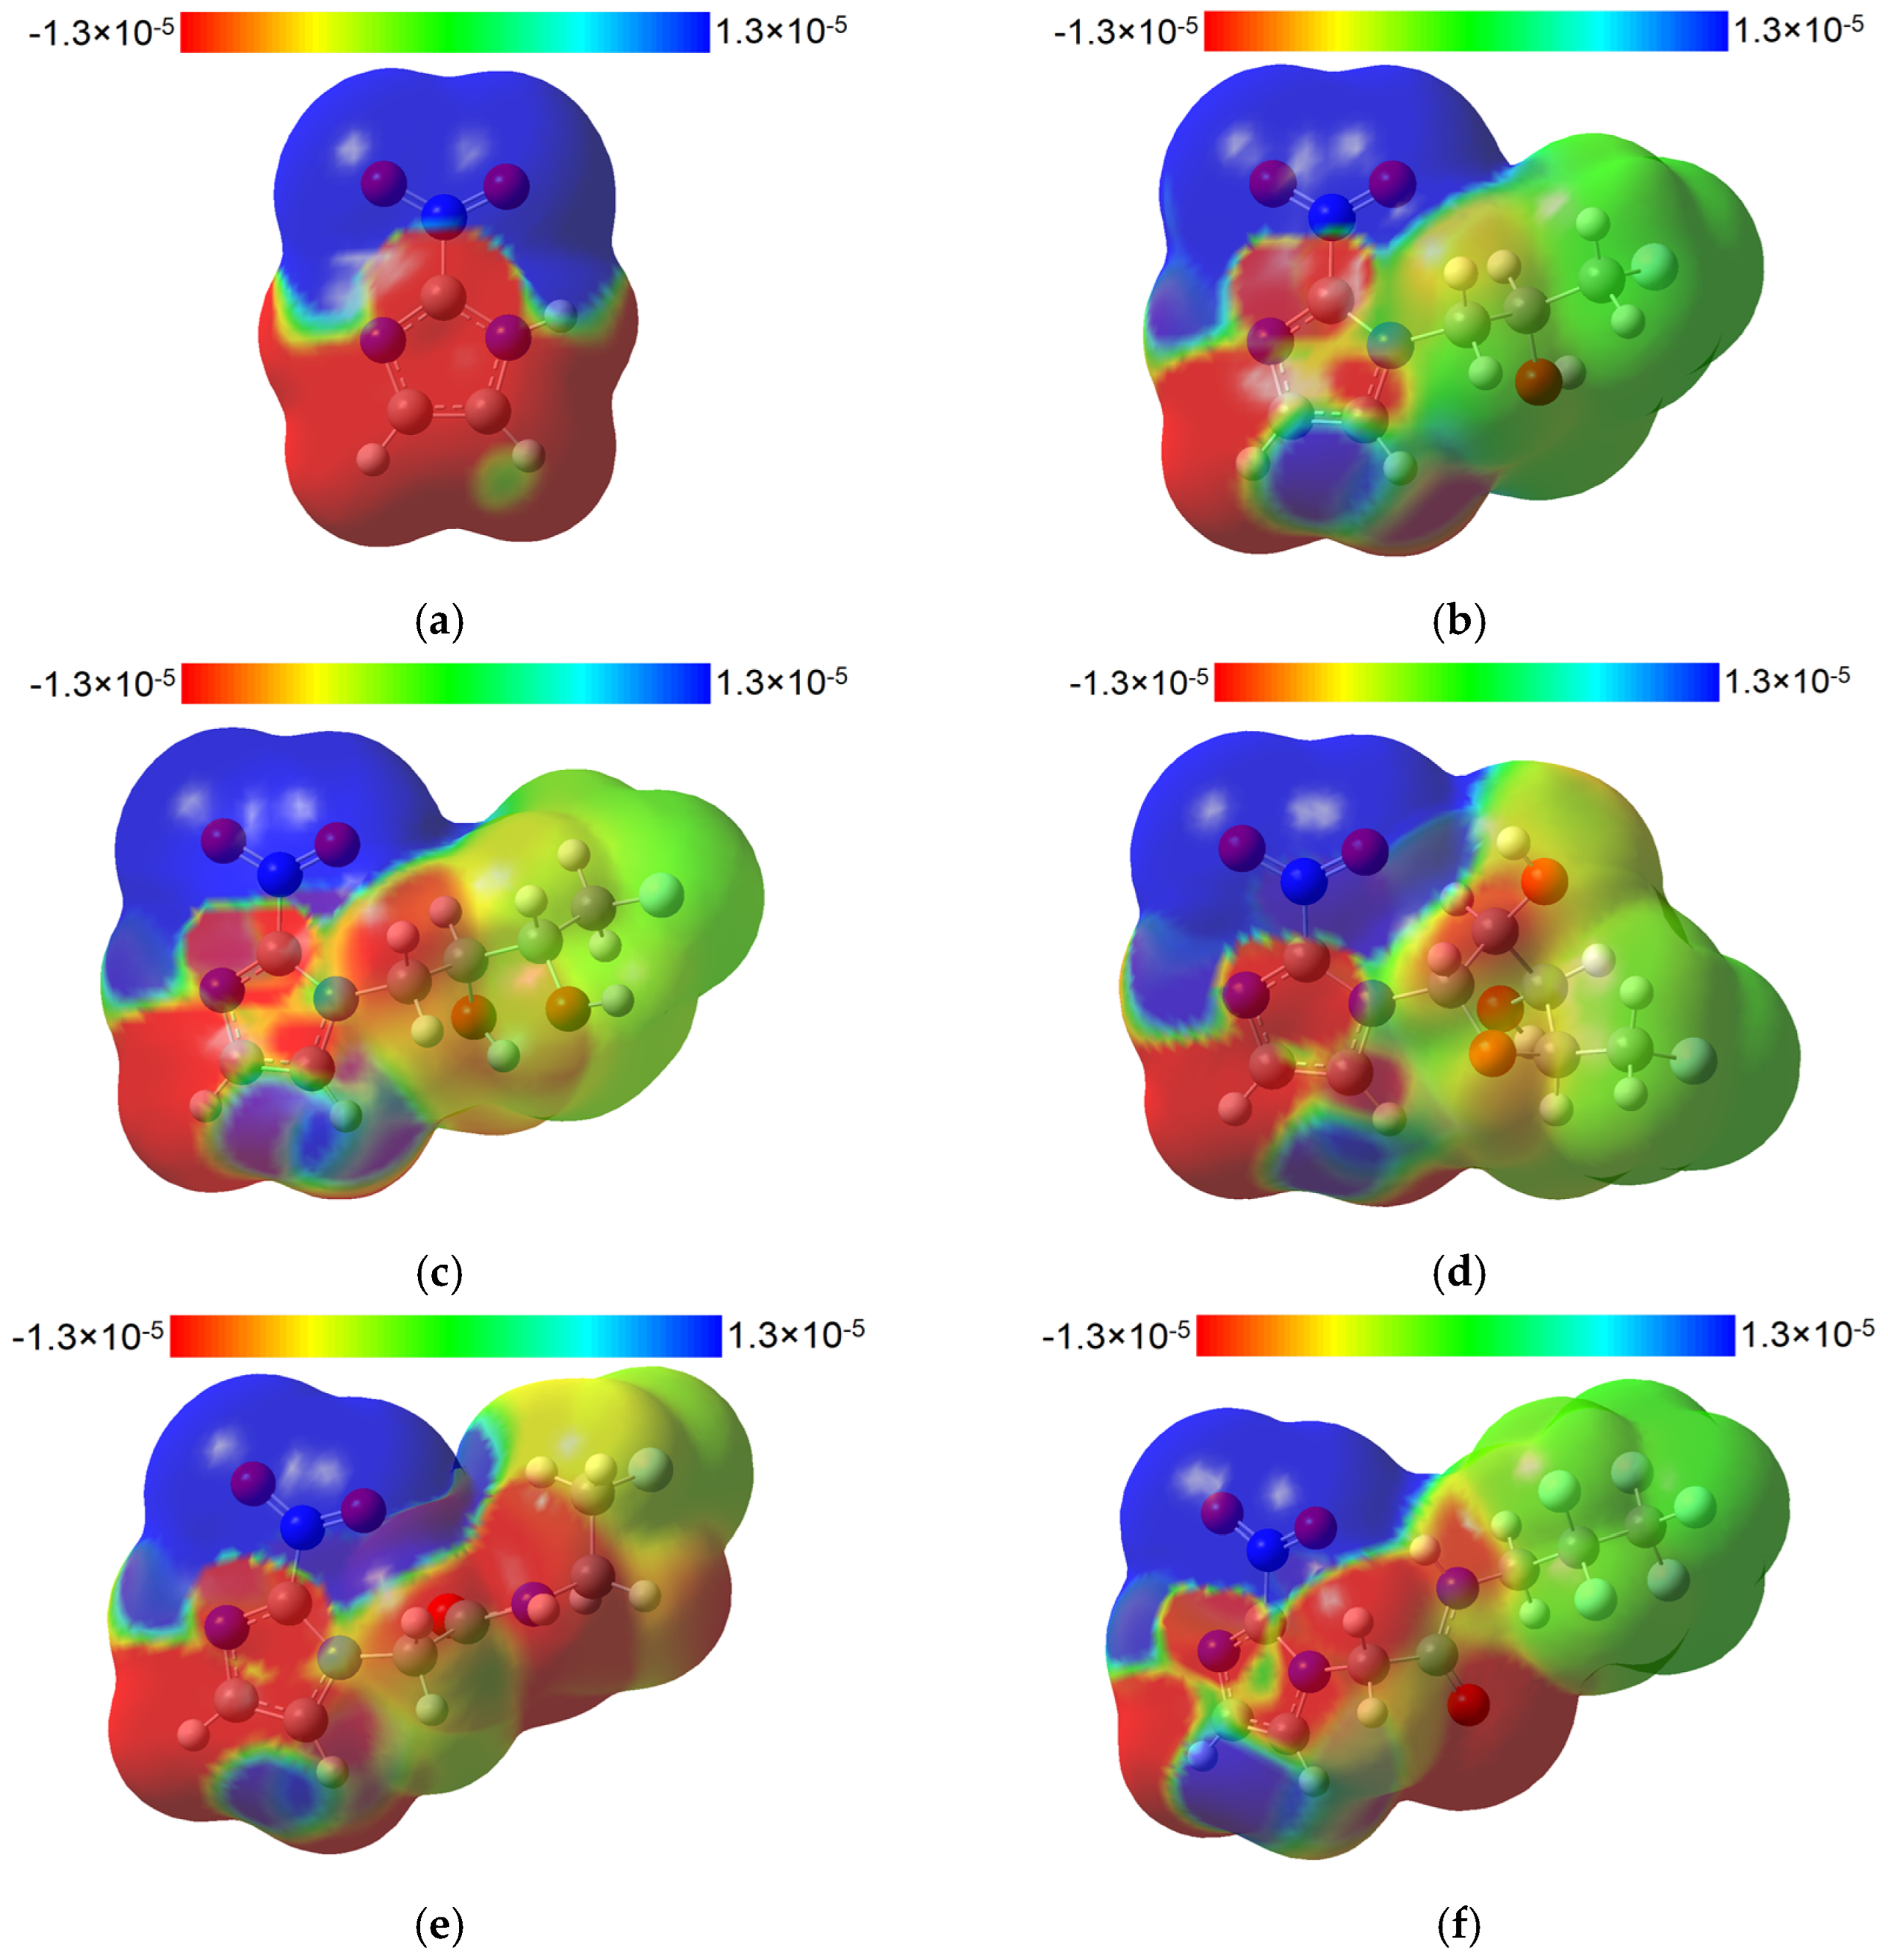
2.4. TD-DFT Data
2.4.1. 2-Nitroimidazole
2.4.2. 2-Nitroimidazole Derivatives
3. Materials and Methods
4. Conclusions
Supplementary Materials
Author Contributions
Funding
Institutional Review Board Statement
Informed Consent Statement
Data Availability Statement
Conflicts of Interest
References
- Emami Nejad, A.; Najafgholian, S.; Rostami, A.; Sistani, A.; Shojaeifar, S.; Esparvarinha, M.; Nedaeinia, R.; Haghjooy Javanmard, S.; Taherian, M.; Ahmadlou, M.; et al. The Role of Hypoxia in the Tumor Microenvironment and Development of Cancer Stem Cell: A Novel Approach to Developing Treatment. Cancer Cell. Int. 2021, 21, 62. [Google Scholar] [CrossRef]
- Sørensen, B.S.; Horsman, M.R. Tumor Hypoxia: Impact on Radiation Therapy and Molecular Pathways. Front. Oncol. 2020, 10, 562. [Google Scholar] [CrossRef]
- Hompland, T.; Fjeldbo, C.S.; Lyng, H. Tumor Hypoxia as a Barrier in Cancer Therapy: Why Levels Matter. Cancers 2021, 13, 499. [Google Scholar] [CrossRef] [PubMed]
- Mittal, S.; Mallia, M.B. Molecular Imaging of Tumor Hypoxia: Evolution of Nitroimidazole Radiopharmaceuticals and Insights for Future Development. Bioorg. Chem. 2023, 139, 106687. [Google Scholar] [CrossRef] [PubMed]
- Huang, Y.; Fan, J.; Li, Y.; Fu, S.; Chen, Y.; Wu, J. Imaging of Tumor Hypoxia With Radionuclide-Labeled Tracers for PET. Front. Oncol. 2021, 11, 731503. [Google Scholar] [CrossRef]
- Crișan, G.; Moldovean-Cioroianu, N.S.; Timaru, D.-G.; Andrieș, G.; Căinap, C.; Chiș, V. Radiopharmaceuticals for PET and SPECT Imaging: A Literature Review over the Last Decade. Int. J. Mol. Sci. 2022, 23, 5023. [Google Scholar] [CrossRef]
- Rashed, F.B.; Diaz-Dussan, D.; Mashayekhi, F.; Macdonald, D.; Nation, P.N.; Yang, X.-H.; Sokhi, S.; Stoica, A.C.; El-Saidi, H.; Ricardo, C.; et al. Cellular mechanism of action of 2-nitroimidazoles as hypoxia-selective therapeutic agents. Redox Biol. 2022, 52, 102300. [Google Scholar] [CrossRef] [PubMed]
- Hsieh, C.-J.; Giannakoulias, S.; Petersson, E.J.; Mach, R.H. Computational Chemistry for the Identification of Lead Compounds for Radiotracer Development. Pharmaceuticals 2023, 16, 317. [Google Scholar] [CrossRef]
- Moldovean, S.N.; Timaru, D.-G.; Chiş, V. All-Atom Molecular Dynamics Investigations on the Interactions between D2 Subunit Dopamine Receptors and Three 11C-Labeled Radiopharmaceutical Ligands. Int. J. Mol. Sci. 2022, 23, 2005. [Google Scholar] [CrossRef]
- Feng, J.; Zhou, P.; Qin, C.; Chen, R.; Chen, Q.; Li, L.; Chen, J.; Cheng, H.; Huang, W.; Cao, J. Magnetic solid-phase extraction-based surface-enhanced Raman spectroscopy for label-free therapeutic drug monitoring of carbamazepine and clozapine in human serum. Spectrochim. Acta A 2024, 310, 123924. [Google Scholar] [CrossRef]
- Jurina, T.; Cvetnić, T.S.; Šalić, A.; Benković, M.; Valinger, D.; Kljusurić, J.G.; Zelić, B.; Jurinjak Tušek, A. Application of Spectroscopy Techniques for Monitoring (Bio)Catalytic Processes in Continuously Operated Microreactor Systems. Catalysts 2023, 13, 690. [Google Scholar] [CrossRef]
- Willoughby, P.H.; Jansma, M.J.; Hoye, T.R. A Guide to Small-Molecule Structure Assignment through Computation of (1H and 13C) NMR Chemical Shifts. Nat. Protoc. 2014, 9, 643–660. [Google Scholar] [CrossRef] [PubMed]
- Lopes Jesus, A.J.; Jarmelo, S.; Fausto, R.; Reva, I. Conformational Preferences of 3,4-Dihydroxyphenylacetic Acid (DOPAC). Spectrochim. Acta A 2015, 140, 54–64. [Google Scholar] [CrossRef] [PubMed]
- Ducasse, L.; Castet, F.; Fritsch, A.; Huc, I.; Buffeteau, T. Density Functional Theory Calculations and Vibrational Circular Dichroism of Aromatic Foldamers. J. Phys. Chem. A 2007, 111, 5092–5098. [Google Scholar] [CrossRef] [PubMed]
- AIST:Spectral Database for Organic Compounds, SDBS. Available online: https://sdbs.db.aist.go.jp/sdbs/cgi-bin/direct_frame_disp.cgi?sdbsno=13553 (accessed on 8 September 2023).
- SpectraBase. Available online: https://spectrabase.com/spectrum/KWTAHQsUXFH (accessed on 8 September 2023).
- Lim, J.-L.; Berridge, M.S. An Efficient Radiosynthesis of [18F]Fluoromisonidazole. Appl. Radiat. Isot. 1993, 44, 1085–1091. [Google Scholar] [CrossRef] [PubMed]
- Yang, D.J.; Wallace, S.; Cherif, A.; Li, C.; Gretzer, M.B.; Kim, E.E.; Podoloff, D.A. Development of F-18-Labeled Fluoroerythronitroimidazole as a PET Agent for Imaging Tumor Hypoxia. Radiology 1995, 194, 795–800. [Google Scholar] [CrossRef] [PubMed]
- Castillo, A.E.; Pérez-Gutiérrez, E.; Ceballos, P.; Venkatesan, P.; Thamotharan, S.; Siegler, M.A.; Percino, M.J. Non-Covalent Interactions towards 2-(4-(2,2-Dicyanovinyl) Benzylidene)malononitrile Packing Polymorphism Due to Solvent Effect. Experimental and Theoretical Spectroscopy Approach. J. Mol. Struct. 2023, 1275, 134674. [Google Scholar] [CrossRef]
- Isley, W.C.; Urick, A.K.; Pomerantz, W.C.K.; Cramer, C.J. Prediction of 19F NMR Chemical Shifts in Labeled Proteins: Computational Protocol and Case Study. Mol. Pharm. 2016, 13, 2376–2386. [Google Scholar] [CrossRef] [PubMed]
- Saunders, C.; Khaled, M.B.; Weaver, J.D.; Tantillo, D.J. Prediction of 19F NMR Chemical Shifts for Fluorinated Aromatic Compounds. J. Org. Chem. 2018, 83, 3220–3225. [Google Scholar] [CrossRef]
- Benassi, E. An Inexpensive Density Functional Theory-based Protocol to Predict Accurate 19F-NMR Chemical Shifts. J. Comput. Chem. 2022, 43, 170–183. [Google Scholar] [CrossRef]
- Grierson, J.R.; Link, J.M.; Mathis, C.A.; Rasey, J.S.; Krohn, K.A. A Radiosynthesis of Fluorine-18 Fluoromisonidazole. J. Nucl. Med. 1989, 30, 343–350. [Google Scholar] [PubMed]
- Zanato, C.; Testa, A.; Zanda, M. Improved Synthesis of the Hypoxia Probe 5-Deutero-5-Fluoro-5-Deoxy-Azomycin Arabinoside (FAZA) as a Model Process for Tritium Radiolabeling. J. Fluor. Chem. 2013, 155, 110–117. [Google Scholar] [CrossRef]
- Kumar, P.; Stypinski, D.; Xia, H.; McEwan, A.J.B.; Machulla, H.-J.; Wiebe, L.I. Fluoroazomycin Arabinoside (FAZA): Synthesis,2H and3H-Labelling and Preliminary Biological Evaluation of a Novel 2-Nitroimidazole Marker of Tissue Hypoxia. J. Label. Compd. Radiopharm. 1999, 42, 3–16. [Google Scholar] [CrossRef]
- Tewson, T.J. Synthesis of [18F]Fluoroetanidazole: A Potential New Tracer for Imaging Hypoxia. Nucl. Med. Biol. 1997, 24, 755–760. [Google Scholar] [CrossRef] [PubMed]
- Dolbier, W.R.; Li, A.-R.; Koch, C.J.; Shiue, C.-Y.; Kachur, A.V. [18F]-EF5, a Marker for PET Detection of Hypoxia: Synthesis of Precursor and a New Fluorination Procedure. Appl. Radiat. Isot. 2001, 54, 73–80. [Google Scholar] [CrossRef] [PubMed]
- Orsi, A.; Price, D.J.; Kahr, J.; Pillai, R.S.; Sneddon, S.; Cao, S.; Benoit, V.; Łozińska, M.M.; Cordes, D.B.; Slawin, A.M.Z.; et al. Porous Zinc and Cobalt 2-Nitroimidazolate Frameworks with Six-Membered Ring Windows and a Layered Cobalt 2-Nitroimidazolate Polymorph. CrystEngComm 2017, 19, 1377–1388. [Google Scholar] [CrossRef]
- Martin, R.L. Natural transition orbitals. J. Chem. Phys. 2003, 118, 4775–4777. [Google Scholar] [CrossRef]
- Kimber, P.; Plasser, F. Energy Component Analysis for Electronically Excited States of Molecules: Why the Lowest Excited State Is Not Always the HOMO/LUMO Transition. J. Chem. Theory Comput. 2023, 19, 2340–2352. [Google Scholar] [CrossRef] [PubMed]
- Yu, Z.; Bernstein, E.R. Experimental and Theoretical Studies of the Decomposition of New Imidazole Based Energetic Materials: Model Systems. J. Chem. Phys. 2012, 137, 114303. [Google Scholar] [CrossRef]
- Adamo, C.; Barone, V. Toward reliable density functional methods without adjustable parameters: The PBE0 model. J. Chem. Phys. 1999, 110, 6158–6169. [Google Scholar] [CrossRef]
- Chai, J.-D.; Head-Gordon, M. Long-range corrected hybrid density functionals with damped atom-atom dispersion corrections. Phys. Chem. Chem. Phys. 2008, 10, 6615–6620. [Google Scholar] [CrossRef] [PubMed]
- Frisch, M.J.; Trucks, G.W.; Schlegel, H.B.; Scuseria, G.E.; Robb, M.A.; Cheeseman, J.R.; Scalmani, G.; Barone, V.; Petersson, G.A.; Nakatsuji, H.; et al. Gaussian 16, Revision C.01; Gaussian Inc.: Wallingford, CT, USA, 2016. [Google Scholar]
- Becke, A.D. Density-Functional Thermochemistry. III. The Role of Exact Exchange. J. Chem. Phys. 1993, 98, 5648–5652. [Google Scholar] [CrossRef]
- Lee, C.; Yang, W.; Parr, R.G. Development of the Colle-Salvetti Correlation-Energy Formula into a Functional of the Electron Density. Phys. Rev. B 1988, 37, 785–789. [Google Scholar] [CrossRef] [PubMed]
- Vosko, S.H.; Wilk, L.; Nusair, M. Accurate Spin-Dependent Electron Liquid Correlation Energies for Local Spin Density Calculations: A Critical Analysis. Can. J. Phys. 1980, 58, 1200–1211. [Google Scholar] [CrossRef]
- Stephens, P.J.; Devlin, F.J.; Chabalowski, C.F.; Frisch, M.J. Ab Initio Calculation of Vibrational Absorption and Circular Dichroism Spectra Using Density Functional Force Fields. J. Phys. Chem. 1994, 98, 11623–11627. [Google Scholar] [CrossRef]
- Frisch, M.J.; Pople, J.A.; Binkley, J.S. Self-Consistent Molecular Orbital Methods 25. Supplementary Functions for Gaussian Basis Sets. J. Chem. Phys. 1984, 80, 3265–3269. [Google Scholar] [CrossRef]
- Tomasi, J.; Mennucci, B.; Cammi, R. Quantum Mechanical Continuum Solvation Models. Chem. Rev. 2005, 105, 2999–3094. [Google Scholar] [CrossRef]
- Scalmani, G.; Frisch, M.J. Continuous Surface Charge Polarizable Continuum Models of Solvation. I. General Formalism. J. Chem. Phys. 2010, 132, 114110. [Google Scholar] [CrossRef]
- NIST. Computational Chemistry Comparison and Benchmark Database; NIST Standard Reference Database Number 101 Release 22; Johnson, R.D., III, Ed.; National Institute of Standards and Technology: Gaithersburg, MD, USA, May 2022. Available online: http://cccbdb.nist.gov/ (accessed on 2 September 2023).
- Barone, V. Anharmonic Vibrational Properties by a Fully Automated Second-Order Perturbative Approach. J. Chem. Phys. 2005, 122, 014108. [Google Scholar] [CrossRef]
- Bloino, J.; Baiardi, A.; Biczysko, M. Aiming at an Accurate Prediction of Vibrational and Electronic Spectra for Medium-to-large Molecules: An Overview. Int. J. Quantum. Chem. 2016, 116, 1543–1574. [Google Scholar] [CrossRef]
- Crișan, G.; Macea, A.-M.; Andrieș, G.; Chiș, V. Experimental and Computational Raman Spectroscopies Applied to 2-Methoxy-2-Methylpropylisonitrile (MIBI) Ligand of the 99mTc-Sestamibi Radiopharmaceutical. J. Mol. Struct. 2021, 1246, 131159. [Google Scholar] [CrossRef]
- Ditchfield, R. Self-Consistent Perturbation Theory of Diamagnetism: I. A Gauge-Invariant LCAO Method for N.M.R. Chemical Shifts. Mol. Phys. 1974, 27, 789–807. [Google Scholar] [CrossRef]
- Wolinski, K.; Hinton, J.F.; Pulay, P. Efficient Implementation of the Gauge-Independent Atomic Orbital Method for NMR Chemical Shift Calculations. J. Am. Chem. Soc. 1990, 112, 8251–8260. [Google Scholar] [CrossRef]
- Casida, M.E.; Jamorski, C.; Casida, K.C.; Salahub, D.R. Molecular Excitation Energies to High-Lying Bound States from Time-Dependent Density-Functional Response Theory: Characterization and Correction of the Time-Dependent Local Density Approximation Ionization Threshold. J. Chem. Phys. 1998, 108, 4439–4449. [Google Scholar] [CrossRef]

| Compound | Dihedral Angle (°) |
|---|---|
| FMISO | C4-N3-C9-C10 |
| N3-C9-C10-C11 | |
| FETNIM | C4-N3-C9-C10 |
| N3-C9-C10-C11 | |
| FAZA | C4-N3-C9-C10 |
| FETA | C4-N3-C9-C10 |
| N3-C9-C10-N11 | |
| EF5 | C4-N3-C9-C10 |
| N3-C9-C10-N11 |
| Compound | Gas Phase Conformer | ΔG (kcal∙mol−1) | Relative Boltzmann Population (%) | Water Conformer | ΔG (kcal∙mol−1) | Relative Boltzmann Population (%) |
|---|---|---|---|---|---|---|
| FMISO | 1g | 0.000 | 62.15 | 1w | 0.000 | 65.91 |
| 2g | 0.630 | 21.45 | 2w | 0.690 | 20.56 | |
| 3g | 1.030 | 10.92 | 3w | 1.280 | 7.59 | |
| 4g | 1.800 | 2.97 | 4w | 1.720 | 3.61 | |
| 5g | 1.900 | 2.51 | 5w | 1.980 | 2.33 | |
| FETNIM | 1g | 0.000 | 71.36 | 1w | 0.000 | 68.26 |
| 2g | 1.030 | 12.53 | 2w | 0.640 | 23.16 | |
| 3g | 1.280 | 8.22 | 3w | 1.370 | 6.75 | |
| 4g | 1.660 | 4.33 | 4w | 2.780 | 0.62 | |
| 5g | 1.990 | 2.48 | 5w | 2.810 | 0.59 | |
| 6g | 2.480 | 1.08 | 6w | 2.820 | 0.58 | |
| 7g | 5.390 | 0.01 | 7w | 4.850 | 0.02 | |
| FAZA | 1g | 0.000 | 99.25 | 1w | 0.000 | 69.66 |
| 2g | 3.190 | 0.45 | 2w | 0.530 | 28.46 | |
| 3g | 3.450 | 0.29 | 3w | 2.140 | 1.88 | |
| FETA | 1g | 0.000 | 50.84 | 1w | 0.000 | 63.97 |
| 2g | 0.020 | 49.16 | 2w | 0.340 | 36.03 | |
| EF5 | 1g | 0.000 | 54.21 | 1w | 0.000 | 55.05 |
| 2g | 0.100 | 45.79 | 2w | 0.120 | 44.95 |
| Mode | Theoretical Wavenumbers in Gas Phase (cm−1) | Assignments c | |||||||
|---|---|---|---|---|---|---|---|---|---|
| 2nim | FMISO 1g | FETNIM 1g | FETA 1g | FAZA 1g | EF5 1g | ||||
| Harmonic | Anharmonic | Experimental a | |||||||
| Q1 | 201 | 199 | n.a. b | 216 | 187 | 174 | 200 | 195 | oop. def. (2nim) |
| Q2 | 242 | 240 | n.a. | 244 | 298 | 308 | 285 | 306 | ρ(2nim) |
| Q3 | 548 | 539 | n.a. | 566 | 562 | 540 | 600 | 546 | δ(CNO) |
| Q4 | 600 | 572 | 623 | 638 | 635 | 625 | 631 | 628 | γ(imidazole) |
| Q5 | 660 | 645 | 649 | 660 | 660 | 660 | 661 | 660 | γ(imidazole) |
| Q6 | 777 | 772 | 798 | 785 | 785 | 789 | 798 | 788 | γ(CH)imidazole (ip.) |
| Q7 | 840 | 830 | 820 | 855 | 854 | 857 | 866 | 857 | δ(NO2) + δ(CN2)imidazole |
| Q8 | 890 | 872 | n.a. | 888 | 886 | 893 | 893 | 894 | γ(CH) |
| Q9 | 929 | 916 | 944 | 932 | 926 | 924 | 934 | 922 | δ(CNC) + δ(NCC) |
| Q10 | 997 | 984 | 985 | - | - | - | - | - | δ(NCN) + δ ν(C-NO2) + (CH) |
| Q11 | 1056 | 1067 | n.a. | - | - | - | - | - | β(CH) + β(NH) |
| Q12 | 1083 | 1102 | 1103 | 1068 | 1061 | 1059 | 1047 | 1167 | δ(CH) |
| Q13 | 1150 | 1158 | 1155 | 1156 | 1154 | 1151 | 1156 | 1153 | δ(CN2) + β(CH) |
| Q14 | 1217 | 1223 | 1269 | 1270 | 1256 | 1260 | 1224 | 1260 | β(CH) + νsym(NO2) + ip. def.(imidazole) |
| Q15 | 1330 | 1342 | 1348 | 1325 | 1323 | 1323 | 1324 | 1318 | ν(C-N)imidazole + δ(NO2) + β(CH, NH) |
| Q16 | 1333 | 1349 | 1376 | 1331 | 1332 | 1329 | 1337 | 1331 | ν(C-NO2) + β(CH) + δ(NO2) |
| Q17 | 1386 | 1393 | 1425 | 1384 | 1380 | 1377 | 1380 | 1377 | ν(C-N)imidazole + β(NH) + β(CH) |
| Q18 | 1456 | 1467 | 1494 | 1464 | 1463 | 1459 | 1445 | 1459 | ν(C-N)imidazole + β(NH) + β(CH) |
| Q19 | 1494 | 1513 | 1520 | 1476 | 1474 | 1473 | 1467 | 1474 | ν(C=N)imidazole + ν(C=C) + β(NH) + β(CH) |
| Q20 | 1546 | 1559 | 1554 | 1535 | 1533 | 1536 | 1530 | 1538 | νasym(NO2) |
| Q21 | 3141 | 3123 | 3146 | 3139 | 3138 | 3140 | 3140 | 3140 | νasym(CH) |
| Q22 | 3165 | 3147 | 3164 | 3166 | 3164 | 3160 | 3189 | 3161 | νsym(CH) |
| Q23 | 3512 | 3469 | 3423 | - | - | - | - | - | ν(NH) |
| Compound | Excited State * | f | Transitions | Contributions (%) | |
|---|---|---|---|---|---|
| S2 | 315 | 0.3287 | H→L | 99.12 | |
| S5 | 245 | 0.0239 | H-2→L | 90.08 | |
| S6 | 204 | 0.1247 | H-4→L | 87.57 |
| Compound | Excited State * | f | Transitions | Contributions (%) | |
|---|---|---|---|---|---|
| FMISO 1w | S1 | 331 | 0.0221 | H-4 → L | 17.34 |
| H-2 → L | 59.61 | ||||
| H-1 → L | 10.33 | ||||
| S2 | 315 | 0.2708 | H → L | 88.58 | |
| S5 | 270 | 0.0126 | H-4 → L | 61.04 | |
| H-1 → L | 22.37 | ||||
| S6 | 260 | 0.0332 | H-3 → L | 80.51 | |
| S8 | 204 | 0.1194 | H-5 → L | 78.21 | |
| FETNIM 1w | S1 | 332 | 0.0399 | H-5 → L | 14.87 |
| H-3 → L | 59.22 | ||||
| H → L | 18.96 | ||||
| S2 | 318 | 0.2172 | H-3 → L | 17.28 | |
| H → L | 76.24 | ||||
| S3 | 286 | 0.0784 | H-1 → L | 92.78 | |
| S9 | 205 | 0.1166 | H-6 → L | 82.94 | |
| FAZA 1w | S1 | 328 | 0.0536 | H-4 → L | 58.31 |
| H → L | 22.26 | ||||
| S2 | 317 | 0.2195 | H-4 → L | 21.16 | |
| H → L | 73.38 | ||||
| S3 | 297 | 0.0248 | H-4 → L | 22.66 | |
| H-2 → L | 68.72 | ||||
| S4 | 286 | 0.0238 | H-4 → L | 54.06 | |
| H-3 → L | 15.42 | ||||
| H-2 → L | 20.91 | ||||
| S10 | 204 | 0.1169 | H-9 → L | 23.39 | |
| H-7 → L | 64.87 | ||||
| FETA 1w | S2 | 323 | 0.0541 | H-1 → L | 59.96 |
| H → L | 30.57 | ||||
| S3 | 314 | 0.0508 | H-2 → L | 84.74 | |
| H → L | 13.82 | ||||
| S4 | 312 | 0.1961 | H → L | 54.27 | |
| H-1 → L | 37.03 | ||||
| S7 | 251 | 0.0312 | H-4 → L | 92.54 | |
| S10 | 206 | 0.1221 | H-6 → L | 84.89 | |
| EF5 1w | S1 | 335 | 0.0525 | H-5 → L | 12.02 |
| H-3 → L | 41.36 | ||||
| H → L | 27.89 | ||||
| S2 | 322 | 0.1329 | H-3 → L | 23.75 | |
| H → L | 54.16 | ||||
| S3 | 307 | 0.0874 | H-1 → L | 72.79 | |
| H → L | 12.56 | ||||
| S4 | 302 | 0.0547 | H-2 → L | 75.39 | |
| S10 | 205 | 0.1299 | H-7 → L | 11.53 | |
| H-6 → L | 77.38 |
Disclaimer/Publisher’s Note: The statements, opinions and data contained in all publications are solely those of the individual author(s) and contributor(s) and not of MDPI and/or the editor(s). MDPI and/or the editor(s) disclaim responsibility for any injury to people or property resulting from any ideas, methods, instructions or products referred to in the content. |
© 2024 by the authors. Licensee MDPI, Basel, Switzerland. This article is an open access article distributed under the terms and conditions of the Creative Commons Attribution (CC BY) license (https://creativecommons.org/licenses/by/4.0/).
Share and Cite
Crișan, G.; Stan, Ș.; Chiș, V. Exploring Geometrical, Electronic and Spectroscopic Properties of 2-Nitroimidazole-Based Radiopharmaceuticals via Computational Chemistry Methods. Molecules 2024, 29, 1505. https://doi.org/10.3390/molecules29071505
Crișan G, Stan Ș, Chiș V. Exploring Geometrical, Electronic and Spectroscopic Properties of 2-Nitroimidazole-Based Radiopharmaceuticals via Computational Chemistry Methods. Molecules. 2024; 29(7):1505. https://doi.org/10.3390/molecules29071505
Chicago/Turabian StyleCrișan, George, Ștefan Stan, and Vasile Chiș. 2024. "Exploring Geometrical, Electronic and Spectroscopic Properties of 2-Nitroimidazole-Based Radiopharmaceuticals via Computational Chemistry Methods" Molecules 29, no. 7: 1505. https://doi.org/10.3390/molecules29071505
APA StyleCrișan, G., Stan, Ș., & Chiș, V. (2024). Exploring Geometrical, Electronic and Spectroscopic Properties of 2-Nitroimidazole-Based Radiopharmaceuticals via Computational Chemistry Methods. Molecules, 29(7), 1505. https://doi.org/10.3390/molecules29071505