
Plant-Assisted Synthesis of Ag-Based Nanoparticles on Cotton: Antimicrobial and Cytotoxicity Studies


 ,
,  , ,
, ,
Abstract
1. Introduction
2. Results and Discussion
2.1. Chemical Composition of Herbal Extracts
2.2. Chemical and Morphological Properties of the Samples
2.3. Antimicrobial Activity of Textile Nanocomposites
2.4. Release of Ag+-Ions from Textile Nanocomposites
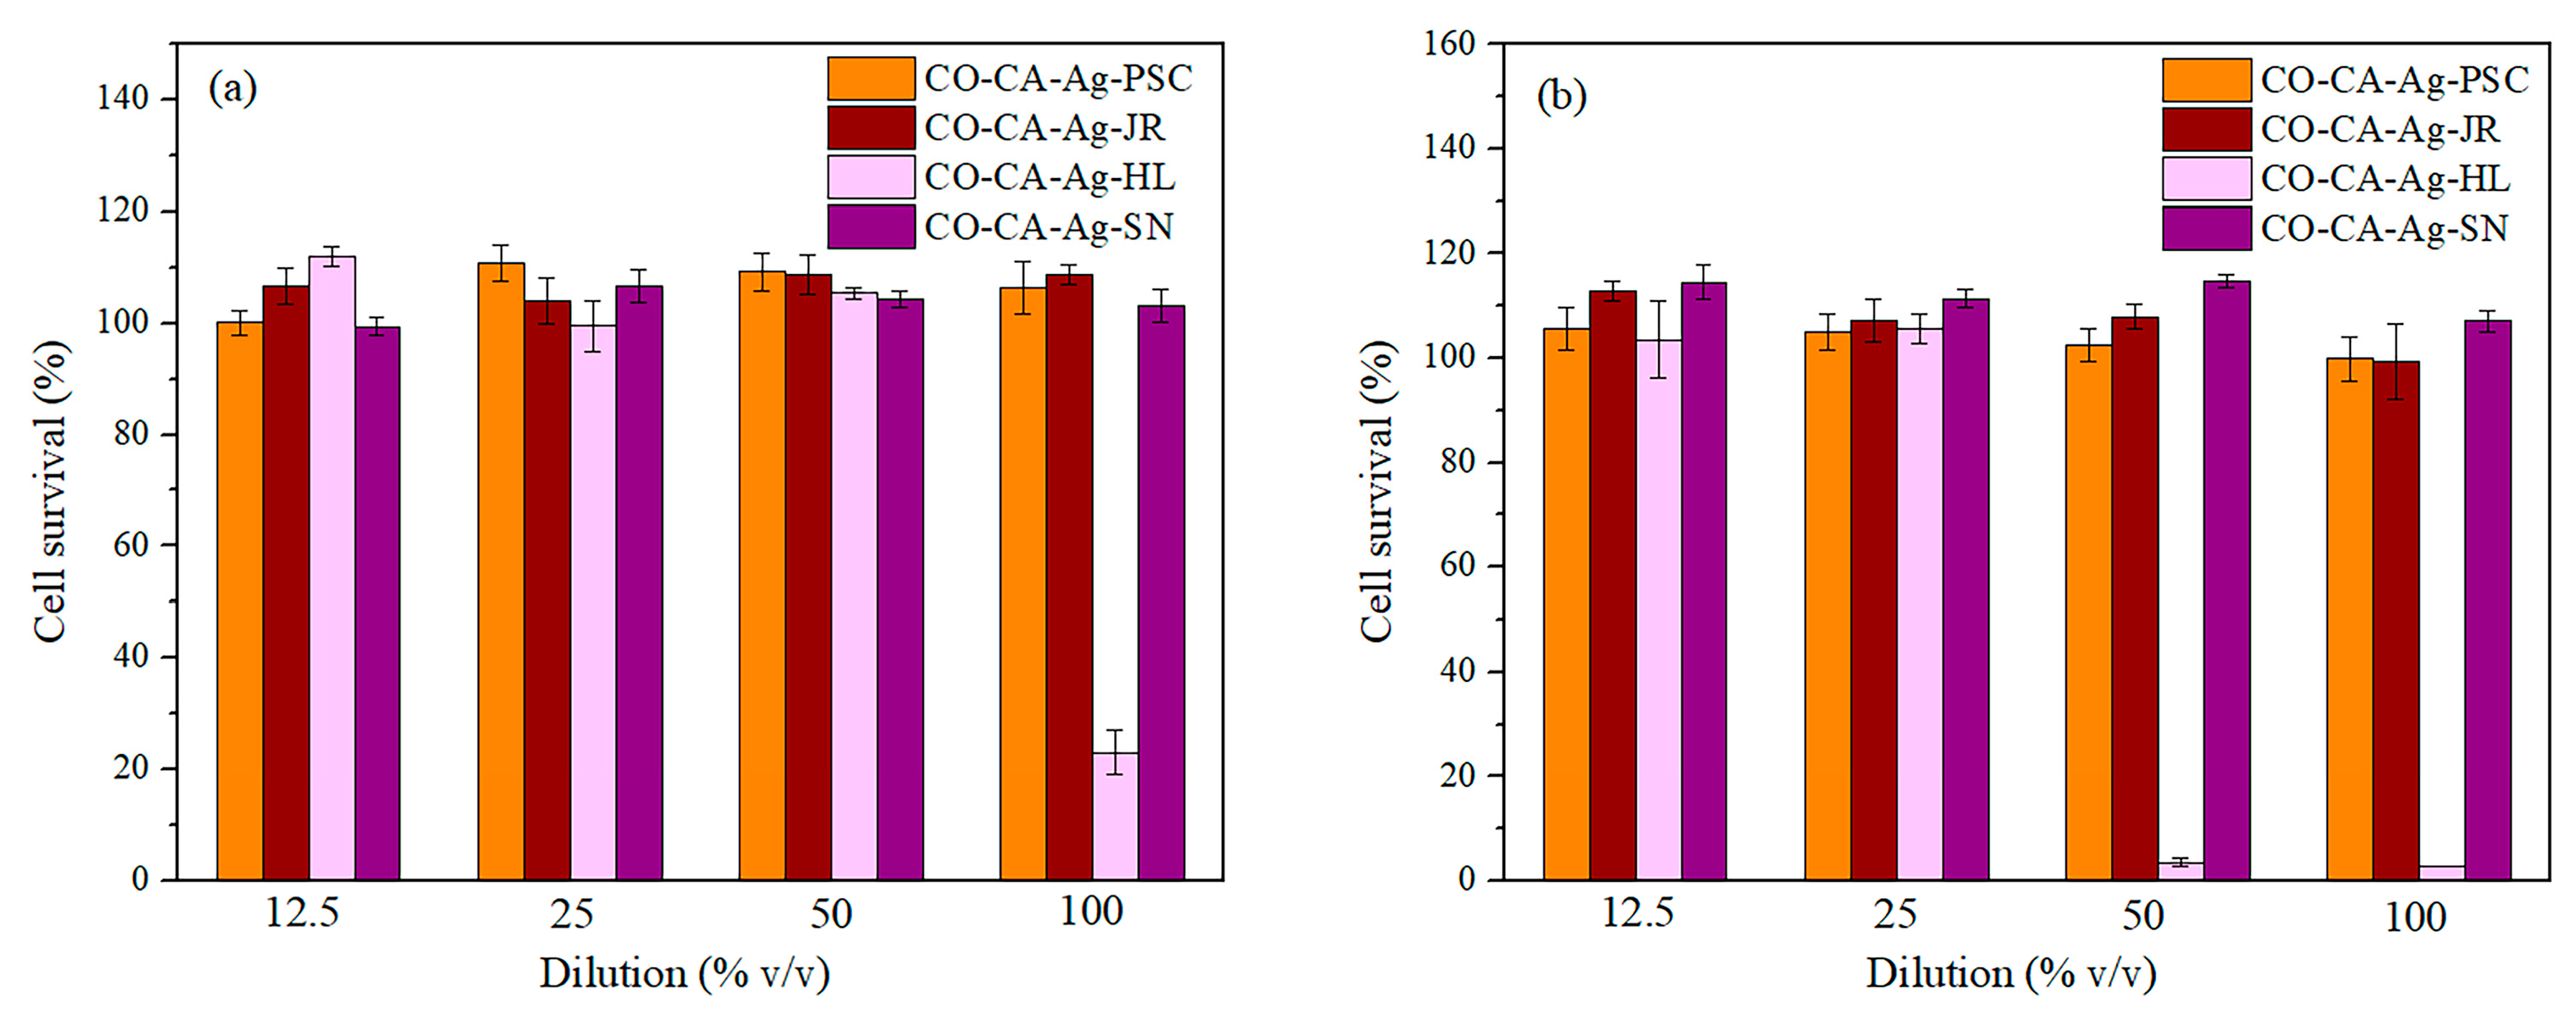
2.5. Cytotoxicity of Textile Nanocomposites
3. Materials and Methods
3.1. Materials
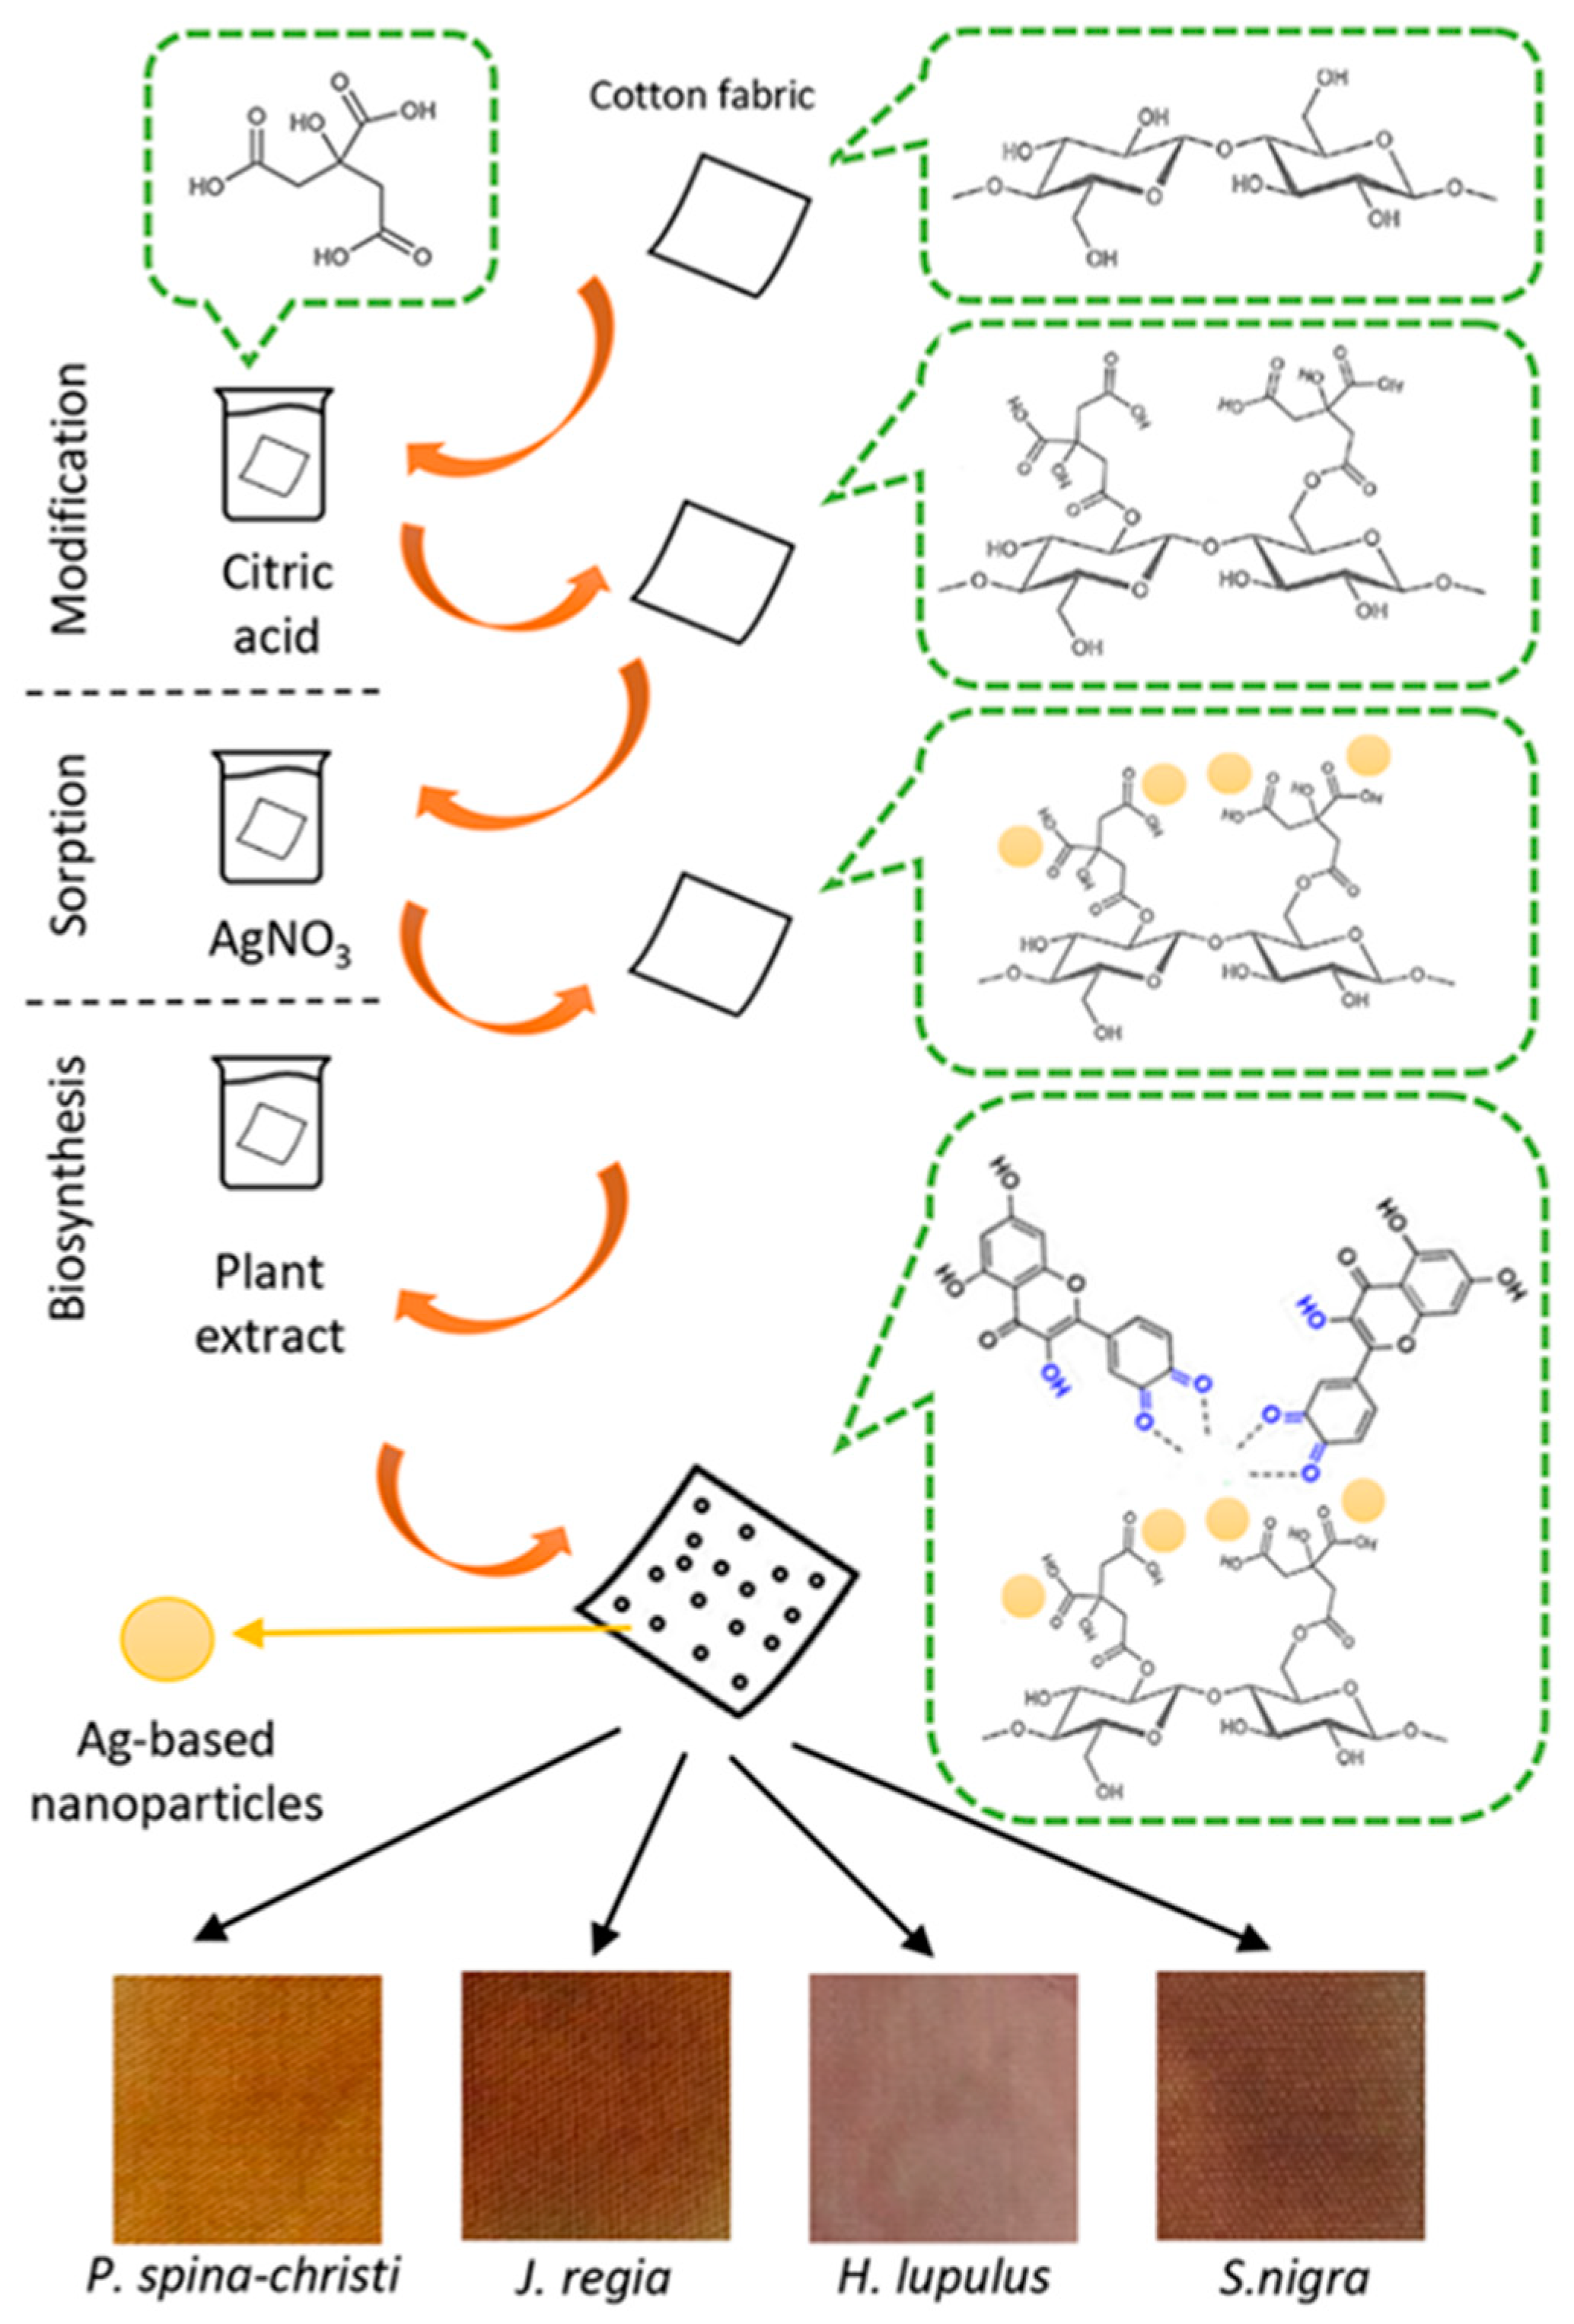
3.2. Preparation of CO Fabrics
3.3. Modification of CO Samples with Polycarboxylic Acid
3.4. Preparation of Plant Extracts
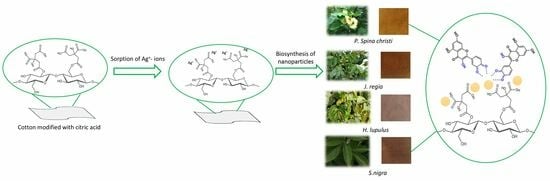
3.5. In Situ Synthesis of Ag-Based NPs on the Modified Samples
3.6. HPLC Analysis of Plant Extracts
3.7. Total Phenolic Content
3.8. Total Flavonoid Aglycones Content
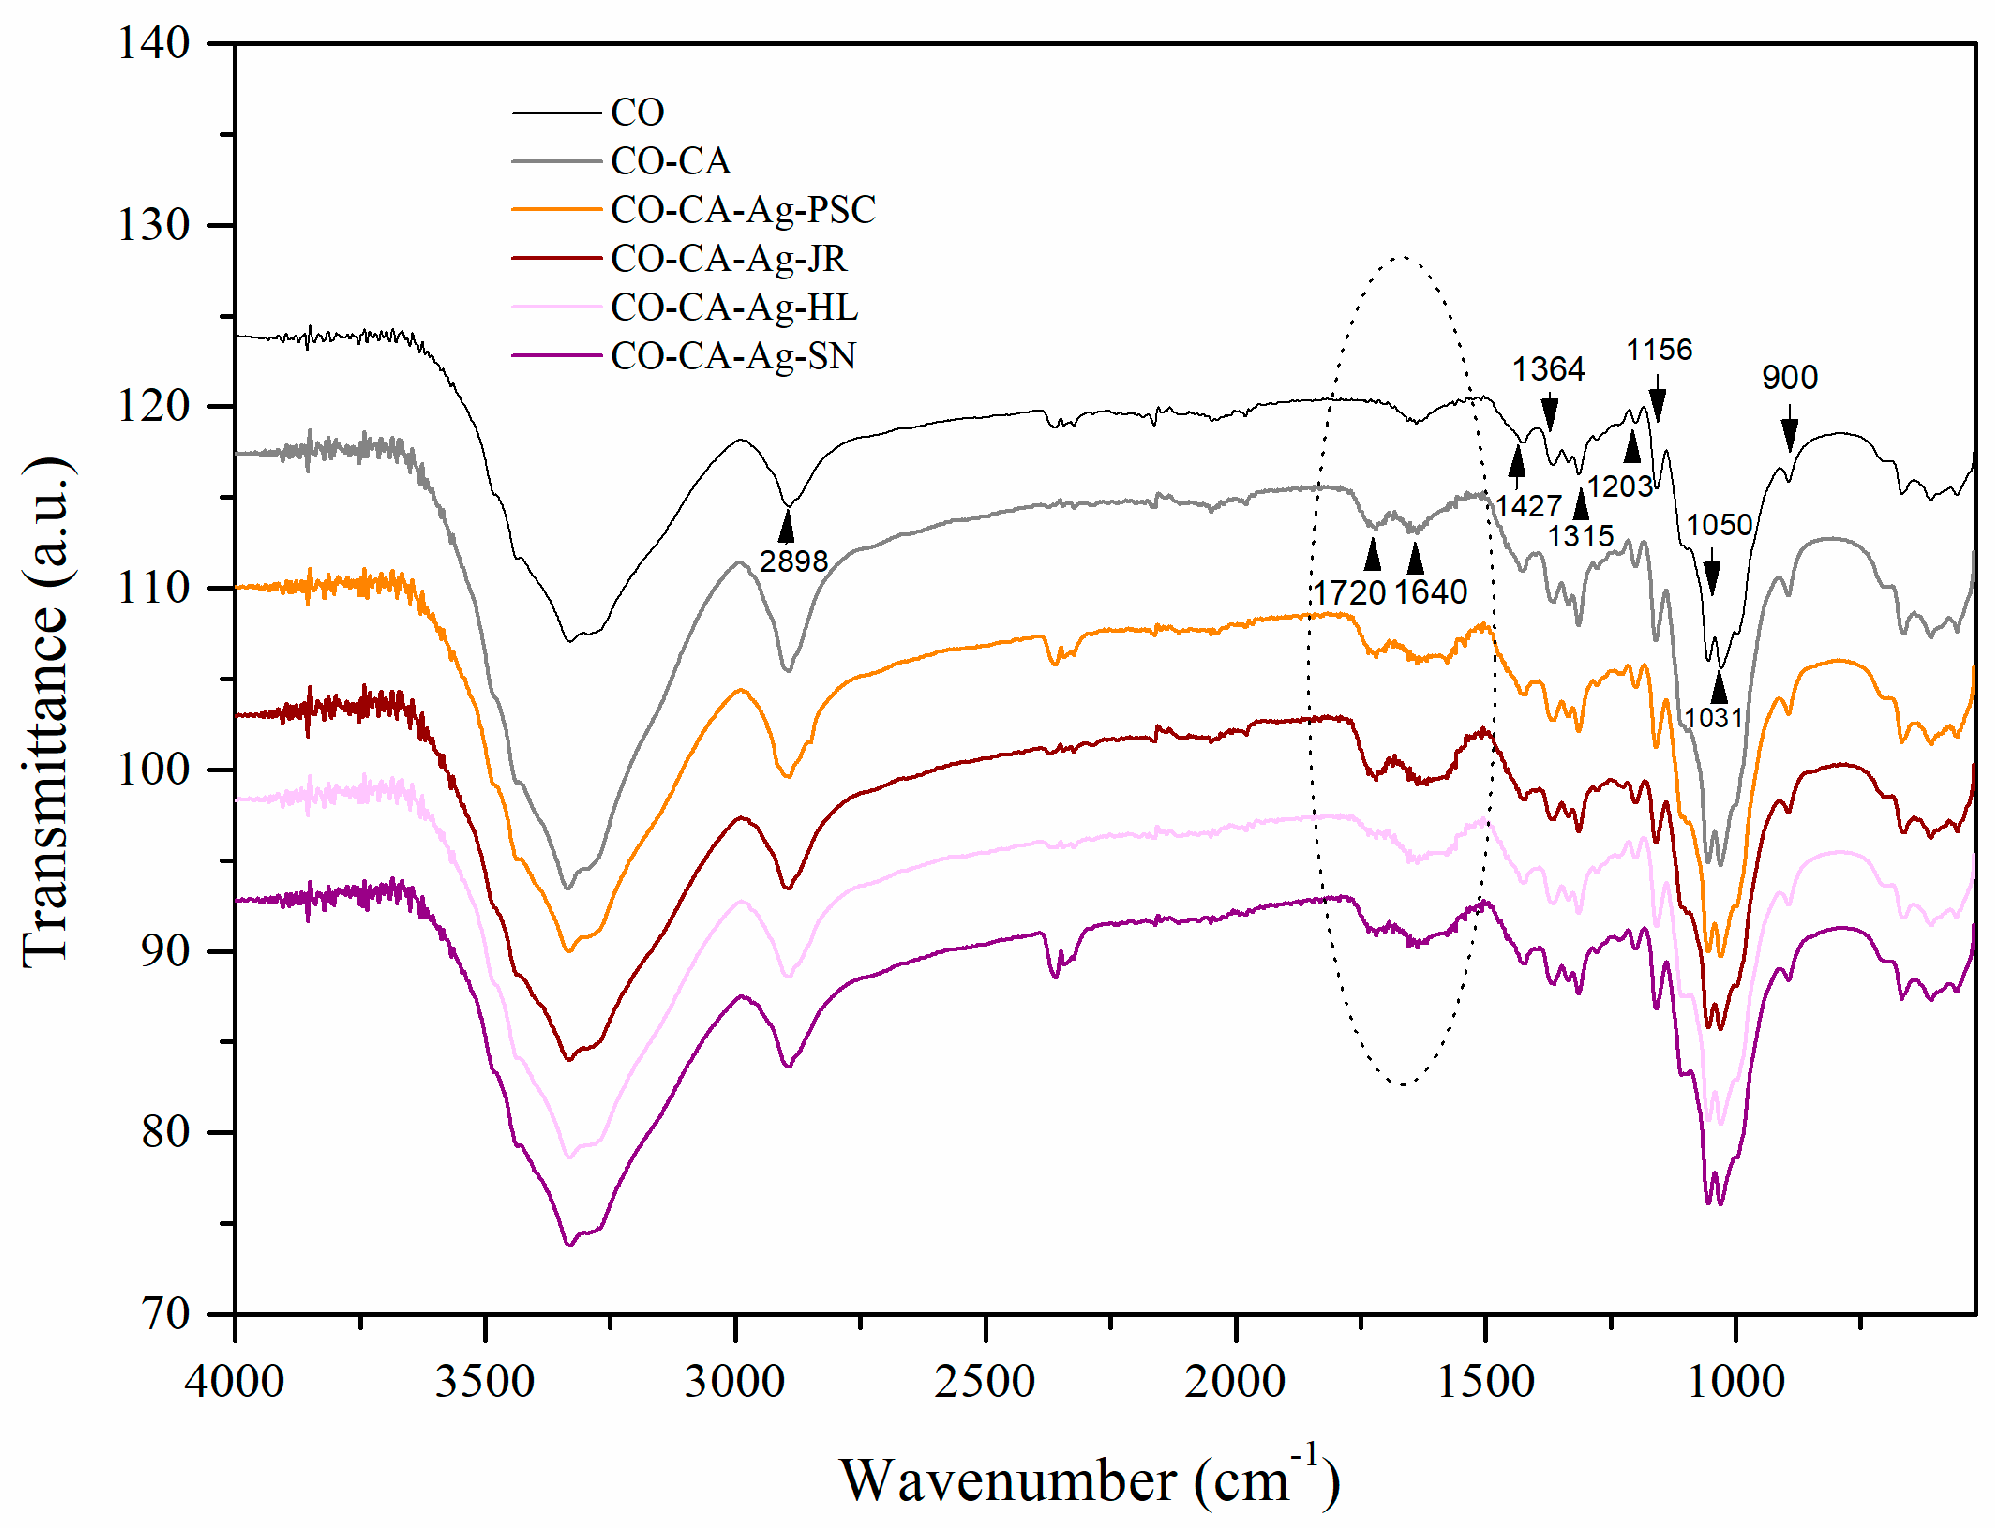
3.9. FTIR Analysis
3.10. FE-SEM Analysis
3.11. AAS Analysis
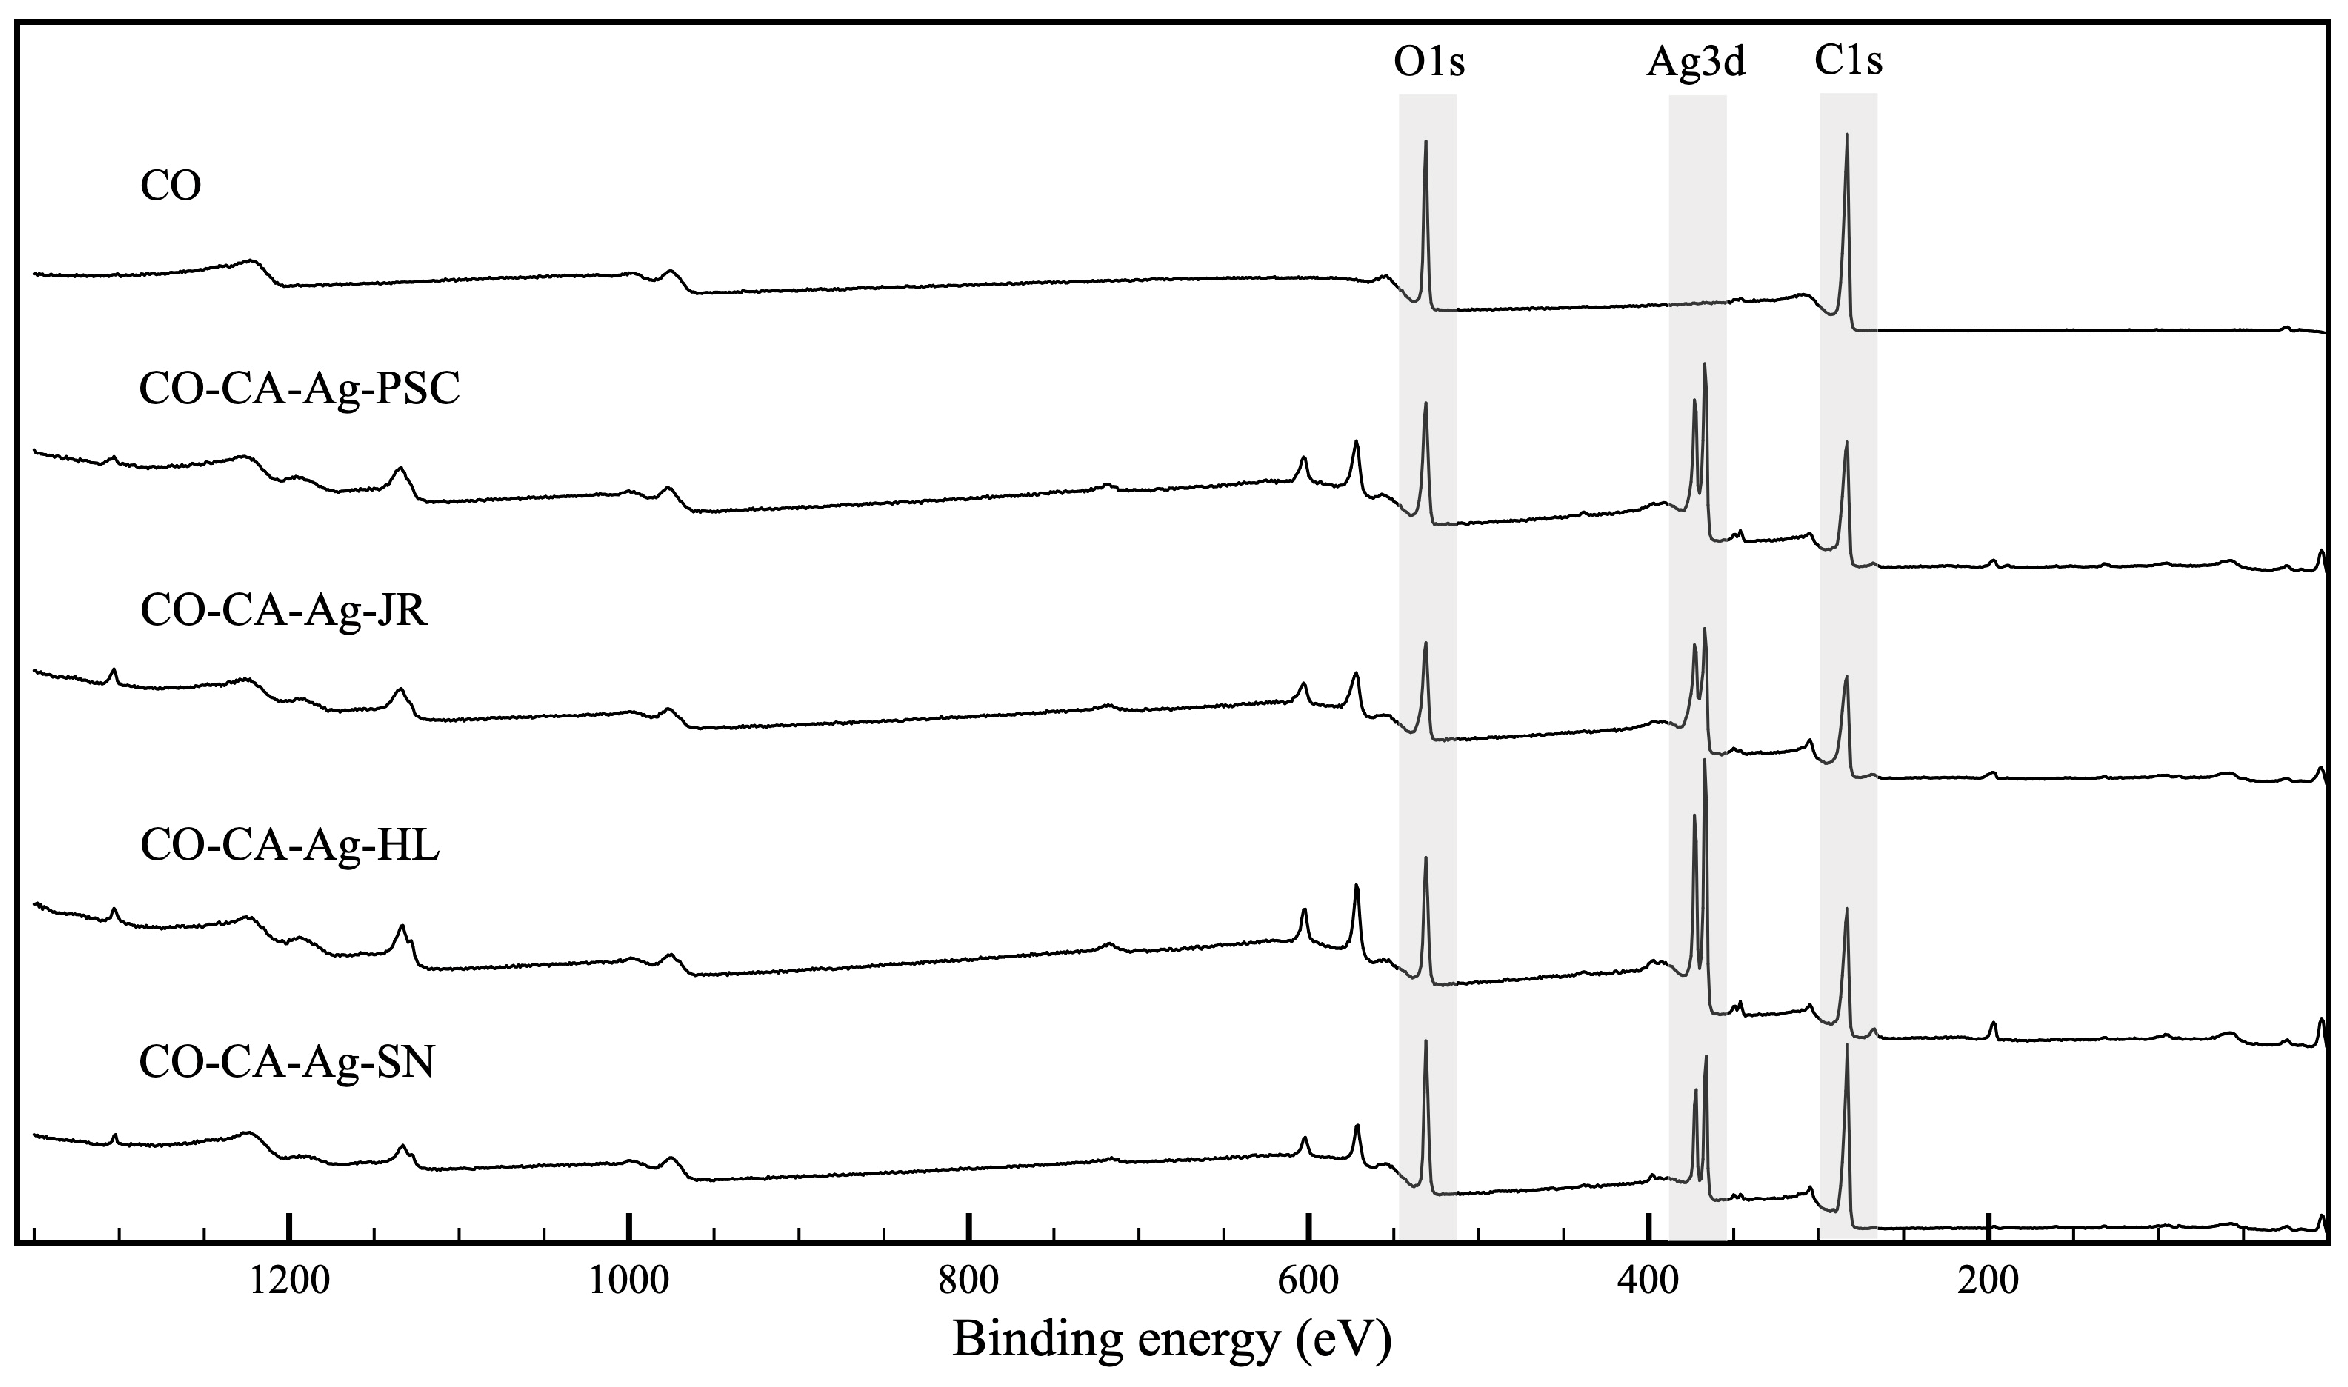
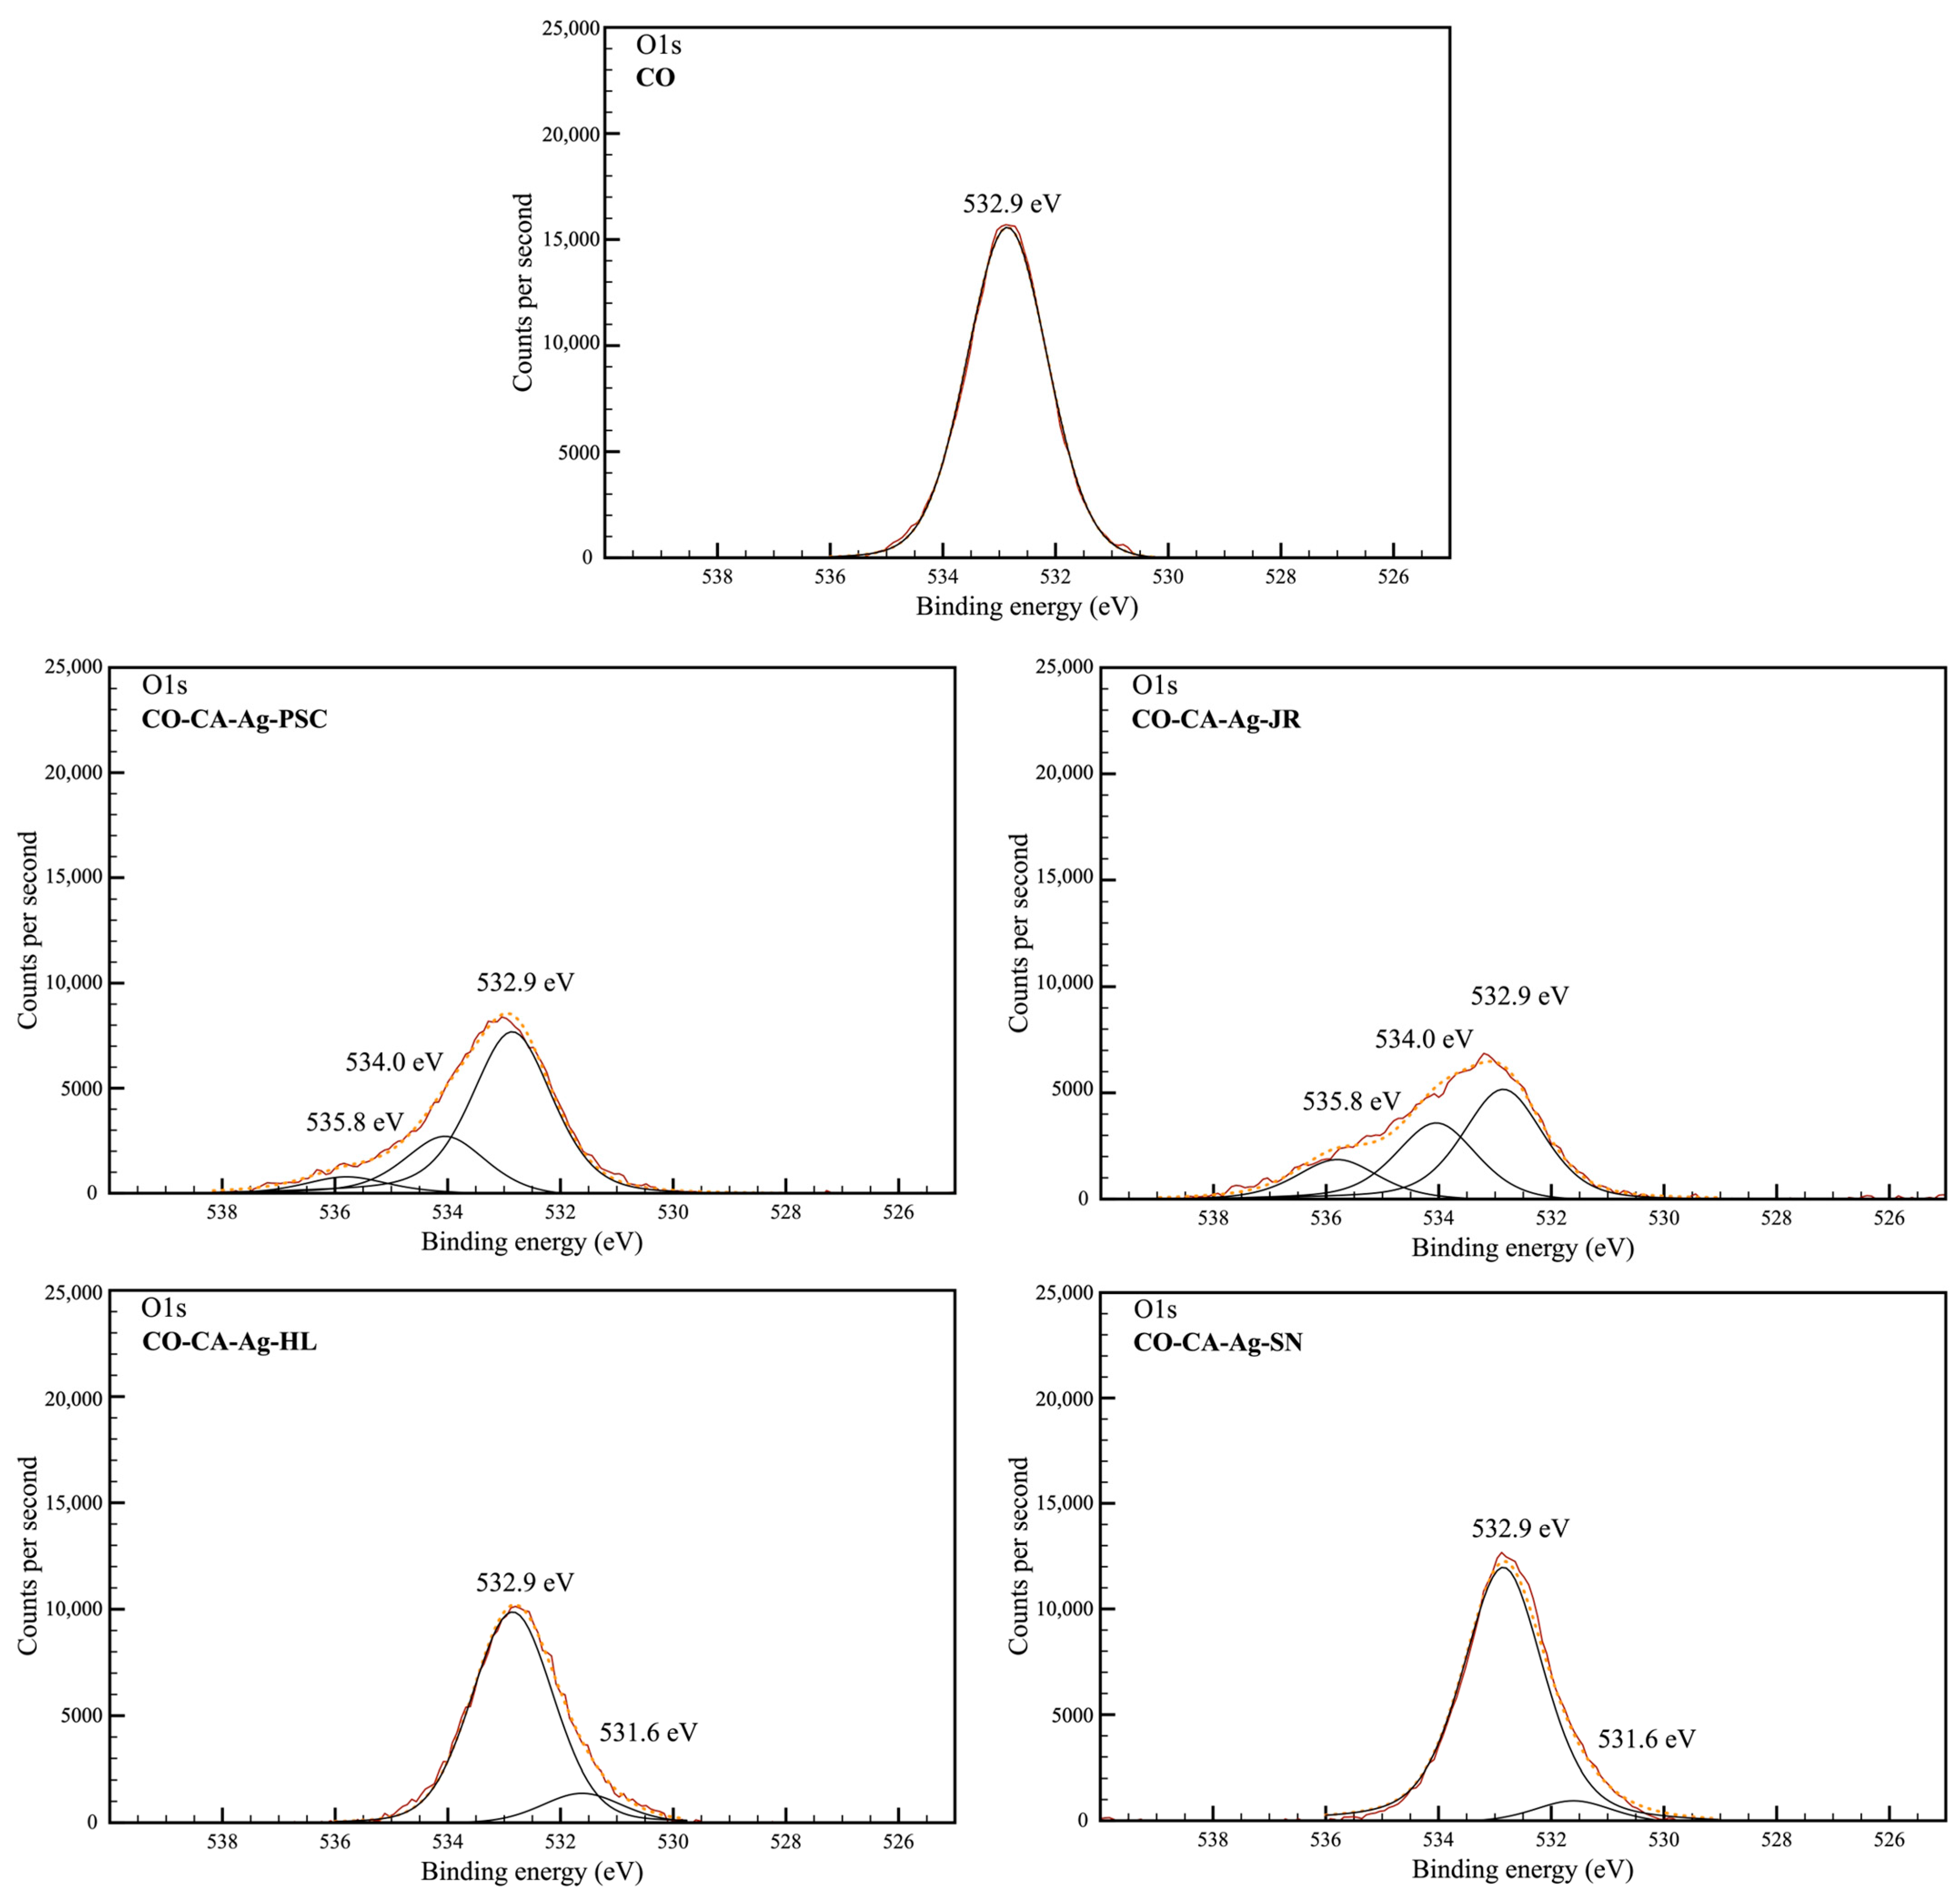
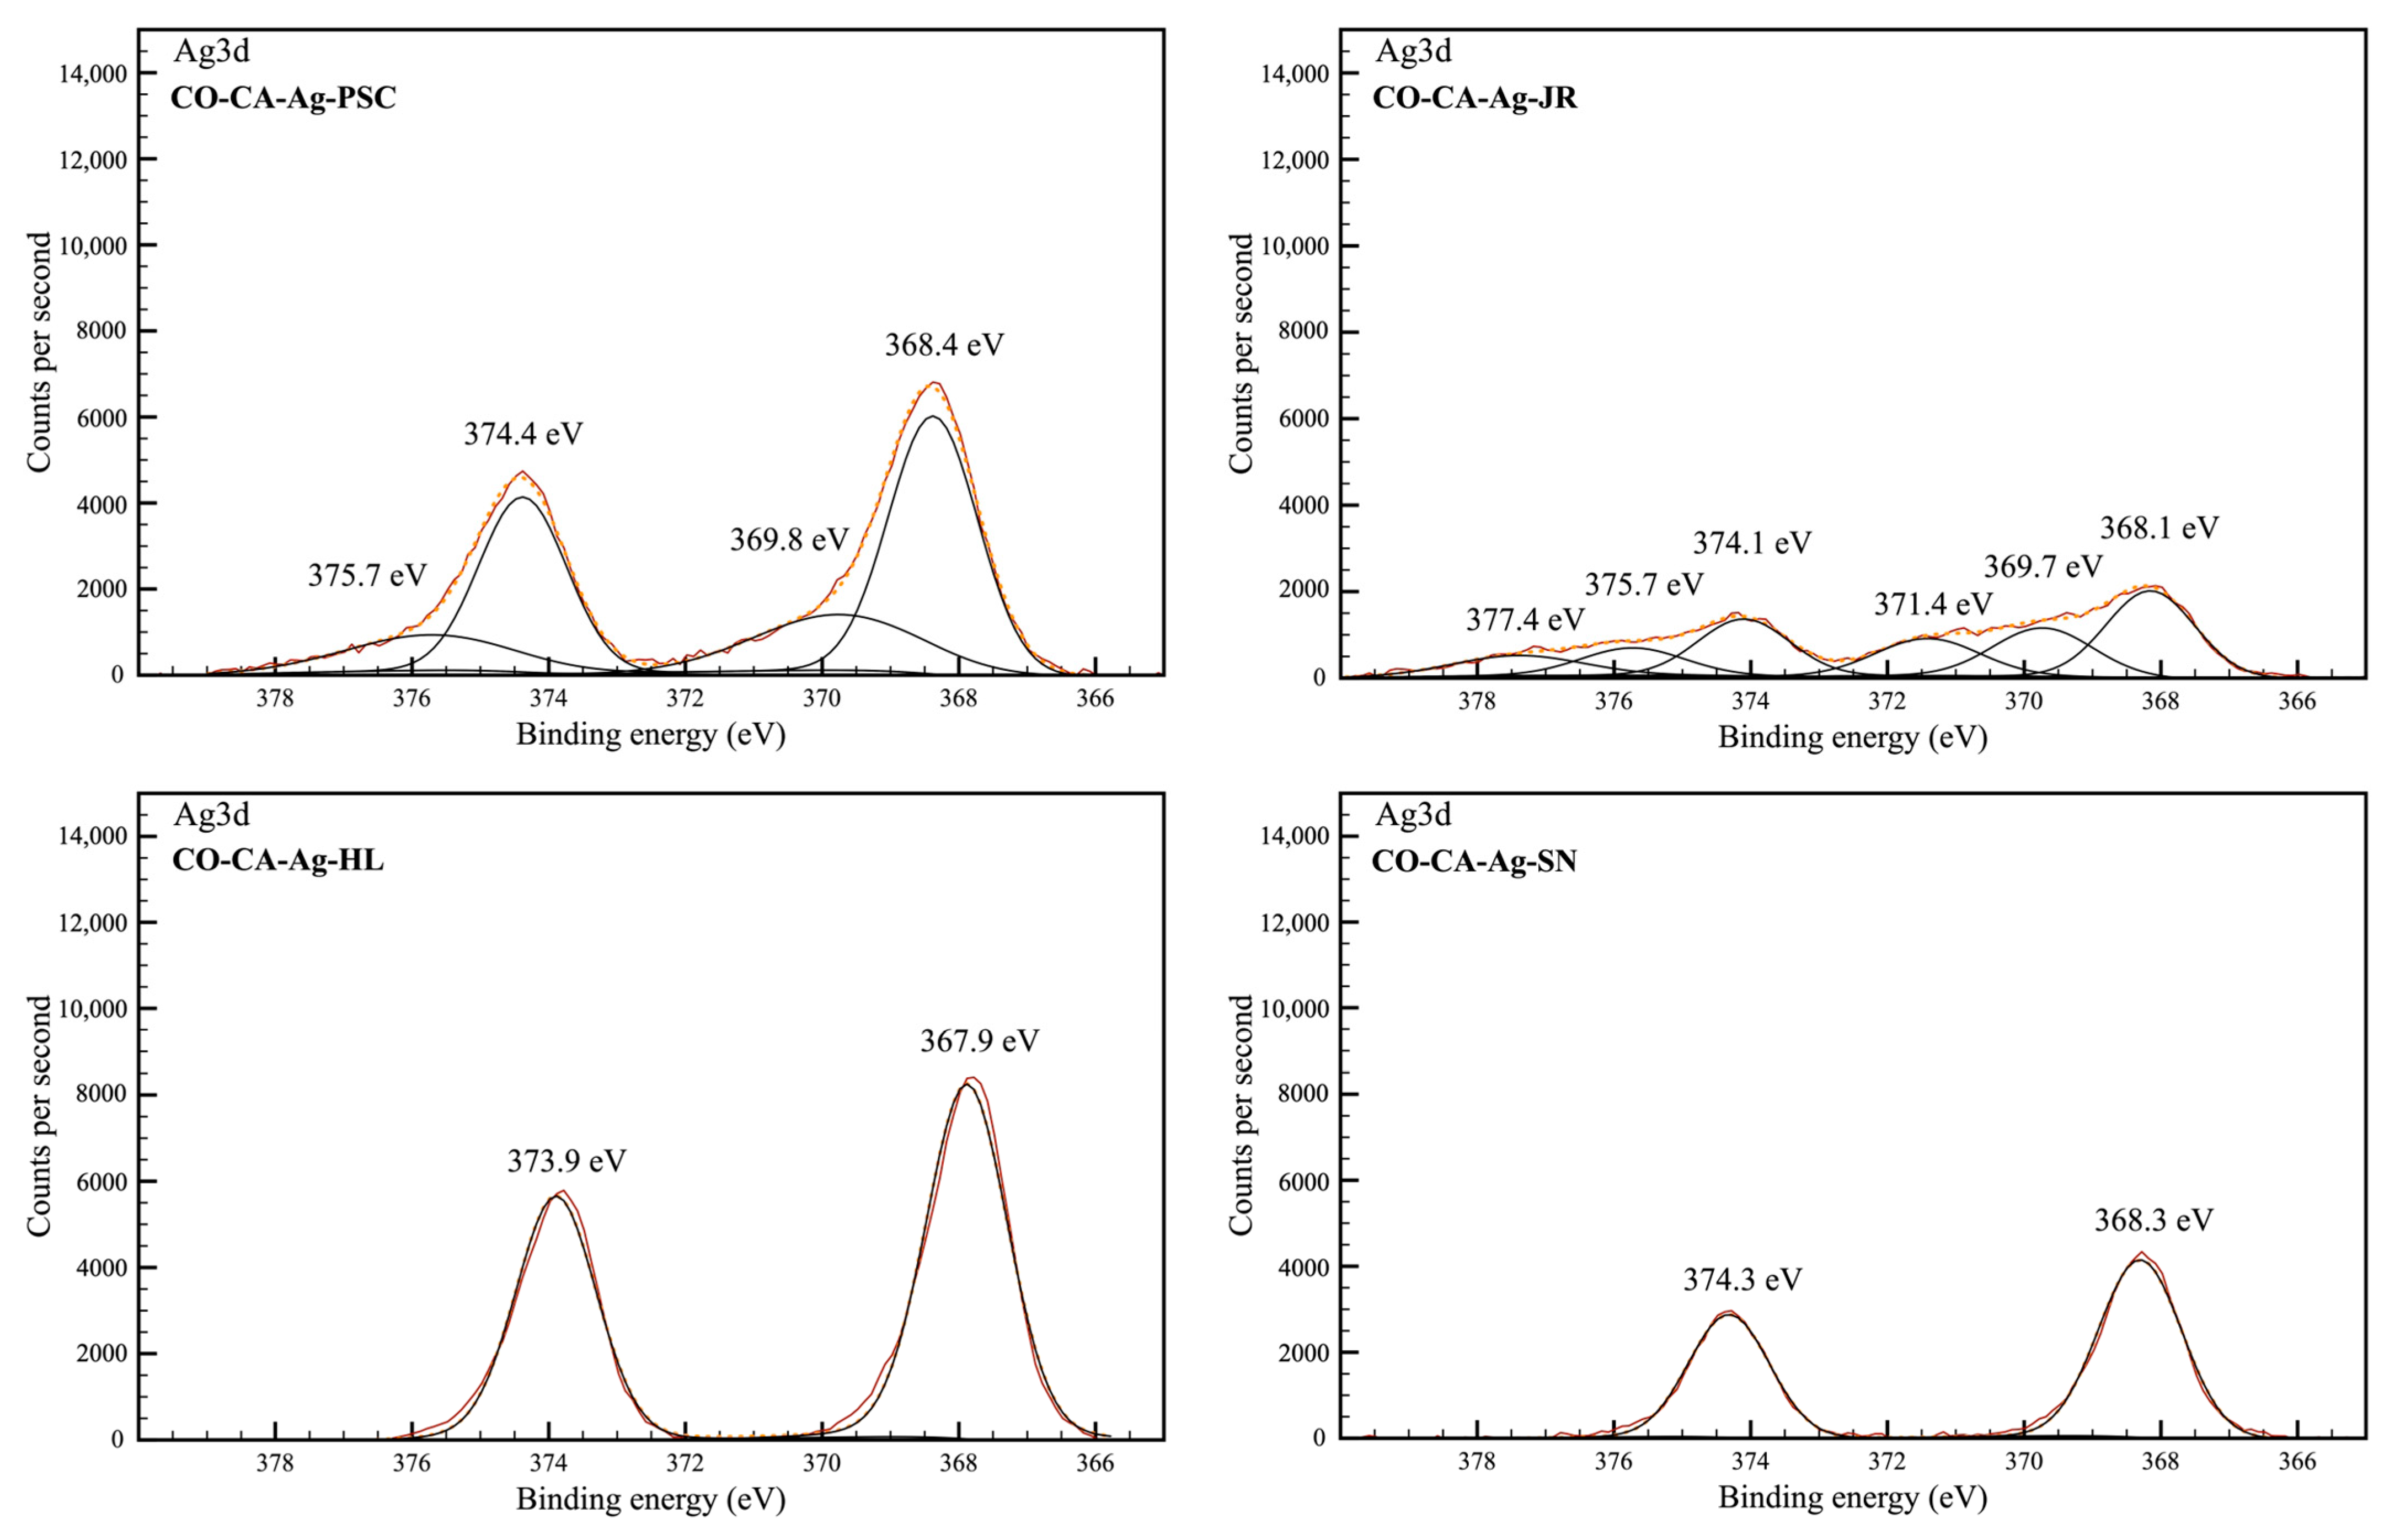
3.12. XPS Analysis
3.13. Antimicrobial Test
3.14. The Release of Ag+-Ions from the Samples into the Physiological Solution
3.15. Cytotoxicity Test
4. Conclusions
Supplementary Materials
Author Contributions
Funding
Institutional Review Board Statement
Informed Consent Statement
Data Availability Statement
Acknowledgments
Conflicts of Interest
References
- Hassabo, A.G.; El-Naggar, M.E.; Mohamed, A.L.; Hebeish, A.A. Development of multifunctional modified cotton fabric with tri-component nanoparticles of silver, copper and zinc oxide. Carbohyd. Polym. 2019, 210, 144–156. [Google Scholar] [CrossRef]
- Meenu, N.C.; Manokari, S.L.; Senthil, T.S. Plant-mediated green synthesis, characterization and antibacterial efficacy of Ag-NPS using extracts of Wrightia tinctoria leaves for biological applications. J. Optoelectron. Biomed. Mater. 2021, 13, 77–88. [Google Scholar] [CrossRef]
- Ganesan, R.M.; Prabu, H.G. Synthesis of gold nanoparticles using herbal Acorus calamus rhizome extract and coating on cotton fabric for antibacterial and UV blocking applications. Arab. J. Chem. 2019, 12, 2166–2174. [Google Scholar] [CrossRef]
- Maghimaa, M.; Alharbi, S.A. Green synthesis of silver nanoparticles from Curcuma longa L. and coating on the cotton fabrics for antimicrobial applications and wound healing activity. J. Photochem. Photobiol. B Biol. 2020, 204, 111806. [Google Scholar] [CrossRef]
- Zain, N.M.; Stapley, A.G.F.; Shama, G. Green synthesis of silver and copper nanoparticles using ascorbic acid and chitosan for antimicrobial applications. Carbohydr. Polym. 2014, 112, 195–202. [Google Scholar] [CrossRef]
- David, L.; Moldovan, B.; Vulcu, A.; Olenic, L.; Perde-Schrepler, M.; Fischer-Fodor, E.; Florea, A.; Crisan, M.; Chiorean, I.; Clichici, S.; et al. Green synthesis, characterization and anti-inflammatory activity of silver nanoparticles using European black elderberry fruits extract Luminita. Colloids Surf. B: Biointerfaces 2014, 122, 767–777. [Google Scholar] [CrossRef] [PubMed]
- Moldovan, B.; David, L.; Achim, M.; Clichici, S.; Filip, G.A. A green approach to phytomediated synthesis of silver nanoparticles using Sambucus nigra L. fruits extract and their antioxidant activity. J. Mol. Liq. 2016, 221, 271–278. [Google Scholar] [CrossRef]
- Das, P.; Dutta, T.; Manna, S.; Loganathan, S.; Basak, P. Facile green synthesis of non-genotoxic, non-hemolytic organometallic silver nanoparticles using extract of crushed, wasted, and spent Humulus lupulus (hops): Characterization, anti-bacterial, and anti-cancer studies. Environ. Res. 2022, 204, 111962. [Google Scholar] [CrossRef] [PubMed]
- Loo, Y.Y.; Chieng, B.W.; Nishibuchi, M.; Radu, S. Synthesis of silver nanoparticles by using tea leaf extract from Camellia sinensis. Int. J. Nanomed. 2012, 7, 4263–4267. [Google Scholar]
- Loo, Y.Y.; Rukayadi, Y.; Nor-Khaizura, M.A.R.; Kuan, C.H.; Chieng, B.W.; Nishibuchi, M.; Radu, S. In Vitro Antimicrobial Activity of Green Synthesized Silver Nanoparticles Against Selected Gram-negative Foodborne Pathogens. Front. Microbiol. 2018, 9, 1555. [Google Scholar] [CrossRef] [PubMed]
- Chopra, H.; Bibi, S.; Singh, I.; Hasan, M.M.; Khan, M.S.; Yousafi, Q.; Baig, A.A.; Rahman, M.M.; Islam, F.; Emran, T.B.; et al. Green Metallic Nanoparticles: Biosynthesis to Applications. Front. Bioeng. Biotechnol. 2022, 10, 874742. [Google Scholar] [CrossRef]
- Alavi, M.; Moradi, M. Different antibacterial and photocatalyst functions for herbal and bacterial synthesized silver and copper/copper oxide nanoparticles/nanocomposites: A review. Inorg. Chem. Commun. 2022, 142, 109590. [Google Scholar] [CrossRef]
- Abdelaziz, A.M.; Elshaer, M.A.; Elraheem, M.A.A.; Ali, O.M.; Haggag, M.I.; El-Sayyad, G.S.; Attia, M.S. Ziziphus spina christi extract stabilized novel silver nanoparticle synthesis for combating Fusarium oxysporum causing pepper wilt disease: In vitro and in vivo studies. Arch. Microbiol. 2023, 205, 69. [Google Scholar] [CrossRef]
- Khan, M.; Shaik, M.R.; Adil, S.F.; Khan, S.T.; Al-Warthan, A.; Siddiqui, M.H.; Tahir, M.N.; Tremel, W. Plant extracts as green reductants for the synthesis of silver nanoparticles: Lessons from chemical synthesis. Dalton Trans. 2018, 47, 11988–12010. [Google Scholar] [CrossRef] [PubMed]
- Ranoszek-Soliwoda, K.; Tomaszewska, K.; Małek, G.; Celichowski, P.; Orlowski, M.; Krzyzowska, J. Grobelny, The synthesis of monodisperse silver nanoparticles with plant extracts. Colloids Surf. B Biointerfaces 2019, 177, 19–24. [Google Scholar] [CrossRef] [PubMed]
- Franci, G.; Falanga, A.; Galdiero, S.; Palomba, L.; Rai, M.; Morelli, G.; Galdiero, M. Silver Nanoparticles as Potential Antibacterial Agents. Molecules 2015, 20, 8856–8874. [Google Scholar] [CrossRef] [PubMed]
- Naqvi, S.I.Z.; Kausar, H.; Afzal, A.; Hashim, M.; Mujahid, H.; Javed, M.; Hano, C.; Anjum, S. Antifungal Activity of Juglans-regia-Mediated Silver Nanoparticles (AgNPs) against Aspergillus-ochraceus-Induced Toxicity in In Vitro and In Vivo Settings. J. Funct. Biomater. 2023, 14, 221. [Google Scholar] [CrossRef] [PubMed]
- Thakur, N.D.; Gaikar, V.G.; Sen, D.; Mazumder, S.; Pandita, N.S. Phytosynthesis of Silver Nanoparticles Using Walnut (Juglans regia) Bark with Characterization of the Antibacterial Activity against Streptococcus mutans. Anal. Lett. 2017, 50, 690–711. [Google Scholar] [CrossRef]
- Crisan, M.; David, L.; Moldovan, B.; Vulcu, A.; Dreve, S.; Perde-Schrepler, M.; Tatomir, C.; Filip, A.G.; Bolfa, P.; Achim, M.; et al. New nanomaterials for the improvement of psoriatic lesions. J. Mater. Chem. B 2013, 1, 3152–3158. [Google Scholar] [CrossRef] [PubMed]
- Shilpa, S.A.; Pavithra, A.J.; Hikku, G.S.; Jeyasubramanian, K.; ·Veluswamy, P.; Ikeda, H. Imparting Efcient Antibacterial Activity to Cotton Fabrics by Coating with Green Synthesized Nano-Ag/PMMA Composite. BioNanoScience 2023, 13, 2180–2194. [Google Scholar] [CrossRef]
- Zhicai, Y.; Jinru, L.; Hualing, H.; Yushu, W.; Yuhang, Z.; Qi Lu Yi, Q.; Yushi, K.; Ying, P. Green synthesis of silver nanoparticles with black rice (Oryza sativa L.) extract endowing carboxymethyl chitosan modified cotton with high anti-microbial and durable properties. Cellulose 2021, 28, 1827–1842. [Google Scholar] [CrossRef]
- Jain, A.; Kongkham, B.; Puttaswamy, H.; Butola, B.S.; Malik, H.K.; Malik, A. Development of Wash-Durable Antimicrobial Cotton Fabrics by In Situ Green Synthesis of Silver Nanoparticles and Investigation of Their Antimicrobial Efficacy against Drug-Resistant Bacteria. Antibiotics 2022, 11, 864. [Google Scholar] [CrossRef]
- dos Santos, O.A.L.; de Araujo, I.; da Silva, F.D.; Sales, M.N.; Christoffolete, M.A.; Backx, B.P. Surface modification of textiles by green nanotechnology against pathogenic microorganisms. Curr. Res. Green Sustain. Chem. 2021, 4, 100206. [Google Scholar] [CrossRef]
- Štular, D.; Savio, E.; Simončič, B.; Šobak, M.; Jerman, I.; Poljanšek, I.; Ferri, A.; Tomšič, B. Multifunctional antibacterial and ultraviolet protective cotton cellulose developed by in situ biosynthesis of silver nanoparticles into a polysiloxane matrix mediated by sumac leaf extract. Appl. Surf. Sci. 2021, 563, 150361. [Google Scholar] [CrossRef]
- Filipič, J.; Glažar, D.; Jerebic, Š.; Kenda, D.; Modic, A.; Roškar, B.; Vrhovski, I.; Štular, D.; Golja, B.; Smolej, S.; et al. Tailoring of Antibacterial and UV-protective Cotton Fabric by an in situ Synthesis of Silver Particles in the Presence of a Sol-gel Matrix and Sumac Leaf Extract. Tekstilec 2020, 63, 4–13. [Google Scholar] [CrossRef]
- Jain, S.; Mehata, M.S. Medicinal plant leaf extract and pure flavonoid mediated green synthesis of silver nanoparticles and their enhanced antibacterial property. Sci. Rep. 2017, 7, 15867. [Google Scholar] [CrossRef] [PubMed]
- Huang, J.; Li, Q.; Sun, D.; Lu, Y.; Su, Y.; Yang, X.; Wang, H.; Wang, Y.; Shao, W.; He, N.; et al. Biosynthesis of silver and gold nanoparticles by novel sundried Cinnamomum camphora leaf. Nanotechnology 2007, 18, 105104. [Google Scholar] [CrossRef]
- Terenteva, E.A.; Apyari, V.V.; Dmitrienko, S.G.; Zolotov, Y.A. Formation of plasmonic silver nanoparticles by flavonoid reduction: A comparative study and application for determination of these substances. Spectrochim. Acta A 2015, 151, 89–95. [Google Scholar] [CrossRef] [PubMed]
- Eslami, M.A.; Ebrahimzadeh, P. Biparva, Green synthesis of safe zero valent iron nanoparticles by Myrtus communis leaf extract as an effective agent for reducing excessive iron in iron-overloaded mice, a thalassemia model. RSC Adv. 2018, 8, 26144–26155. [Google Scholar] [CrossRef] [PubMed]
- Krkobabić, A.; Marković, D.; Kovačević, A.; Tadić, V.; Radoičić, M.; Barudžija, T.; Ilic-Tomic, T.; Radetić, M. Antimicrobial nanocomposites based on oxidized cotton fabric and in situ biosynthesized copper oxides nanostructures using bearberry leaves extract. Fiber. Polym. 2022, 23, 954–966. [Google Scholar] [CrossRef]
- Krkobabić, A.; Radetić, M.; Tseng, H.H.; Nunney, T.S.; Tadić, V.; Ilic-Tomic, T.; Marković, D. Green in situ synthesis of Ag- and Cu-based nanoparticles on viscose fabric using a Punica granatum peel extract. Appl. Surf. Sci. 2023, 611, 155612. [Google Scholar] [CrossRef]
- Sivakumar, R.; Park, S.Y.; Lee, N.Y. Quercetin-mediated silver nanoparticle formation for the colorimetric detection of infectious pathogens coupled with loop-mediated isothermal amplification. ACS Sens. 2023, 8, 1422–1430. [Google Scholar] [CrossRef] [PubMed]
- Makarov, V.V.; Love, A.J.; Sinitsyna, O.V.; Makarova, S.S.; Yaminsky, I.V.; Taliansky, M.E.; Kalinina, N.O. “Green” Nanotechnologies: Synthesis of Metal Nanoparticles Using Plants. Acta Naturae 2014, 6, 35–44. [Google Scholar] [CrossRef] [PubMed]
- Marković, D.; Deeks, C.; Nunney, T.; Radovanović, Ž.; Radoičić, M.; Šaponjić, Z.; Radetić, M. Antibacterial activity of Cu-based nanoparticles synthesized on the cotton fabrics modified with polycarboxylic acids. Carbohyd. Polym. 2018, 173, 200. [Google Scholar] [CrossRef] [PubMed]
- Chung, C.; Lee, M.; Choe, E. Characterization of cotton fabric scouring by FT-IR ATR spectroscopy. Carbohyd. Polym. 2004, 58, 417–420. [Google Scholar] [CrossRef]
- Xu, W.; Li, Y. Crosslinking analysis of polycarboxylic acid durable press finishing of cotton fabrics and strength retention improvement. Text. Res. J. 2000, 70, 588–592. [Google Scholar] [CrossRef]
- Meilert, K.T.; Laub, D.; Kiwi, J. Photocatalytic self-cleaning of modified cotton textiles by TiO2 clusters attached by chemical spacers. J. Mol. Catal. A-Chem. 2005, 237, 101–108. [Google Scholar] [CrossRef]
- Khajavi, R.; Berendjchi, A. Effect of dicarboxylic acid chain length on the self-cleaning property of nano-TiO2 –coated cotton fabrics. ACS Appl. Mater. Inter. 2014, 6, 18795–18799. [Google Scholar] [CrossRef] [PubMed]
- Šauperl, O.; Kleinschek, K.S.; Ribitsch, V. Cotton cellulose 1,2,3,4 buthanetetracarboxylic acid (BTCA) crosslinking monitored by some physical-chemical methods. Text. Res. J. 2009, 79, 780–791. [Google Scholar] [CrossRef]
- Čuk, N.; Šala, M.; Gorjanc, M. Development of antibacterial and UV protective cotton fabrics using plant food waste and alien invasive plant extracts as reducing agents for the in-situ synthesis of silver nanoparticles. Cellulose 2021, 28, 3215–3233. [Google Scholar] [CrossRef]
- Fras, L.; Johansson, L.S.; Stenius, P.; Laine, J.; Stana-Kleinschek, K.; Ribitsch, V. Analysis of the oxidation of cellulose fibres by titration and XPS. Colloid Surf. A Physicochem. Eng. Asp. 2005, 260, 101–108. [Google Scholar] [CrossRef]
- Meye Biyogo, A.; Hespel, L.; Humblot, V.; Lebrun, L.; Estour, F. Cellulose fibers modification through metal-free click chemistry for the elaboration of versatile functional surfaces. Eur. Polym. J. 2020, 135, 109866. [Google Scholar] [CrossRef]
- Wang, C.; Wang, H.; Dang, B.; Yang, Y.; Zhou, L.; Li, Y.; Sun, Q. A Versatile 2D Cellulose Platform Strategy from Natural Wood Scaffold. ACS Nano 2023, 17, 12663–12672. [Google Scholar] [CrossRef]
- Ma, J.; Li, N.; Zhang, Q.; Zhang, X.; Wang, J.; Li, K.; Hao, X.; Yan, J. Synthesis of porous and metallic CoB nanosheets towards a highly efficient electrocatalyst for rechargeable Na–O2 batteries. Energy Environ. Sci. 2018, 11, 2833–2838. [Google Scholar] [CrossRef]
- Sedighi, A.; Naderi, M.; Brycki, B. Wearable nonwoven fabric decorated with Fe3O4/rGO/PANI/Ni-P for efficient electromagnetic interference shielding. J. Alloy Compd. 2023, 938, 168454. [Google Scholar] [CrossRef]
- Ribeiro, A.I.; Modic, M.; Cvelbar, U.; Dinescu, G.; Mitu, B.; Nikiforov, A.; Leys, C.; Kuchakova, I.; De Vrieze, M.; Felgueiras, H.P.; et al. Effect of Dispersion Solvent on the Deposition of PVP-Silver Nanoparticles onto DBD Plasma-Treated Polyamide 6,6 Fabric and Its Antimicrobial Efficiency. Nanomaterials 2020, 10, 607. [Google Scholar] [CrossRef] [PubMed]
- Ferraria, A.M.; Carapeto, A.P.; Botelho do Rego, A.M. X-ray photoelectron spectroscopy: Silver salts revisited. Vacuum 2012, 86, 1988–1991. [Google Scholar] [CrossRef]
- Sohn, Y. SiO2 nanospheres modified by Ag nanoparticles: Surface charging and CO oxidation activity. J. Mol. Catal. A-Chem. 2013, 379, 59–67. [Google Scholar] [CrossRef]
- Ahmad, N.; Sharma, S.; Alam, M.K.; Singh, V.N.; Shamsi, S.F.; Mehta, B.R.; Fatma, A. Rapid synthesis of silver nanoparticles using dried medicinal plant of basil. Colloids Surf. B Biointerfaces 2010, 81, 81–86. [Google Scholar] [CrossRef] [PubMed]
- Srisod, S.; Motina, K.; Inprasit, T.; Pisitsak, P. A green and facile approach to durable antimicrobial coating of cotton with silver nanoparticles, whey protein, and natural tannin. Prog. Org. Coat. 2018, 120, 123–131. [Google Scholar] [CrossRef]
- López-García, J.; Lehocký, M.; Humpolíček, P.; Sáha, P. HaCaT Keratinocytes Response on Antimicrobial Atelocollagen Substrates: Extent of Cytotoxicity, Cell Viability and Proliferation. J. Funct. Biomater. 2014, 5, 43–57. [Google Scholar] [CrossRef] [PubMed]
- Ribeiro, A.I.; Shvalya, V.; Cvelbar, U.; Silva, R.; Marques-Oliveira, R.; Remião, F.; Felgueiras, H.P.; Padrão, J.; Zille, A. Stabilization of Silver Nanoparticles on Polyester Fabric Using Organo-Matrices for Controlled Antimicrobial Performance. Polymers 2022, 14, 1138. [Google Scholar] [CrossRef] [PubMed]
- Xu, Q.; Li, R.; Shena, L.; Xu, W.; Wang, J.; Jiang, Q.; Zhang, L.; Fu, F.; Fu, Y.; Liu, X. Enhancing the surface affinity with silver nano-particles for antibacterial cotton fabric by coating carboxymethyl chitosan and L-cysteine. Appl. Sur. Sci. 2019, 497, 143673. [Google Scholar] [CrossRef]
- Ballottin, D.; Fulaz, S.; Cabrini, F.; Tsukamoto, J.; Durána, N.; Alves, O.L.; Tasic, L. Antimicrobial textiles: Biogenic silver nanoparticles against Candida and Xanthomonas. Mater. Sci. Eng. C 2017, 75, 582–589. [Google Scholar] [CrossRef]
- Bastos, V.; Brown, D.; Johnston, H.; Daniel-da-Silva, A.L.; Duarte, I.F.; Santos, H.C. Oliveira Inflammatory responses of a human keratinocyte cell line to 10 nm citrate- and PEG-coated silver nanoparticles. J. Nanopart. Res. 2016, 18, 205. [Google Scholar] [CrossRef]
- Tadić, V.M.; Dobrić, S.; Marković, G.M.; Ðorđević, S.M.; Arsić, I.A.; Menković, N.R.; Stević, T. Anti-inflammatory, Gastroprotective, Free-Radical-Scavenging, and Antimicrobial Activities of Hawthorn Berries Ethanol Extract. J. Agric. Food Chem. 2008, 56, 7700–7709. [Google Scholar] [CrossRef]
- Velioglu, Y.S.; Mazza, G.; Gao, L.; Omah, B.D. Antioxidant activity and total phenolics inselectedfruits, vegetables, andgrainproducts. J. Agric. Food Chem. 1998, 46, 4113–4117. [Google Scholar] [CrossRef]
- European Pharmacopoeia 10.0; Council of Europe: Strasbourg Cedex, France, 2019; pp. 1422–1423.
- Hansen, M.B.; Nielsen, S.E.; Berg, K. Re-examination and further development of a precise and rapid dye method for measuring cell growth/cell kill. J. Immunol. Methods 1989, 119, 203. [Google Scholar] [CrossRef] [PubMed]


| Compound | Plant (mg/g DW) | |||
|---|---|---|---|---|
| P. spina-christi | J. regia | H. lupulus | S. nigra | |
| Neochlorogenic acid | / | 8.27 ± 0.23 | / | 4.65 ± 0.17 |
| Protocathehuic acid | 2.61 ± 0.31 | / | 1.78 ± 0.03 | / |
| Gallic acid | 3.76 ± 0.34 | 1.20 ± 0.08 | 0.26 ± 0.01 | 2.30 ± 0.10 |
| Chlorogenic acid | / | 6.72 ± 0.20 | / | 43.99 ± 0.85 |
| Ellagic acid | / | 5.02 ± 0.16 | / | / |
| Vanilic acid | 0.80 ± 0.11 | / | / | / |
| Quercetin derivative | 6.90 ± 0.21 | |||
| Rutin | 19.56 ± 0.67 | 20.63 ± 1.02 | 2.22 ± 0.10 | 45.61 ± 0.89 |
| Hyperoside | / | 4.06 ± 0.33 | 0.32 ± 0.02 | 2.77 ± 010 |
| Isoquercetin | 4.12 ± 0.11 | 3.12 ± 0.22 | / | / |
| Miquelianin | / | 8.30 ± 0.31 | / | 3.22 ± 0.13 |
| Kaempferol-3-O-glucuronide | / | 6.51 ± 0.19 | / | / |
| Quercitrin | / | 5.54 ± 0.13 | / | 5.61 ± 0.12 |
| 3,5-di-O-caffeoylquinic acid | / | / | / | 1.16 ± 0.08 |
| Kaempferol-3-O-glucoside | 0.29 ± 0.01 | 1.21 ± 0.10 | 0.18 ± 0.01 | / |
| Quercetin * | 19.63 ± 0.54 | 33.22 ± 1.30 | 1.35 ± 0.08 | 49.07 ± 1.02 |
| Kaempferol * | 0.56 ± 0.07 | 8.92 ± 0.56 | 1.22 ± 0.10 | 0.33 ± 0.02 |
| Isorhamnetin * | / | / | / | 2.99 ± 0.09 |
| Total flavonoid content (%) | 2.13 ± 0.11 | 3.95 ± 0.15 | 0.29 ± 0.03 | 4.95 ± 0.10 |
| Total polyphenol content (mg GAE/g ext.) | 492.93 ± 3.05 | 220.74 ± 2.11 | 61.41 ± 0.67 | 127.40 ± 1.11 |
| Sample | C | O | Ag | Cl | Mg | Ca | N | S | P | C/O | C/N |
|---|---|---|---|---|---|---|---|---|---|---|---|
| CO | 62.72 | 37.28 | - | - | - | - | - | - | - | 1.68 | - |
| CO-CA-Ag-PSC | 61.13 | 31.28 | 4.61 | 1.84 | - | - | - | 1.13 | - | 1.95 | - |
| CO-CA-Ag-JR | 61.63 | 33.57 | 2.49 | 2.3 | - | - | - | - | - | 1.84 | - |
| CO-CA-Ag-HL | 57.17 | 29.83 | 4.29 | 3.82 | - | - | 4.88 | - | - | 1.92 | 11.72 |
| CO-CA-Ag-SN | 60.83 | 31.48 | 1.95 | 0.56 | - | - | 4.18 | 1.0 | - | 1.93 | 14.55 |
| Sample | C | O | Ag | Cl | Mg | Ca | N | S | P | C/O | C/N |
|---|---|---|---|---|---|---|---|---|---|---|---|
| CO | 78.29 | 21.41 | - | - | - | - | - | - | - | 3.66 | - |
| CO-CA-Ag-PSC | 63.76 | 22.77 | 6.44 | 1.76 | 2.1 | 1.49 | - | - | 1.67 | 2.80 | - |
| CO-CA-Ag-JR | 66.58 | 21.23 | 6.26 | 2.1 | 2.61 | 1.21 | - | - | - | 3.14 | - |
| CO-CA-Ag-HL | 62.89 | 20.65 | 8.31 | 3.92 | 2.45 | 1.78 | - | - | - | 3.05 | - |
| CO-CA-Ag-SN | 71.31 | 21.24 | 3.96 | 0.47 | 1.52 | 0.93 | - | 0.57 | - | 3.36 | - |
| C1s | O1s | |||||||
|---|---|---|---|---|---|---|---|---|
| C-C/C-H | C-O | O-C-O | O-C=O | C=O | O-C-O/ C-OH | O-C=O | H2O | |
| Samples | 284.8 eV | 286.4 eV | 287.8 eV | 289.9 eV | 531.6 eV | 532.9 eV | 534.0 eV | 535.8 eV |
| CO | 26.5 | 43.0 | 30.5 | - | - | 100.0 | - | - |
| CO-CA-Ag-PSC | 28.4 | 39.5 | 29.2 | 2.9 | - | 69.2 | 24.0 | 6.7 |
| CO-CA-Ag-JR | 16.0 | 28.2 | 41.8 | 14.1 | - | 49.1 | 33.6 | 17.3 |
| CO-CA-Ag-HL | 33.2 | 41.9 | 24.9 | - | 12.2 | 87.8 | - | - |
| CO-CA-Ag-SN | 32.4 | 41.2 | 26.4 | - | 8.2 | 91.8 | - | - |
| Ag0/Ag+ | Ag2+ | Ag+-Ag2+ | Ag0/Ag+ | Ag2+ | Ag+-Ag2+ | |
|---|---|---|---|---|---|---|
| Samples | 367.9–368.4 eV | 369.7–369.8 eV | 371.4 eV | 373.9–374.4 eV | 375.7 eV | 377.4 eV |
| CO | - | - | - | - | - | - |
| CO-CA-Ag-PSC | 42.83 | 17.43 | - | 28.63 | 11.10 | - |
| CO-CA-Ag-JR | 28.65 | 17.78 | 14.27 | 19.25 | 10.41 | 9.64 |
| CO-CA-Ag-HL | 59.50 | - | - | 40.50 | - | - |
| CO-CA-Ag-SN | 59.81 | - | - | 40.19 | - | - |
| Sample | Microorganisms | |||||
|---|---|---|---|---|---|---|
| E. coli | S. aureus | C. albicans | ||||
| CFU | R (%) | CFU | R (%) | CFU | R (%) | |
| Inoculum | 3.6 × 10⁵ | 1.5 × 10⁵ | 1.3 × 10⁵ | |||
| Control CO | 4 × 10⁵ | 9.7 × 10⁴ | 1.1 × 10⁵ | |||
| CO-CA-Ag-PSC | 850 | 99.8 | 3 | 99.9 | 705 | 99.4 |
| CO-CA-Ag-JR | 3 × 10³ | 99.2 | 15 | 99.9 | 970 | 99.1 |
| CO-CA-Ag-HL | 580 | 99.8 | 20 | 99.9 | 750 | 99.3 |
| CO-CA-Ag-SN | 3 × 10³ | 99.2 | 25 | 99.9 | 500 | 99.5 |
Disclaimer/Publisher’s Note: The statements, opinions and data contained in all publications are solely those of the individual author(s) and contributor(s) and not of MDPI and/or the editor(s). MDPI and/or the editor(s) disclaim responsibility for any injury to people or property resulting from any ideas, methods, instructions or products referred to in the content. |
© 2024 by the authors. Licensee MDPI, Basel, Switzerland. This article is an open access article distributed under the terms and conditions of the Creative Commons Attribution (CC BY) license (https://creativecommons.org/licenses/by/4.0/).
Share and Cite
Krkobabić, A.; Radetić, M.; Zille, A.; Ribeiro, A.I.; Tadić, V.; Ilic-Tomic, T.; Marković, D. Plant-Assisted Synthesis of Ag-Based Nanoparticles on Cotton: Antimicrobial and Cytotoxicity Studies. Molecules 2024, 29, 1447. https://doi.org/10.3390/molecules29071447
Krkobabić A, Radetić M, Zille A, Ribeiro AI, Tadić V, Ilic-Tomic T, Marković D. Plant-Assisted Synthesis of Ag-Based Nanoparticles on Cotton: Antimicrobial and Cytotoxicity Studies. Molecules. 2024; 29(7):1447. https://doi.org/10.3390/molecules29071447
Chicago/Turabian StyleKrkobabić, Ana, Maja Radetić, Andrea Zille, Ana Isabel Ribeiro, Vanja Tadić, Tatjana Ilic-Tomic, and Darka Marković. 2024. "Plant-Assisted Synthesis of Ag-Based Nanoparticles on Cotton: Antimicrobial and Cytotoxicity Studies" Molecules 29, no. 7: 1447. https://doi.org/10.3390/molecules29071447
APA StyleKrkobabić, A., Radetić, M., Zille, A., Ribeiro, A. I., Tadić, V., Ilic-Tomic, T., & Marković, D. (2024). Plant-Assisted Synthesis of Ag-Based Nanoparticles on Cotton: Antimicrobial and Cytotoxicity Studies. Molecules, 29(7), 1447. https://doi.org/10.3390/molecules29071447