
Investigation on Combustion Characteristics and Molecular Structures of Heiyanquan Mining Area, Xinjiang, China

Abstract
1. Introduction
2. Results and Discussion
2.1. Proximate and Ultimate Analyses
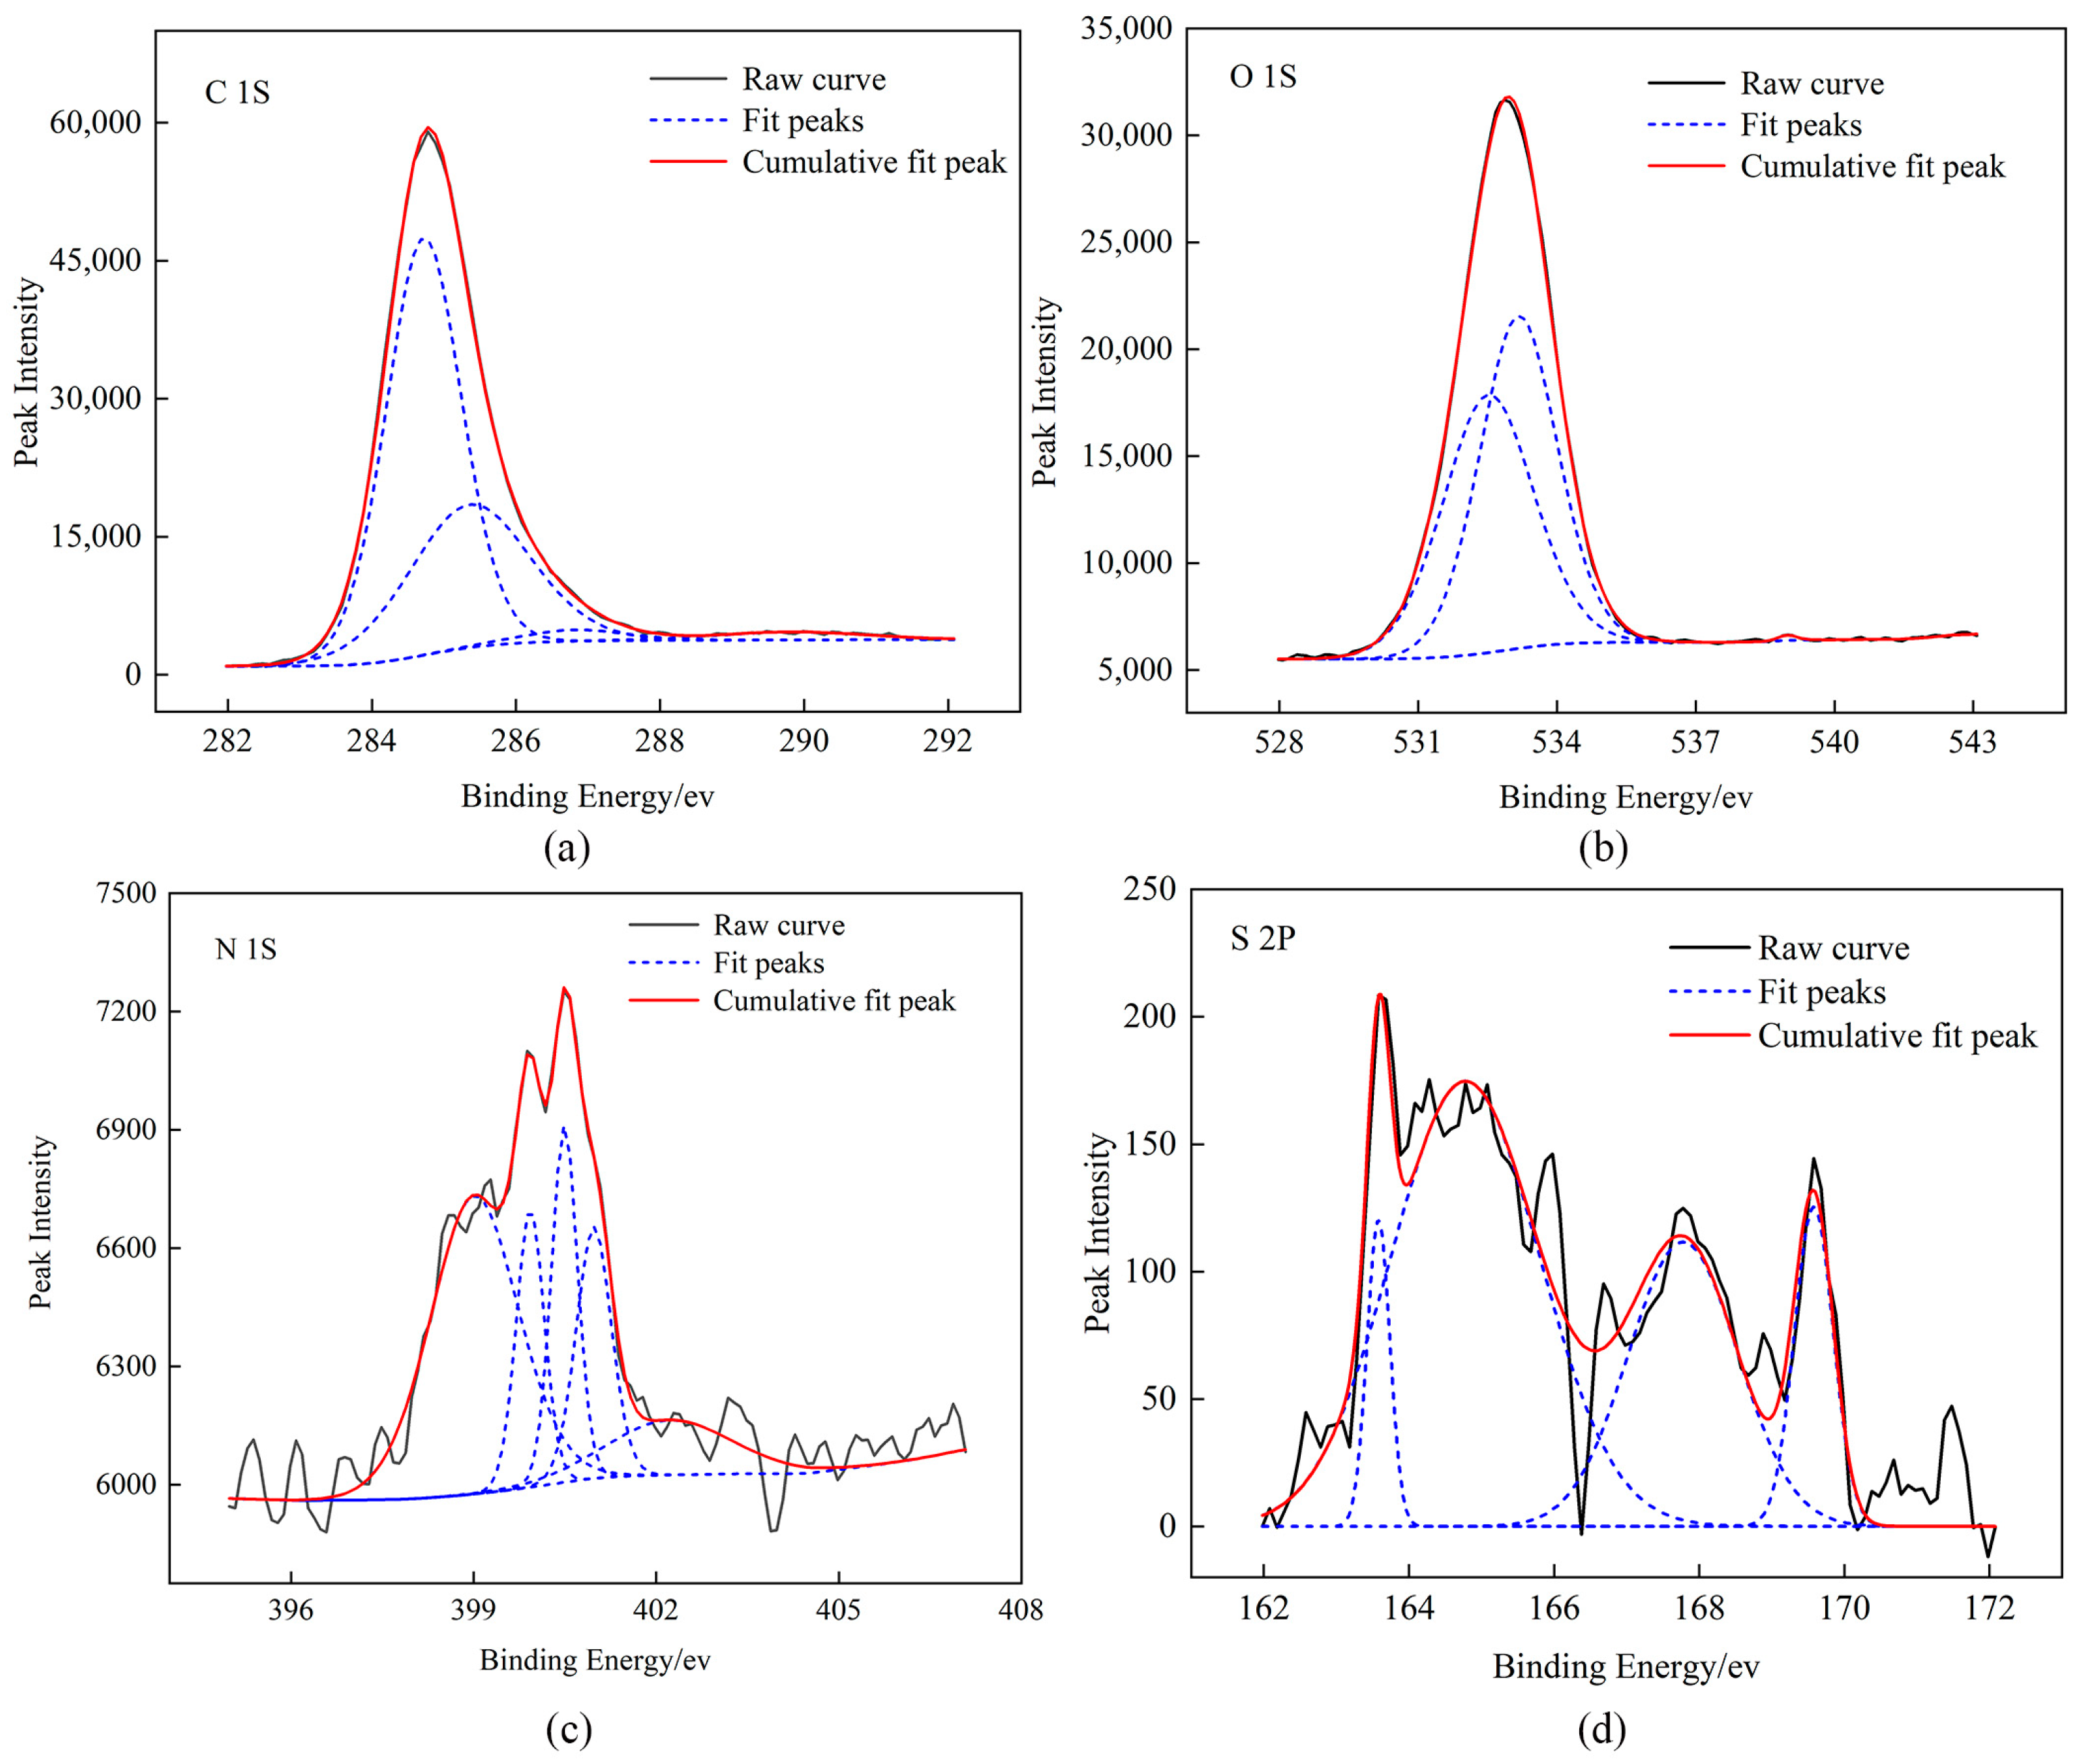
2.2. XPS Test Results
2.3. XRD Test Results
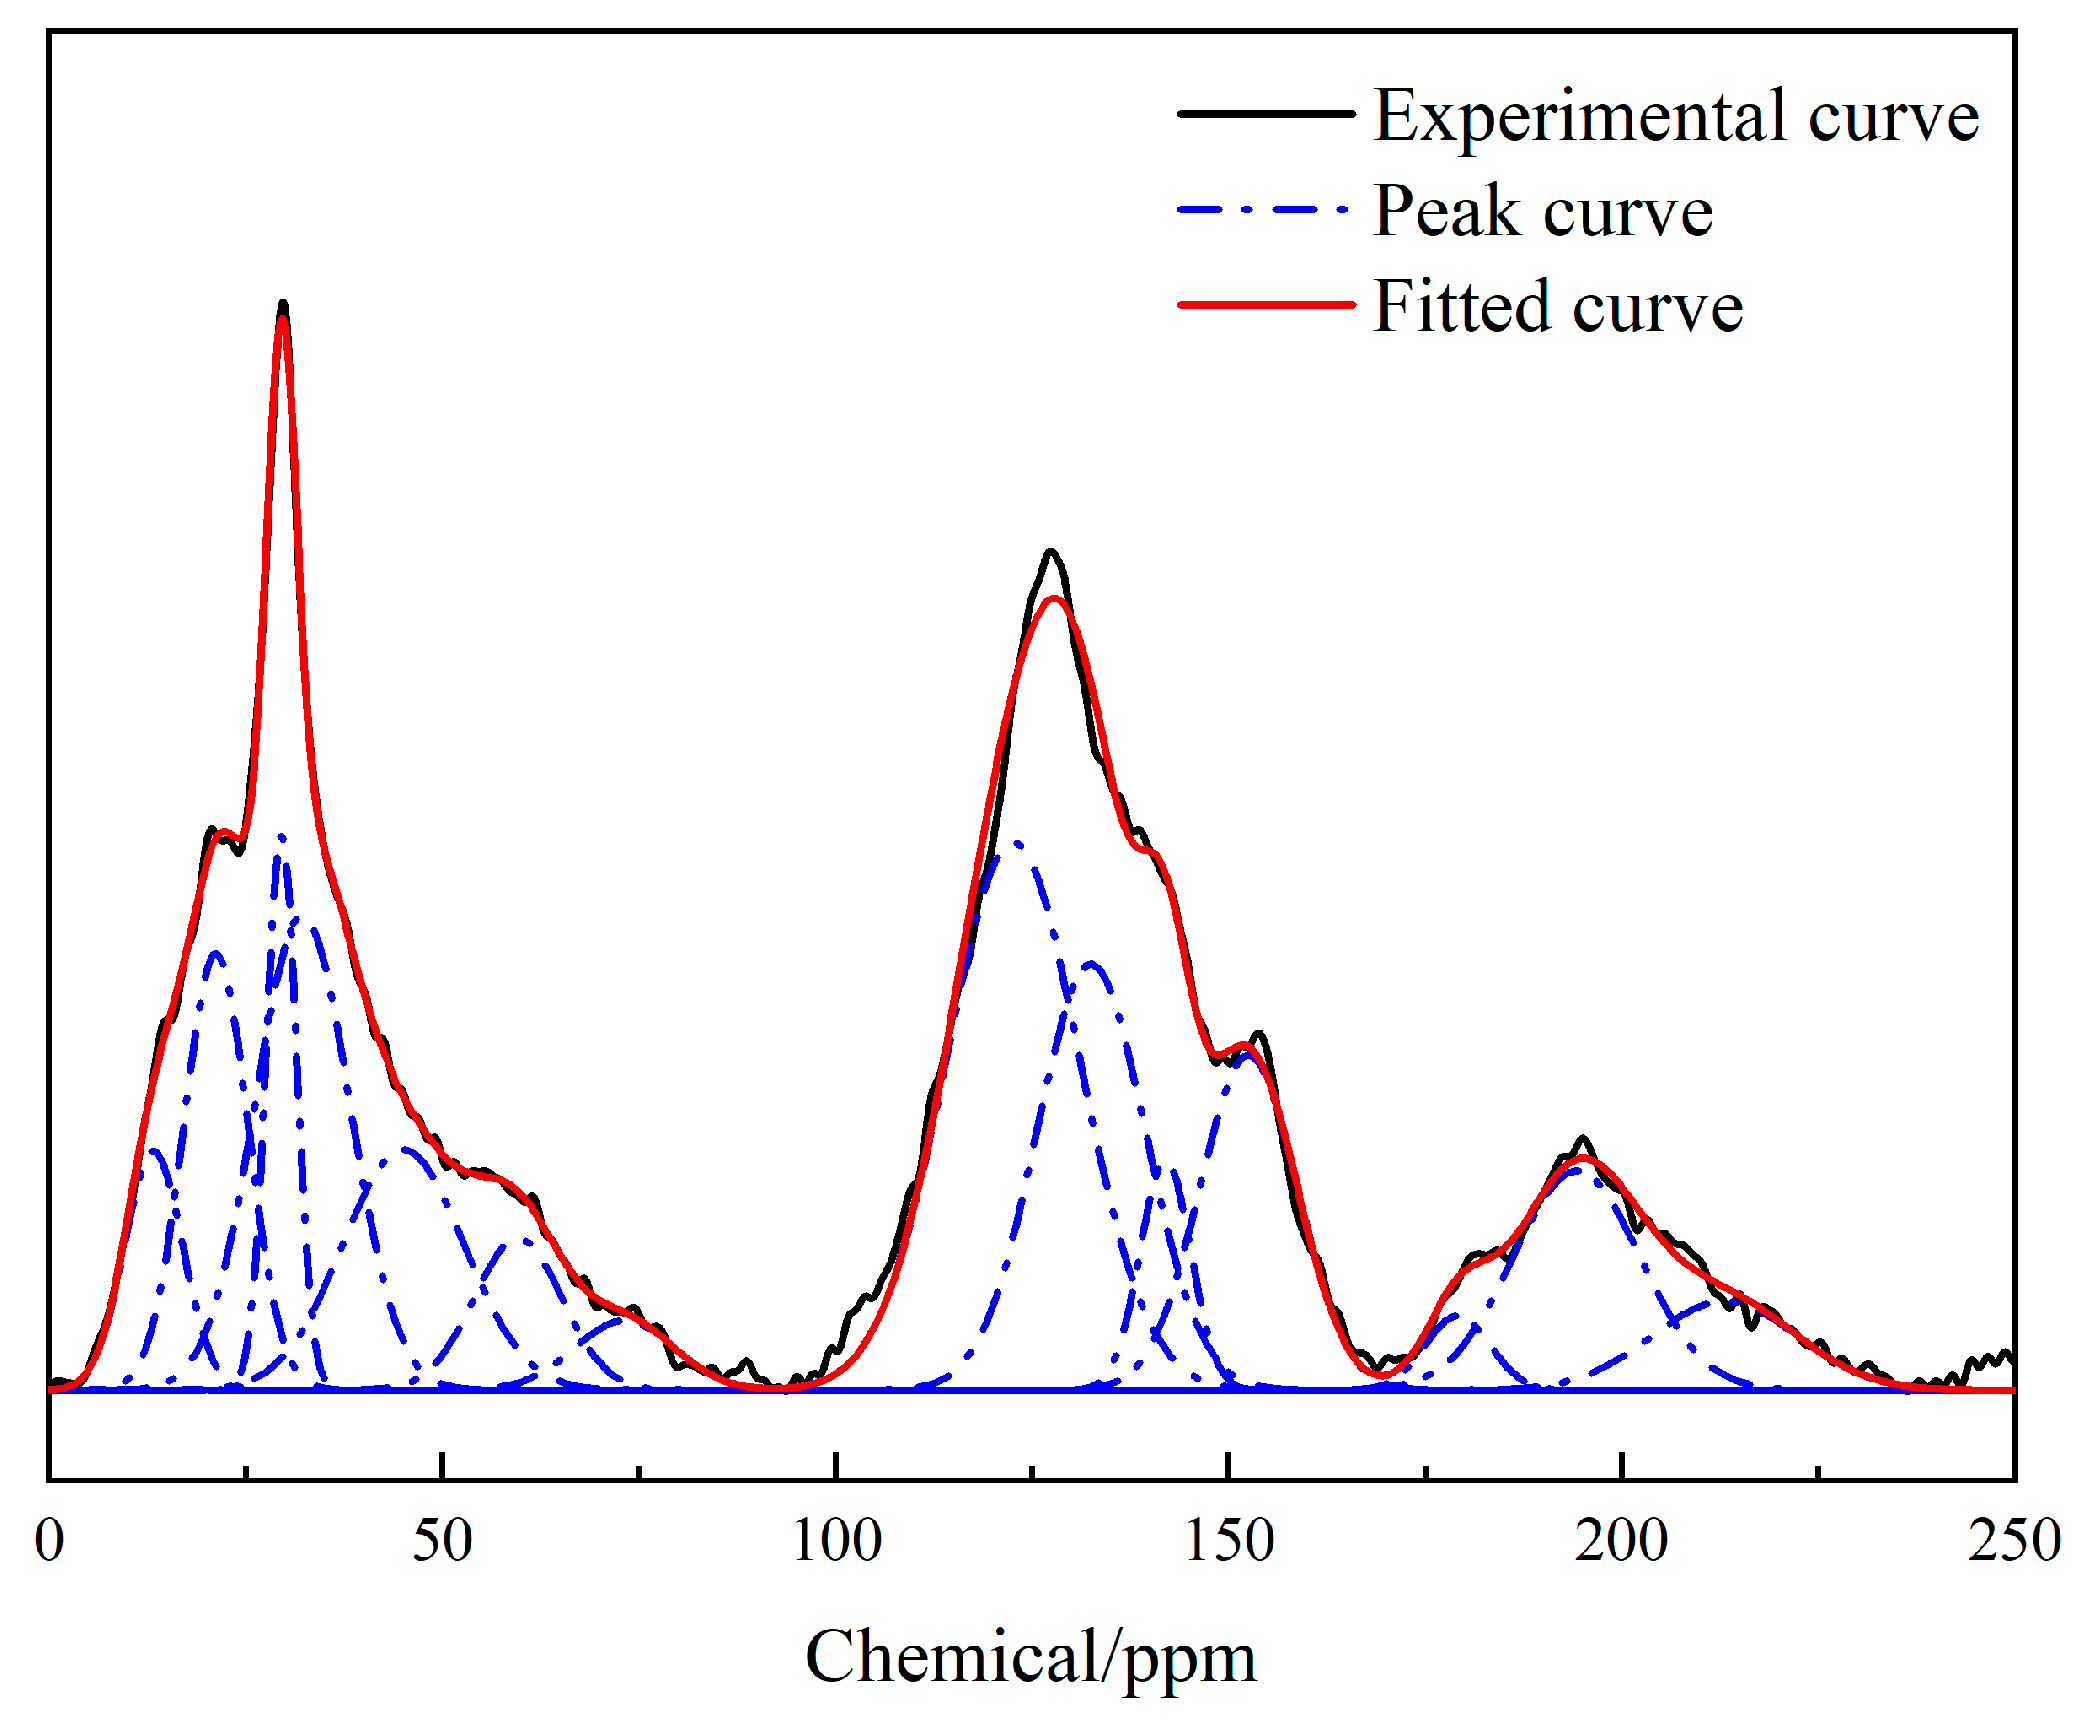
2.4. 13C-NMR Test Result
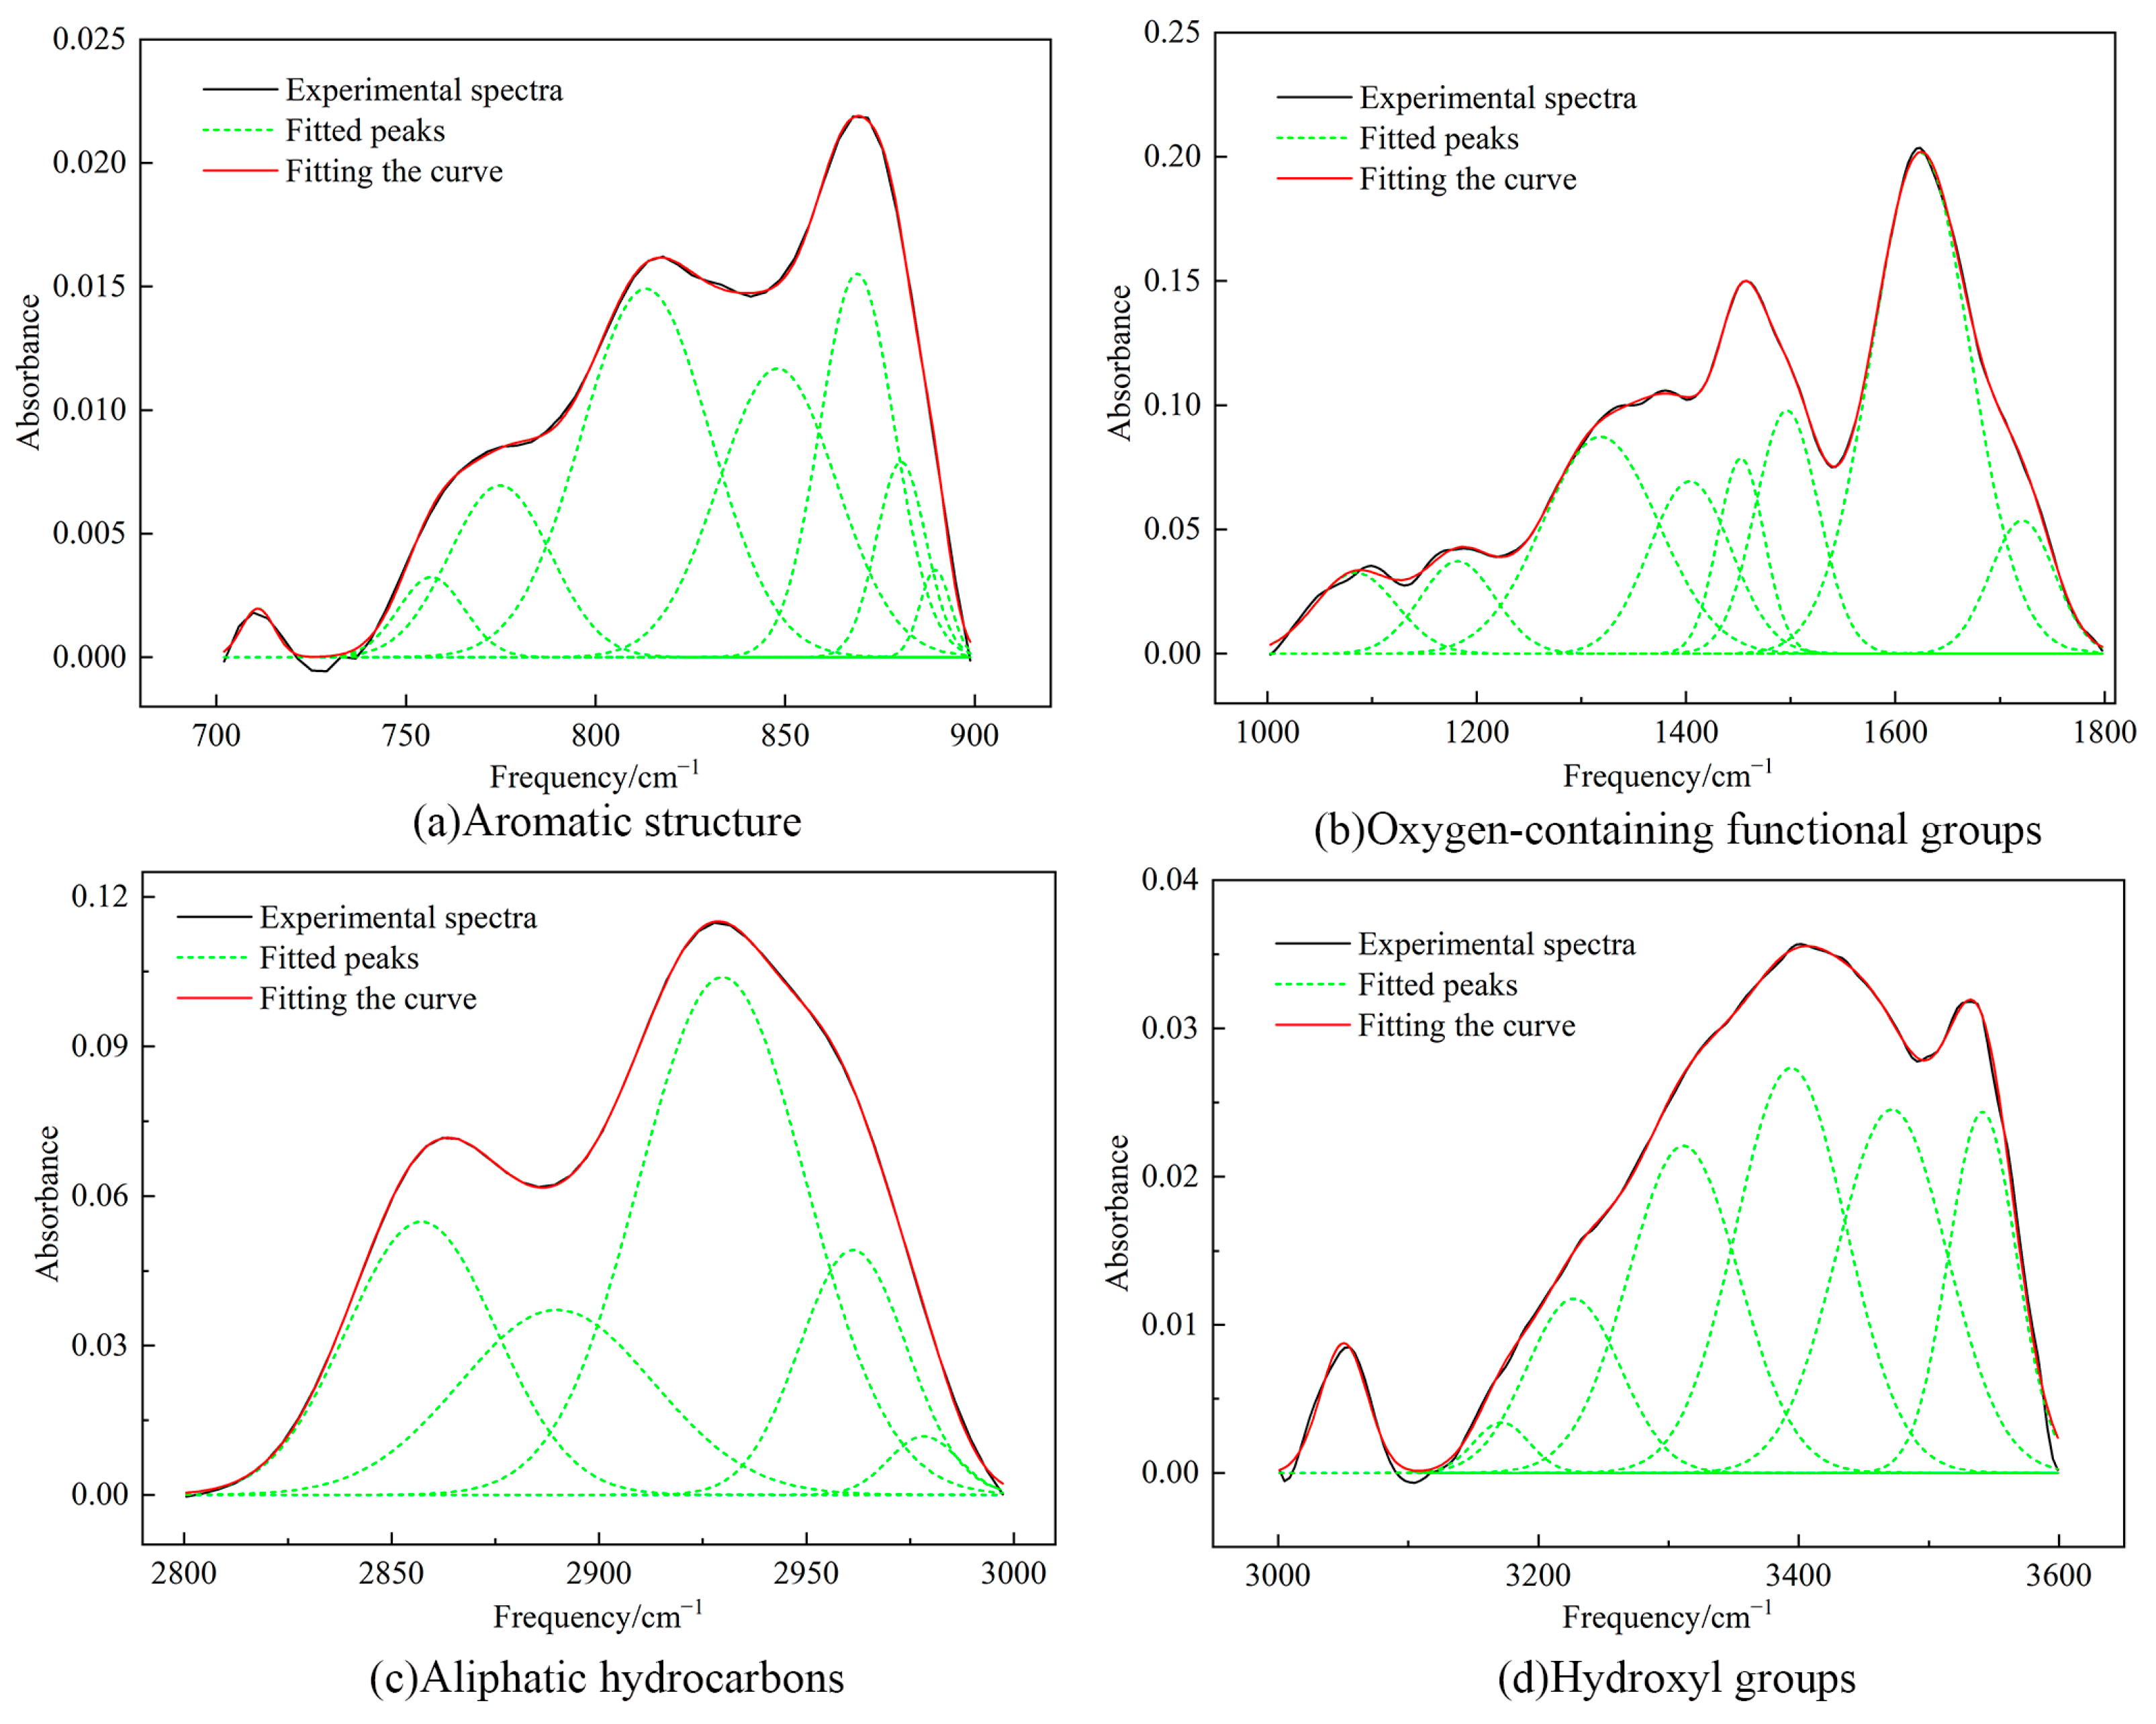
2.5. FTIR Test Results
2.6. Basic Structure of the Coal Molecular Model
2.6.1. Aromatic Structure
2.6.2. Aliphatic Structure
2.6.3. Heteroatomic Structure
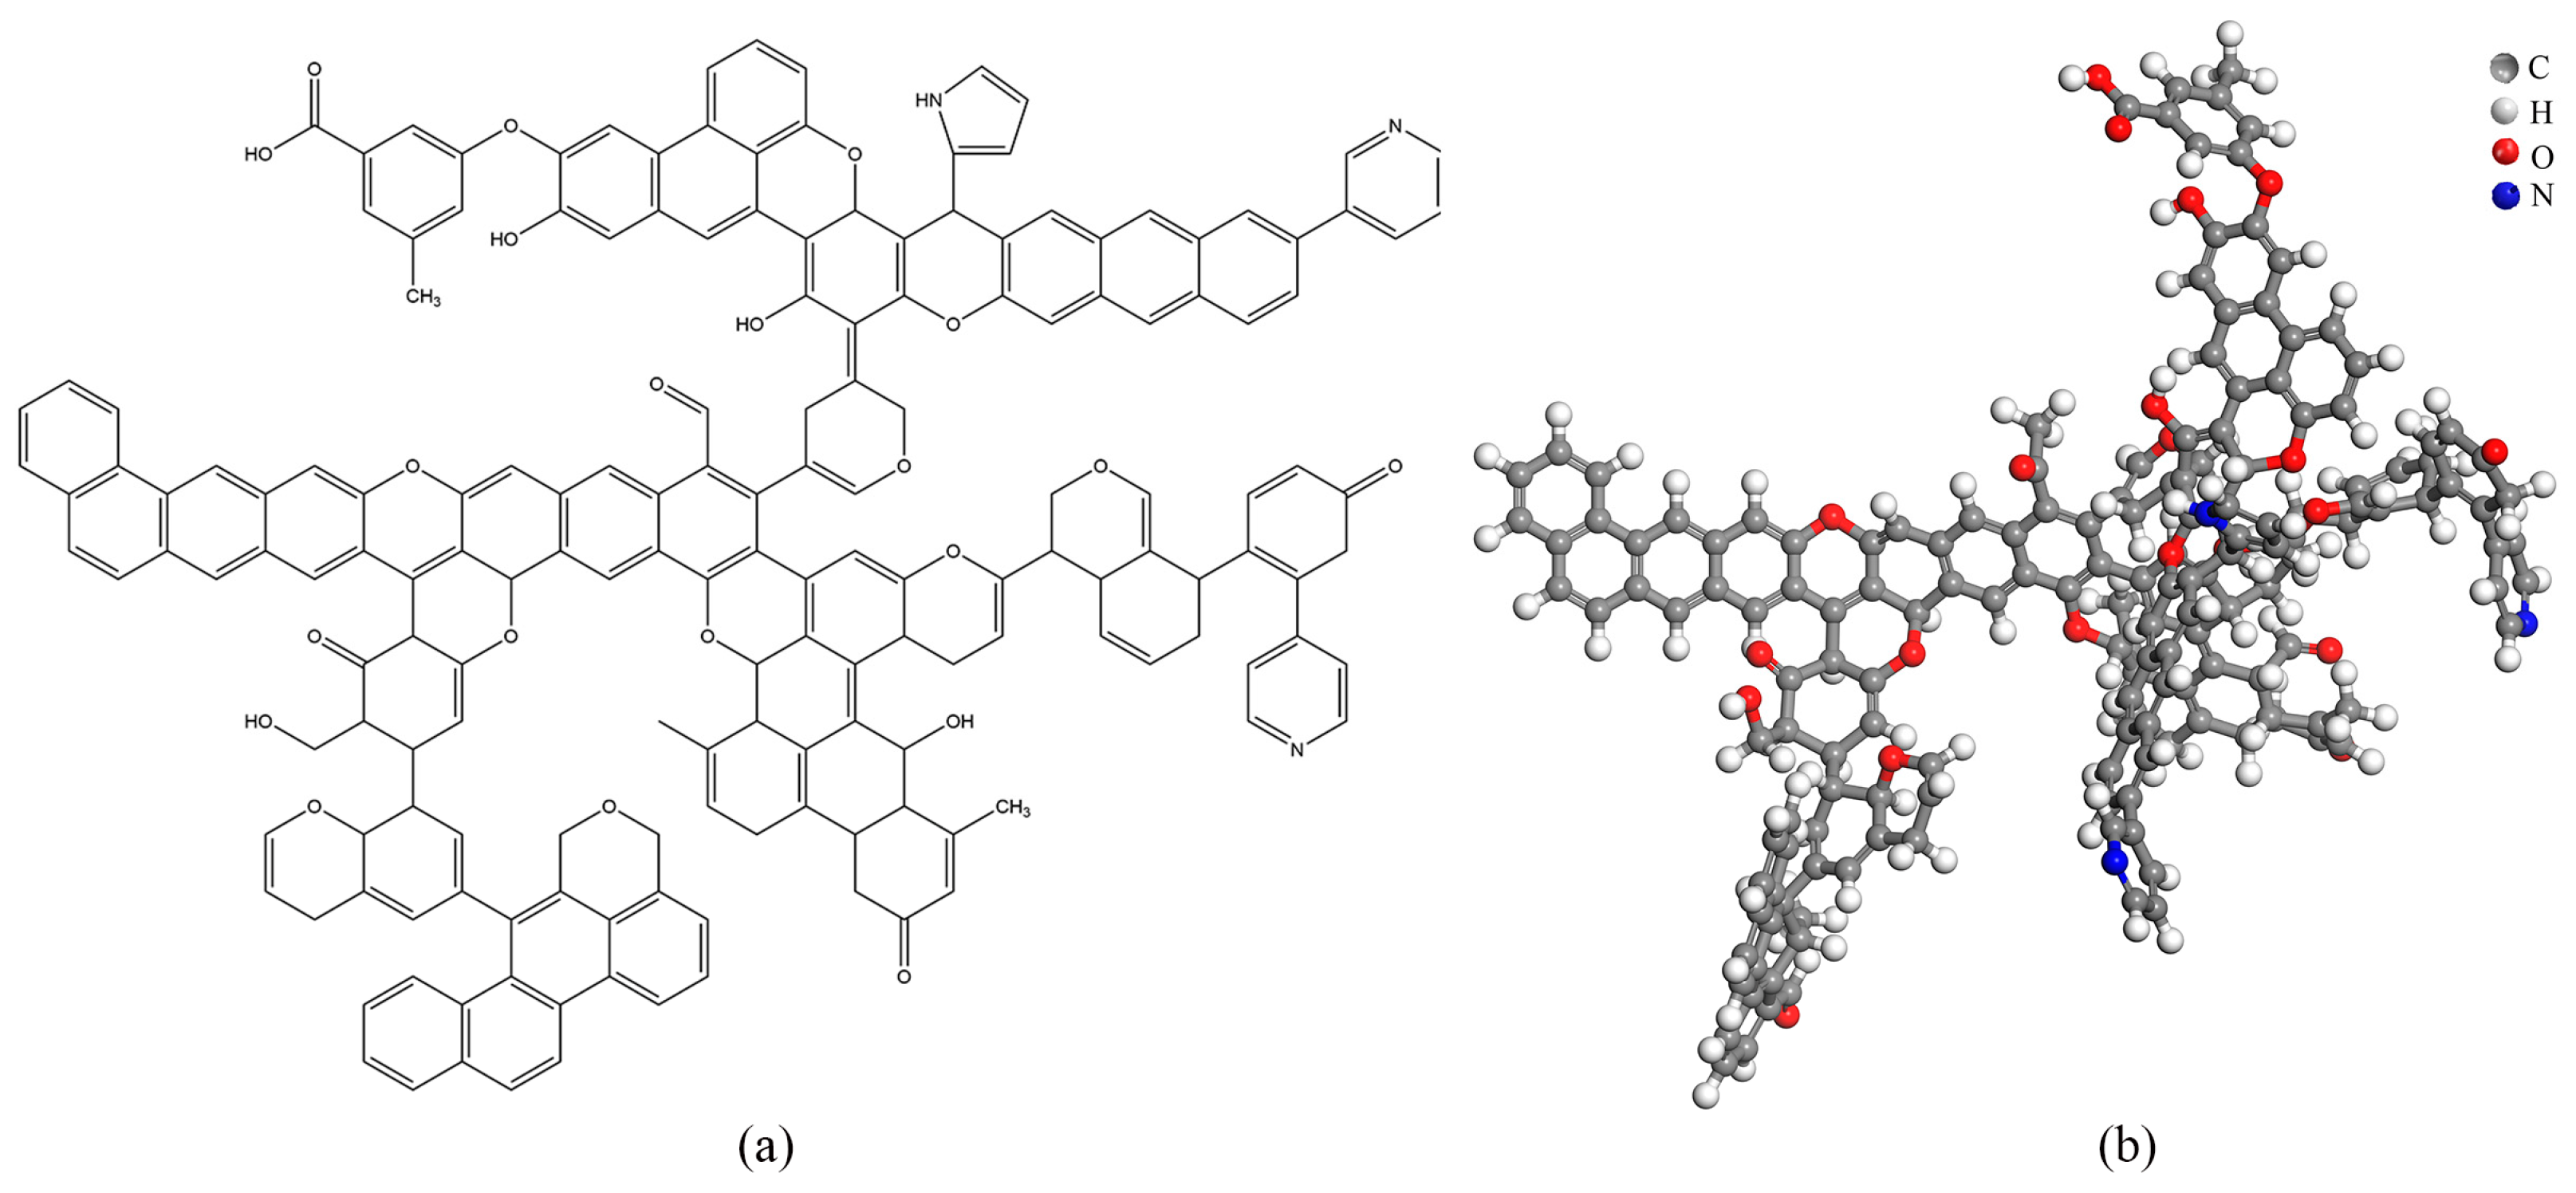
2.6.4. Coal Molecular Structure Model
2.6.5. Coal Molecular Structure Optimization
2.7. Coal Oxidation Characterization Analysis
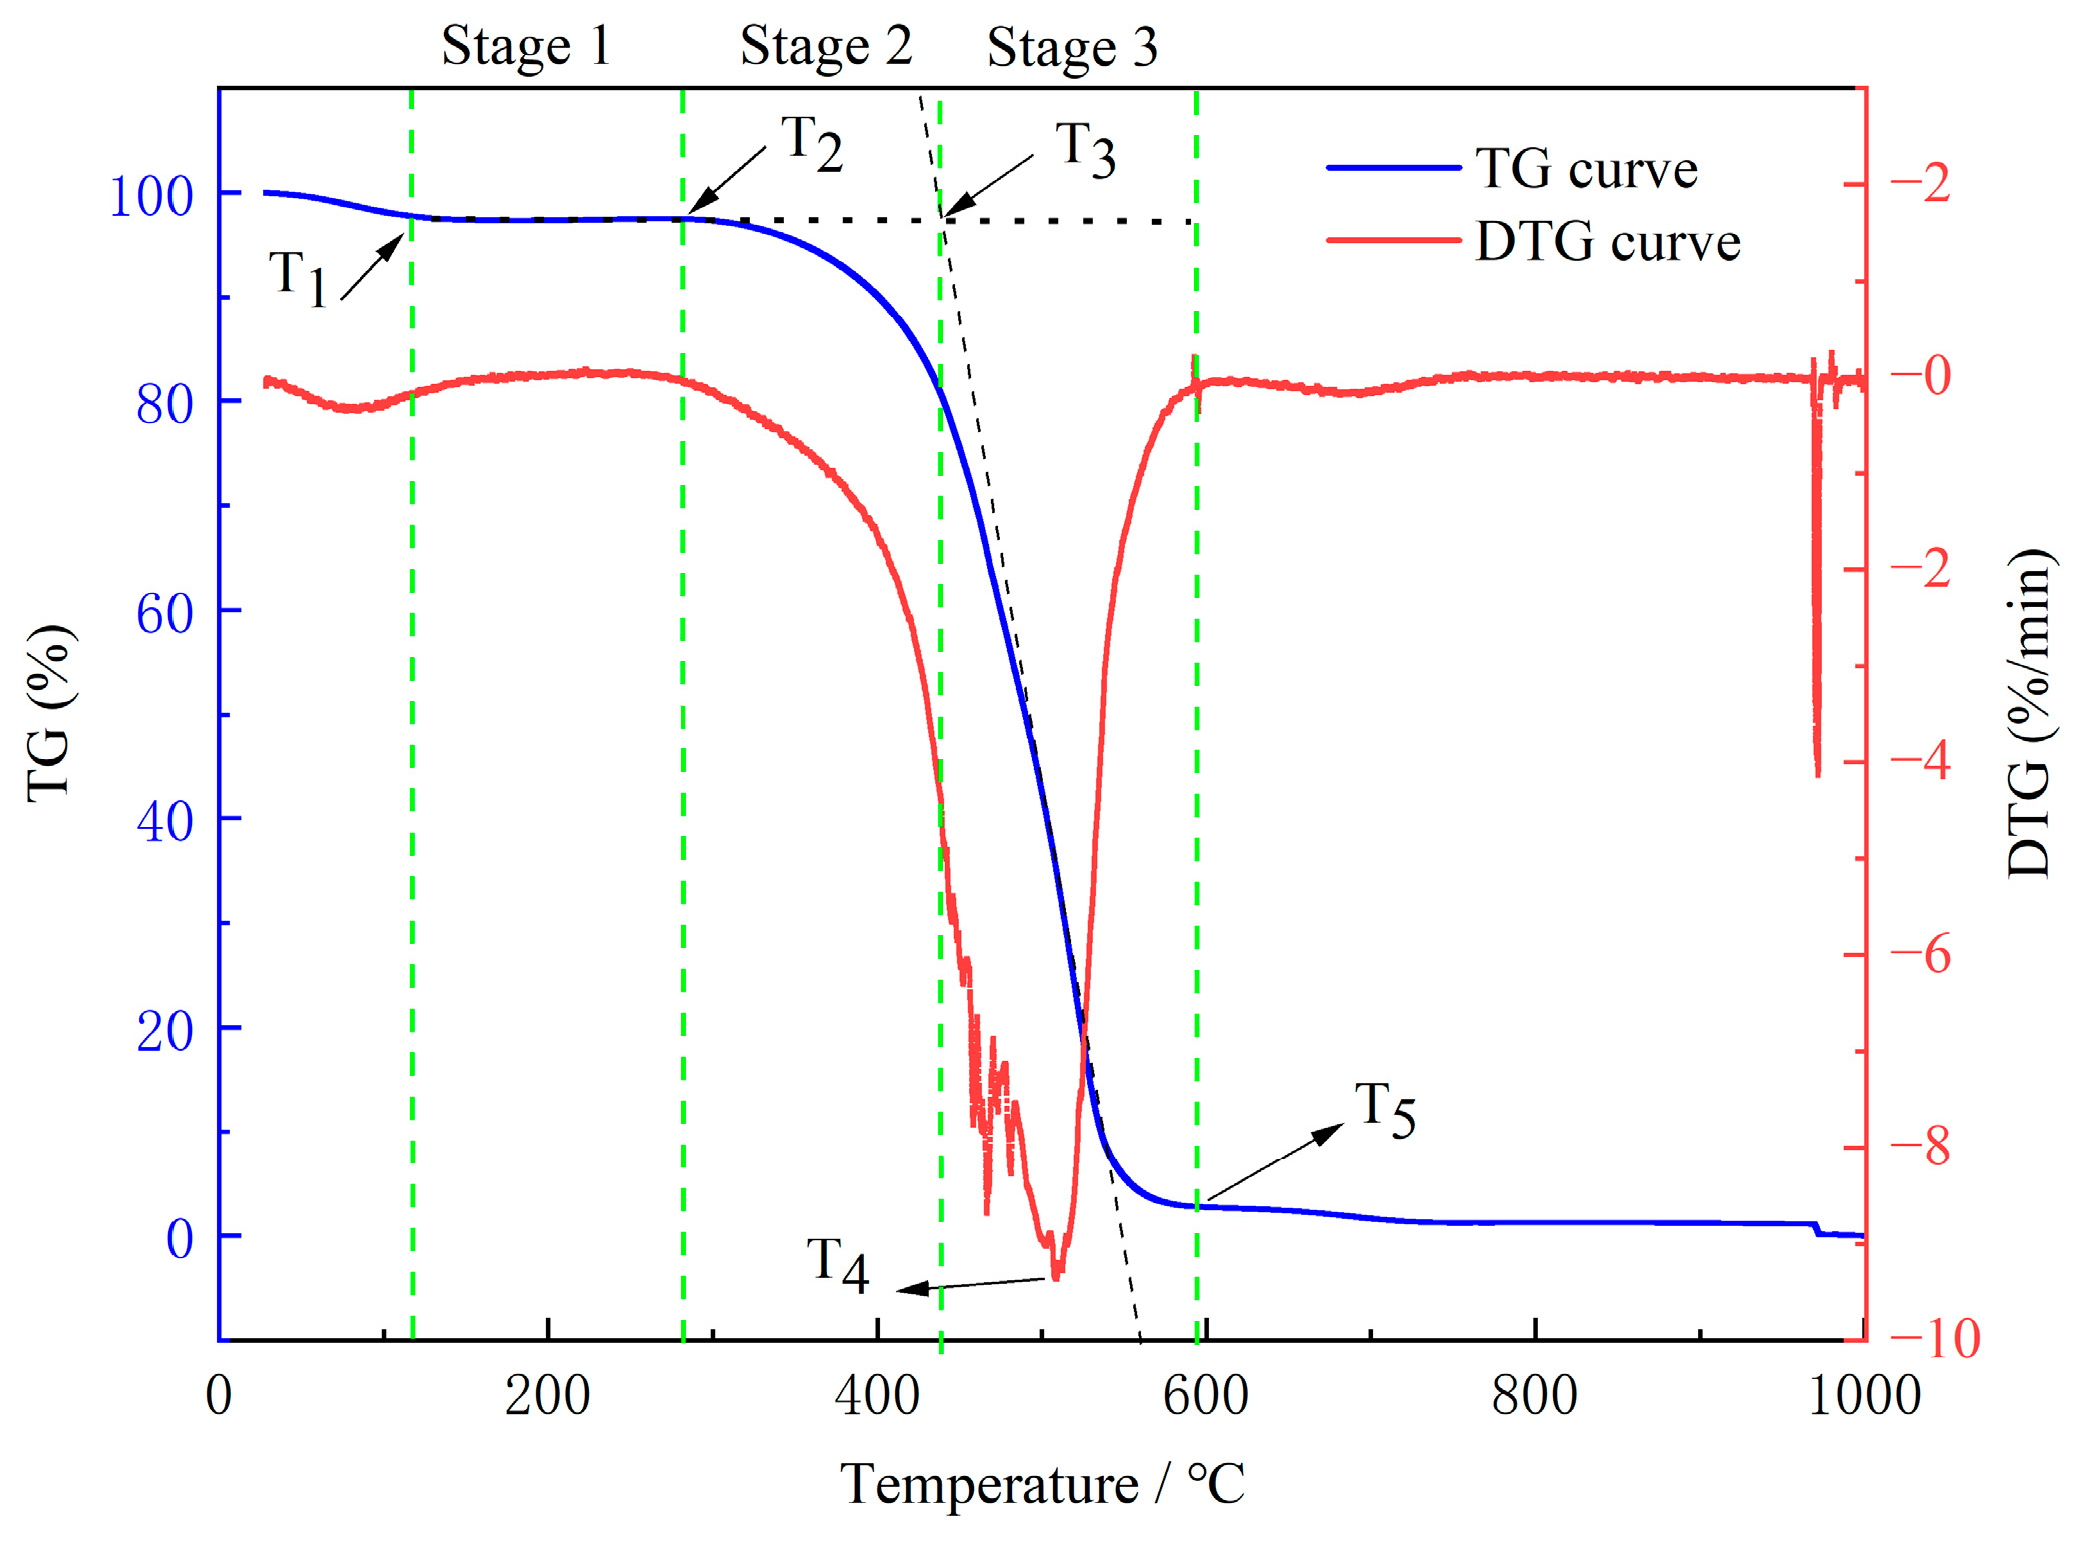
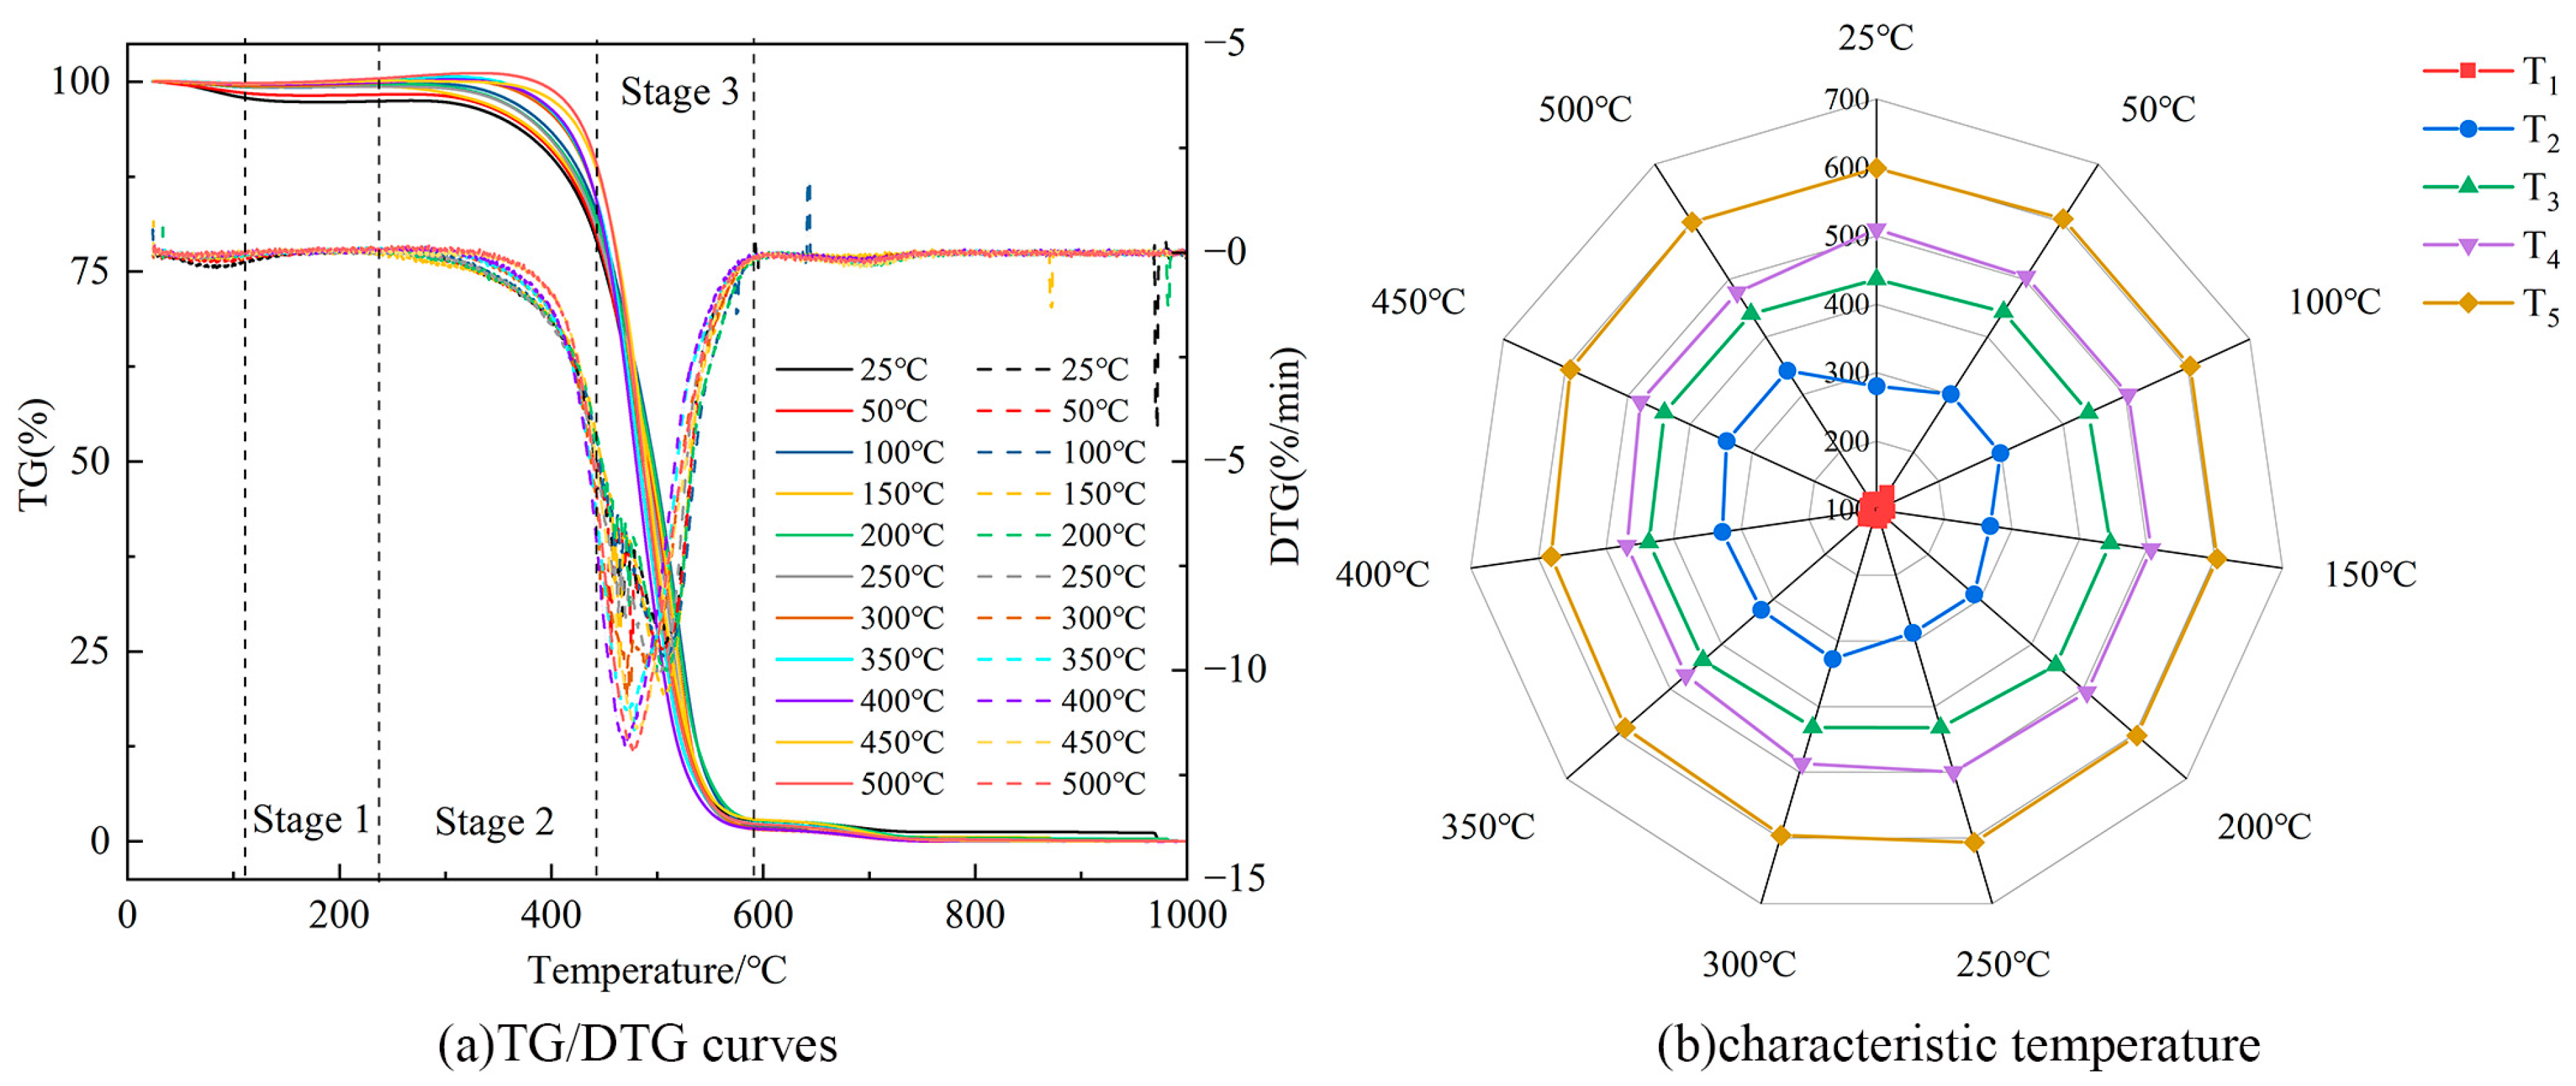
2.7.1. TG Test Results and Analysis
- (1)
- Characteristic Temperature and Stage Division
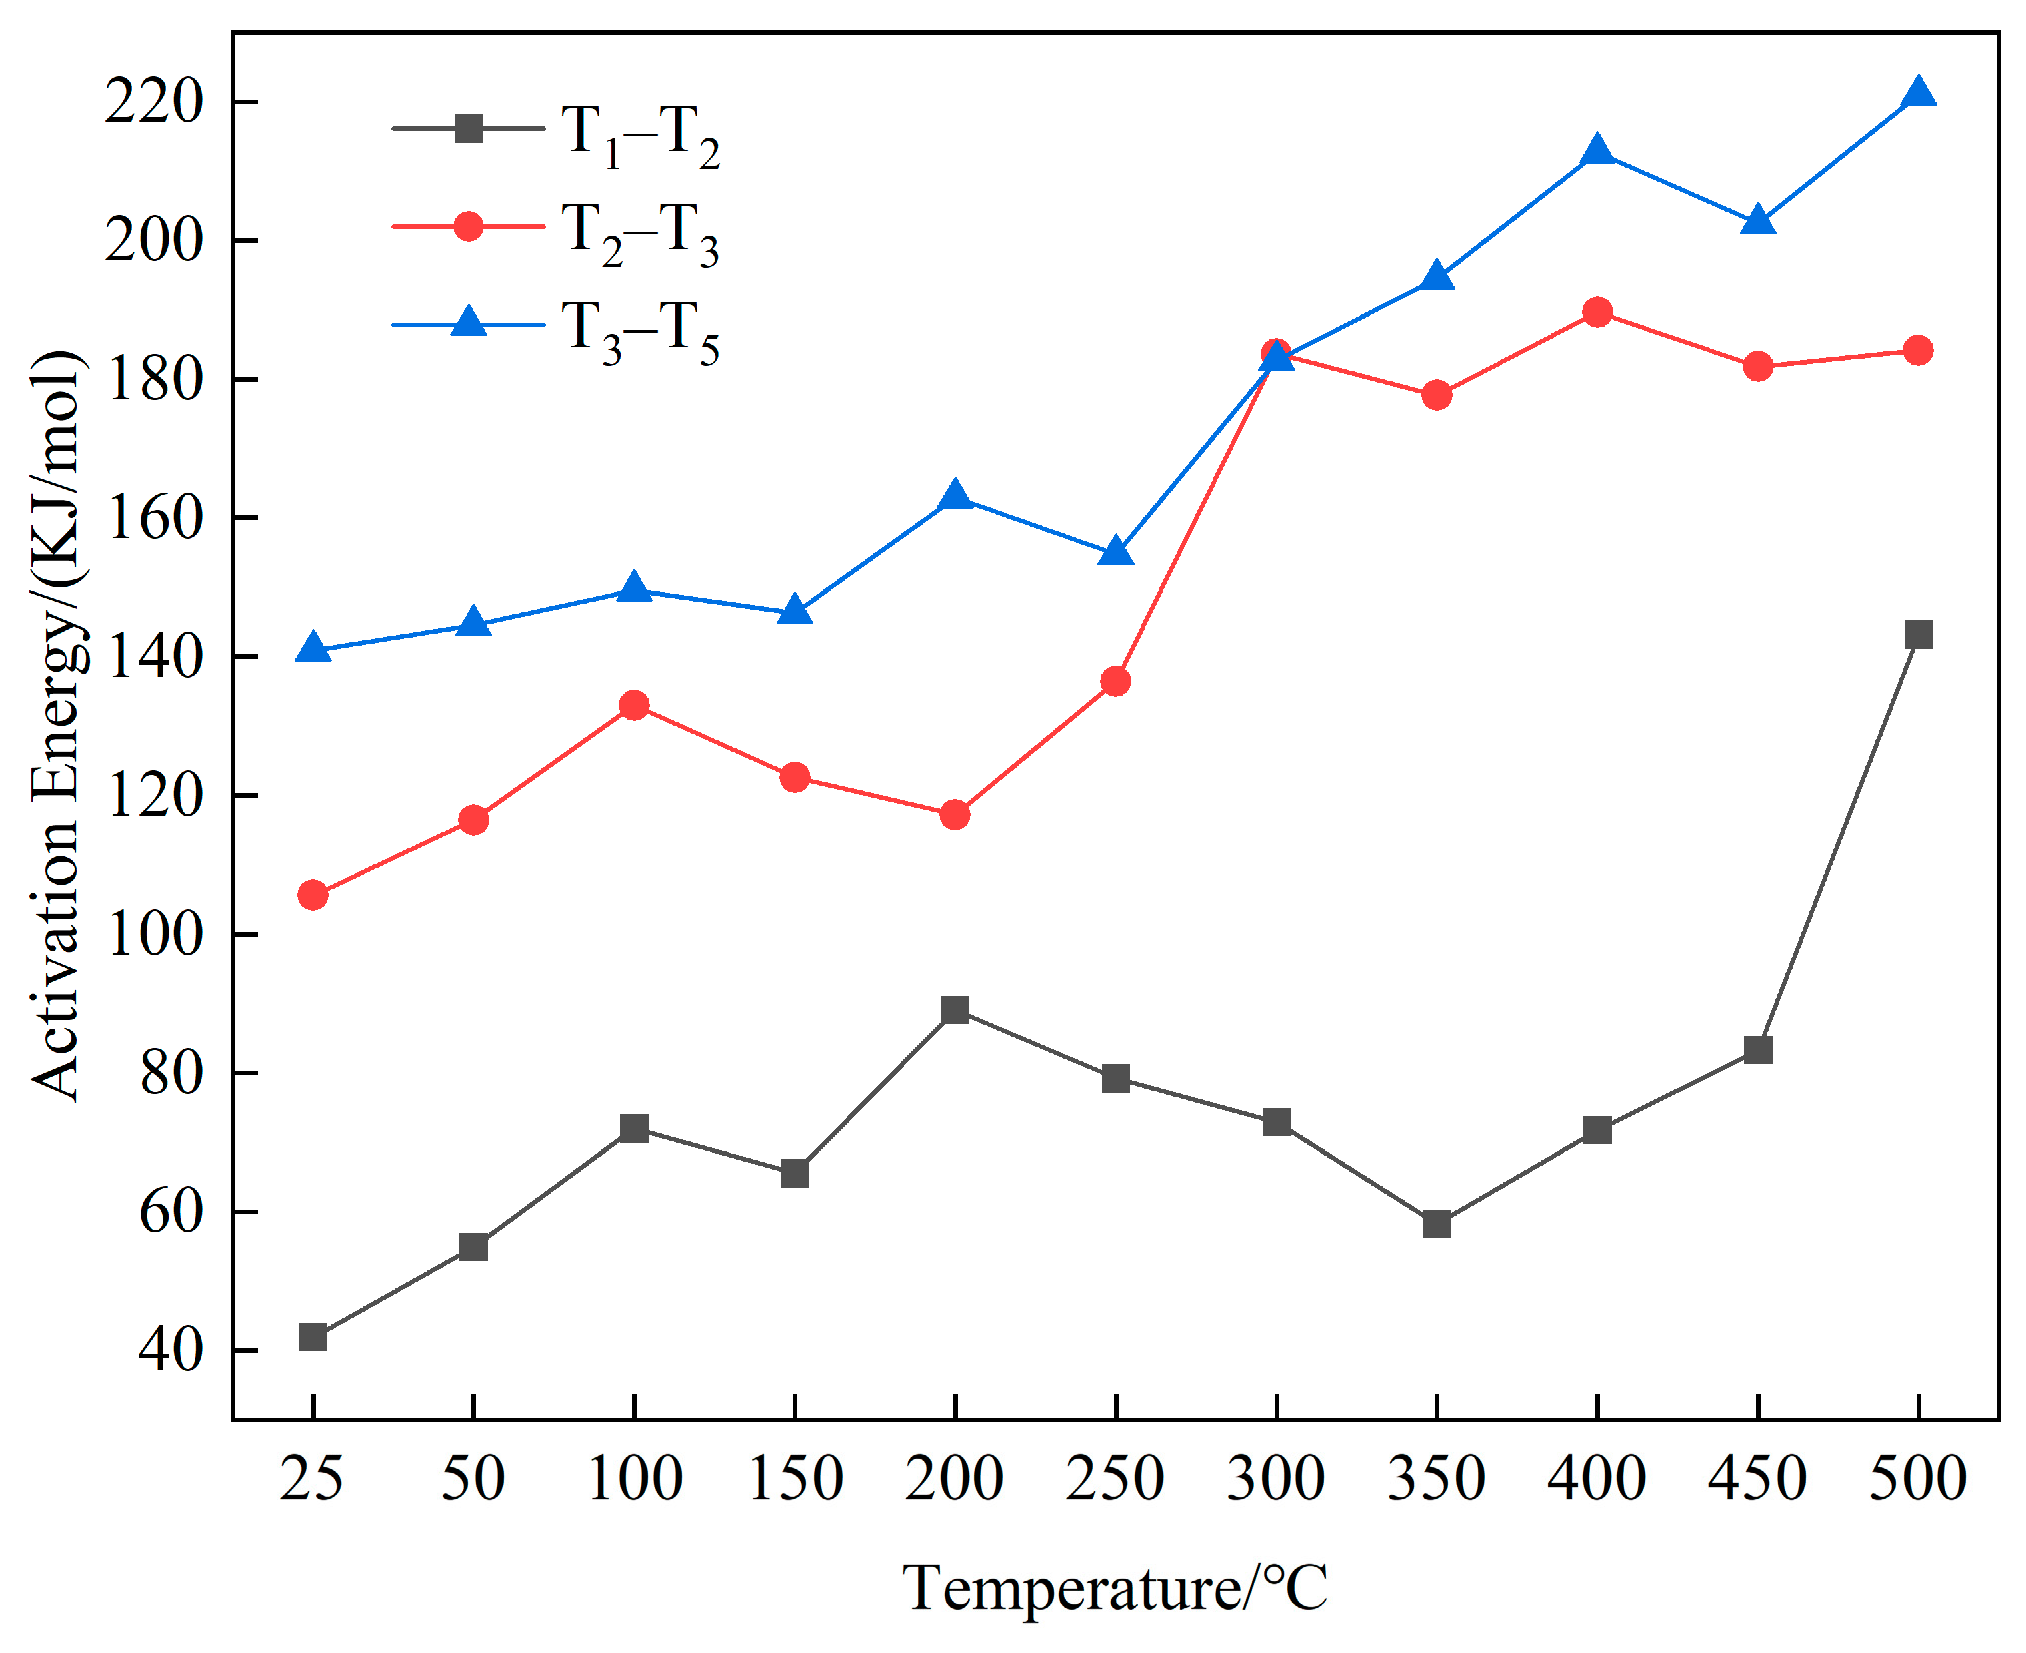
- (2)
- Kinetic Parameters
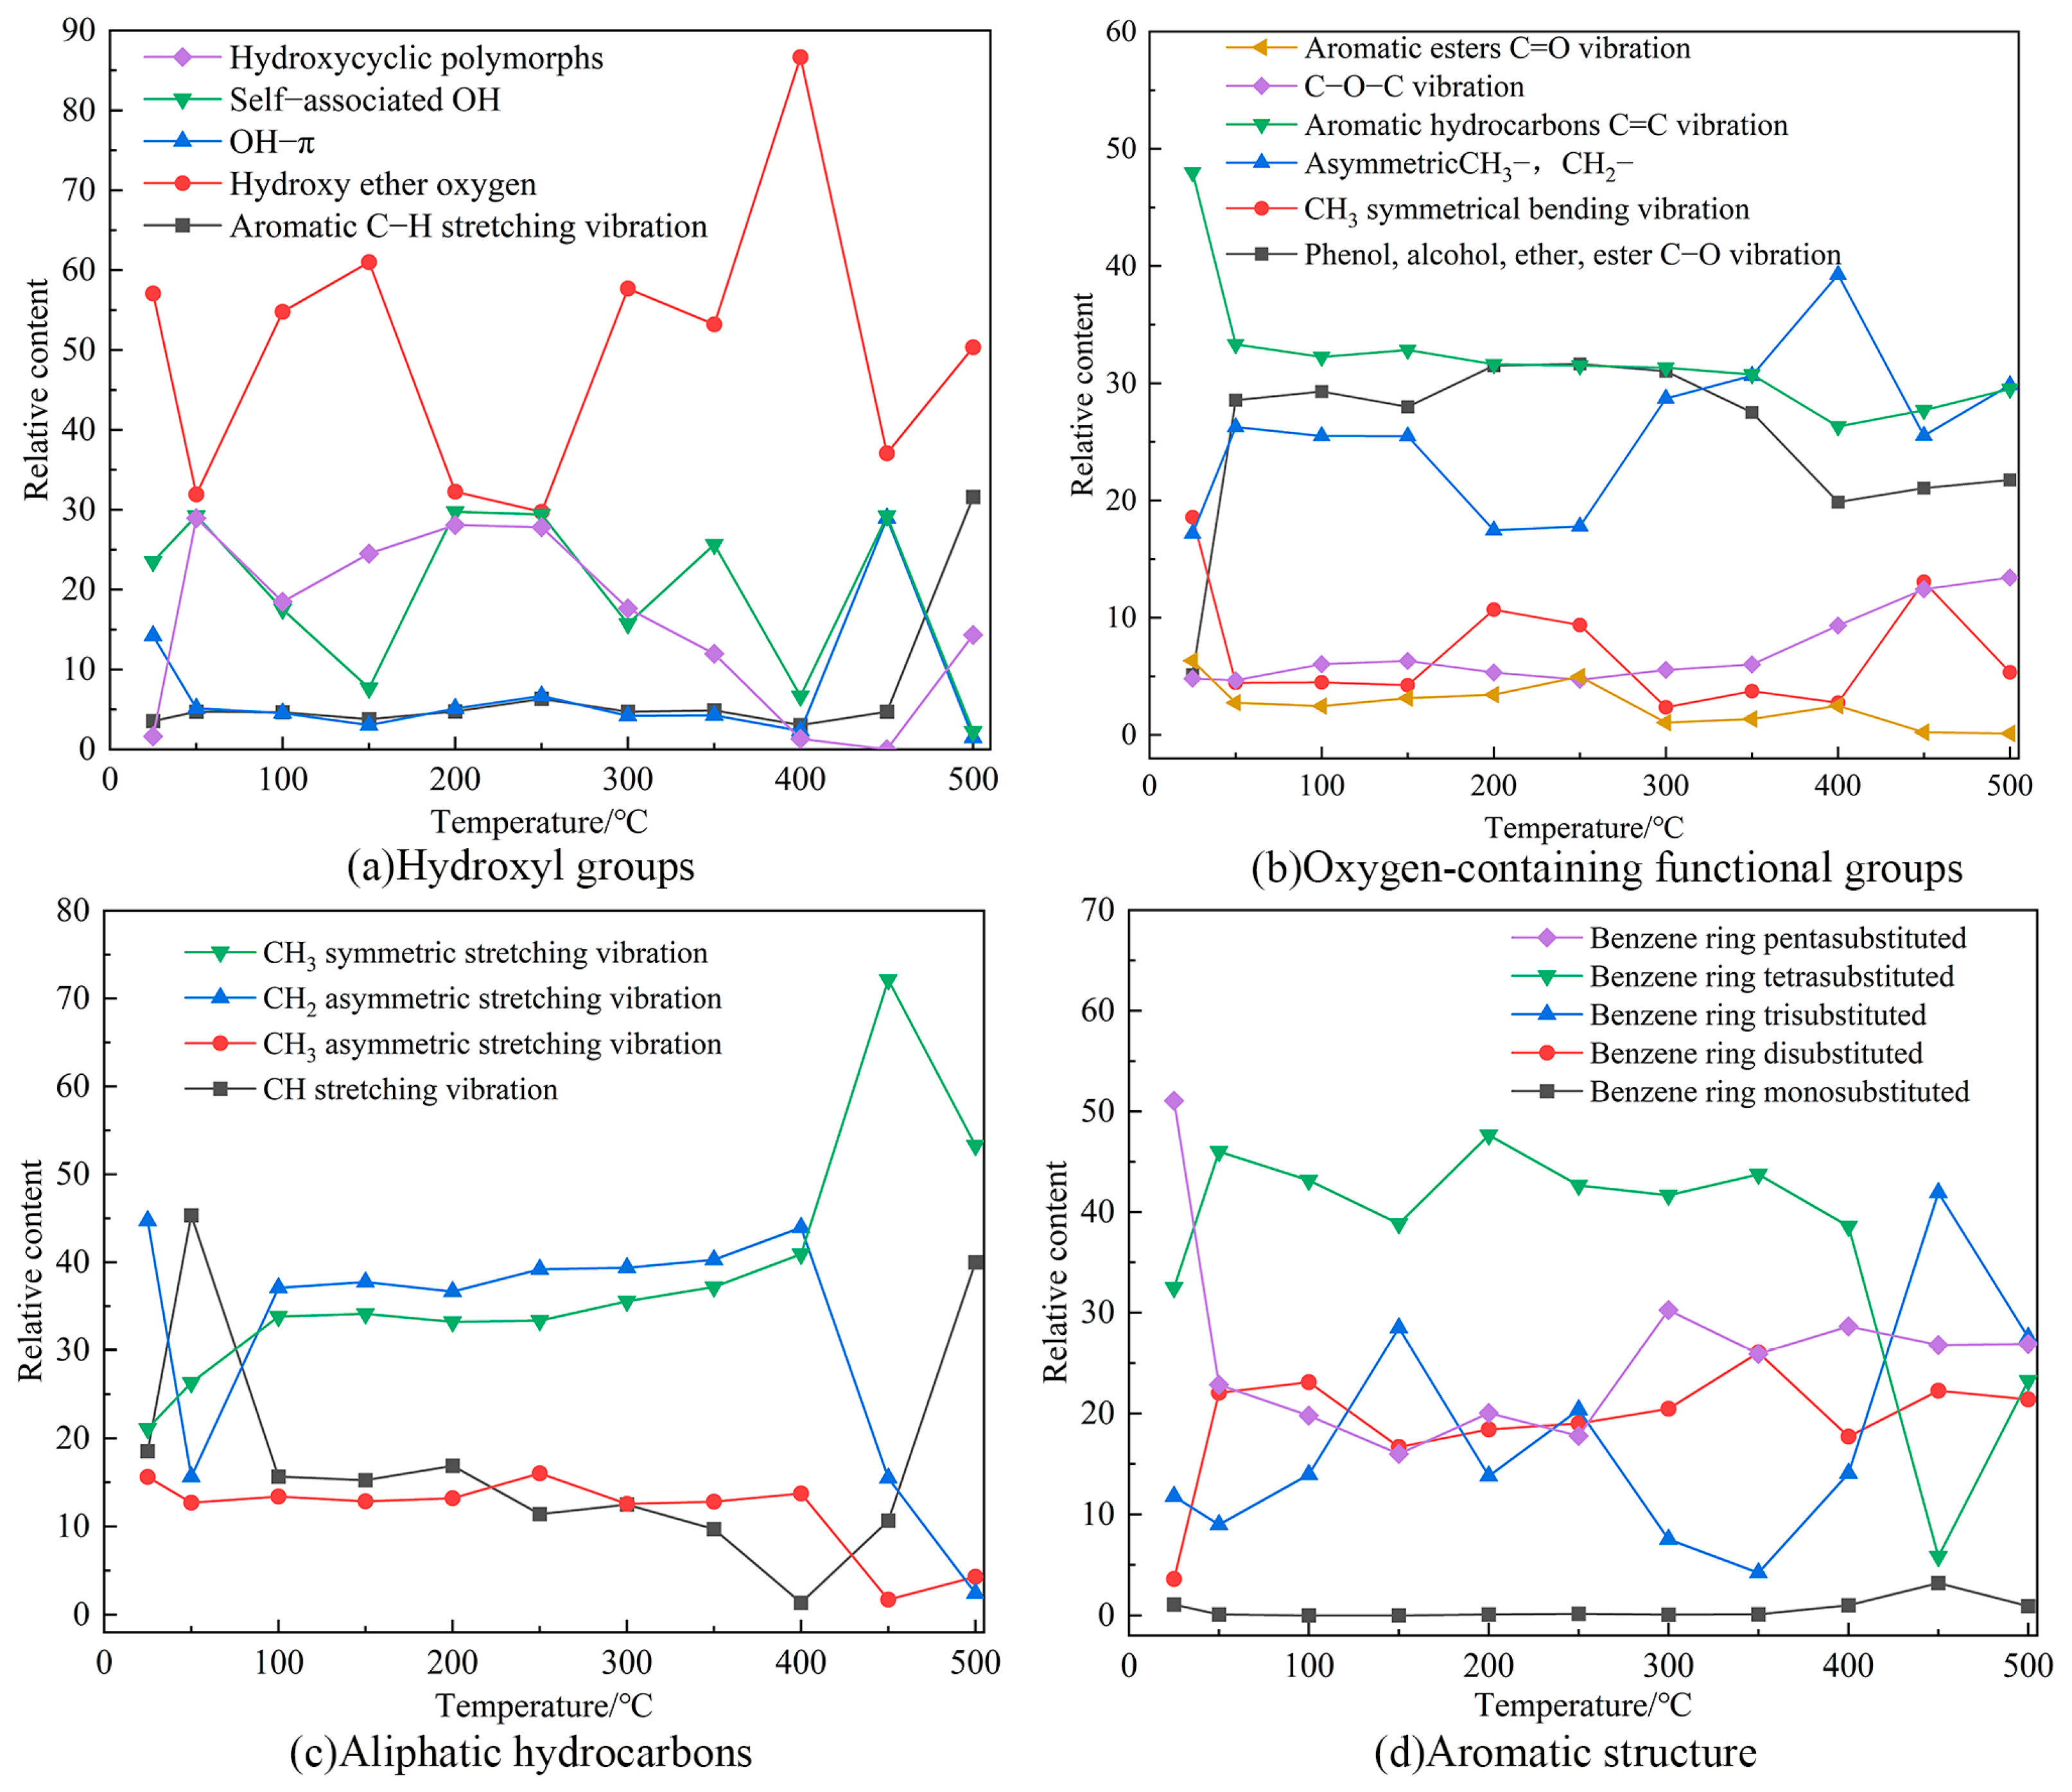
2.7.2. FTIR Test Results and Analysis
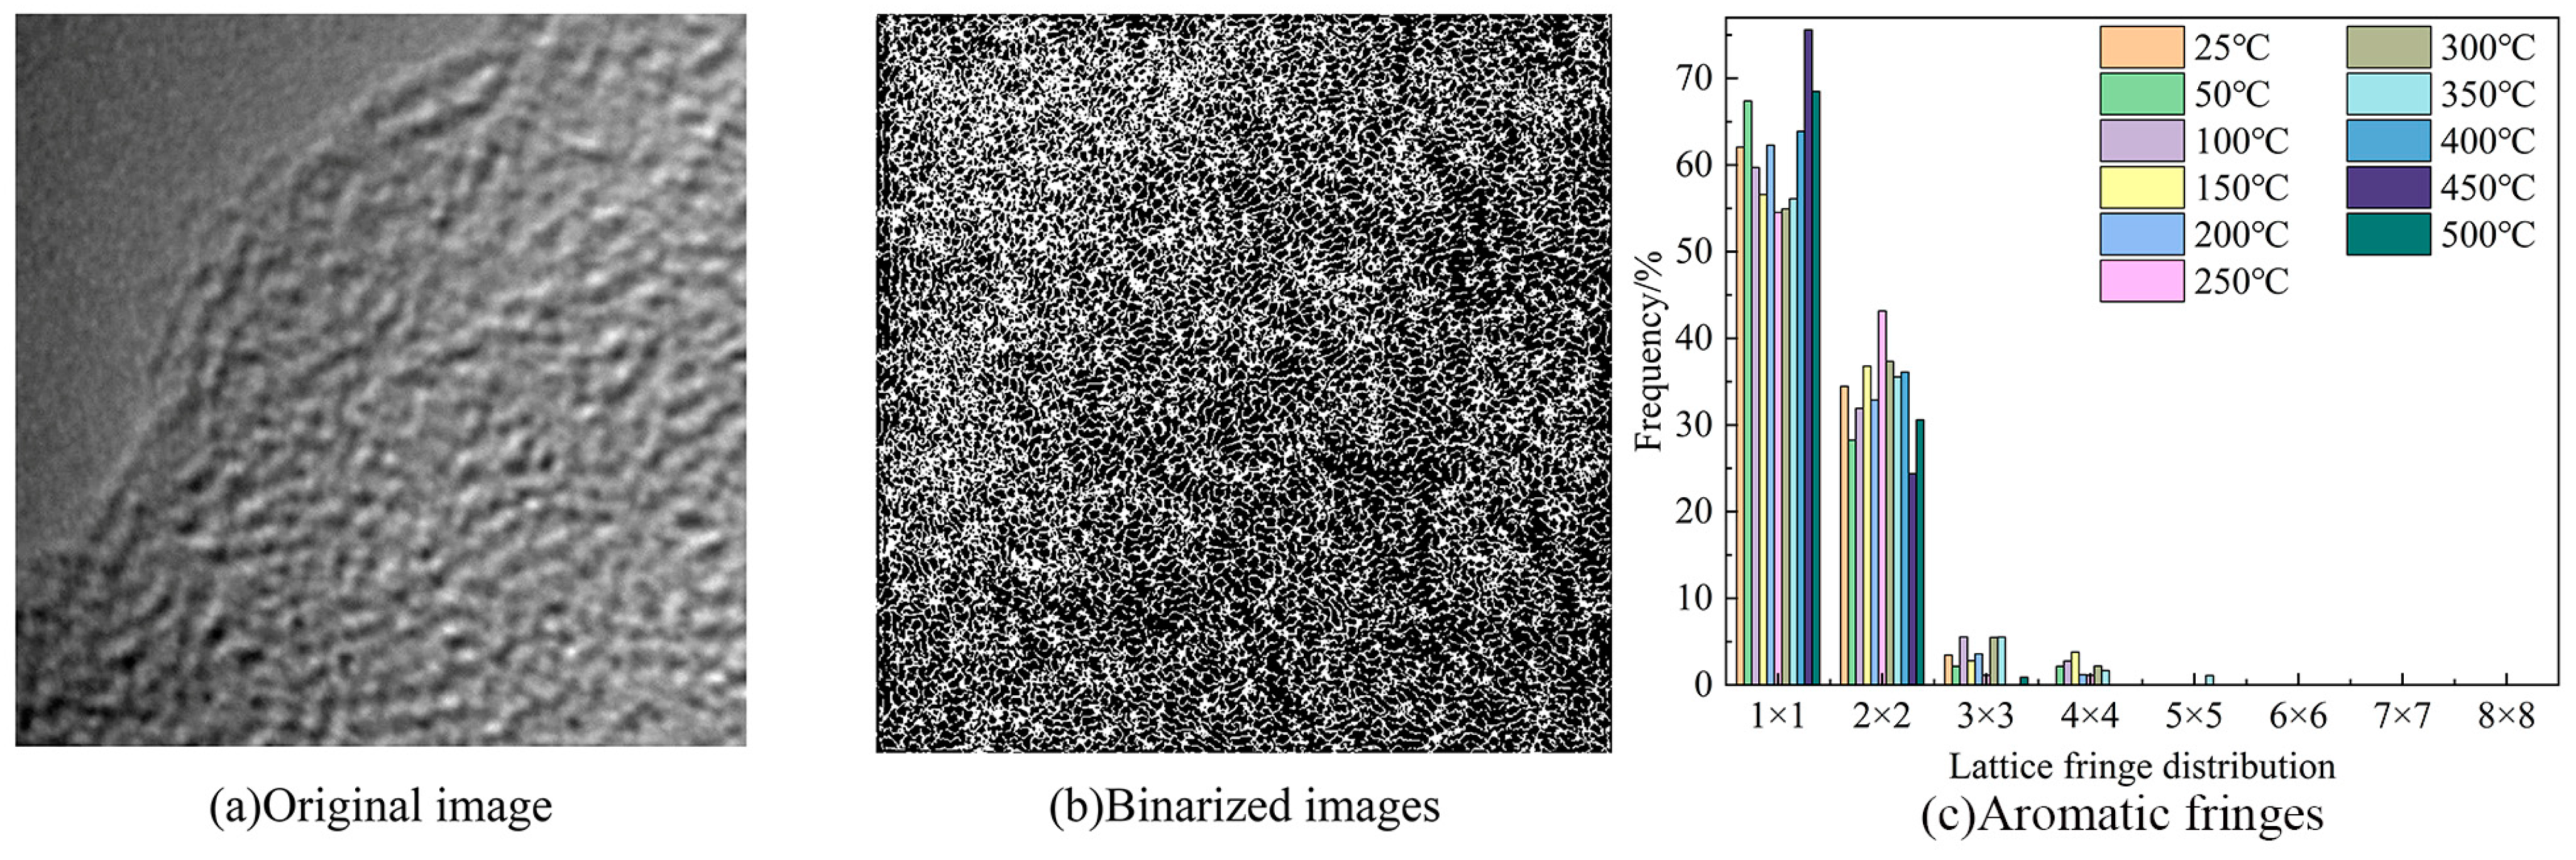
2.7.3. HRTEM Test Results and Analysis
3. Materials and Methods
3.1. Materials
3.2. Test Methods
3.2.1. Proximate and Ultimate Analyses
3.2.2. X-ray Photoelectron Spectroscopy (XPS)
3.2.3. X-ray Diffraction (XRD)
3.2.4. Nuclear Magnetic Resonance Carbon Spectrum (13C-NMR)
3.2.5. Fourier Transform Infrared Spectrometer (FTIR)
3.2.6. Thermogravimetry (TG)
3.2.7. High Resolution Transmission Electron Microscopy (HRTEM)
4. Conclusions
- The Heiyanquan coal has the molecular empirical formula C175H125O21N3 and is characterized by a high aromatic carbon content (57.74%), with the aliphatic carbon content exceeding the CH and CH2 contents. Themolecular structure of the coal includes two pyridines and one pyrrole as heteroatoms. Upon geometric optimization and annealing simulation, there was a substantial decrease in total energy, with the Van der Waals energy playing aprominent role.
- As the temperature increased, the starting combustion temperature (T2) gradually rosewhile the temperature at the maximum combustion rate (T4) decreased. The remaining characteristic temperatures remained nearly constant. During the stage of water loss and drying, the activation energy required for the coal was small but increased with rising temperature. In the oxidation and weight gain stage, the activation energy did not significantly change at low-to-medium temperatures but rose significantly at high-to-medium temperatures. In the combustion stage, the activation energy increased with the temperature.
- With the rise in reaction temperature, the C=C content decreased significantly, and the C–O content exhibited an increasing trend and higher activity. The content of benzene ring substituents varied considerably and mainly occurred in the high-temperature stage. The hydroxy ether oxygen groups demonstrated a broader range of variation due to higher activity.
Author Contributions
Funding
Institutional Review Board Statement
Informed Consent Statement
Data Availability Statement
Conflicts of Interest
References
- Cui, X.; Yan, H.; Zhao, P. A review on the model coal construction and analysis methods of molecular structure. J. China Univ. Min. Technol. 2019, 48, 704–717. [Google Scholar] [CrossRef]
- Si, J. Macromlecular Structural Model Construction and Molecular Simulation of Malan8 Coal; Taiyuan University of Technology: Taiyuan, China, 2014. [Google Scholar]
- Ma, M.; Li, L.; Gao, S. Research progress on coal maceral pyrolysis characteristics. Coal Chem. Ind. 2022, 50, 86–89+94. [Google Scholar] [CrossRef]
- Onifade, M.; Genc, B. A review of research on spontaneous combustion of coal. Int. J. Min. Sci. Technol. 2020, 30, 303–311. [Google Scholar] [CrossRef]
- Chermin, H.A.G.; Vankrevelend, W. Chemical structure and properties of coal. XVII-A mathematical model of coal pyrolysis. Fuel 1957, 36, 85–104. [Google Scholar]
- Giver, P.H. The distribution of hydroxyl in coal and its relation to coal structure. Fuel 1960, 39, 147. [Google Scholar]
- Wiser, W.H. Reported in division of fuel chemistry. Preprints 1975, 20, 122. [Google Scholar]
- Shinn, J.H. From coal to single stage and two stage products: A reactive model of coal structure. Fuel 1984, 63, 1187–1196. [Google Scholar] [CrossRef]
- Baysal, M.; Yürüm, A.; Yıldız, B.; Yürüm, Y. Structure of some western Anatolia coals investigated by FTIR, Raman, 13C solid state NMR spectroscopy and X-ray diffraction. Int. J. Coal Geol. 2016, 163, 166–176. [Google Scholar] [CrossRef]
- Karayiğit, A.I.; Bircan, C.; Mastalerz, M.; Oskay, R.G.; Querol, X.; Lieberman, N.R.; Türkmen, I. Coal characteristics, elemental composition and modes of occurrence of some elements in the İsaalan coal (Balıkesir, NW Turkey). Int. J. Coal Geol. 2017, 172, 43–59. [Google Scholar] [CrossRef]
- Matlala, I.V.; Moroeng, O.M.; Wagner, N.J. Macromolecular structural changes in contact metamorphosed inertinite-rich coals from the No. 2 Seam, Witbank Coalfield (South Africa): Insights from petrography, NMR and XRD. Int. J. Coal Geol. 2021, 247, 103857. [Google Scholar] [CrossRef]
- Xiang, J.; Zeng, F.; Liang, H.; Sun, B.; Zhang, L.; Li, M.; Jia, J. Modele structural of the macromolecules of Yanzhou coal and its molecular simulation. J. Fuel Chem. Technol. 2011, 39, 481–488. [Google Scholar] [CrossRef]
- Suggate, R.P.; Dickinson, W.W. Carbon NMR of coals: The effects of coal type and rank. Int. J. Coal Geol. 2004, 57, 1–22. [Google Scholar] [CrossRef]
- Zhang, W.; Zeng, F. Infrared spectral analysis of Hydroxyl groupsin medium metamorphic coal. J. Taiyuan Univ. Technol. 2005, 36, 545–548. [Google Scholar]
- Black, S.; Ferrell, J.R. Determination of Carbonyl Groups in Pyrolysis Bio-Oils Using Potentiometric Titration: Review and Comparison of Methods. Energy Fuels 2016, 30, 1071–1077. [Google Scholar] [CrossRef]
- Chai, S.; Zeng, Q. Molecular model construction and structural characteristics analysis of Wucaiwan coal in Eastern Junggar coalfield based on quantum chemistry theory. J. China Coal Soc. 2022, 47, 4504–4516. [Google Scholar] [CrossRef]
- Meng, Y.; Zhang, S.; Cao, Z.; Wang, C. Insight on coal molecular-scale pore reconstruction of Tunliu mine and its characterization and analysis. J. China Coal Soc. 2022, 47 (Suppl. S1), 160–170. [Google Scholar] [CrossRef]
- Ma, R.; Zhang, S.; Hou, D.; Liu, W.; Yuan, L.; Liu, Q. Model construction and optimization of molecule structure of high-rank coal in Feng County, Shaanxi Province. J. China Coal Soc. 2019, 44, 1827–1835. [Google Scholar] [CrossRef]
- Zhang, Z.; Wang, L.; Li, H. Study on model construction and optimization of molecular structure. Coal Sci. Technol. 2021, 49, 245–253. [Google Scholar] [CrossRef]
- Zhang, S.; Ma, R.; Liu, L.; Zhang, H.; Liu, Q. Molecular structure characteristics and model construction of anthracite in Jarud. Coal Geol. Explor. 2020, 48, 62–69. [Google Scholar] [CrossRef]
- Wang, D.; Zeng, Q. Study on the inhibitory effect of inhibitor based on the coal molecular structure analysis: A case study of Zhundong coal, Xinjiang, China. J. Mol. Struct. 2024, 1301, 137446. [Google Scholar] [CrossRef]
- Zhang, W.; Zeng, Q. Characteristics of coal oxidation and spontaneous combustion in Baishihu Mine, Xinjiang, China. Front. Earth Sci. 2023, 11, 1208803. [Google Scholar] [CrossRef]
- Liang, C.; Liang, W.; Li, W. Functional groups of different coal ranks based on infrared spectroscopy. Coal Sci. Technol. 2020, 48 (Suppl. S1), 182–186. [Google Scholar]
- Lei, L.; Xiang, J.; Zeng, F.; Deng, X. High resolution TEM image analysis of anthracite coal microcrystalline structure. J. Fuel Chem. Technol. 2021, 49, 742–751. [Google Scholar] [CrossRef]
- Deng, J.; Xv, J.; Chen, X. Advances in the Mechanism and Prediction Theory of Coal Spontaneous Combustion. J. Liaoning Tech. Univ. 2003, 4, 455–459. [Google Scholar]
- Shi, T.; Deng, J.; Wang, X.; Wen, Z. Reaction mechanism study on the initial stage of spontaneous coal combustion. J. Fuel Chem. Technol. 2004, 6, 652–657. [Google Scholar]
- Gu, L.; Shi, Y.; Zhang, L. Study on surface modification and properties of bio-based intumescent flame retardant. J. Therm. Anal. Calorim. 2023, 148, 9519–9535. [Google Scholar] [CrossRef]
- Kok, M.V.; Bal, B.; Varfolomeev, M.A.; Nurgaliev, D.K. Thermal characteristics and model-free kinetics of oil shale samples. J. Therm. Anal. Calorim. 2023, 148, 8933–8943. [Google Scholar] [CrossRef]
- Sun, B.; Yu, H.; Qian, D.; Chen, M. The peak separation process in X-ray photoelectron spectroscopy. Univ. Chem. 2017, 32, 53–59. [Google Scholar] [CrossRef]
- Zhu, H.; He, X.; Huo, Y.; Xie, Y.; Wang, W.; Fang, S. Construction and optimization of lignite molecular structure model. J. Min. Sci. Technol. 2021, 6, 429–437. [Google Scholar]
- Jiang, J.; Zhang, S.; Longhurst, P.; Yang, W.; Zheng, S. Molecular structure characterization of bituminous coal in Northern China via XRD, Raman and FTIR spectroscopy. Spectrochim. Acta Part A Mol. Biomol. Spectrosc. 2021, 255, 119724. [Google Scholar] [CrossRef] [PubMed]
- Zhang, D.; Li, Y.; Chang, L.; Zi, C.; Zhang, Y.; Tian, G.; Zhao, W. Structural characteristics of Mile lignite and its molecular model construction. J. Fuel Chem. Technol. 2021, 49, 727–734. [Google Scholar] [CrossRef]
- Jia, J.; Zeng, F.; Sun, B. Construction and modification of macromolecular structure model for vitrinite from Shendong 2−2 coal. J. Fuel Chem. Technol. 2011, 39, 652–657. [Google Scholar]
- Jiang, J.; Yang, W.; Cheng, Y.; Liu, Z.; Zhang, Q.; Zhao, K. Molecular structure characterization of middle-high rank coal v-ia XRD, Raman and FTIR spectroscopy: Implications for coalification. Fuel 2019, 239, 559–572. [Google Scholar] [CrossRef]
- Çelik, Y.; Karayigit, A.I.; Oskay, R.G.; Kayseri-Özer, M.S.; Christanis, K.; Hower, J.C.; Querol, X. A multidisciplinary study an-d palaeoenvironmental interpretation of middle Miocene Keles lignite (Harmancık Basin, NW Turkey), with emphasis on syngenetic zeolite formation. Int. J. Coal Geol. 2021, 237, 103691. [Google Scholar] [CrossRef]
- Ding, L.; Zeng, Q. Study on Characteristics of Coal Spontaneous Combustion in Kerjian Mining Area, Xinjiang, China. Minerals 2022, 12, 1508. [Google Scholar] [CrossRef]
- Jia, T.; Qiang, Q.; Lou, H.; Qu, G. Experimental study on thermal characteristics of coal samples with different metamorphism degree during spontaneous combustion. China Saf. Sci. J. 2021, 31, 62–67. [Google Scholar] [CrossRef]
- Zhu, H.; Guo, A.; Qu, L. Experimental Study on the Relationship among the Coal Kinetics Parameters, Characteristic Temperatures and Volatile. China Saf. Sci. J. 2012, 22, 55–60. [Google Scholar] [CrossRef]
- Deng, C.; Qiao, L.; Wang, X.; Dai, F.; Zhang, X. Spontaneous combustion characteristics and infrared analysis of soaked lignite. China Saf. Sci. J. 2018, 28, 105–110. [Google Scholar]
- Chen, Y.; Mastalerz, M.; Schimmelmann, A. Characterization of chemical functional groups in macerals across different coal ranks via micro-FTIR spectroscopy. Int. J. Coal Geol. 2012, 104, 22–33. [Google Scholar] [CrossRef]
- Wang, X.; Li, X.; Zeng, F.; Bian, J. Characterization of different aggregate structure in coal based on HRTEM. J. China Coal Soc. 2020, 45, 749–759. [Google Scholar] [CrossRef]
- GB/T212-2008; Proximate Analysis of Coal. Standardization Administration of China: Beijing, China, 2008.
- GB/T476-2008; Determination of carbon and hydrogen in coal. Standardization Administration of China: Beijing, China, 2008.


| Proximate Analysis/(Mass)% | Ultimate Analysis/(Mass)% | H/C | O/C | N/C | S/C | |||||||
|---|---|---|---|---|---|---|---|---|---|---|---|---|
| Mad | Aad | Vdaf | FCad | Cad | Had | Oad | Nad | Std | ||||
| 2.68 | 9.65 | 38.15 | 49.52 | 69.85 | 4.90 | 10.90 | 1.70 | 0.32 | 0.84 | 0.12 | 0.02 | 0.0017 |
| Elemental Peak | Binding Energy/eV | Attribution | Relative Content/% |
|---|---|---|---|
| C (1s) | 284.72 | C–C, C–H | 61.64 |
| 285.36 | C–O, C–O–C | 33.74 | |
| 286.81 | C=O | 2.27 | |
| 289.83 | COOH | 2.34 | |
| O (1s) | 532.52 | C=O | 47.35 |
| 533.17 | C–O | 52.44 | |
| 538.98 | adsorbed oxygen | 0.21 | |
| N (1s) | 399.01 | N–6 | 44.50 |
| 399.93 | N–6 | 13.17 | |
| 402.23 | N–Q | 11.55 | |
| 400.49 | N–5 | 15.03 | |
| 400.97 | N–5 | 11.55 | |
| S (2p) | 163.58 | Mercaptan thiophenol | 6.01 |
| 164.77 | Thiophene type sulfur | 56.53 | |
| 167.78 | Sulfoxide sulfur | 26.74 | |
| 169.58 | Inorganic sulfur | 10.72 |
| Peak | 2θ/° | FWHM | Peak Type |
|---|---|---|---|
| γ | 13.12 | 7.64 | Gaussian |
| 002 | 22.81 | 8.81 | Gaussian |
| 100 | 43.35 | 10.76 | Gaussian |
| Sample | d002 | Lc | La | Nave |
|---|---|---|---|---|
| Heiyanquan Coal | 3.90 | 9.10 | 16.25 | 2.33 |
| Peak | Centre | Peak Types | Relative Area/% | Attribution |
|---|---|---|---|---|
| 1 | 13.29 | Gaussian | 3.84 | R–CH3 |
| 2 | 21.21 | Gaussian | 7.77 | RCH3–CH2 |
| 3 | 29.55 | Gaussian | 4.68 | CH2 |
| 4 | 32.22 | Gaussian | 12.35 | CH2 |
| 5 | 45.06 | Gaussian | 8.02 | C,CH |
| 6 | 59.63 | Gaussian | 3.69 | O–CH3,O–CH2 |
| 7 | 73.16 | Gaussian | 1.92 | O–CH |
| 8 | 122.59 | Gaussian | 20.15 | Ar–H |
| 9 | 132.53 | Gaussian | 12.83 | C–C |
| 10 | 142.00 | Gaussian | 3.21 | Ar–C |
| 11 | 152.56 | Gaussian | 8.97 | Ar–O |
| 12 | 179.16 | Gaussian | 1.32 | COOH |
| 13 | 194.27 | Gaussian | 7.67 | C=O |
| 14 | 213.10 | Gaussian | 3.58 | C=O |
| Percentage/% | 57.74 | 12.58 | 45.16 | 20.15 | 25.01 | 8.97 | 3.21 | 12.83 | 42.26 | 3.84 | 32.82 | 5.60 |
| Peak | Centre | Relative Area/% | Area | Attribution |
|---|---|---|---|---|
| 1 | 3050.55 | 3.54 | 0.39 | Aromatics C–H stretching vibration |
| 2 | 3171.68 | 1.63 | 0.18 | Hydroxycyclic polymorphs |
| 3 | 3227.06 | 9.55 | 1.06 | Hydroxy ether oxygen |
| 4 | 3311.53 | 21.24 | 2.35 | Stretching vibration of secondary amine –NH |
| 5 | 3394.25 | 26.29 | 2.91 | Hydroxy ether oxygen |
| 6 | 3471.64 | 23.51 | 2.60 | Self-associated OH |
| 7 | 3541.16 | 14.24 | 1.58 | OH–Π |
| Peak | Centre | Relative Area/% | Area | Attribution |
|---|---|---|---|---|
| 1 | 2857.17 | 21.11 | 2.47 | CH3 symmetric stretching vibration |
| 2 | 2889.83 | 18.53 | 2.17 | CH stretching vibration |
| 3 | 2929.75 | 44.73 | 5.24 | CH2 asymmetric stretching vibration |
| 4 | 2961.20 | 13.53 | 1.59 | CH3 asymmetric stretching vibration |
| 5 | 2978.31 | 2.1 | 0.25 | CH3 asymmetric stretching vibration |
| Peak | Centre | Relative Area/% | Area | Attribution |
|---|---|---|---|---|
| 1 | 1084.34 | 4.80 | 3.12 | C–O–C vibration |
| 2 | 1181.80 | 5.14 | 3.34 | Phenol, alcohol, ether, ester C–O vibration |
| 3 | 1318.27 | 18.57 | 12.07 | CH3 symmetric bending vibration |
| 4 | 1403.86 | 10.51 | 6.83 | Stretching vibration of alkyl–CH2, –CH3, C–H |
| 5 | 1452.62 | 6.68 | 4.34 | Stretching vibration of alkyl–CH2, –CH3, C–H |
| 6 | 1496.52 | 11.34 | 7.37 | Aromatic hydrocarbons C=C vibrations |
| 7 | 1624.34 | 36.64 | 23.82 | Aromatic hydrocarbons C=C vibrations |
| 8 | 1721.38 | 6.32 | 4.11 | Aromatic esters C=O vibration |
| Peak | Centre | Relative Area/% | Area | Attribution |
|---|---|---|---|---|
| 1 | 710.96 | 1.07 | 0.02 | Benzene ring monosubstituted |
| 2 | 756.67 | 3.60 | 0.07 | Benzene ring disubstituted |
| 3 | 774.81 | 11.80 | 0.23 | Benzene ring trisubstituted |
| 4 | 813.27 | 32.48 | 0.63 | Benzene ring tetrasubstituted |
| 5 | 848.02 | 23.20 | 0.45 | Benzene ring tetrasubstituted |
| 6 | 868.96 | 19.44 | 0.38 | Benzene ring tetrasubstituted |
| 7 | 880.58 | 6.61 | 0.13 | Benzene ring pentasubstituted |
| 8 | 889.59 | 1.80 | 0.03 | Benzene ring pentasubstituted |
| Aromatic Structure | Number | Aromatic Structure | Number |
|---|---|---|---|
 | 2 | 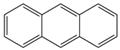 | 1 |
 | 2 |  | 1 |
 | 1 |  | 1 |
 | 1 | 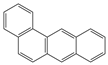 | 1 |
| Molecular Empirical Formula | Molecular Weight | Chemical Composition (%) | |||
|---|---|---|---|---|---|
| C | H | O | N | ||
| C175H125O21N3 | 2603 | 80.68 | 4.61 | 12.91 | 1.61 |
| Project | Total Energy | EB | EA | ET | EH | EVan | EI | EE |
|---|---|---|---|---|---|---|---|---|
| Initial | 200,974.99 | 778.29 | 110.03 | 308.13 | 0.00 | 200,308.95 | 18.67 | −549.08 |
| Final | 574.23 | 89.55 | 87.99 | 123.03 | −0.01 | 435.54 | 2.43 | −164.30 |
Disclaimer/Publisher’s Note: The statements, opinions and data contained in all publications are solely those of the individual author(s) and contributor(s) and not of MDPI and/or the editor(s). MDPI and/or the editor(s) disclaim responsibility for any injury to people or property resulting from any ideas, methods, instructions or products referred to in the content. |
© 2024 by the authors. Licensee MDPI, Basel, Switzerland. This article is an open access article distributed under the terms and conditions of the Creative Commons Attribution (CC BY) license (https://creativecommons.org/licenses/by/4.0/).
Share and Cite
Feng, T.; Zeng, Q. Investigation on Combustion Characteristics and Molecular Structures of Heiyanquan Mining Area, Xinjiang, China. Molecules 2024, 29, 1231. https://doi.org/10.3390/molecules29061231
Feng T, Zeng Q. Investigation on Combustion Characteristics and Molecular Structures of Heiyanquan Mining Area, Xinjiang, China. Molecules. 2024; 29(6):1231. https://doi.org/10.3390/molecules29061231
Chicago/Turabian StyleFeng, Tong, and Qiang Zeng. 2024. "Investigation on Combustion Characteristics and Molecular Structures of Heiyanquan Mining Area, Xinjiang, China" Molecules 29, no. 6: 1231. https://doi.org/10.3390/molecules29061231
APA StyleFeng, T., & Zeng, Q. (2024). Investigation on Combustion Characteristics and Molecular Structures of Heiyanquan Mining Area, Xinjiang, China. Molecules, 29(6), 1231. https://doi.org/10.3390/molecules29061231