

Thermodynamic Study of N-Methylformamide and N,N-Dimethyl-Formamide


Abstract
1. Introduction
2. Results and Discussion
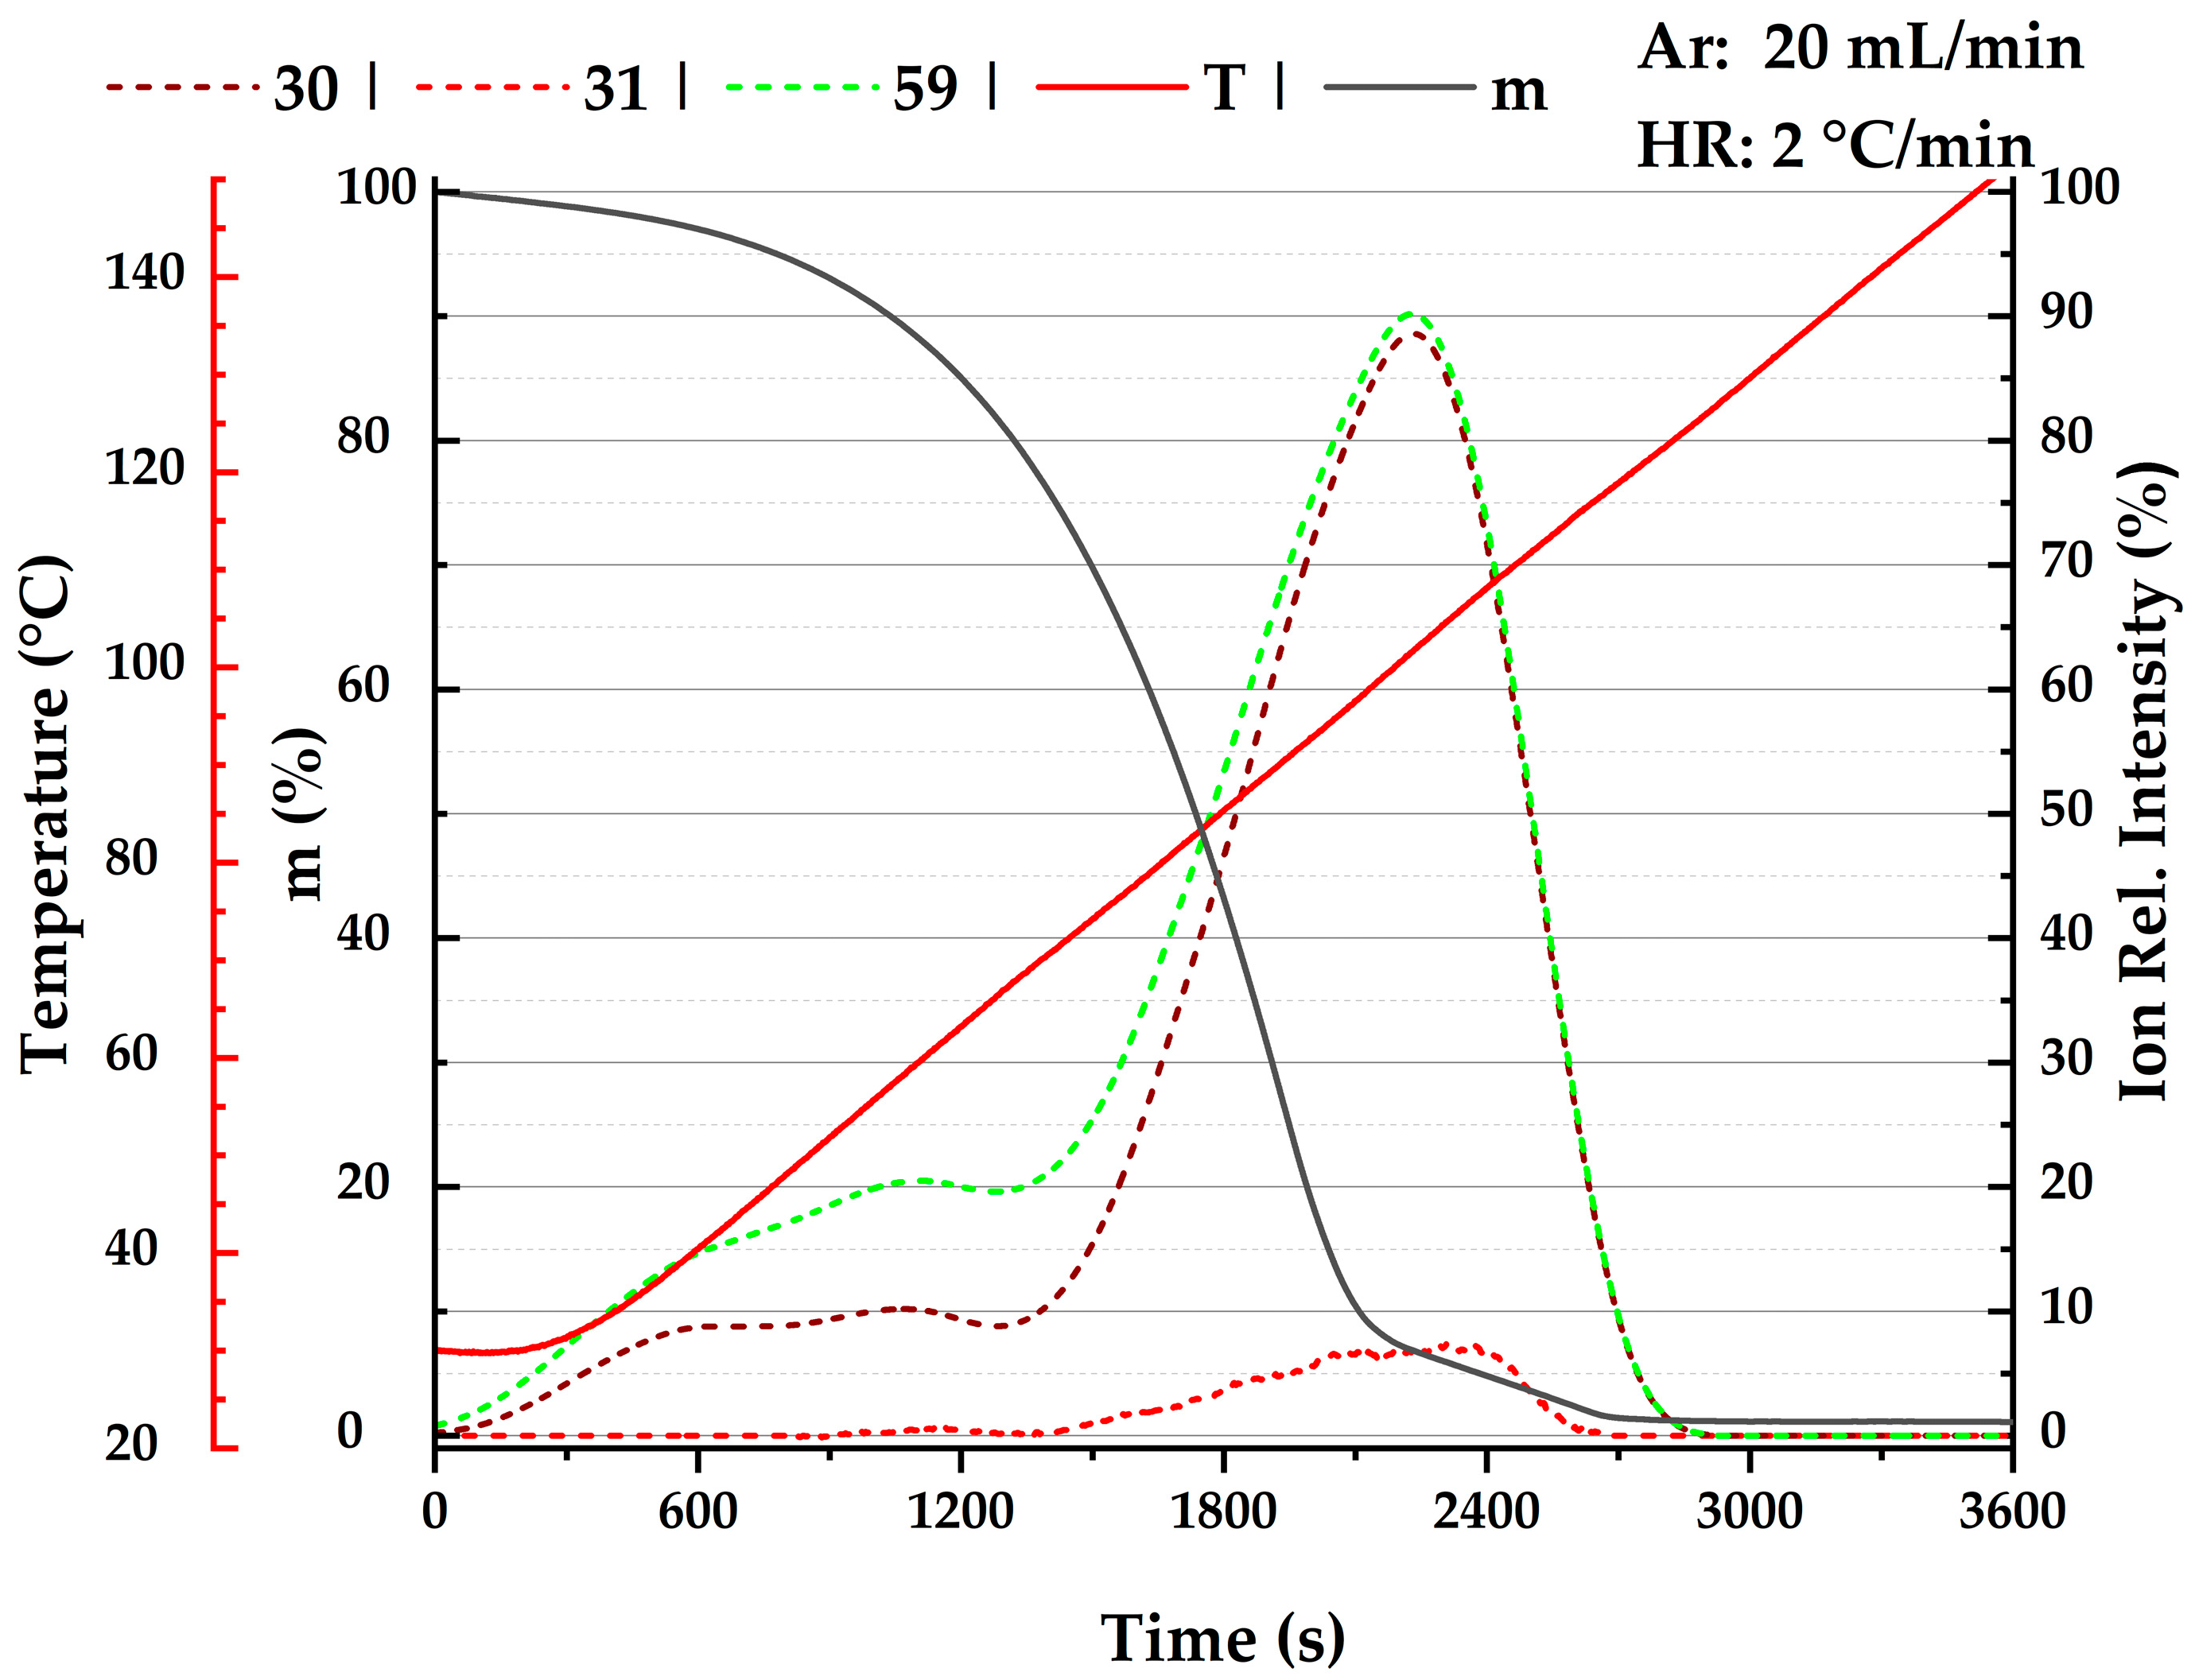
2.1. Thermogravimetry
- Reaction between two molecules of NMF to yield N-methyl-diformylamine and gaseous methylamine. This path does not require any further reagent and might occur even in pure NMF.
- Reaction with trace water (or any nucleophilic impurities, e.g., alcohols), which yields formic acid (or its derivates) and methylamine.
2.2. Vapor Pressure
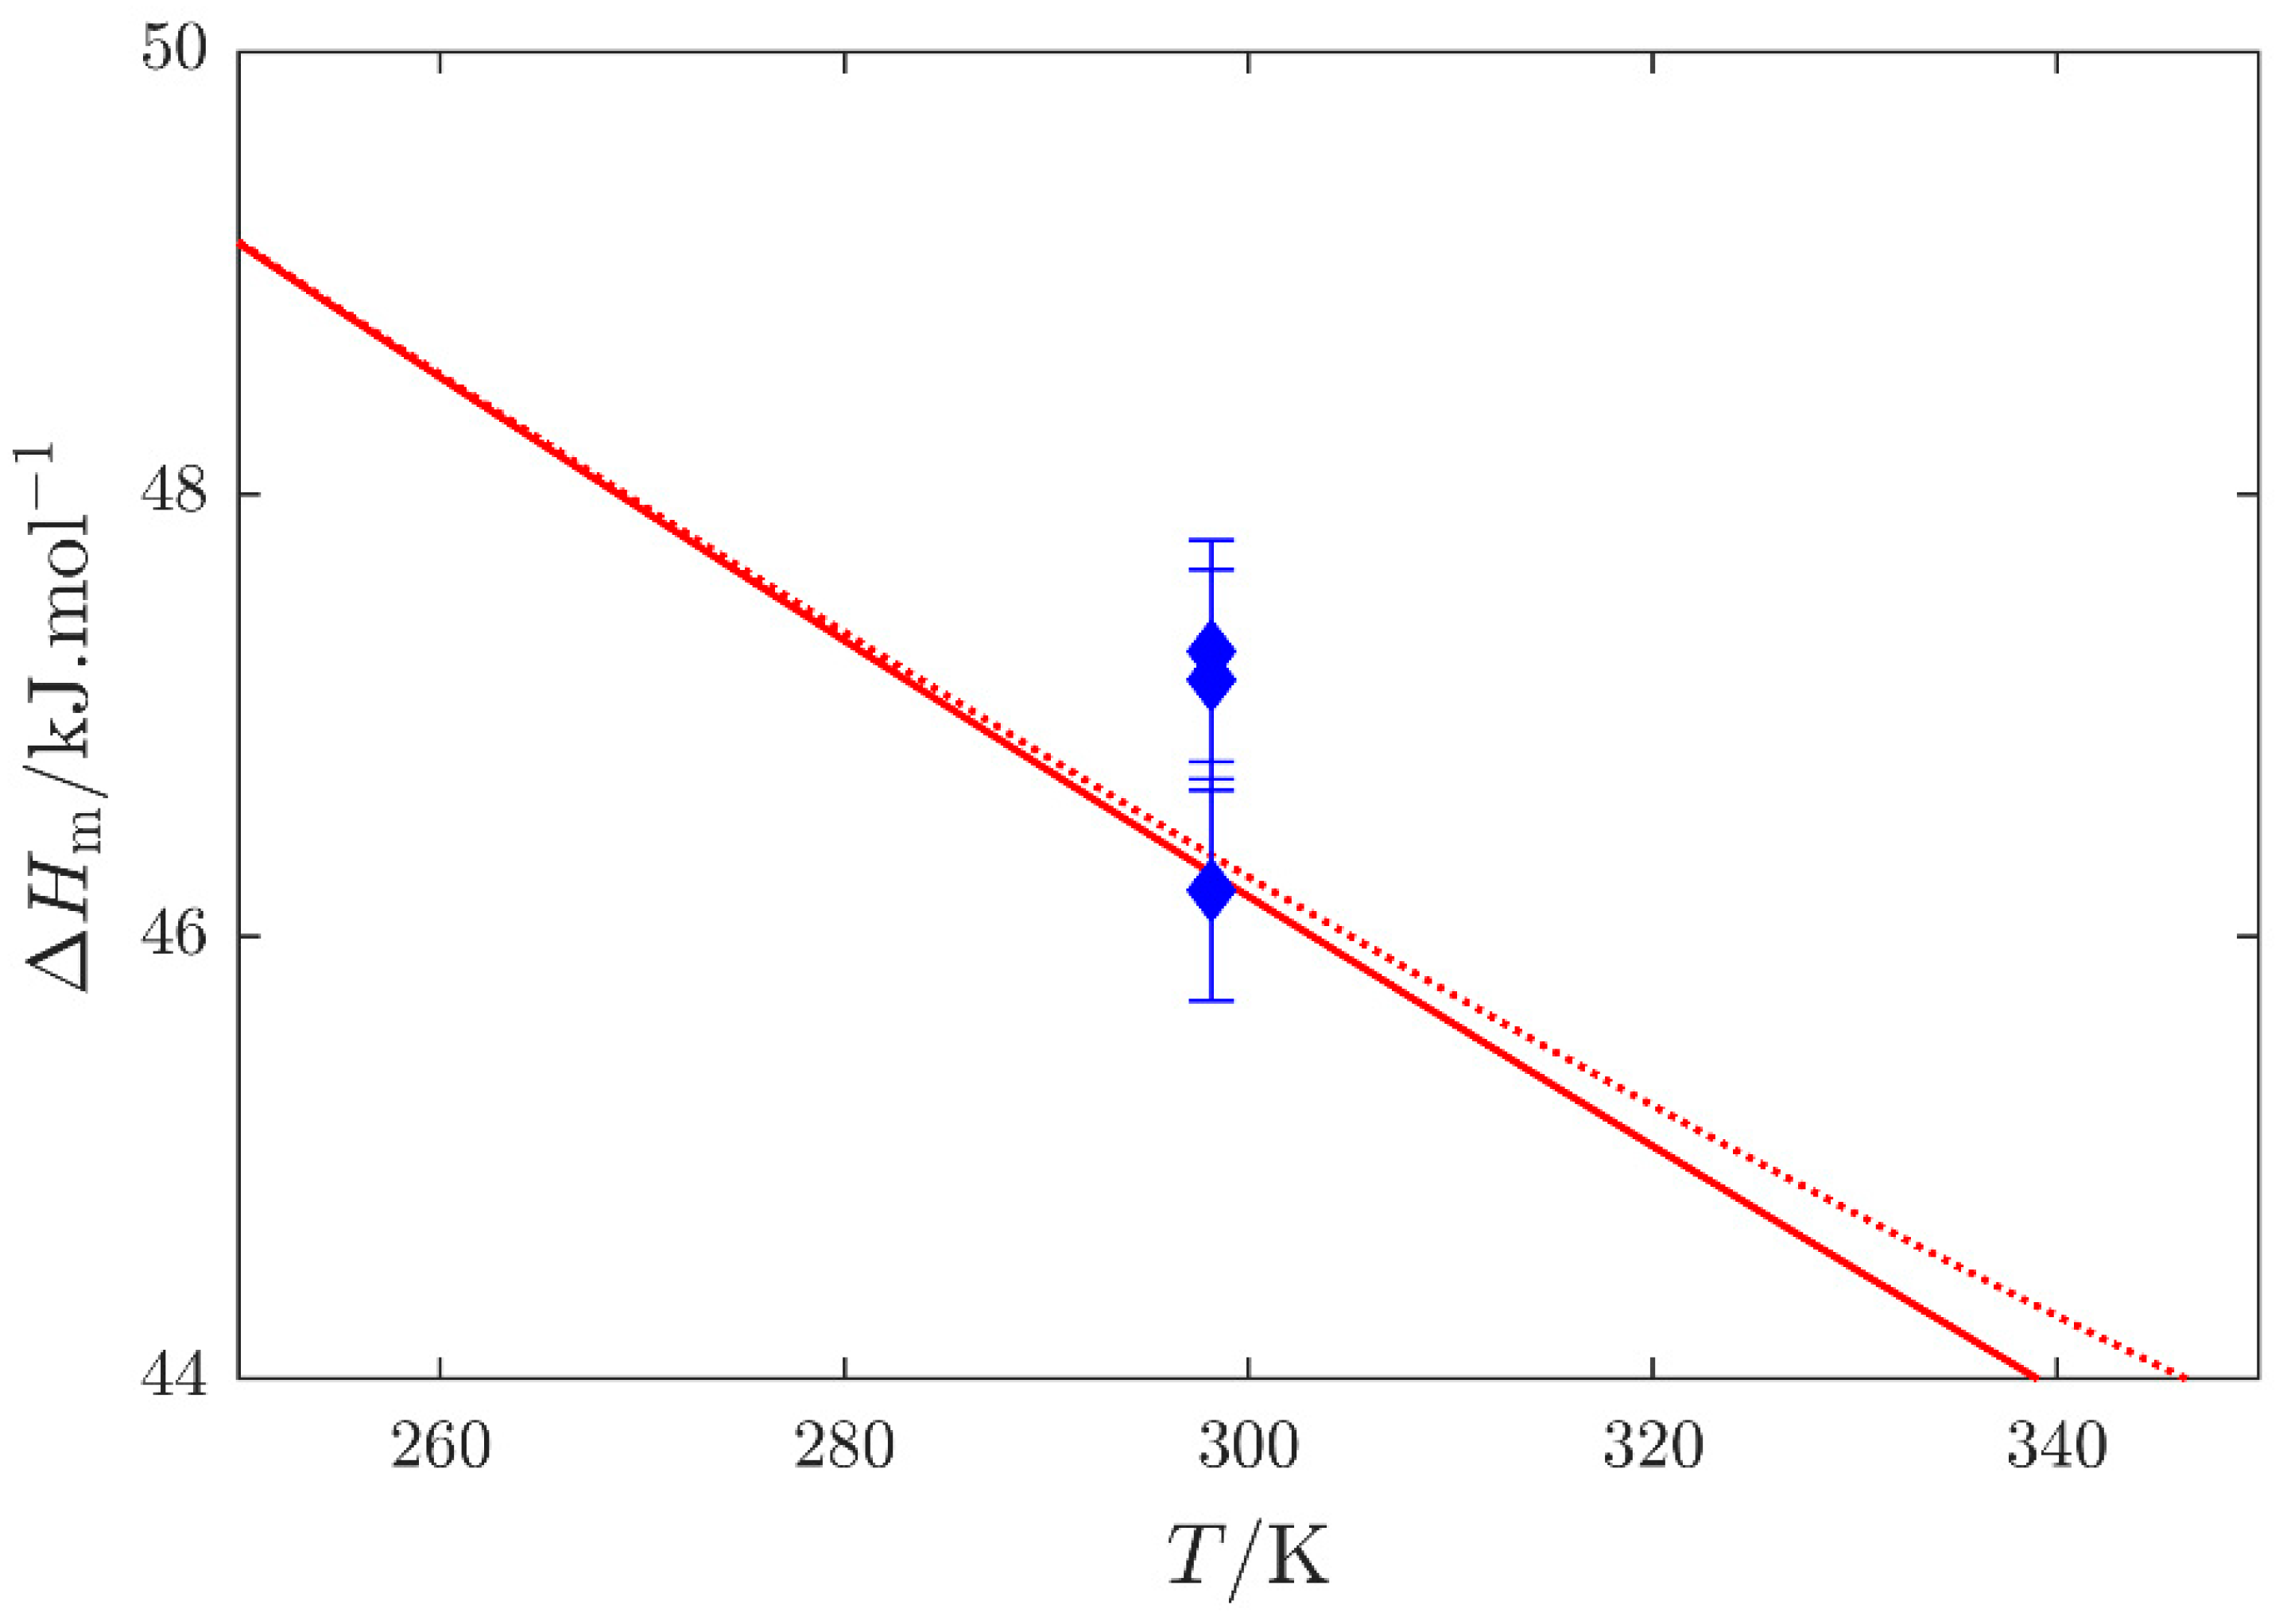
2.3. Enthalpies of Vaporization
2.4. Liquid Heat Capacities

| Year | Reference a | N b | (Tmin − Tmax)/K | ) c | Method |
|---|---|---|---|---|---|
| N-methylformamide | |||||
| 1974 | de Visser and Somsen [56] | 1 | 298.15 | 0.7 d | Isoperibol |
| 1976 | Bonner and Cerutti [57] | 1 | 298.15 | 1.0 | Isoperibol |
| 1976 | Sköld et al. [14] | 1 | 298.15 | 0.2 d | Drop |
| 1977 | de Visser et al. [58] | 1 | 298.15 | 1.0 | Isoperibol |
| 1992 | Kolker et al. [59] | 4 | 283–328 | 0.05 | “Adiabatic” e |
| 2014 | Sharma and Dua [60,61] | 3 | 298–308 | 0.3 | Tian–Calvet f |
| 2024 | This work | 11 | 250–300 | 0.6 | Tian–Calvet |
| N,N-dimethylformamide g | |||||
| 1974 | de Visser and Somsen [56] | 1 | 298.15 | 0.3 d | Isoperibol |
| 1976 | Bonner and Cerutti [57] | 1 | 298.15 | 1.0 | Isoperibol |
| 1992 | Kolker et al. [62] | 6 | 283–323 | 0.05 | “Adiabatic” e |
| 1994 | Prasad et al. [63] | 4 | 293–323 | nosp | DTA |
| 2007 | Smirnova et al. [8] | 57 | 216–302 | 0.3 | Adiabatic |
| 2010 | Checoni and Volpe [64] | 4 | 288–303 | nosp | solution |
| 2013 | Shokouhi et al. [65] | 6 | 303–353 | 0.2 | Hot wire |
| 2014 | Sharma and Dua [60,61] | 3 | 298–308 | 0.3 | Tian–Calvet |
| 2019 | Tyczyńska et al. [66,67] | 6 | 293–318 | 0.2 | Tian–Calvet |
| 2023 | Tyczyńska et al. [68] | 6 | 293–318 | 0.2 | Tian–Calvet |
 , this work; red
  , Sköld et al. [14]; green
  , Smirnova et al. [8]. Other da-tasets: black
  , de Visser and Somsen [56]; black
  , Bonner and Cerutti [57]; black
  , de Visser et al. [58]; black
  , Kolker et al. [59,62]; magenta
  , Sharma and Dua [60,61]; blue
  , Prasad et al. [63]; magenta
  , Checoni and Volpe [64]; red
  , Shokouhi et al. [65]; red
  , Tyczyńska et al. [66,67]; blue
  , Tyczyńska et al. [68].
, this work; red , Sköld et al. [14]; green , Smirnova et al. [8]. Other da-tasets: black , de Visser and Somsen [56]; black , Bonner and Cerutti [57]; black , de Visser et al. [58]; black , Kolker et al. [59,62]; magenta , Sharma and Dua [60,61]; blue , Prasad et al. [63]; magenta , Checoni and Volpe [64]; red , Shokouhi et al. [65]; red , Tyczyńska et al. [66,67]; blue , Tyczyńska et al. [68].
, Tyczyńska et al. [68].
, this work; red , Sköld et al. [14]; green , Smirnova et al. [8]. Other da-tasets: black , de Visser and Somsen [56]; black , Bonner and Cerutti [57]; black , de Visser et al. [58]; black , Kolker et al. [59,62]; magenta , Sharma and Dua [60,61]; blue , Prasad et al. [63]; magenta , Checoni and Volpe [64]; red , Shokouhi et al. [65]; red , Tyczyńska et al. [66,67]; blue , Tyczyńska et al. [68].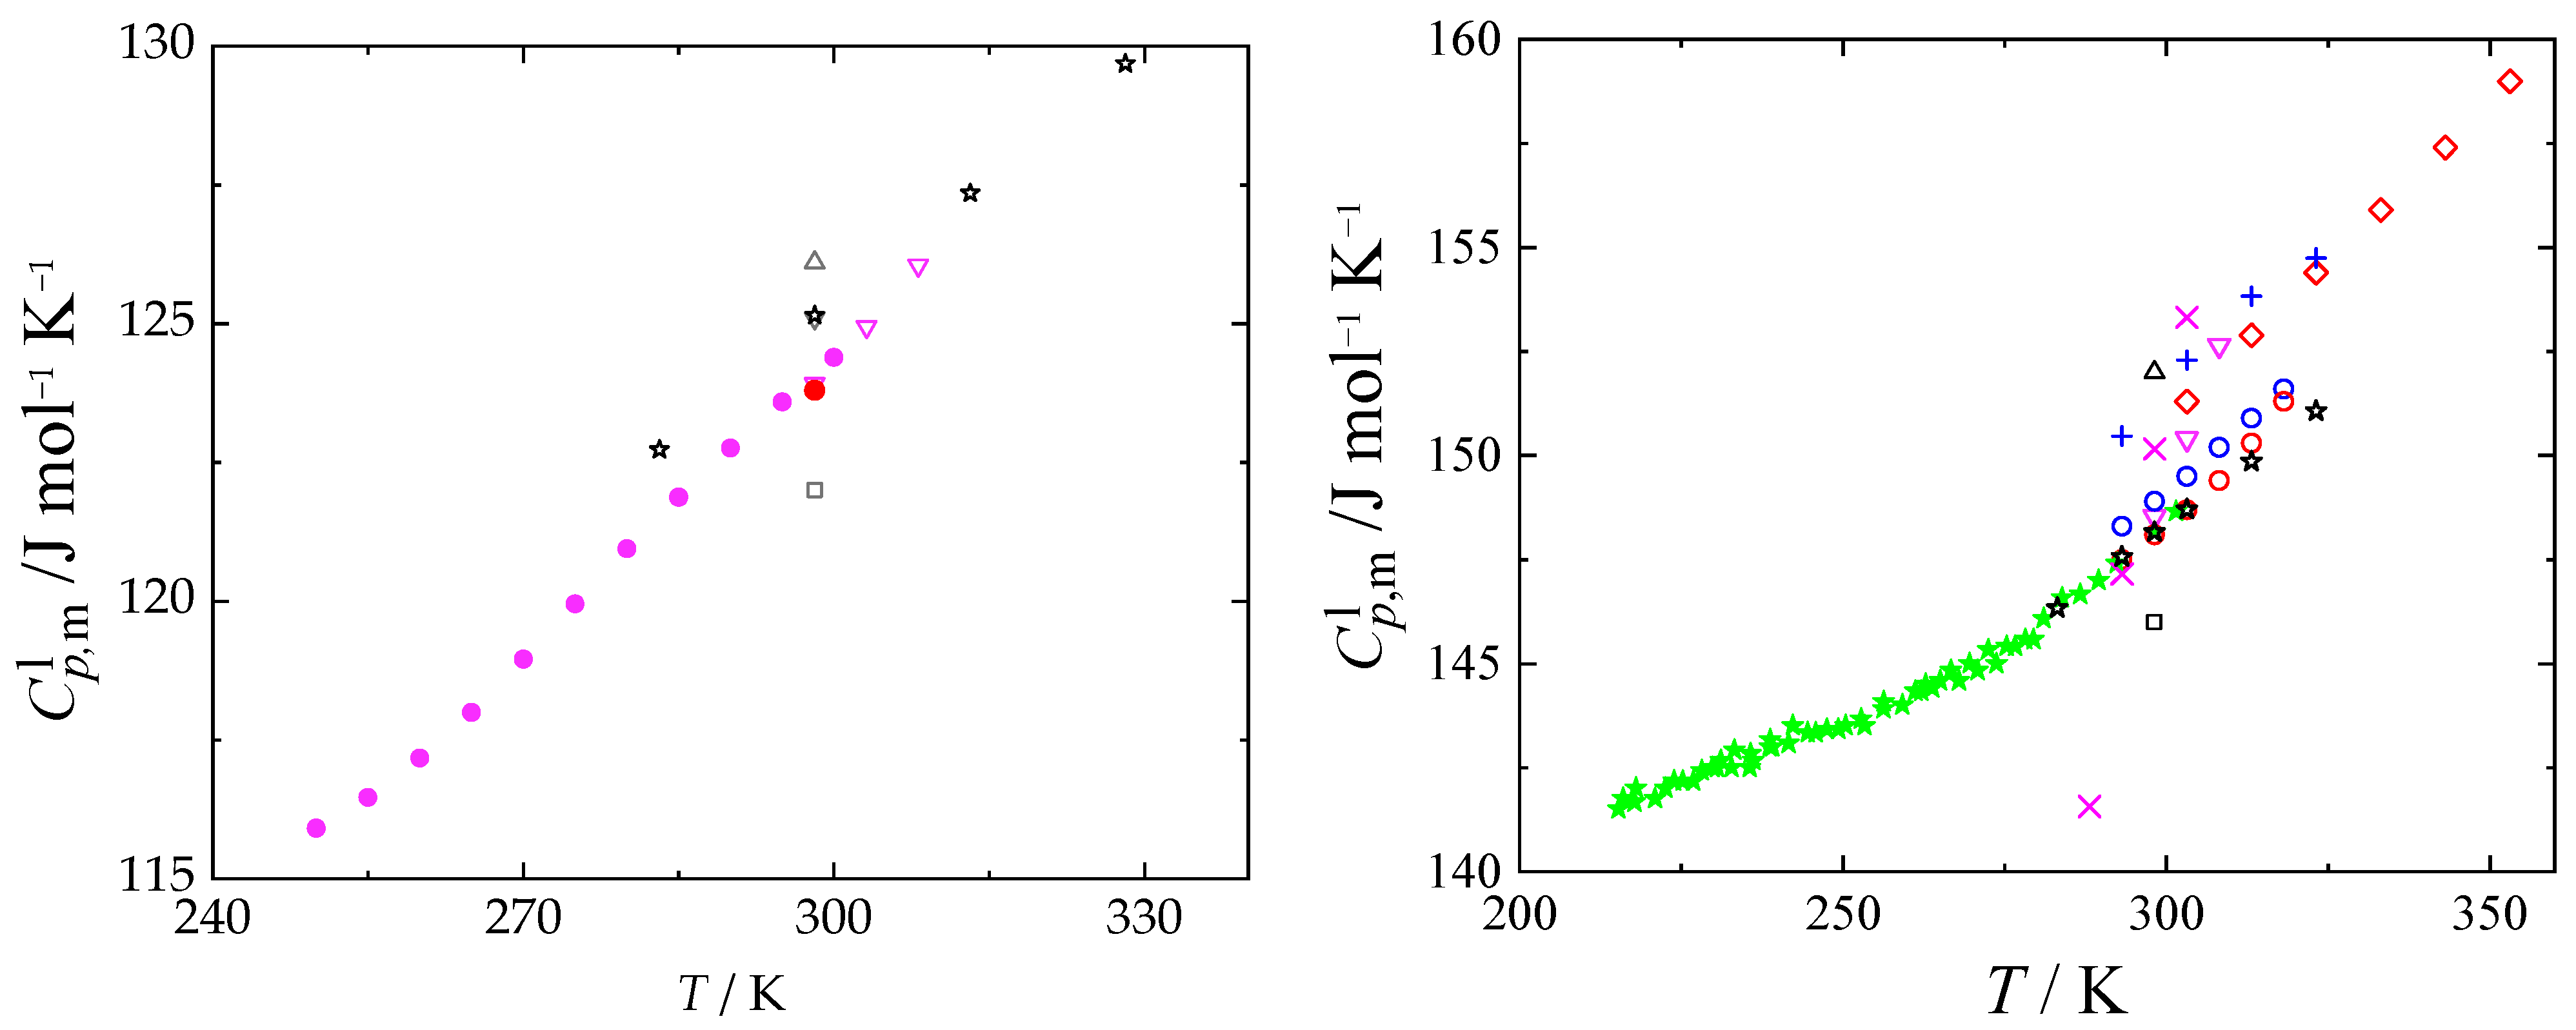
| T/K | /J·K−1·mol−1 | T/K | /J·K−1·mol−1 | T/K | /J·K−1·mol−1 |
|---|---|---|---|---|---|
| 250.0 | 115.9 | 270.0 | 119.0 | 290.0 | 122.8 |
| 255.0 | 116.5 | 275.0 | 120.0 | 295.0 | 123.6 |
| 260.0 | 117.2 | 280.0 | 120.9 | 300.0 | 124.4 |
| 265.0 | 118.0 | 285.0 | 121.9 |
2.5. Ideal-Gas Heat Capacities
2.6. Selection of Recommended Data for NMF and DMF Using SimCor Method
3. Materials and Methods
3.1. Samples Description
3.2. Thermogravimetry
3.3. Vapor Pressures
3.4. Heat Capacity Measurements
3.5. Theoretical Calculations
3.6. Simultaneous Treatment of Vapor Pressures and Related Thermal Data (SimCor Method)
4. Conclusions
Supplementary Materials
Author Contributions
Funding
Institutional Review Board Statement
Informed Consent Statement
Data Availability Statement
Conflicts of Interest
References
- Fulem, M.; Růžička, K.; Červinka, C.; Bazyleva, A.; Della Gatta, G. Thermodynamic study of alkane-α,ω-diamines – Evidence of odd–even pattern of sublimation properties. Fluid Phase Equilibria 2014, 371, 93–105. [Google Scholar] [CrossRef]
- Štejfa, V.; Chun, S.; Pokorný, V.; Fulem, M.; Růžička, K. Thermodynamic study of acetamides. J. Mol. Liq. 2020, 319, 114019. [Google Scholar] [CrossRef]
- Pokorný, V.; Červinka, C.; Štejfa, V.; Havlín, J.; Růžička, K.; Fulem, M. Heat Capacities of l-Alanine, l-Valine, l-Isoleucine, and l-Leucine: Experimental and Computational Study. J. Chem. Eng. Data 2020, 65, 1833–1849. [Google Scholar] [CrossRef]
- Pokorný, V.; Štejfa, V.; Havlín, J.; Fulem, M.; Růžička, K. Heat Capacities of L-Cysteine, L-Serine, L-Threonine, L-Lysine, and L-Methionine. Molecules 2023, 28, 451. [Google Scholar] [CrossRef]
- Štejfa, V.; Pokorný, V.; Lieberzeitová, E.; Havlín, J.; Fulem, M.; Růžička, K. Heat Capacities of N-Acetyl Amides of Glycine, L-Alanine, L-Valine, L-Isoleucine, and L-Leucine. Molecules 2023, 28, 5440. [Google Scholar] [CrossRef]
- Basma, N.; Cullen, P.L.; Clancy, A.J.; Shaffer, M.S.P.; Skipper, N.T.; Headen, T.F.; Howard, C.A. The liquid structure of the solvents dimethylformamide (DMF) and dimethylacetamide (DMA). Mol. Phys. 2019, 117, 3353–3363. [Google Scholar] [CrossRef]
- Ahlers, J.; Lohmann, J.; Gmehling, J. Binary Solid–Liquid Equilibria of Organic Systems Containing Different Amides and Sulfolane. J. Chem. Eng. Data 1999, 44, 727–730. [Google Scholar] [CrossRef]
- Smirnova, N.N.; Tsvetkova, L.Y.; Bykova, T.A.; Marcus, Y. Thermodynamic properties of N,N-dimethylformamide and N,N-dimethylacetamide. J. Chem. Thermodyn. 2007, 39, 1508–1513. [Google Scholar] [CrossRef]
- González, J.A. Thermodynamics of mixtures containing a very strongly polar compound: V – application of the extended real associated solution model to 1-Alkanol + Secondary Amide Mixtures. Phys. Chem. Liq. 2004, 42, 159–172. [Google Scholar] [CrossRef]
- Mitzel, T.M. N-Methylformamide. In Encyclopedia of Reagents for Organic Synthesis (EROS); Wiley: Hoboken, NJ, USA, 2009; pp. 1–5. [Google Scholar] [CrossRef]
- Comins, D.L.; Joseph, S.P. N,N-Dimethylformamide. In Encyclopedia of Reagents for Organic Synthesis (EROS); Wiley: Hoboken, NJ, USA, 2001; pp. 1–4. [Google Scholar] [CrossRef]
- Bipp, H.; Kieczka, H. Formamides. In Ullmann’s Encyclopedia of Industrial Chemistry; Wiley-VCH: Weinheim, Germany, 2012; pp. 1–12. [Google Scholar] [CrossRef]
- Heinrich, J.; Ilavský, J.; Surový, J. Temperature Dependence of N-Methylformamide Vapour Pressure, Liquid-Vapour Equilibrium of the N-Methylformamide-Water System (in Slovak). Chemické zvesti 1961, 15, 414–418. [Google Scholar]
- Sköld, R.; Suurkuusk, J.; Wadsö, I. Thermochemistry of solutions of biochemical model compounds 7. Aqueous solutions of some amides, t-butanol and pentanol. J. Chem. Thermodyn. 1976, 8, 1075–1080. [Google Scholar] [CrossRef]
- Rouw, A.; Somsen, G. Solvation and hydrophobic hydration of alkyl-substituted ureas and amides in NN-dimethylformamide + water mixtures. J. Chem. Soc. Faraday Trans. 1 Phys. Chem. Cond. Phases 1982, 78, 3397–3408. [Google Scholar] [CrossRef]
- Barone, G.; Castronuovo, G.; Della Gatta, G.; Elia, V.; Iannone, A. Enthalpies of vaporization of seven alkylamides. Fluid Phase Equilibria 1985, 21, 157–164. [Google Scholar] [CrossRef]
- Zaitseva, K.V.; Zaitsau, D.H.; Varfolomeev, M.A.; Verevkin, S.P. Vapour pressures and enthalpies of vaporisation of alkyl formamides. Fluid Phase Equilibria 2019, 494, 228–238. [Google Scholar] [CrossRef]
- Bendová, L.; Jurečka, P.; Hobza, P.; Vondrášek, J. Model of Peptide Bond–Aromatic Ring Interaction: Correlated Ab Initio Quantum Chemical Study. J. Phys. Chem. B 2007, 111, 9975–9979. [Google Scholar] [CrossRef]
- Biswas, S.; Mallik, B.S. Probing the vibrational dynamics of amide bands of N-methylformamide, N, N-dimethylacetamide, and N-methylacetamide in water. Comput. Theor. Chem. 2020, 1190, 113001. [Google Scholar] [CrossRef]
- Andrushchenko, V.; Matějka, P.; Anderson, D.T.; Kaminský, J.; Horníček, J.; Paulson, L.O.; Bouř, P. Solvent Dependence of the N-Methylacetamide Structure and Force Field. J. Phys. Chem. A 2009, 113, 9727–9736. [Google Scholar] [CrossRef]
- Reimann, M.; Kaupp, M. Evaluation of an Efficient 3D-RISM-SCF Implementation as a Tool for Computational Spectroscopy in Solution. J. Phys. Chem. A 2020, 124, 7439–7452. [Google Scholar] [CrossRef]
- Konicek, J.; Wadsö, I. Thermochemical Properties of Some Carboxylic Acids, Amines, and N-Substituted Amides in Aqueous Solution. Acta Chem. Scand. 1971, 25, 1541–1551. [Google Scholar] [CrossRef]
- Kortüm, G.; Biedersee, H.V. Dampf/Flüssigkeit-Gleichgewichte (Siedediagramme) binärer Systeme hoher relativer Flüchtigkeit. Wasser/N-Methylacetamid, Wasser/N-Methylformamid und N-Methylformamid/N-Methylacetamid. Chemie-Ing.-Techn. 1970, 42, 552–560. [Google Scholar] [CrossRef]
- Stein, S.E. NIST Standard Reference Database 1A, NIST Mass Spectral Libraries [Database on the Internet]. NIST. 2023. Available online: https://www.nist.gov/srd/nist-standard-reference-database-1a (accessed on 22 January 2024).
- Messow, U.; Quitzsch, K.; Seyffert, U.; Geiseler, G. Studies on Thermodynamics of Binary-Liquid Mixtures with Homolog Formamides.10. Binary-Systems Benzene(1) and N-Methylformamide(2), Tetrachloromethane(1) and N-Methylformamide(2), Cyclohexane(1) and N-Methylformamide(2), and Heptane(1) and N-Methylformamide(2). Z. Phys. Chem.-Leipzig 1974, 255, 947–968. [Google Scholar]
- Ushakov, V.S.; Sedov, S.M.; Knyazev, B.A.; Kuchkaev, B.I. The thermodynamic properties of N-methylformamide. Zh. Fiz. Khim. 1996, 70, 1573–1577. [Google Scholar]
- Zielkiewicz, J. (Vapour+liquid) equilibria in (N-methylformamide+methanol+water) at the temperature 313.15 K. J. Chem. Thermodyn. 1996, 28, 887–894. [Google Scholar] [CrossRef]
- Zielkiewicz, J. (Vapour + liquid) equilibria in (N-methylformamide + ethanol + water) at the temperature 313.15 K. J. Chem. Eng. Data 1997, 29, 229–237. [Google Scholar] [CrossRef]
- Zielkiewicz, J. Excess Molar Volumes and Excess Gibbs Energies in N-Methylformamide + Water, or + Methanol, or + Ethanol at the Temperature 303.15 K. J. Chem. Eng. Data 1998, 43, 650–652. [Google Scholar] [CrossRef]
- Harris, R.A.; Wittig, R.; Gmehling, J.; Letcher, T.M.; Ramjugernath, D.; Raal, J.D. Vapor–Liquid Equilibria for Four Binary Systems at 363.15 K: N-Methylformamide + Hexane, + Benzene, + Chlorobenzene, and + Acetonitrile. J. Chem. Eng. Data 2003, 48, 341–343. [Google Scholar] [CrossRef]
- Chen, W.-K.; Lee, K.-J.; Chang, C.-M.J.; Ko, J.-W.; Lee, L.-S. Vapor-liquid equilibria and density measurement for binary mixtures of o-xylene+NMF, m-xylene+NMF and p-xylene+NMF at 333.15 K, 343.15 K and 353.15 K from 0 kPa to 101.3 kPa. Fluid Phase Equilib. 2010, 291, 40–47. [Google Scholar] [CrossRef]
- Li, R.; Meng, X.; Liu, X.; Gao, J.; Xu, D.; Wang, Y. Separation of azeotropic mixture (2, 2, 3, 3-Tetrafluoro-1-propanol + water) by extractive distillation: Entrainers selection and vapour-liquid equilibrium measurements. J. Chem. Thermodyn. 2019, 138, 205–210. [Google Scholar] [CrossRef]
- Ivanova, T.M.; Geller, B.E. Properties of the Dimethylformamide-Water System. 2. Vapor Density and Osmotic Pressure of the Aqueous Solutions. Zh. Fiz. Khim. 1961, 35, 1221–1229. [Google Scholar]
- Gopal, R.; Rizvi, S.A. Vapour Pressures of some Mono- and Di-Alkyl Substituted Aliphatic Amides at Different Temperatures. J. Ind. Chem. Soc. 1968, 45, 13–16. [Google Scholar]
- Quitzsch, K.; Strittmatter, D.; Geiseler, G. Studien zur Thermodynamik binärer Flüssigkeitsgemische mit homologen Formamiden VIII. Die binären Systeme R-Heptan(l)/Dimethylformamid(2) und n-Heptan(l)/Diäthylformamid(2). Z. Phys. Chem. 1969, 240, 107–126. [Google Scholar] [CrossRef]
- Myasnikova, L.F.; Shmelev, V.A.; Vaisman, I.L.; Bushinskii, V.I.; Novokhatka, D.A. Temperature dependence of the vapor-pressure of dimethylformamide and its aqueous solutions. Zh. Prikl. Khim. 1974, 47, 2604–2606. [Google Scholar]
- Bludilina, V.I.; Baev, A.K.; Matveev, V.K.; Gaidym, I.L.; Shcherbina, E.I. Thermodynamic study of the evaporation of dimethylformamide, N-methylpyrrolidone and tetrahydrofurfuryl alcohol. Zh. Fiz. Khim. 1979, 53, 1052–1053. [Google Scholar]
- Agarwal, R.S.; Bapat, S.L. Solubility characteristics of R22-DMF refrigerant-absorbent combination. Int. J. Refrig. 1985, 8, 70–74. [Google Scholar] [CrossRef]
- Shealy, G.S.; Sandler, S.I. Vapor-liquid equilibrium for four mixtures containing N,N-dimethylformamide. J. Chem. Eng. Data 1985, 30, 455–459. [Google Scholar] [CrossRef]
- Wilding, W.V.; Wilson, L.C.; Wilson, G.M. Vapor liquid equilibrium measurements on five binary mixtures. Fluid Phase Equilibria 1987, 36, 67–90. [Google Scholar] [CrossRef]
- Polishchuk, A.P.; Luk’yanchikova, I.A.; Sergeev, E.N.; Rumyantsev, E.M. Thermodynamic study of the dimethylformamide-ethylene glycol monobutyl ether-ammonium nitrate system. Izv. Vyssh. Uchebn. Zaved., Khim. Khim. Tekhnol. 1988, 31, 48–52. [Google Scholar]
- Marzal, P.; Gabaldon, C.; Seco, A.; Monton, J.B. Isobaric Vapor-Liquid Equilibria of 1-Butanol + N,N-Dimethylformamide and 1-Pentanol + N,N-Dimethylformamide Systems at 50.00 and 100.00 kPa. J. Chem. Eng. Data 1995, 40, 589–592. [Google Scholar] [CrossRef]
- Blanco, B.; Beltrán, S.; Cabezas, J.L.; Coca, J. Phase Equilibria of Binary Systems Formed by Hydrocarbons from Petroleum Fractions and the Solvents N-Methylpyrrolidone and N,N-Dimethylformamide. 1. Isobaric Vapor–Liquid Equilibria. J. Chem. Eng. Data 1997, 42, 938–942. [Google Scholar] [CrossRef]
- Wang, C.; Li, H.; Zhu, L.; Han, S. Isothermal and isobaric vapor + liquid equilibria of N,N-dimethylformamide + n-propanol + n-butanol. Fluid Phase Equilibria 2001, 189, 119–127. [Google Scholar] [CrossRef]
- Muñoz, R.; Montón, J.B.; Burguet, M.C.; de la Torre, J. Phase equilibria in the systems isobutyl alcohol+N,N-dimethylformamide, isobutyl acetate+N,N-dimethylformamide and isobutyl alcohol+isobutyl acetate+N,N-dimethylformamide at 101.3;kPa. Fluid Phase Equilibria 2005, 232, 62–69. [Google Scholar] [CrossRef]
- Cui, X.; Chen, G.; Han, X. Experimental Vapor Pressure Data and a Vapor Pressure Equation for N,N-Dimethylformamide. J. Chem. Eng. Data 2006, 51, 1860–1861. [Google Scholar] [CrossRef]
- Fulem, M.; Růžička, K.; Morávek, P.; Pangrác, J.; Hulicius, E.; Kozyrkin, B.; Shatunov, V. Vapor Pressure of Selected Organic Iodides. J. Chem. Eng. Data 2010, 55, 4780–4784. [Google Scholar] [CrossRef]
- Čenský, M.; Roháč, V.; Růžička, K.; Fulem, M.; Aim, K. Vapor pressure of selected aliphatic alcohols by ebulliometry. Part 1. Fluid Phase Equilibria 2010, 298, 192–198. [Google Scholar] [CrossRef]
- Barone, G.; Della Gatta, G.; Elia, V. Direct Determination of Enthalpies of Vaporization of Liquid Compounds by a Miniaturized Effusion Cell Adapted to a Commercial Microcalorimeter. J. Therm. Anal. 1984, 29, 763–772. [Google Scholar] [CrossRef]
- Majer, V.; Svoboda, V. IUPAC Chemical Data Series No. 32: Enthalpies of Vaporization of Organic Compounds: A Critical Review and Data Compilation; Blackwell Scientific: Oxford, UK, 1985. [Google Scholar]
- Herrig, S.; Thol, M.; Harvey, A.H.; Lemmon, E.W. A Reference Equation of State for Heavy Water. J. Phys. Chem. Ref. Data 2018, 47, 043102. [Google Scholar] [CrossRef]
- Wagner, W.; Pruß, A. The IAPWS Formulation 1995 for the Thermodynamic Properties of Ordinary Water Substance for General and Scientific Use. J. Phys. Chem. Ref. Data 2002, 31, 387–535. [Google Scholar] [CrossRef]
- Acree, W.; Chickos, J.S. Phase Transition Enthalpy Measurements of Organic and Organometallic Compounds. Sublimation, Vaporization and Fusion Enthalpies From 1880 to 2015. Part 1. C1 − C10. J. Phys. Chem. Ref. Data 2016, 45. [Google Scholar] [CrossRef]
- Panneerselvam, K.; Antony, M.P.; Srinivasan, T.G.; Vasudeva Rao, P.R. Enthalpies of vaporization of N,N-dialkyl monamides at 298.15 K. Thermochim. Acta 2009, 495, 1–4. [Google Scholar] [CrossRef]
- Koutek, B.; Pokorný, V.; Mahnel, T.; Štejfa, V.; Řehák, K.; Fulem, M.; Růžička, K. Estimating Vapor Pressure Data from Gas–Liquid Chromatography Retention Times: Analysis of Multiple Reference Approaches, Review of Prior Applications, and Outlook. J. Chem. Eng. Data 2022, 67, 2017–2043. [Google Scholar] [CrossRef]
- de Visser, C.; Somsen, G. Molar Heat Capacities of Binary Mixtures of Water and Some Amides at 298.15 K. Z. Phys. Chem. Neue Folge 1974, 92, 159–162. [Google Scholar] [CrossRef]
- Bonner, O.D.; Cerutti, P.J. The partial molar heat capacities of some solutes in water and deuterium oxide. J. Chem. Thermodyn. 1976, 8, 105–112. [Google Scholar] [CrossRef]
- de Visser, C.; Pel, P.; Somsen, G. Volumes and heat capacities of water andN-methylformamide in mixtures of these solvents. J. Sol. Chem. 1977, 6, 571–580. [Google Scholar] [CrossRef]
- Kolker, A.M.; Kulikov, M.V.; Krestov, A.G. Volumes and heat capacities of binary non-aqueous mixtures. Part 1. The systems acetonitrile—formamide and acetonitrile—N-methylformamide. Thermochimica Acta 1992, 211, 61–72. [Google Scholar] [CrossRef]
- Sharma, V.K.; Dua, R. Topological and thermodynamic investigations of mixtures containing o-chlorotoluene and lower amides. J. Chem. Thermodyn. 2014, 71, 182–195. [Google Scholar] [CrossRef]
- Sharma, V.K.; Dua, R.; Sharma, D. Topological Investigations of Excess Heat Capacities of Binary and Ternary Liquid Mixtures Containing o-Chlorotoluene, Amides and Cyclohexane at 298.15, 303.15 and 308.15 K. J. Sol. Chem. 2015, 44, 1452–1478. [Google Scholar] [CrossRef]
- Kolker, A.M.; Kulikov, M.V.; Krestov, A.G. Volumes and heat capacities of binary non-aqueous mixtures. Part 2. The systems acetonitrile-N,N-dimethylformamide and acetonitrile-hexamethylphosphoric triamide. Thermochimica Acta 1992, 211, 73–84. [Google Scholar] [CrossRef]
- Vittal Prasad, T.E.; Rajiah, A.; Prasad, D.H.L. Heat Capacity of Toluene + Dimethyl Formamide Mixtures. Phys. Chem. Liq. 1994, 27, 215–218. [Google Scholar] [CrossRef]
- Checoni, R.F.; Volpe, P.L.O. Measurements of the Molar Heat Capacities and Excess Molar Heat Capacities for Water + Organic Solvents Mixtures at 288.15 K to 303.15 K and Atmospheric Pressure. J. Sol. Chem. 2010, 39, 259–276. [Google Scholar] [CrossRef]
- Shokouhi, M.; Jalili, A.H.; Hosseini-Jenab, M.; Vahidi, M. Thermo-physical properties of aqueous solutions of N,N-dimethylformamide. J. Mol. Liq. 2013, 186, 142–146. [Google Scholar] [CrossRef]
- Tyczyńska, M.; Jóźwiak, M.; Komudzińska, M.; Majak, T. Effect of temperature and composition on the volumetric, acoustic and thermal properties of N,N-dimethylformamide + propan-1-ol mixture. J. Mol. Liq. 2019, 290, 111124. [Google Scholar] [CrossRef]
- Komudzińska, M.; Tyczyńska, M.; Jóźwiak, M.; Burakowski, A.; Gliński, J. Volumetric, acoustic and thermal properties of aqueous N,N-dimethylformamide system. Effect of temperature and composition. J. Mol. Liq. 2020, 300, 112321. [Google Scholar] [CrossRef]
- Tyczynska, M.; Dentkiewicz, A.; Jozwiak, M. Thermodynamic and Thermal Analyze of N,N-Dimethylformamide + 1-Butanol Mixture Properties Based on Density, Sound Velocity and Heat Capacity Data. Molecules 2023, 28, 4698. [Google Scholar] [CrossRef] [PubMed]
- Sarge, S.M.; Höhne, G.; Hemminger, W. Calorimetry: Fundamentals, Instrumentation and Applications; Wiley: Hoboken, NJ, USA, 2014. [Google Scholar]
- Popov, E.M.; Zheltova, V.N.; Kogan, G.A. Vibrational spectra and force fields of the simplest amides. Zh. Strukt. Khim. 1970, 11, 1053–1060. [Google Scholar] [CrossRef]
- Shin, S.; Kurawaki, A.; Hamada, Y.; Shinya, K.; Ohno, K.; Tohara, A.; Sato, M. Conformational behavior of N-methylformamide in the gas, matrix, and solution states as revealed by IR and NMR spectroscopic measurements and by theoretical calculations. J. Mol. Struct. 2006, 791, 30–40. [Google Scholar] [CrossRef]
- Frenkel, M.; Kabo, G.J.; Marsh, K.N.; Roganov, G.N.; Wilhoit, R.C. Thermodynamics of Organic Compounds in the Gas State; Thermodynamics Research Center: College Station, TX, USA, 1994.
- Suzuki, I. Infrared Spectra and Normal Vibrations of N-Methylformamides HCONHCH-3, HCONDCH-3, DCONDCH-3, AND DCONDCH-3. Bull. Chem. Soc. Jpn. 1962, 35, 540–551. [Google Scholar] [CrossRef]
- Glushko, A.S.; Kabo, G.Y.; Frenkel, M.L. Thermodynamic properties of amides. Zh. Prikl. Khim. 1985, 58, 447–450. [Google Scholar]
- Jao, T.C.; Scott, I.; Steele, D. The Vibrational-Spectra of Amides - Dimethyl Formamide. J. Mol. Spectrosc. 1982, 92, 1–17. [Google Scholar] [CrossRef]
- Růžička, K.; Majer, V. Simple and controlled extrapolation of vapor pressures toward the triple point. AIChE J. 1996, 42, 1723–1740. [Google Scholar] [CrossRef]
- Tsonopoulos, C. Empirical correlation of second virial coefficients. AIChE J. 1974, 20, 263–272. [Google Scholar] [CrossRef]
- Wilson, L.C.; Jasperson, L.V.; VonNiederhausern, D.; Giles, N.F.; Ihmels, C. DIPPR Project 851—Thirty Years of Vapor–Liquid Critical Point Measurements and Experimental Technique Development. J. Chem. Eng. Data 2018, 63, 3408–3417. [Google Scholar] [CrossRef]
- Kessler, M.; Povarov, J.M.; Gorbanev, A.I. Dipole moment of N-Methylformamid. Chem. Zentralblatt 1967, 138, 445–448. [Google Scholar]
- McClellan, A.L. Tables of Experimental Dipole Moments; Rahara Enterprises: El Cerrito, CF, USA, 1974; Volume 2. [Google Scholar]
- Meija, J.; Coplen, T.B.; Berglund, M.; Brand, W.A.; De Bièvre, P.; Gröning, M.; Holden, N.E.; Irrgeher, J.; Loss, R.D.; Walczyk, T.; et al. Atomic weights of the elements 2013 (IUPAC Technical Report). Pur. Appl. Chem. 2016, 88, 265–291. [Google Scholar] [CrossRef]
- Newell, D.B.; Cabiati, F.; Fischer, J.; Fujii, K.; Karshenboim, S.G.; Margolis, H.S.; de Mirandés, E.; Mohr, P.J.; Nez, F.; Pachucki, K.; et al. The CODATA 2017 values of h, e, k, and NA for the revision of the SI. Metrologia 2018, 55, L13. [Google Scholar] [CrossRef]
- Höhne, G.W.H.; Flammersheim, H.-J.; Hemminger, W. Differential Scanning Calorimetry; Springer: Berlin, Germany, 2003. [Google Scholar]
- Irikura, K.K.; Frurip, D.J. Computational Thermochemistry: Prediction and Estimation of Molecular Thermodynamics; American Chemical Society: Washington, DC, USA, 1998. [Google Scholar]
- East, A.L.L.; Radom, L. Ab initio statistical thermodynamical models for the computation of third-law entropies. J. Chem. Phys. 1997, 106, 6655–6674. [Google Scholar] [CrossRef]
- Pfaendtner, J.; Yu, X.; Broadbelt, L.J. The 1-D hindered rotor approximation. Theor. Chem. Acc. 2007, 118, 881–898. [Google Scholar] [CrossRef]
- Frisch, M.J.; Trucks, G.W.; Schlegel, H.B.; Scuseria, G.E.; Robb, M.A.; Cheeseman, J.R.; Scalmani, G.; Barone, V.; Petersson, G.A.; Nakatsuji, H.; et al. Gaussian 16 Revision B.01. Gaussian, Inc.: Wallingford, CT, USA, 2016. [Google Scholar]
- Grimme, S.; Antony, J.; Ehrlich, S.; Krieg, H. A consistent and accurate ab initio parametrization of density functional dispersion correction (DFT-D) for the 94 elements H-Pu. J. Chem. Phys. 2010, 132, 154104. [Google Scholar] [CrossRef] [PubMed]
- Becke, A.D. Density-functional thermochemistry. III. The role of exact exchange. J. Chem. Phys. 1993, 98, 5648–5652. [Google Scholar] [CrossRef]
- Lee, C.; Yang, W.; Parr, R.G. Development of the Colle-Salvetti correlation-energy formula into a functional of the electron density. Physical Review B 1988, 37, 785–789. [Google Scholar] [CrossRef]
- Červinka, C.; Fulem, M.; Růžička, K. Evaluation of Accuracy of Ideal-Gas Heat Capacity and Entropy Calculations by Density Functional Theory (DFT) for Rigid Molecules. J. Chem. Eng. Data 2012, 57, 227–232. [Google Scholar] [CrossRef]
- Červinka, C.; Fulem, M.; Růžička, K. Evaluation of Uncertainty of Ideal-Gas Entropy and Heat Capacity Calculations by Density Functional Theory (DFT) for Molecules Containing Symmetrical Internal Rotors. J. Chem. Eng. Data 2013, 58, 1382–1390. [Google Scholar] [CrossRef]
- Štejfa, V.; Fulem, M.; Růžička, K. First-principles calculation of ideal-gas thermodynamic properties of long-chain molecules by R1SM approach—Application to n-alkanes. J. Chem. Phys. 2019, 150, 224101. [Google Scholar] [CrossRef] [PubMed]
- Pitzer, K.S.; Gwinn, W.D. Energy Levels and Thermodynamic Functions for Molecules with Internal Rotation I. Rigid Frame with Attached Tops. J. Chem. Phys. 1942, 10, 428–440. [Google Scholar] [CrossRef]
- Marston, C.C.; Balintkurti, G.G. The Fourier Grid Hamiltonian Method for Bound-State Eigenvalues and Eigenfunctions. J. Chem. Phys. 1989, 91, 3571–3576. [Google Scholar] [CrossRef]
- Červinka, C.; Fulem, M.; Štejfa, V.; Růžička, K. Analysis of Uncertainty in the Calculation of Ideal-Gas Thermodynamic Properties Using the One-Dimensional Hindered Rotor (1-DHR) Model. J. Chem. Eng. Data 2017, 62, 445–455. [Google Scholar] [CrossRef]
- King, M.B.; Al-Najjar, H. Method for correlating and extending vapor pressure data to lower temperatures using thermal data. Vapor pressure equations for some n-alkanes at temperatures below the normal boiling point. Chem. Eng. Sci. 1974, 29, 1003–1011. [Google Scholar] [CrossRef]
- Mahnel, T.; Štejfa, V.; Maryška, M.; Fulem, M.; Růžička, K. Reconciled thermophysical data for anthracene. J. Chem. Thermodyn. 2019, 129, 61–72. [Google Scholar] [CrossRef]
- Cox, E.R. Hydrocarbon vapor pressures. Ind. Eng. Chem. 1936, 28, 613–616. [Google Scholar] [CrossRef]
 , this work; green
  , Heinrich et al. [13]; green
  , Shealy and Sandler [39]; cyan
  , Blanco et al. [43]; dark green
  , Wang et al. [44]; red
  , Muñoz et al. [45]. Other datasets: cyan
  , Kortüm and Biedersee [23]; black
  , Messow et al. [25]; blue
  , Ushakov et al. [26]; orange
  , Zielkiewicz [27,28,29]; violet
  , Harris et al. [30]; brown
  , Chen et al. [31]; red
  , Li et al. [32]; grey
  , Ivanova and Geller [33]; blue , Gopal et al. [34]; black , Quitzsch et al. [35]; dark green
  , Myasnikova et al. [36] (partially displayed); olive
  , Bludilina et al. [37]; red , Agarwal and Bapat [38]; olive
  , Wilding et al. [40]; red , Polishchuk et al. [41]; red
  , Marzal et al. [42]; green
  , Cui et al. [46]; blue
  , Zaitseva et al. [17]; red
  , data obtained by SimCor method.
, this work; green , Heinrich et al. [13]; green , Shealy and Sandler [39]; cyan , Blanco et al. [43]; dark green , Wang et al. [44]; red , Muñoz et al. [45]. Other datasets: cyan , Kortüm and Biedersee [23]; black , Messow et al. [25]; blue , Ushakov et al. [26]; orange , Zielkiewicz [27,28,29]; violet , Harris et al. [30]; brown , Chen et al. [31]; red , Li et al. [32]; grey , Ivanova and Geller [33]; blue , Gopal et al. [34]; black , Quitzsch et al. [35]; dark green , Myasnikova et al. [36] (partially displayed); olive , Bludilina et al. [37]; red , Agarwal and Bapat [38]; olive , Wilding et al. [40]; red , Polishchuk et al. [41]; red , Marzal et al. [42]; green , Cui et al. [46]; blue , Zaitseva et al. [17]; red , data obtained by SimCor method.
, data obtained by SimCor method.
, this work; green , Heinrich et al. [13]; green , Shealy and Sandler [39]; cyan , Blanco et al. [43]; dark green , Wang et al. [44]; red , Muñoz et al. [45]. Other datasets: cyan , Kortüm and Biedersee [23]; black , Messow et al. [25]; blue , Ushakov et al. [26]; orange , Zielkiewicz [27,28,29]; violet , Harris et al. [30]; brown , Chen et al. [31]; red , Li et al. [32]; grey , Ivanova and Geller [33]; blue , Gopal et al. [34]; black , Quitzsch et al. [35]; dark green , Myasnikova et al. [36] (partially displayed); olive , Bludilina et al. [37]; red , Agarwal and Bapat [38]; olive , Wilding et al. [40]; red , Polishchuk et al. [41]; red , Marzal et al. [42]; green , Cui et al. [46]; blue , Zaitseva et al. [17]; red , data obtained by SimCor method.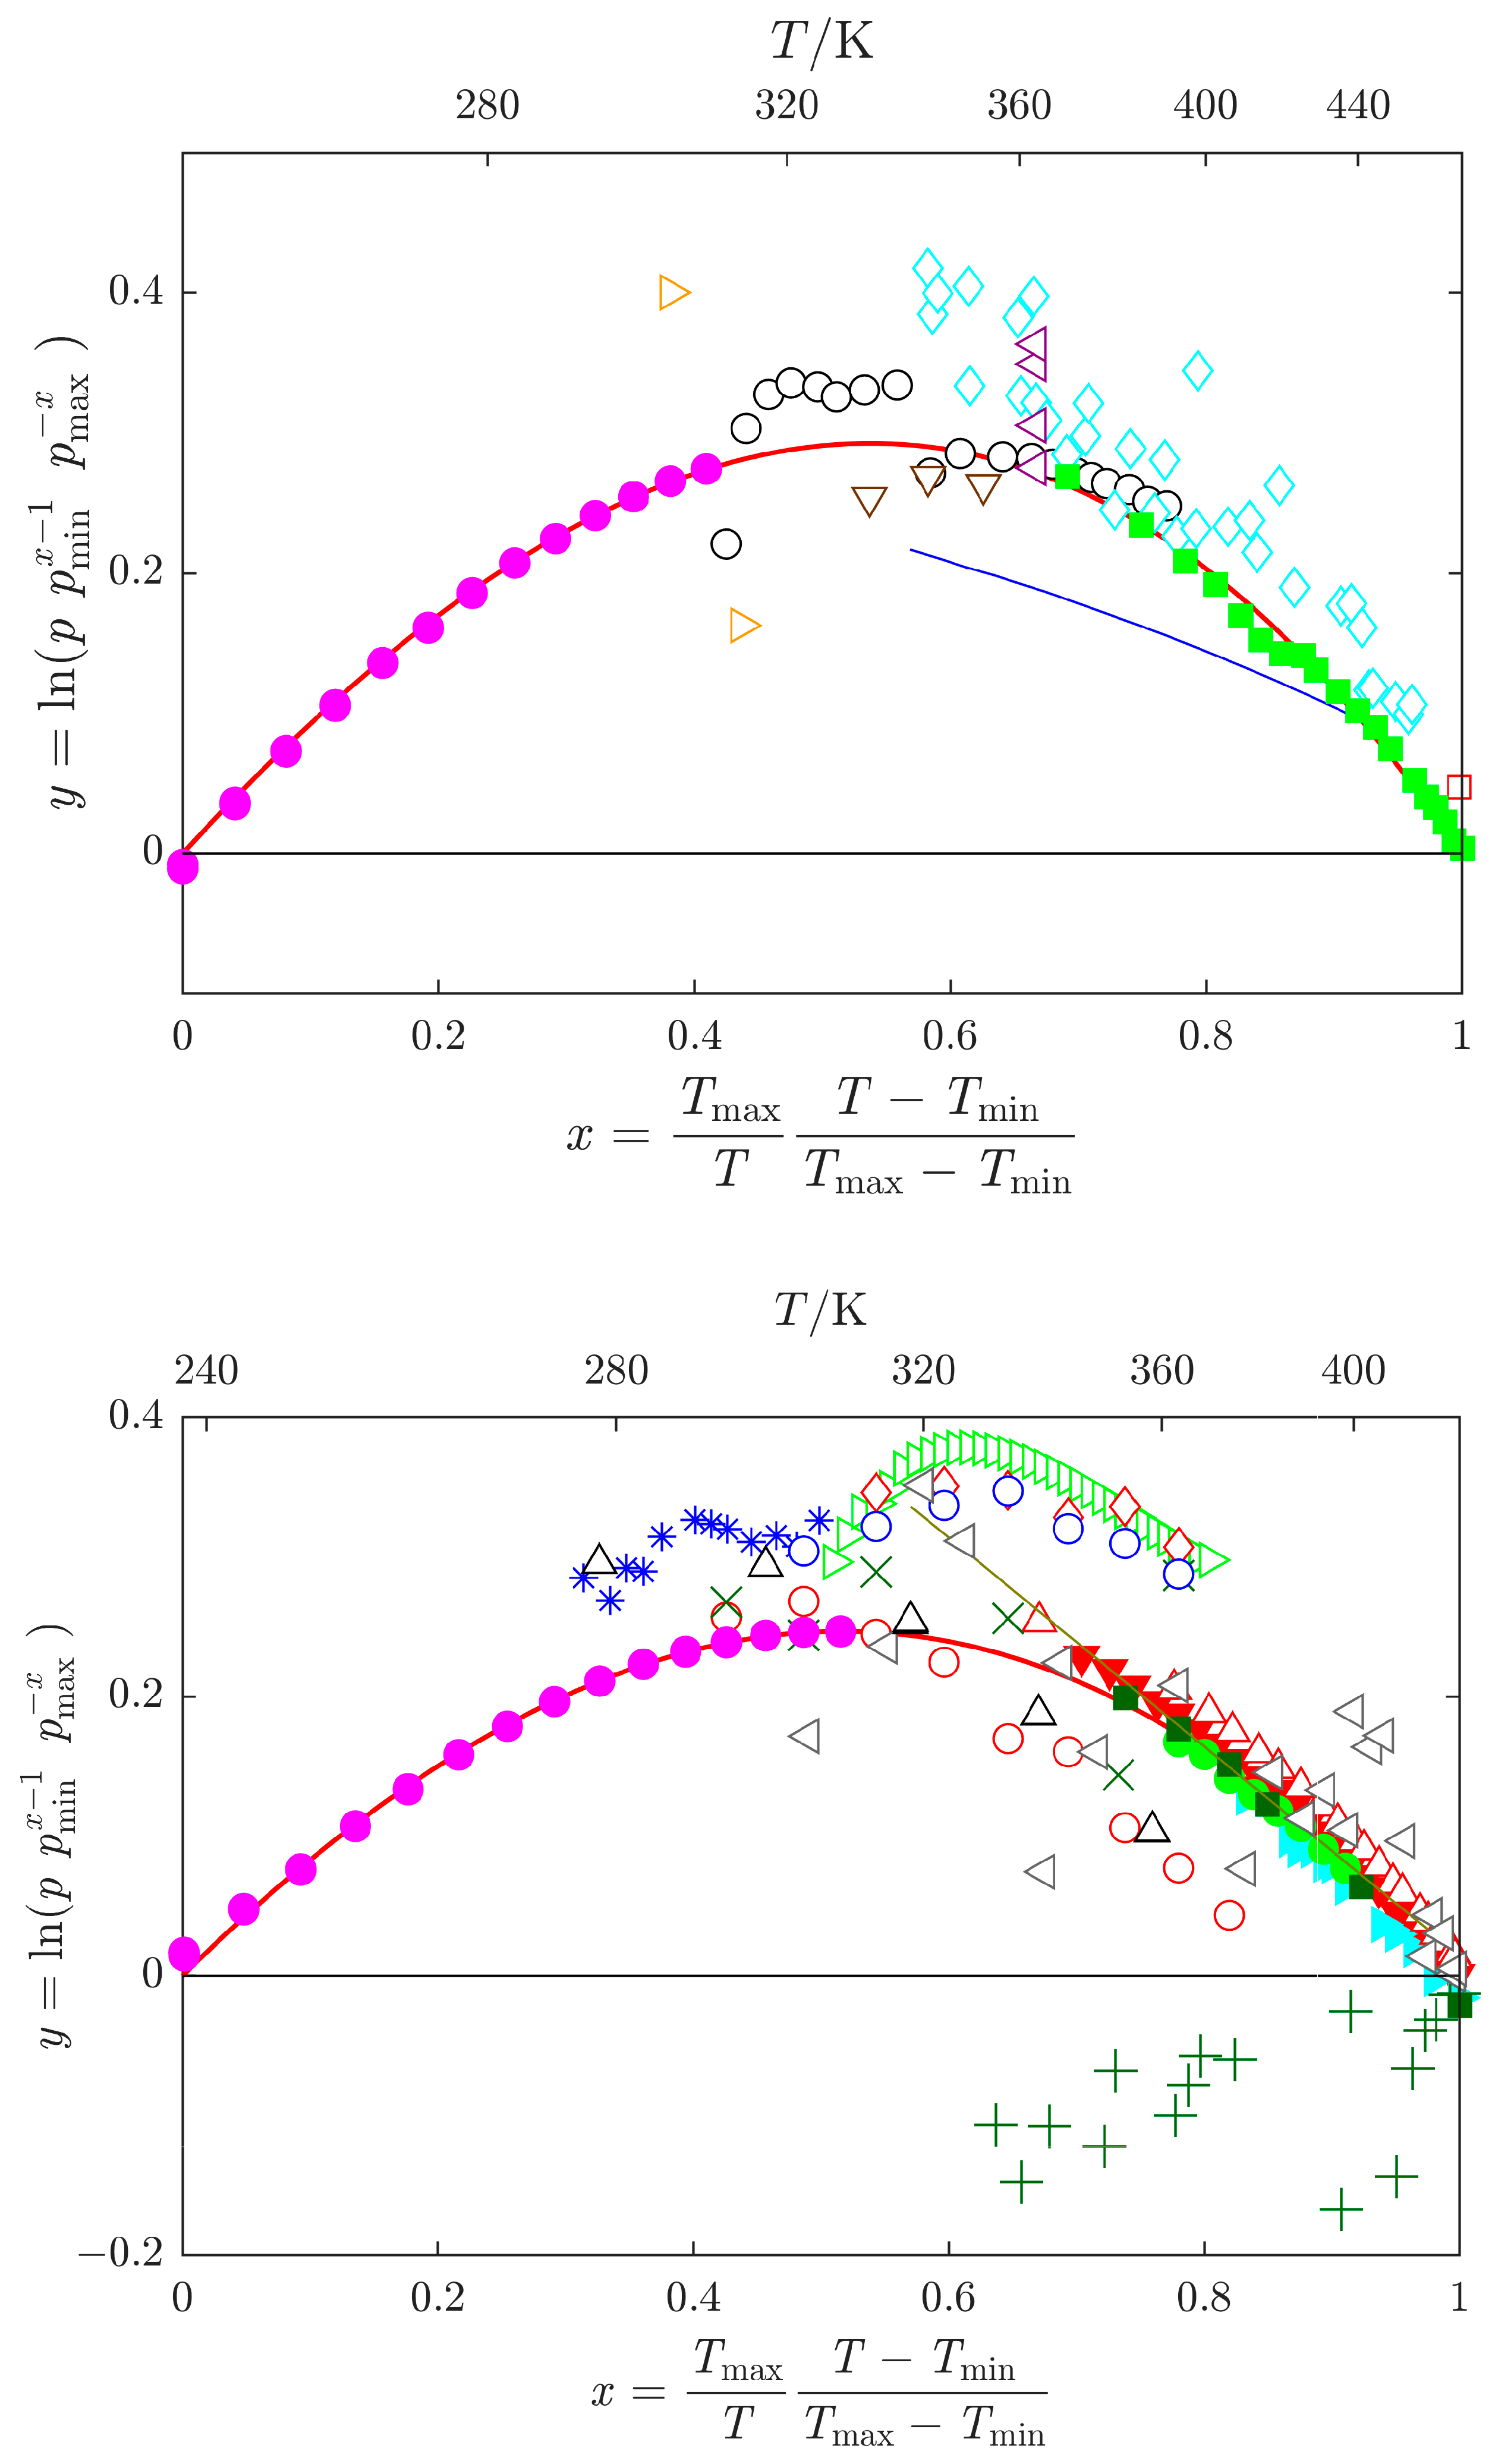 , this work; green , Heinrich et al. [13]; green , Shealy and Sandler [39]; cyan , Blanco et al. [43]; dark green , Wang et al. [44]; red , Muñoz et al. [45]. Other datasets: cyan , Kortüm and Biedersee [23]; black , Messow et al. [25]; blue , Ushakov et al. [26]; orange , Zielkiewicz [27,28,29]; violet , Harris et al. [30]; brown , Chen et al. [31]; red , Li et al. [32]; grey , Ivanova and Geller [33]; blue , Gopal et al. [34]; black , Quitzsch et al. [35]; dark green , Myasnikova et al. [36] (partially displayed); olive , Bludilina et al. [37]; red , Agarwal and Bapat [38]; olive , Wilding et al. [40]; red , Polishchuk et al. [41]; red , Marzal et al. [42]; green , Cui et al. [46]; blue , Zaitseva et al. [17];
  , absolute deviations.
, this work; green , Heinrich et al. [13]; green , Shealy and Sandler [39]; cyan , Blanco et al. [43]; dark green , Wang et al. [44]; red , Muñoz et al. [45]. Other datasets: cyan , Kortüm and Biedersee [23]; black , Messow et al. [25]; blue , Ushakov et al. [26]; orange , Zielkiewicz [27,28,29]; violet , Harris et al. [30]; brown , Chen et al. [31]; red , Li et al. [32]; grey , Ivanova and Geller [33]; blue , Gopal et al. [34]; black , Quitzsch et al. [35]; dark green , Myasnikova et al. [36] (partially displayed); olive , Bludilina et al. [37]; red , Agarwal and Bapat [38]; olive , Wilding et al. [40]; red , Polishchuk et al. [41]; red , Marzal et al. [42]; green , Cui et al. [46]; blue , Zaitseva et al. [17]; , absolute deviations.
, absolute deviations.
, this work; green , Heinrich et al. [13]; green , Shealy and Sandler [39]; cyan , Blanco et al. [43]; dark green , Wang et al. [44]; red , Muñoz et al. [45]. Other datasets: cyan , Kortüm and Biedersee [23]; black , Messow et al. [25]; blue , Ushakov et al. [26]; orange , Zielkiewicz [27,28,29]; violet , Harris et al. [30]; brown , Chen et al. [31]; red , Li et al. [32]; grey , Ivanova and Geller [33]; blue , Gopal et al. [34]; black , Quitzsch et al. [35]; dark green , Myasnikova et al. [36] (partially displayed); olive , Bludilina et al. [37]; red , Agarwal and Bapat [38]; olive , Wilding et al. [40]; red , Polishchuk et al. [41]; red , Marzal et al. [42]; green , Cui et al. [46]; blue , Zaitseva et al. [17]; , absolute deviations.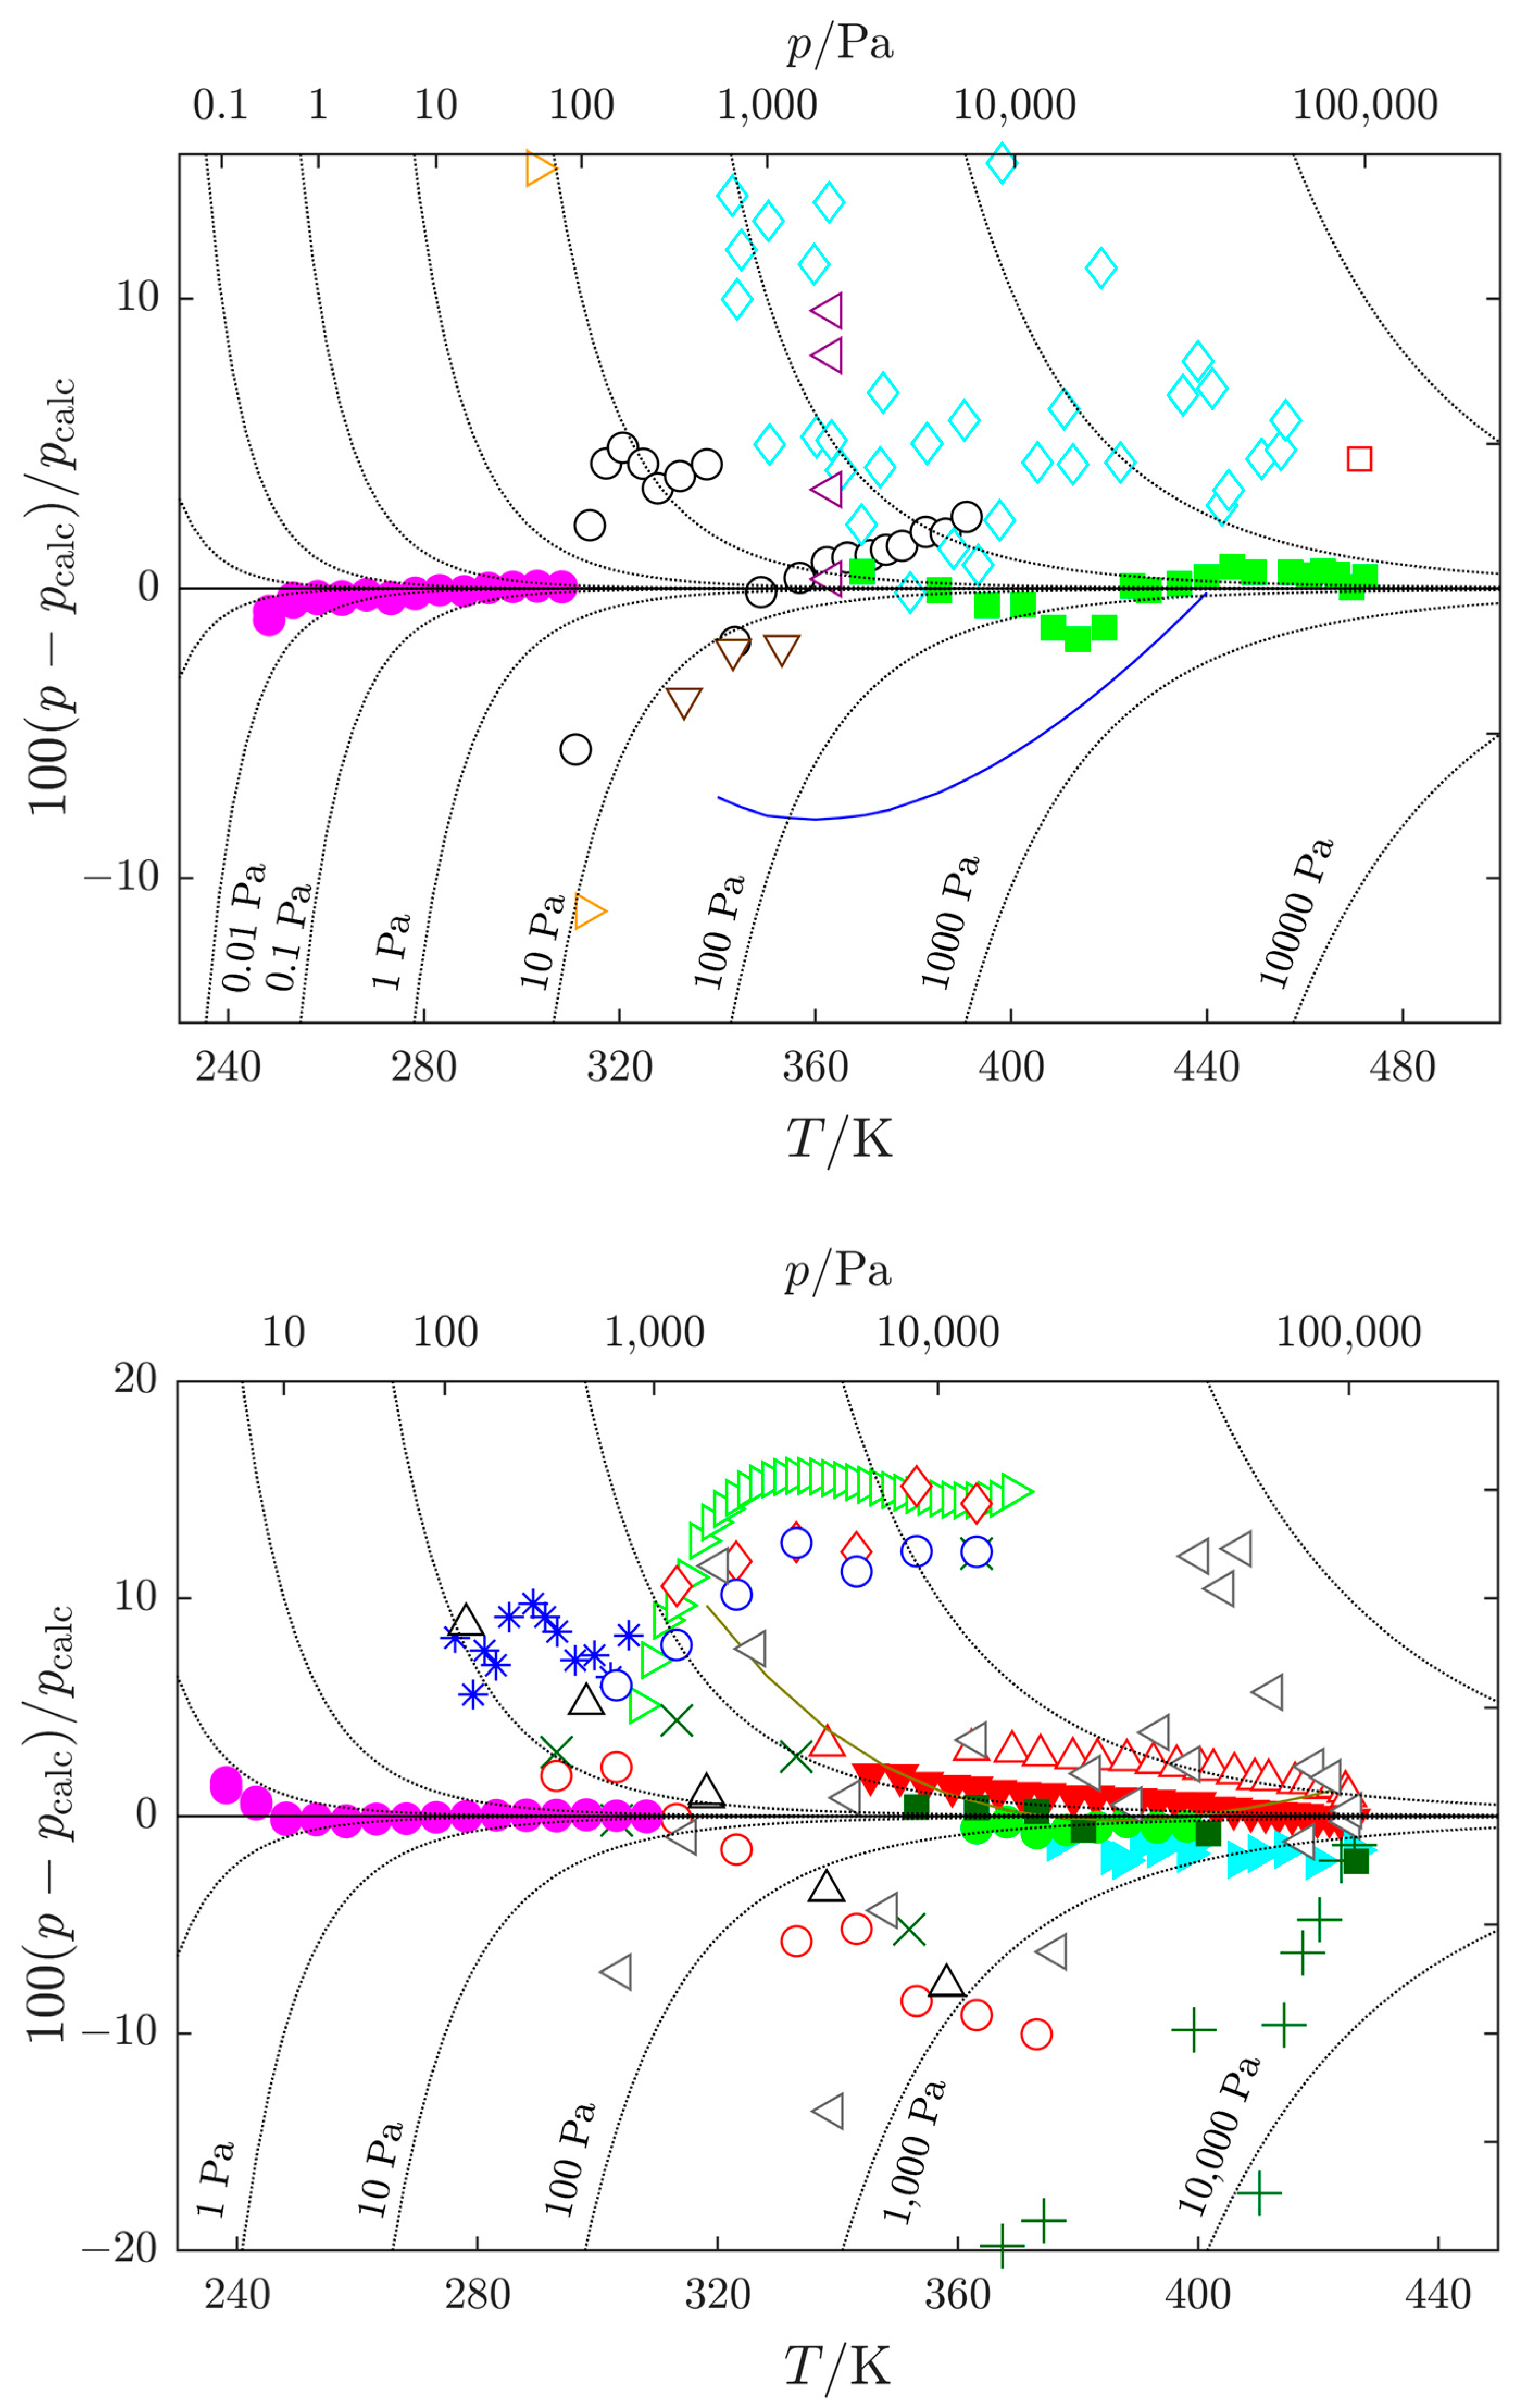
 , Barone et al. [16]; red , enthalpy of vaporization , and red
  , quantity (see Equation (S1) in the Supplementary Materials) obtained by the SimCor method. Datasets published by Barone et al. [16] were used in the SimCor method.
, Barone et al. [16]; red , enthalpy of vaporization , and red , quantity (see Equation (S1) in the Supplementary Materials) obtained by the SimCor method. Datasets published by Barone et al. [16] were used in the SimCor method.
, quantity (see Equation (S1) in the Supplementary Materials) obtained by the SimCor method. Datasets published by Barone et al. [16] were used in the SimCor method.
, Barone et al. [16]; red , enthalpy of vaporization , and red , quantity (see Equation (S1) in the Supplementary Materials) obtained by the SimCor method. Datasets published by Barone et al. [16] were used in the SimCor method.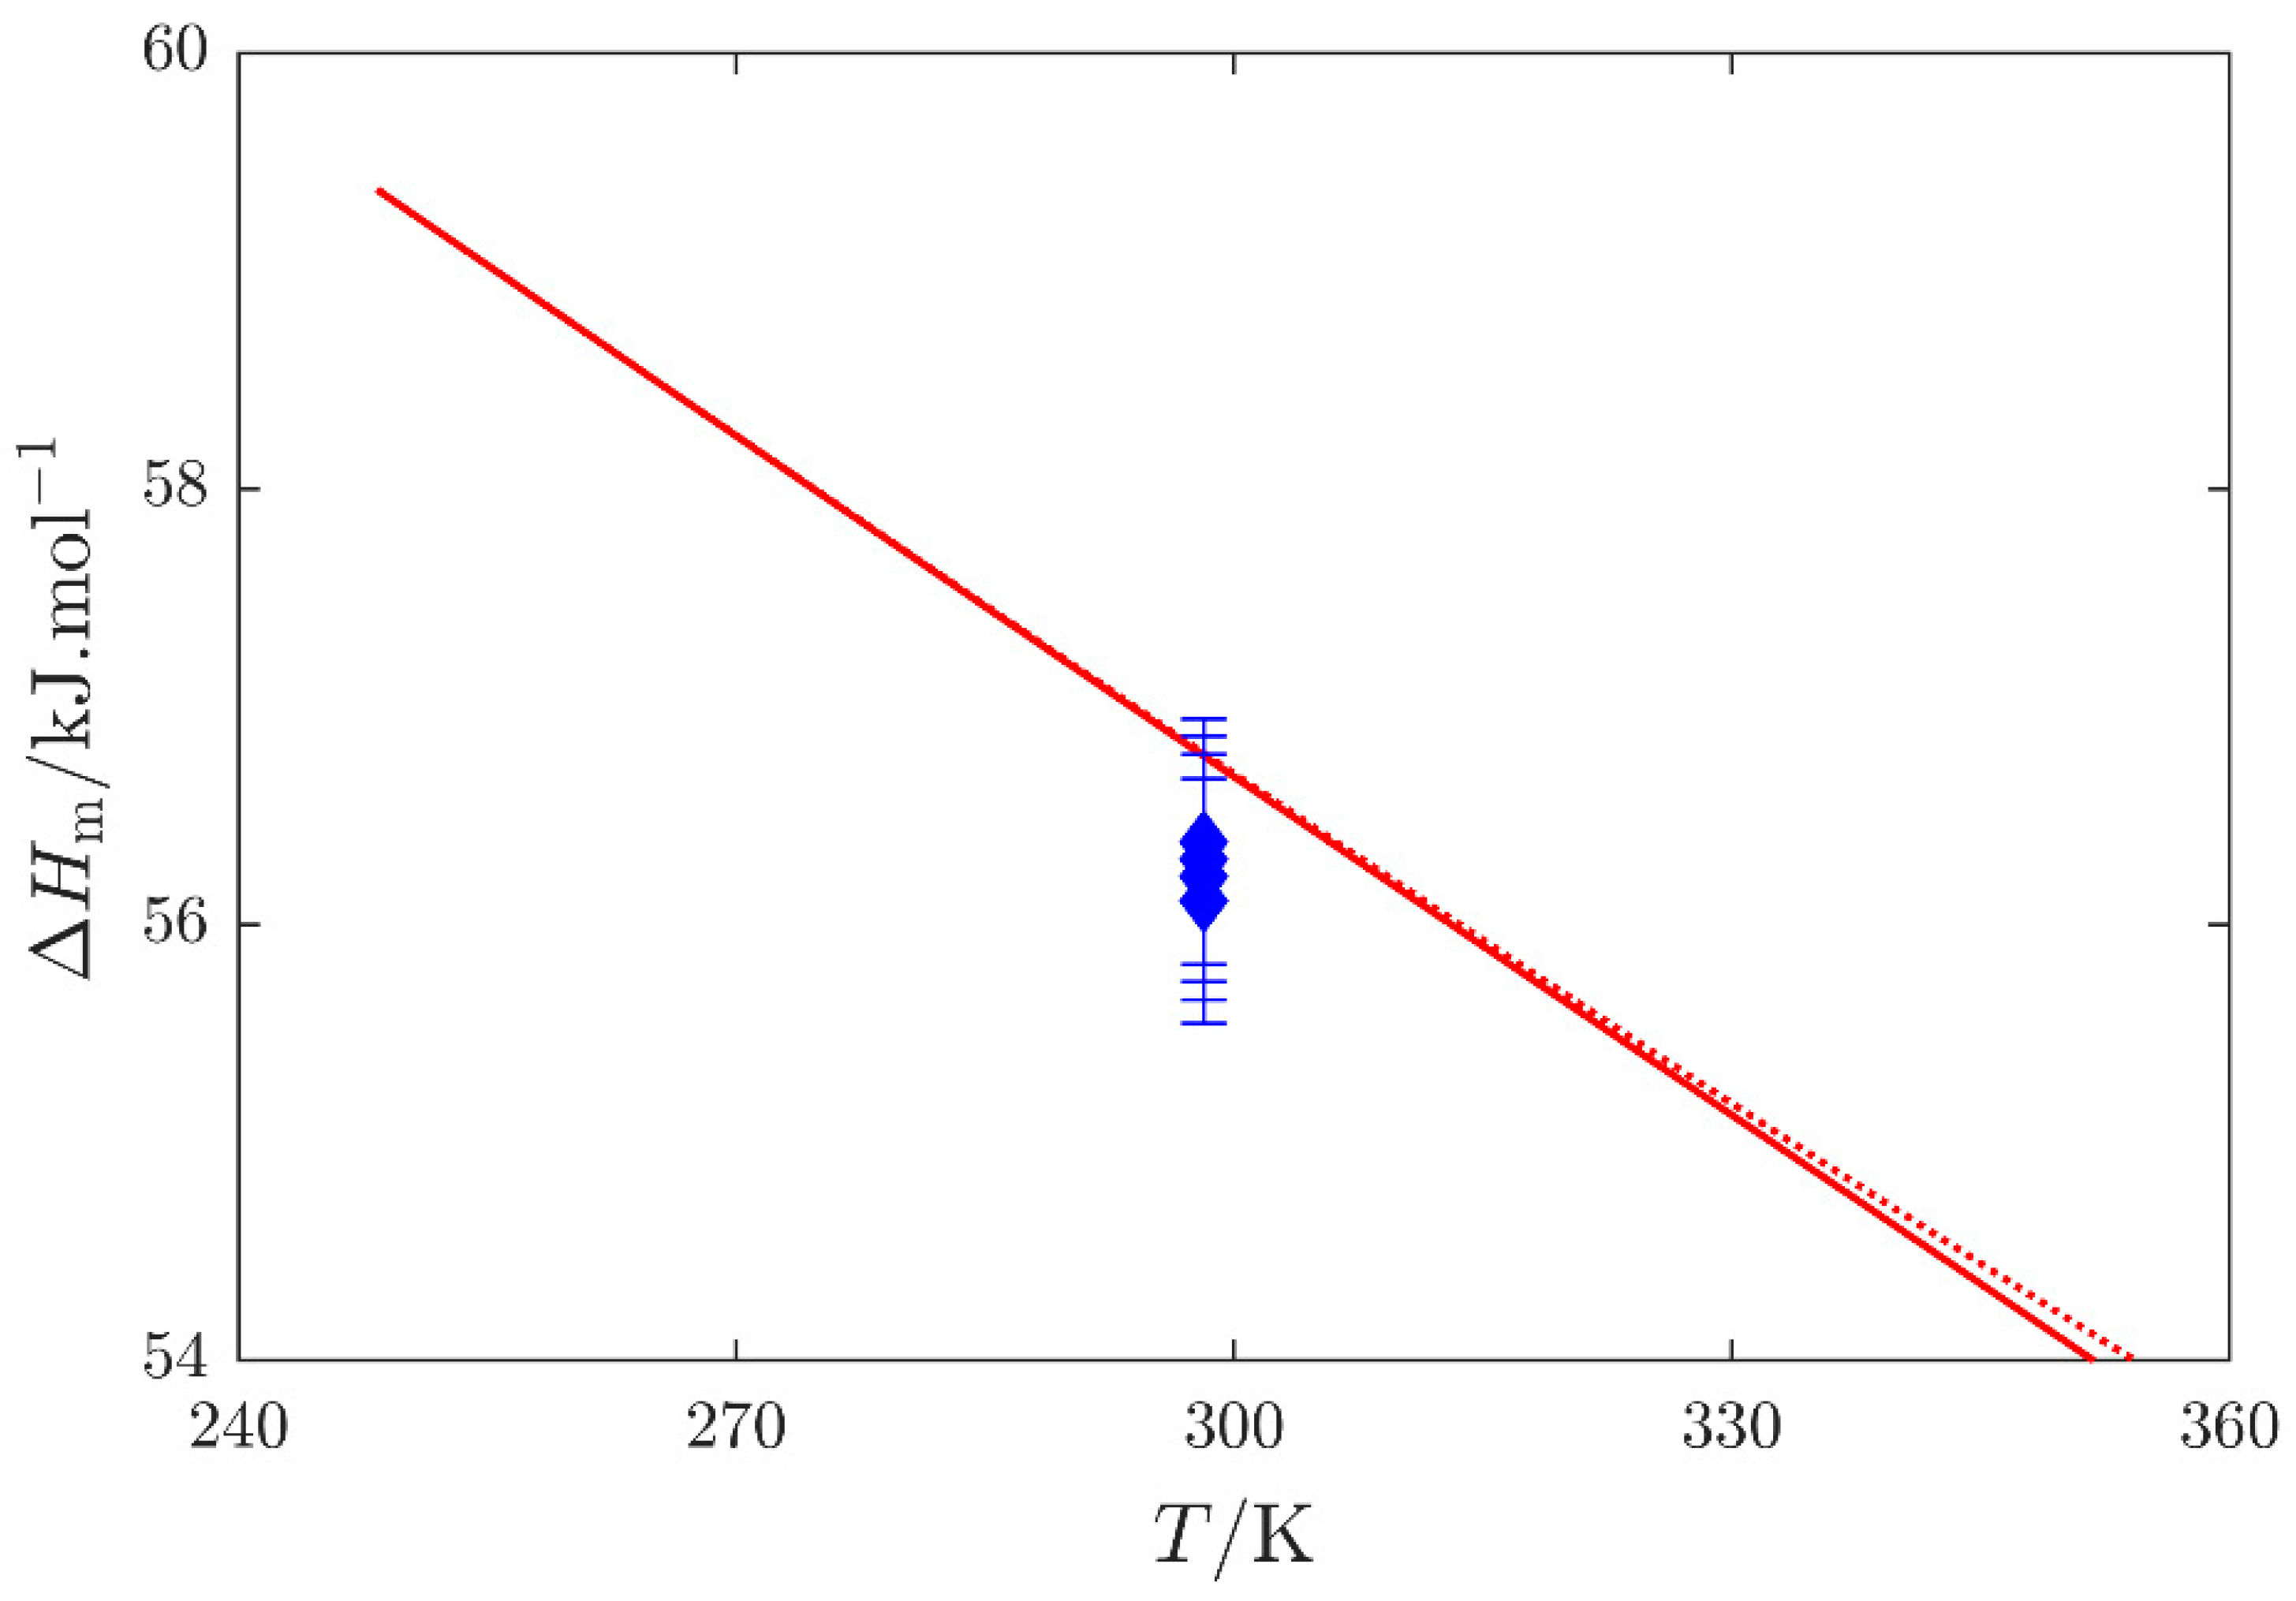
| Year | Reference a | N b | (Tmin − Tmax)/K | (pmin − pmax)/Pa | Method |
|---|---|---|---|---|---|
| N-methylformamide | |||||
| 1961 | Heinrich et al. [13] | 19 | 370–472 | 2653–100,405 | Ebulliometry |
| 1970 | Kortüm and Biedersee [23] | 33 | 343–456 | 773–101,000 | Ebulliometry |
| 1974 | Messow et al. [25] | 19 | 311–391 | 89–6920 | Isoteniscope |
| 1996 | Ushakov et al. [26] | S c | 340–440 | 532–39,312 | Static |
| 1996–1998 | Zielkiewicz [27,28,29] | 3 | 303,313 | 60–95 | Static |
| 2003 | Harris et al. [30] | 4 | 363 | 1950–2130 | Static |
| 2010 | Chen et al. [31] | 3 | 333–353 | 370–1150 | Static/dynamic |
| 2019 | Li et al. [32] | 1 | 471 | 101,325 | Ebulliometry |
| 2024 | This work | 39 | 248–308 | 0.3–75 | Static |
| N,N-dimethylformamide d | |||||
| 1961 | Ivanova and Geller [33] | 22 | 304–425 | 666–101,325 | Ramsay Young |
| 1968 | Gopal et al. [34] | 7 | 303–363 | 733–14,532 | Static |
| 1969 | Quitzsch et al. [35] | 5 | 278–358 | 141–9775 | Isoteniscope |
| 1974 | Myasnikova et al. [36] | 17 | 331–426 | 2266–101,325 | Ebulliometry |
| 1979 | Bludilina et al. [37] | S c | 318–423 | 1784–95,906 | Static |
| 1985 | Agarwal and Bapat [38] | 6 | 313–353 | 1366–14,818 | Static |
| 1985 | Shealy and Sandler [39] e | 8 | 363–398 | 11,900–44,740 | Ebulliometry |
| 1987 | Wilding et al. [40] | 6 | 293–363 | 380–14,520 | Static |
| 1988 | Polishchuk et al. [41] | 9 | 293–373 | 376–17,091 | Static |
| 1995 | Marzal et al. [42] | 20 | 338–425 | 4600–100,780 | Ebulliometry |
| 1997 | Blanco et al. [43] | 13 | 376–426 | 21,400–101,310 | Ebulliometry |
| 2001 | Wang et al. [44] | 6 | 353–426 | 8660–101,300 | Ebulliometry |
| 2005 | Muñoz et al. [45] | 26 | 346–426 | 6300–101,200 | Ebulliometry |
| 2006 | Cui et al. [46] | 32 | 307–369 | 922–18,806 | Static |
| 2019 | Zaitseva et al. [17] | 12 | 276–305 | 123–847 | Gas saturation |
| 2024 | This work | 45 | 238–308 | 4–930 | Static |
| T/K | p b/Pa | T/K | p b/Pa | T/K | p b/Pa |
|---|---|---|---|---|---|
| N-methylformamide | |||||
| 248.35 | 0.32 | 268.22 | 2.69 | 288.19 | 16.21 |
| 248.35 | 0.32 | 268.22 | 2.68 | 293.18 | 24.36 |
| 248.35 | 0.32 | 273.21 | 4.32 | 293.18 | 24.36 |
| 253.26 | 0.57 | 273.21 | 4.32 | 293.18 | 24.36 |
| 253.26 | 0.57 | 273.22 | 4.32 | 298.17 | 36.02 |
| 253.26 | 0.57 | 278.21 | 6.84 | 298.17 | 36.02 |
| 258.25 | 0.97 | 278.21 | 6.84 | 298.17 | 36.02 |
| 258.25 | 0.97 | 278.21 | 6.84 | 303.15 | 52.44 |
| 258.25 | 0.97 | 283.20 | 10.63 | 303.15 | 52.45 |
| 263.24 | 1.63 | 283.20 | 10.63 | 303.15 | 52.44 |
| 263.24 | 1.63 | 283.20 | 10.63 | 308.14 | 75.34 |
| 263.24 | 1.63 | 288.19 | 16.21 | 308.14 | 75.33 |
| 268.22 | 2.68 | 288.19 | 16.21 | 308.15 | 75.38 |
| N,N-dimethylformamide | |||||
| 238.15 | 3.85 | 263.15 | 39.95 | 288.15 | 264.71 |
| 238.16 | 3.84 | 263.15 | 39.96 | 288.15 | 264.77 |
| 238.16 | 3.84 | 263.15 | 39.96 | 288.15 | 264.85 |
| 243.15 | 6.39 | 268.15 | 60.26 | 293.15 | 369.48 |
| 243.16 | 6.39 | 268.15 | 60.27 | 293.15 | 369.48 |
| 243.16 | 6.39 | 268.15 | 60.26 | 293.16 | 369.49 |
| 248.15 | 10.37 | 273.15 | 89.36 | 298.15 | 508.91 |
| 248.15 | 10.38 | 273.15 | 89.37 | 298.15 | 508.93 |
| 248.15 | 10.38 | 273.15 | 89.37 | 298.15 | 508.74 |
| 253.15 | 16.60 | 278.15 | 130.35 | 303.15 | 691.81 |
| 253.15 | 16.59 | 278.15 | 130.33 | 303.15 | 691.79 |
| 253.15 | 16.59 | 278.15 | 130.35 | 303.15 | 691.83 |
| 258.15 | 25.97 | 283.15 | 187.19 | 308.15 | 930.12 |
| 258.15 | 25.99 | 283.15 | 187.20 | 308.15 | 929.99 |
| 258.15 | 25.98 | 283.15 | 187.17 | 308.16 | 929.99 |
| Compound | N-Methylformamide | N,N-Dimethylformamide | N,N-Dimethylformamide |
|---|---|---|---|
| Literature | Barone et al. [16] | Barone et al. [16] | Panneerselvam et al. [54] |
| Method | Calorimetry | Calorimetry | GLC |
| psat/kPa | 0.036 | 0.509 | 0.509 |
| exp. | 56.38 | 47.16 | 47.45 |
| 56.11 | 47.29 | 46.31 | |
| 56.22 | 46.21 | 46.80 | |
| 56.30 | 46.56 | ||
| 46.60 | |||
| avg. | 56.25 ± 0.12 | 46.89 ± 0.59 | 46.65 ± 0.45 |
| Mean rel. dev. | ±0.20% | ±1.26% | ±0.97% |
| N-Methylformamide | N,N-Dimethylformamide | |||||||
|---|---|---|---|---|---|---|---|---|
| T/K | ||||||||
| 100 | 42.5 | 234.6 | 38.6 | 196.0 | 53.6 | 242.7 | 40.4 | 202.3 |
| 150 | 49.2 | 253.0 | 40.9 | 212.2 | 65.4 | 266.8 | 46.9 | 219.9 |
| 200 | 56.3 | 268.1 | 43.5 | 224.6 | 74.5 | 286.9 | 52.7 | 234.2 |
| 210 | 57.8 | 270.9 | 44.1 | 226.8 | 76.2 | 290.5 | 53.8 | 236.8 |
| 220 | 59.3 | 273.6 | 44.7 | 229.0 | 77.9 | 294.1 | 54.8 | 239.3 |
| 230 | 60.8 | 276.3 | 45.2 | 231.1 | 79.6 | 297.6 | 55.8 | 241.8 |
| 240 | 62.4 | 278.9 | 45.8 | 233.1 | 81.3 | 301.0 | 56.9 | 244.2 |
| 250 | 63.9 | 281.5 | 46.4 | 235.1 | 83.1 | 304.4 | 57.9 | 246.5 |
| 250 | 63.9 | 281.5 | 46.4 | 235.1 | 83.1 | 304.4 | 57.9 | 246.5 |
| 260 | 65.5 | 284.0 | 47.0 | 237.0 | 84.8 | 307.7 | 58.9 | 248.8 |
| 270 | 67.1 | 286.5 | 47.6 | 238.9 | 86.7 | 310.9 | 59.9 | 251.1 |
| 273.15 | 67.6 | 287.2 | 47.8 | 239.4 | 87.2 | 311.9 | 60.2 | 251.7 |
| 280 | 68.7 | 289.0 | 48.2 | 240.7 | 88.5 | 314.1 | 60.9 | 253.2 |
| 290 | 70.3 | 291.4 | 48.9 | 242.5 | 90.4 | 317.3 | 61.9 | 255.4 |
| 298.15 | 71.6 | 293.3 | 49.4 | 243.9 | 91.9 | 319.7 | 62.6 | 257.1 |
| 300 | 71.9 | 293.8 | 49.5 | 244.3 | 92.3 | 320.4 | 62.8 | 257.5 |
| 310 | 73.5 | 296.2 | 50.2 | 246.0 | 94.2 | 323.4 | 63.8 | 259.6 |
| 320 | 75.1 | 298.5 | 50.8 | 247.7 | 96.2 | 326.4 | 64.8 | 261.6 |
| 330 | 76.7 | 300.8 | 51.5 | 249.4 | 98.2 | 329.4 | 65.8 | 263.6 |
| 340 | 78.4 | 303.2 | 52.1 | 251.0 | 100.2 | 332.4 | 66.8 | 265.6 |
| 350 | 80.0 | 305.4 | 52.8 | 252.6 | 102.2 | 335.3 | 67.8 | 267.6 |
| 360 | 81.6 | 307.7 | 53.5 | 254.2 | 104.2 | 338.2 | 68.7 | 269.5 |
| 370 | 83.2 | 310.0 | 54.2 | 255.8 | 106.2 | 341.1 | 69.7 | 271.4 |
| 380 | 84.7 | 312.2 | 54.9 | 257.3 | 108.3 | 344.0 | 70.7 | 273.3 |
| 390 | 86.3 | 314.4 | 55.6 | 258.8 | 110.3 | 346.8 | 71.7 | 275.1 |
| 400 | 87.9 | 316.6 | 56.3 | 260.3 | 112.3 | 349.6 | 72.7 | 276.9 |
| 500 | 102.4 | 337.8 | 63.5 | 274.3 | 131.9 | 376.8 | 82.6 | 294.2 |
| 600 | 115.0 | 357.5 | 70.6 | 286.9 | 149.6 | 402.5 | 92.3 | 310.1 |
| 700 | 125.8 | 376.0 | 77.4 | 298.6 | 165.0 | 426.7 | 101.6 | 325.1 |
| 800 | 135.0 | 393.4 | 83.8 | 309.6 | 178.3 | 449.6 | 110.4 | 339.2 |
| 900 | 142.9 | 409.8 | 89.8 | 320.0 | 189.8 | 471.3 | 118.6 | 352.7 |
| 1000 | 149.8 | 425.2 | 95.3 | 329.9 | 199.7 | 491.8 | 126.2 | 365.6 |
| Compound | A0 | A1·103 | A2·106 | Tref/K | pref/Pa a | (Tmin – Tmax)/K | σp/Pa b |
|---|---|---|---|---|---|---|---|
| N-Methylformamide | 2.855705 ±0.001252 | −1.067282 ±0.010432 | 0.795317 ±0.025846 | 472.346 ±0.090 | 100,000 | 248–473 | 152 |
| N,N-Dimethylformamide | 2.852686 ±0.000935 | −1.597511 ±0.008325 | 1.572920 ±0.020373 | 425.101 ±0.026 | 100,000 | 215–427 | 441 |
| Compound | CAS Number | Supplier | Purification Method | Mole Fraction Purity | Mass Fraction Water Content |
|---|---|---|---|---|---|
| N-Methylformamide | 123-39-7 | Aldrich | Distillation, molecular sieves | 0.988 a; 0.9990 b | 30·10−6 d |
| N,N-Dimethylformamide | 68-12-2 | Aldrich | Vapor pressure measurements | 0.9999 a; 1.0000 b,c | 30·10−6 e |
Disclaimer/Publisher’s Note: The statements, opinions and data contained in all publications are solely those of the individual author(s) and contributor(s) and not of MDPI and/or the editor(s). MDPI and/or the editor(s) disclaim responsibility for any injury to people or property resulting from any ideas, methods, instructions or products referred to in the content. |
© 2024 by the authors. Licensee MDPI, Basel, Switzerland. This article is an open access article distributed under the terms and conditions of the Creative Commons Attribution (CC BY) license (https://creativecommons.org/licenses/by/4.0/).
Share and Cite
Růžička, K.; Štejfa, V.; Červinka, C.; Fulem, M.; Šturala, J. Thermodynamic Study of N-Methylformamide and N,N-Dimethyl-Formamide. Molecules 2024, 29, 1110. https://doi.org/10.3390/molecules29051110
Růžička K, Štejfa V, Červinka C, Fulem M, Šturala J. Thermodynamic Study of N-Methylformamide and N,N-Dimethyl-Formamide. Molecules. 2024; 29(5):1110. https://doi.org/10.3390/molecules29051110
Chicago/Turabian StyleRůžička, Květoslav, Vojtěch Štejfa, Ctirad Červinka, Michal Fulem, and Jiří Šturala. 2024. "Thermodynamic Study of N-Methylformamide and N,N-Dimethyl-Formamide" Molecules 29, no. 5: 1110. https://doi.org/10.3390/molecules29051110
APA StyleRůžička, K., Štejfa, V., Červinka, C., Fulem, M., & Šturala, J. (2024). Thermodynamic Study of N-Methylformamide and N,N-Dimethyl-Formamide. Molecules, 29(5), 1110. https://doi.org/10.3390/molecules29051110