
Comparative Conformational Analysis of Acyclic Sugar Alcohols Ribitol, Xylitol and d-Arabitol by Solution NMR and Molecular Dynamics Simulations


Abstract
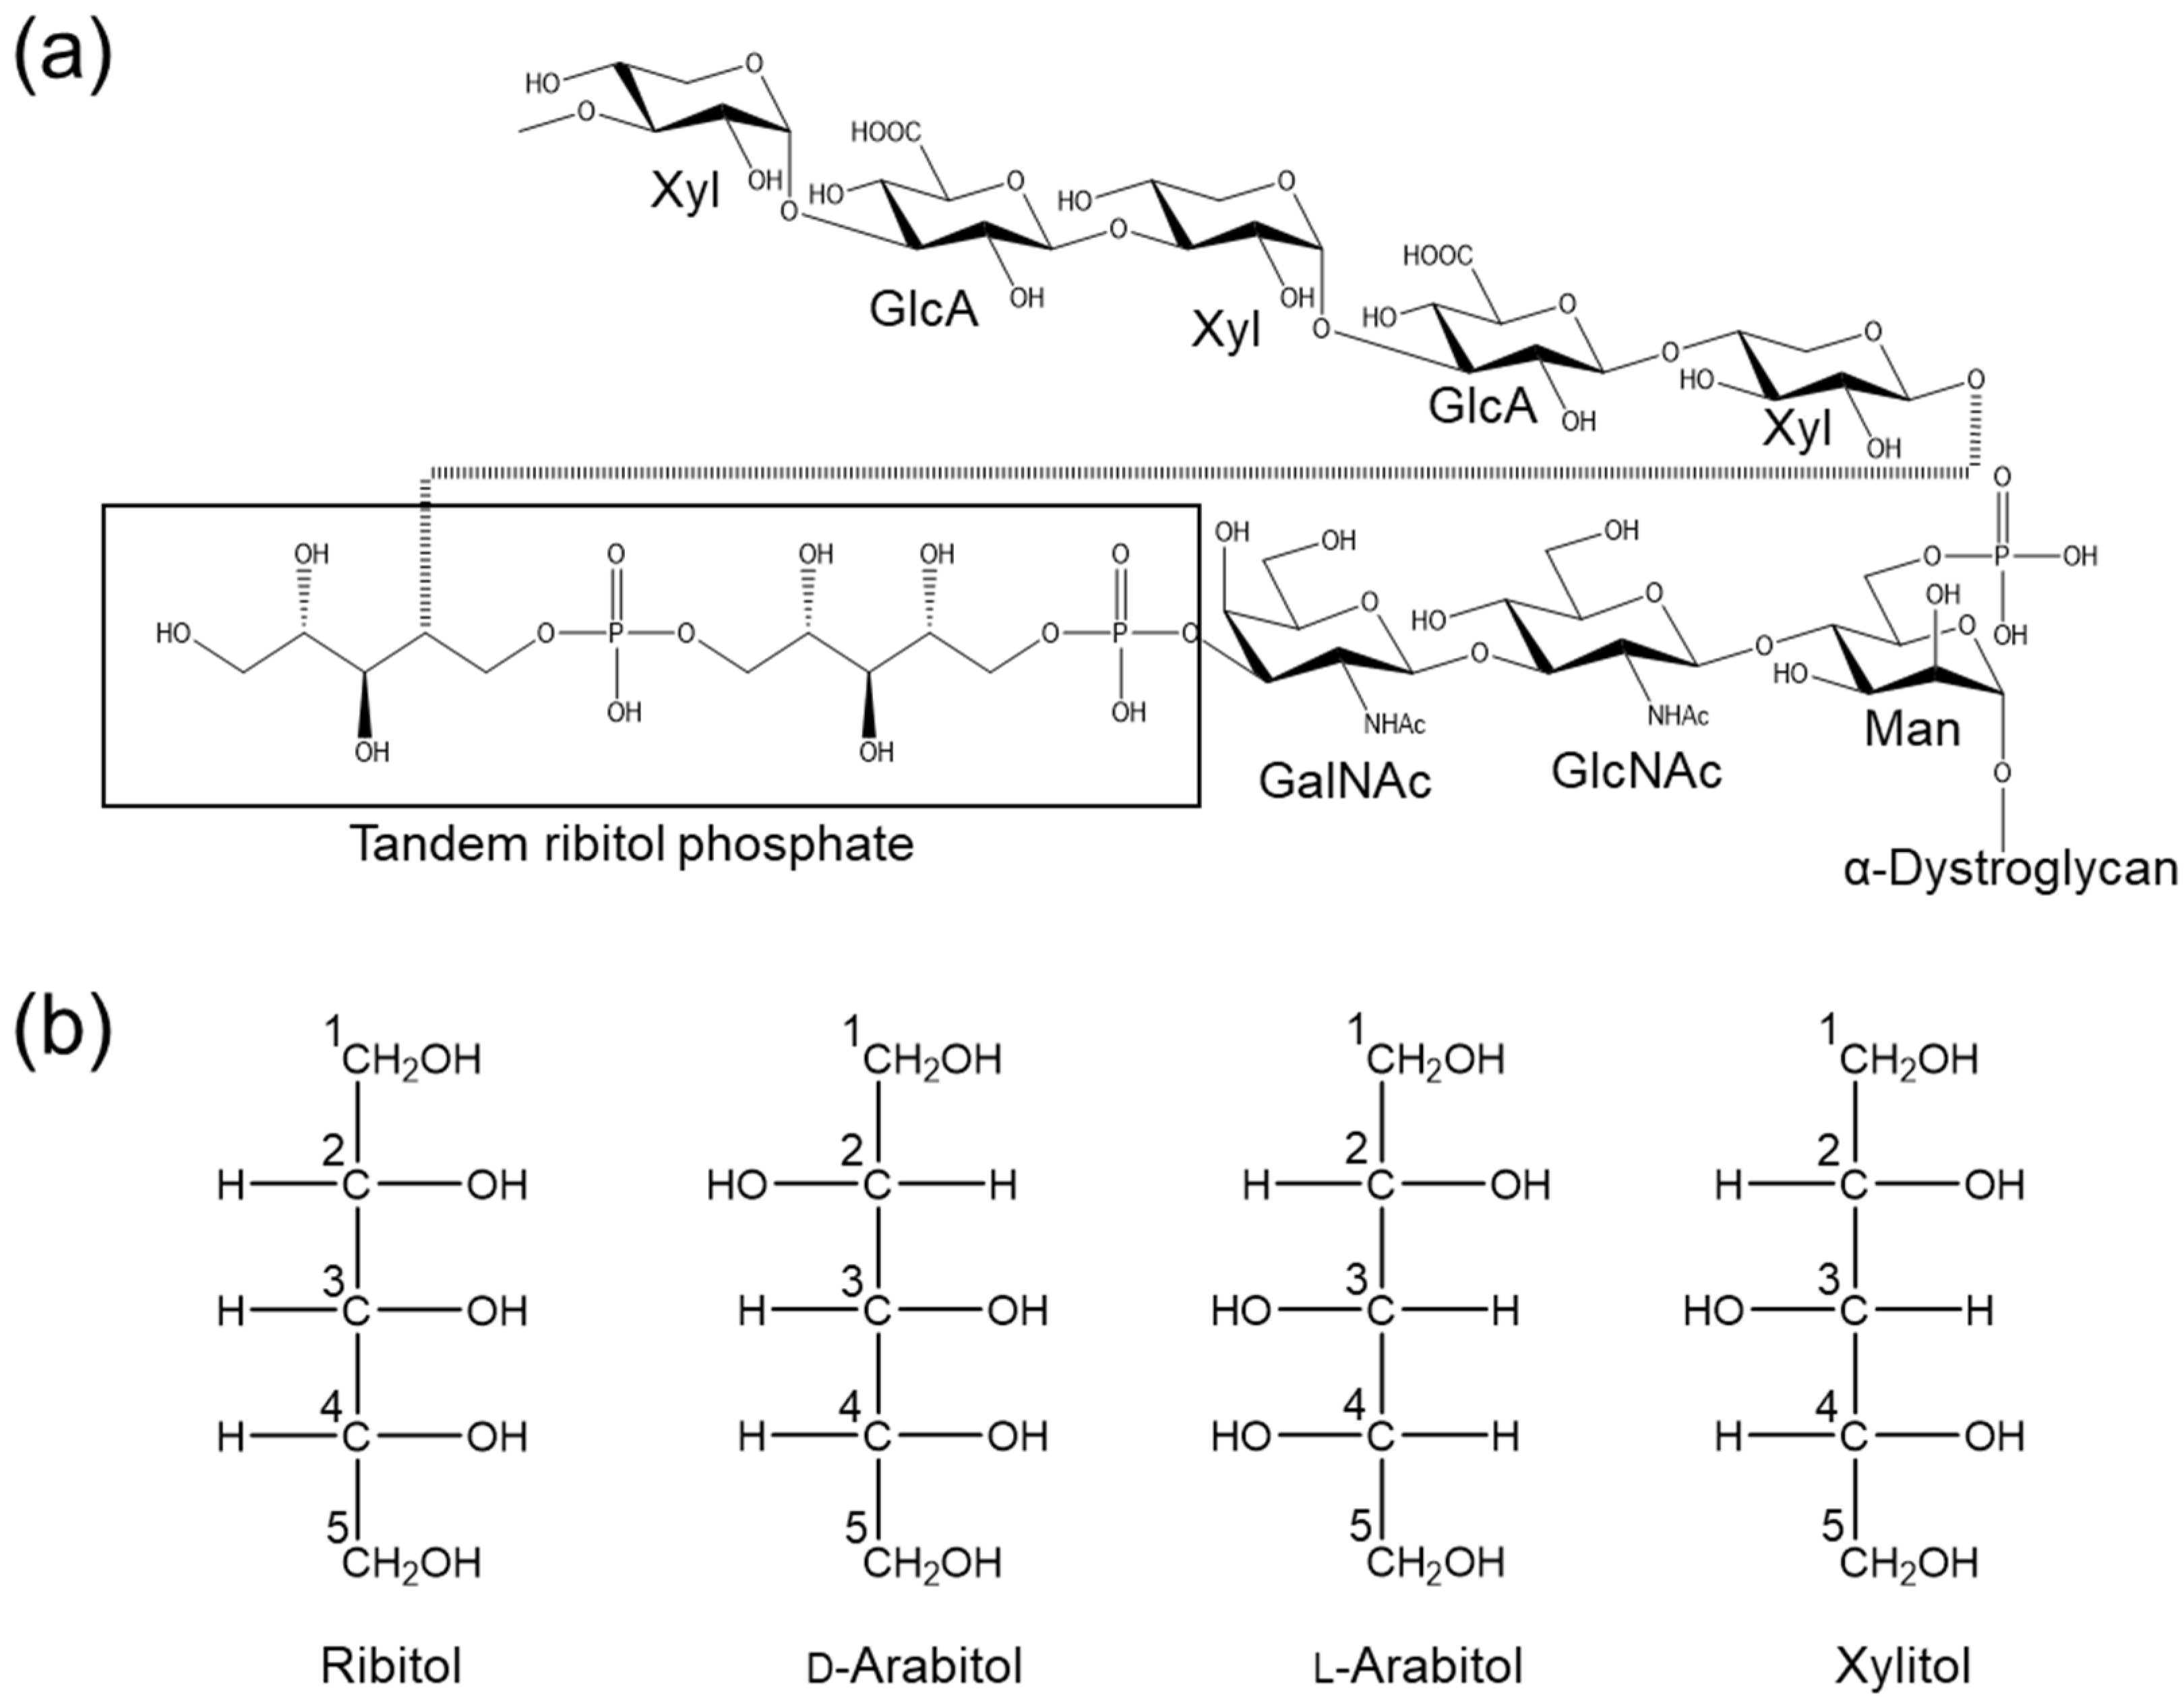
1. Introduction
2. Results and Discussion
2.1. Database Analysis of d-Arabitol and Xylitol
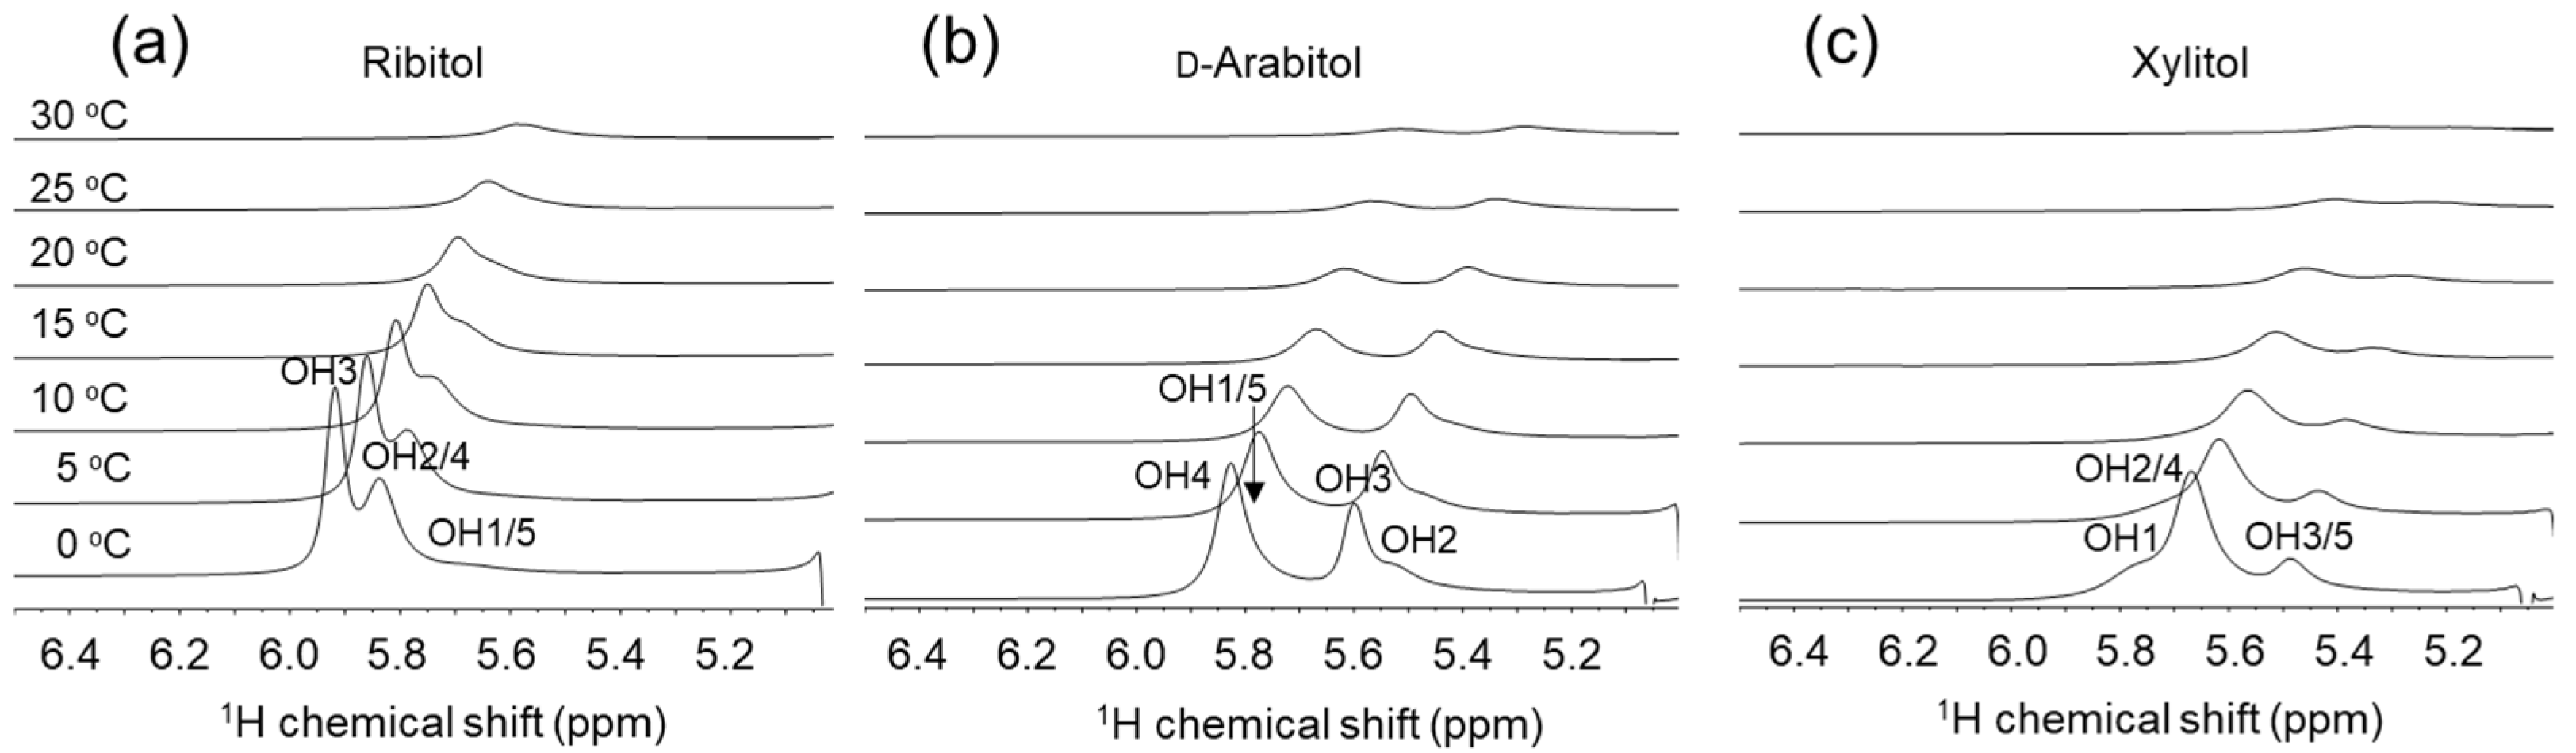
2.2. NMR Analysis of Ribitol and Its Stereoisomers
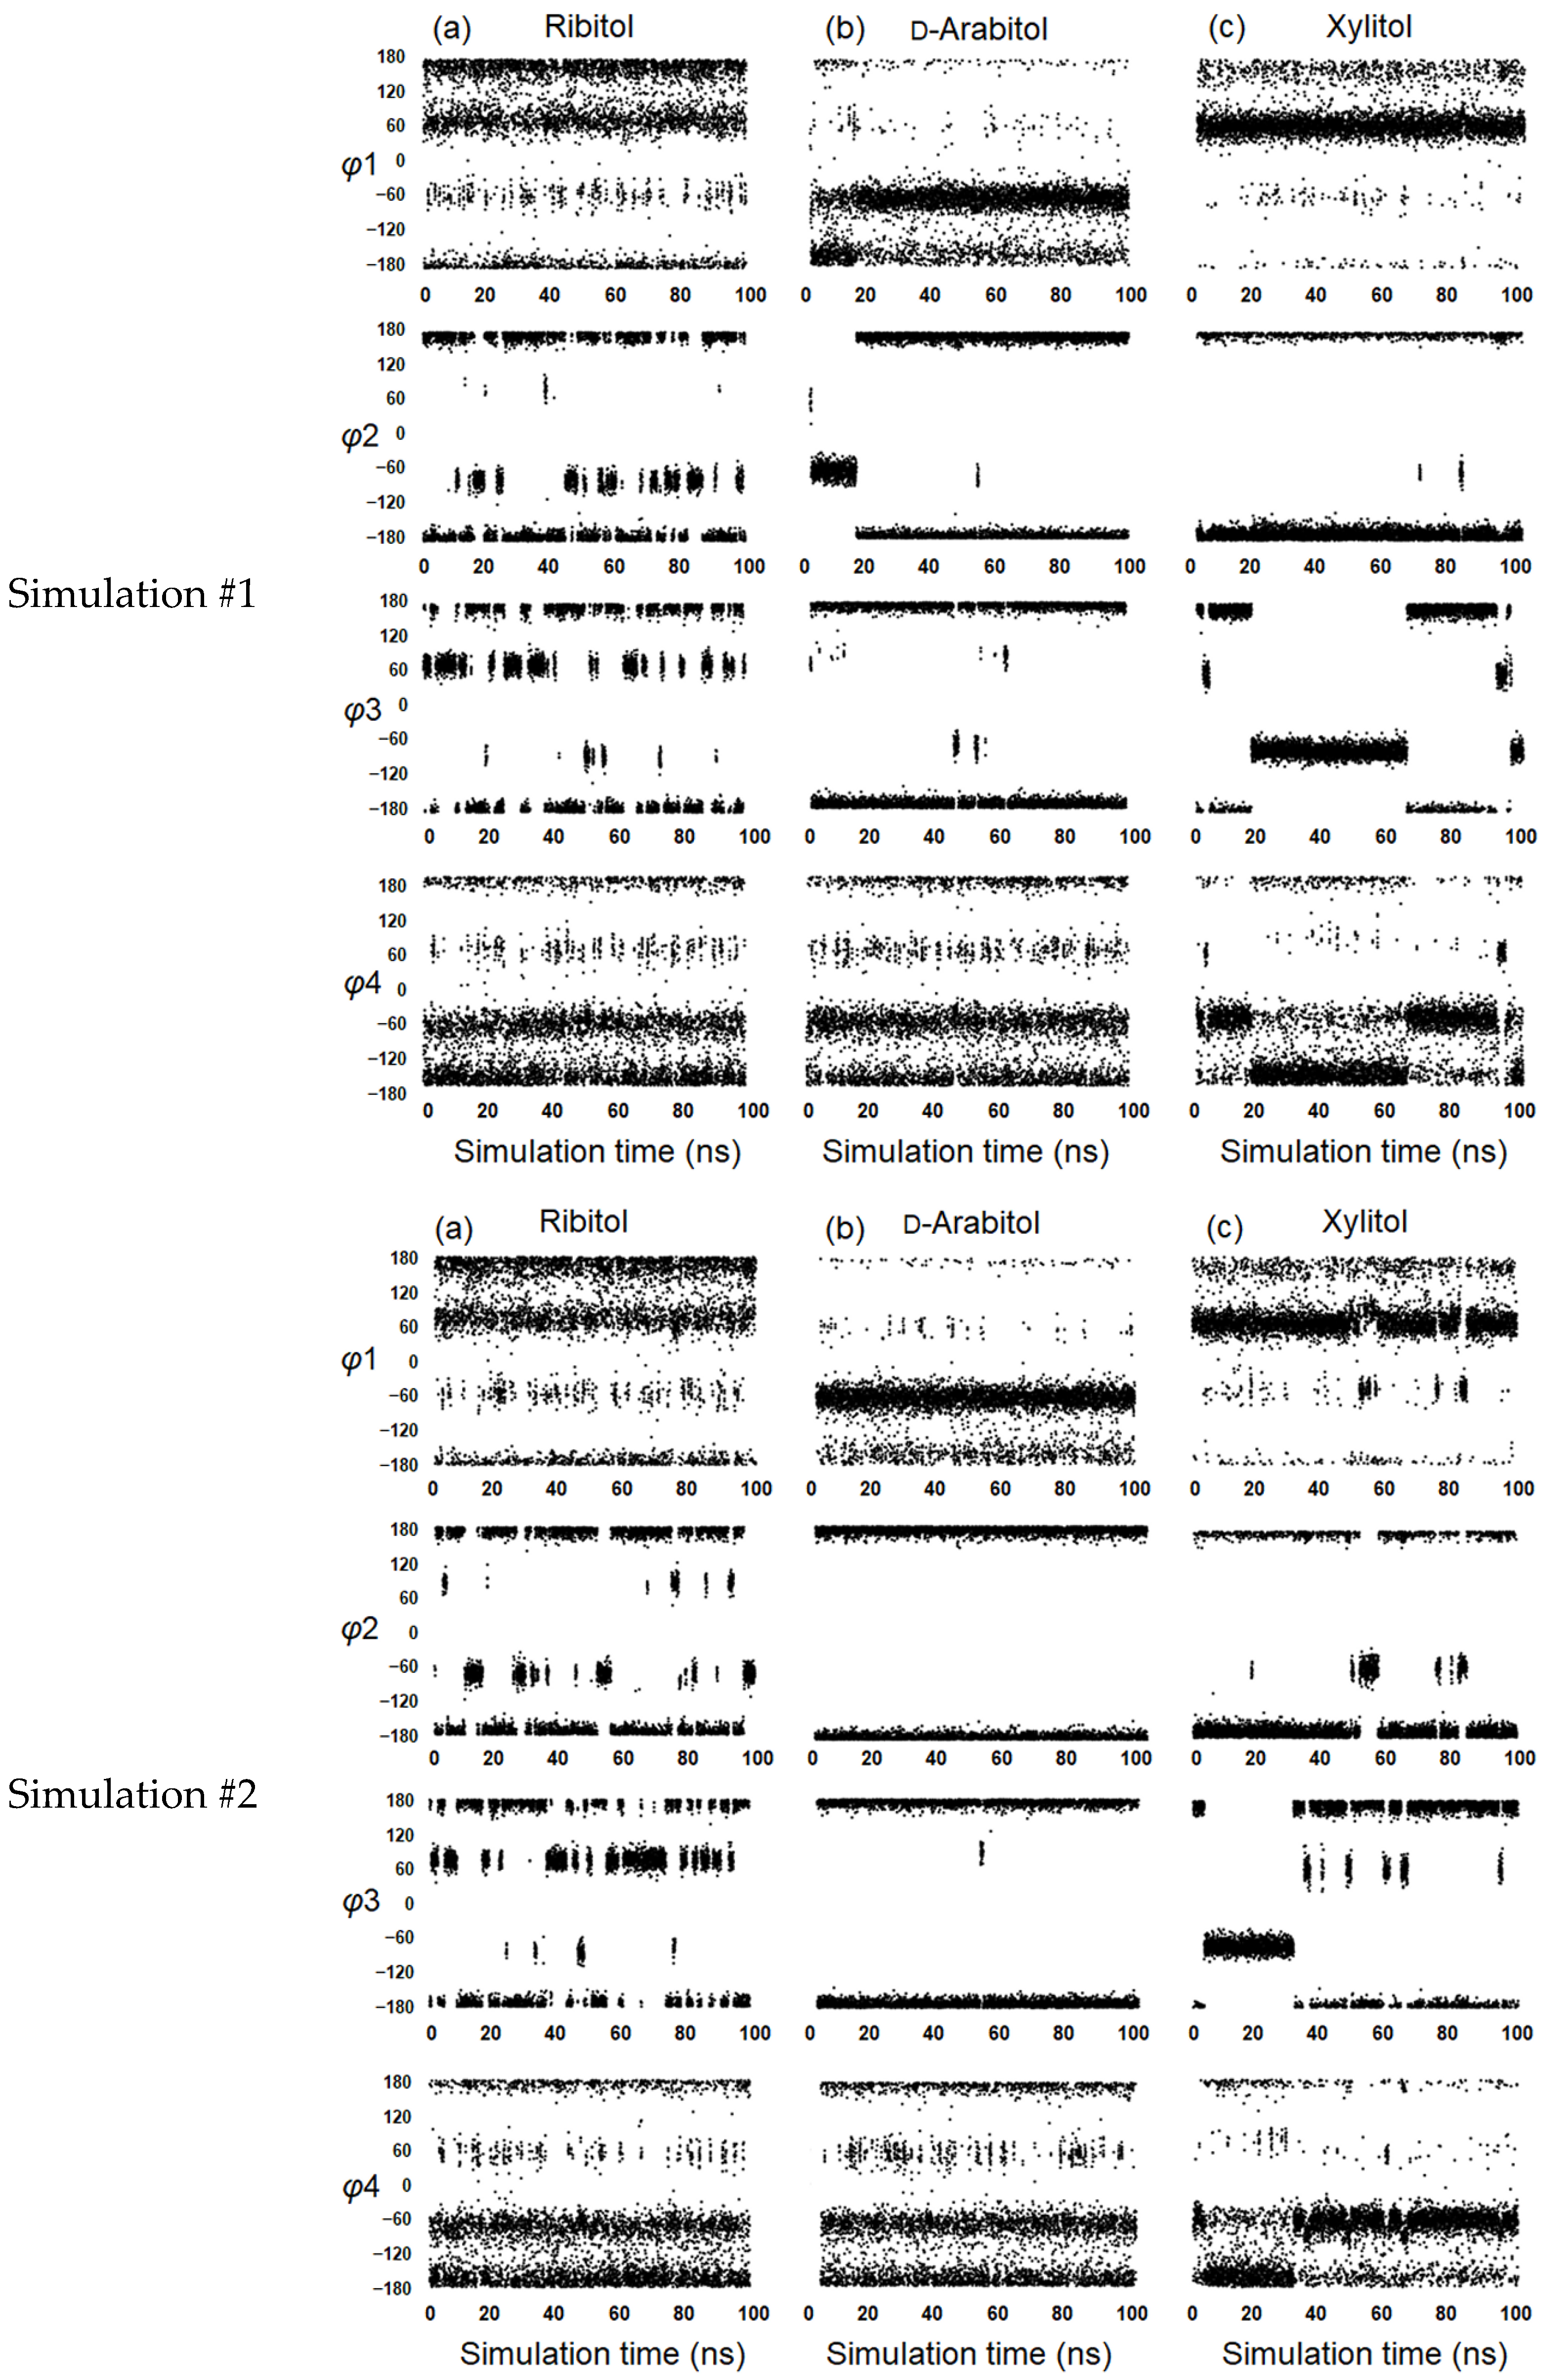
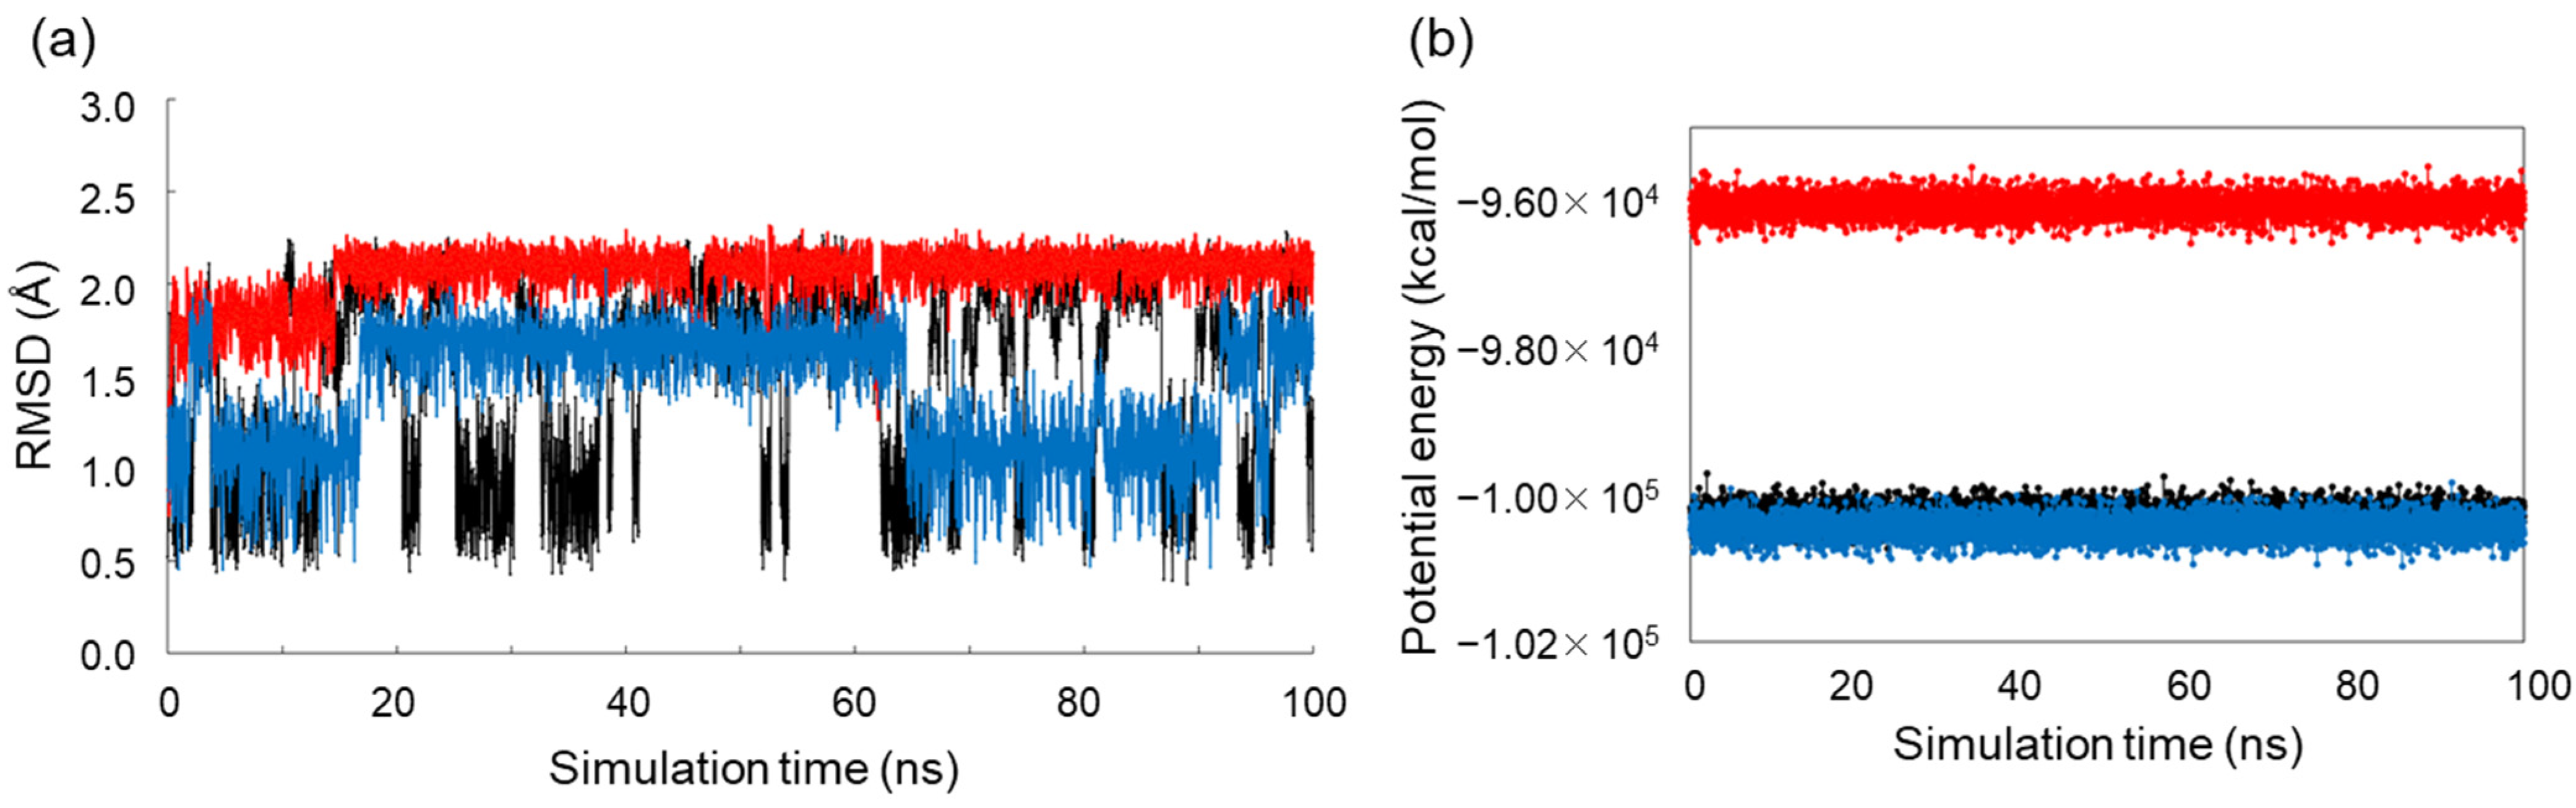
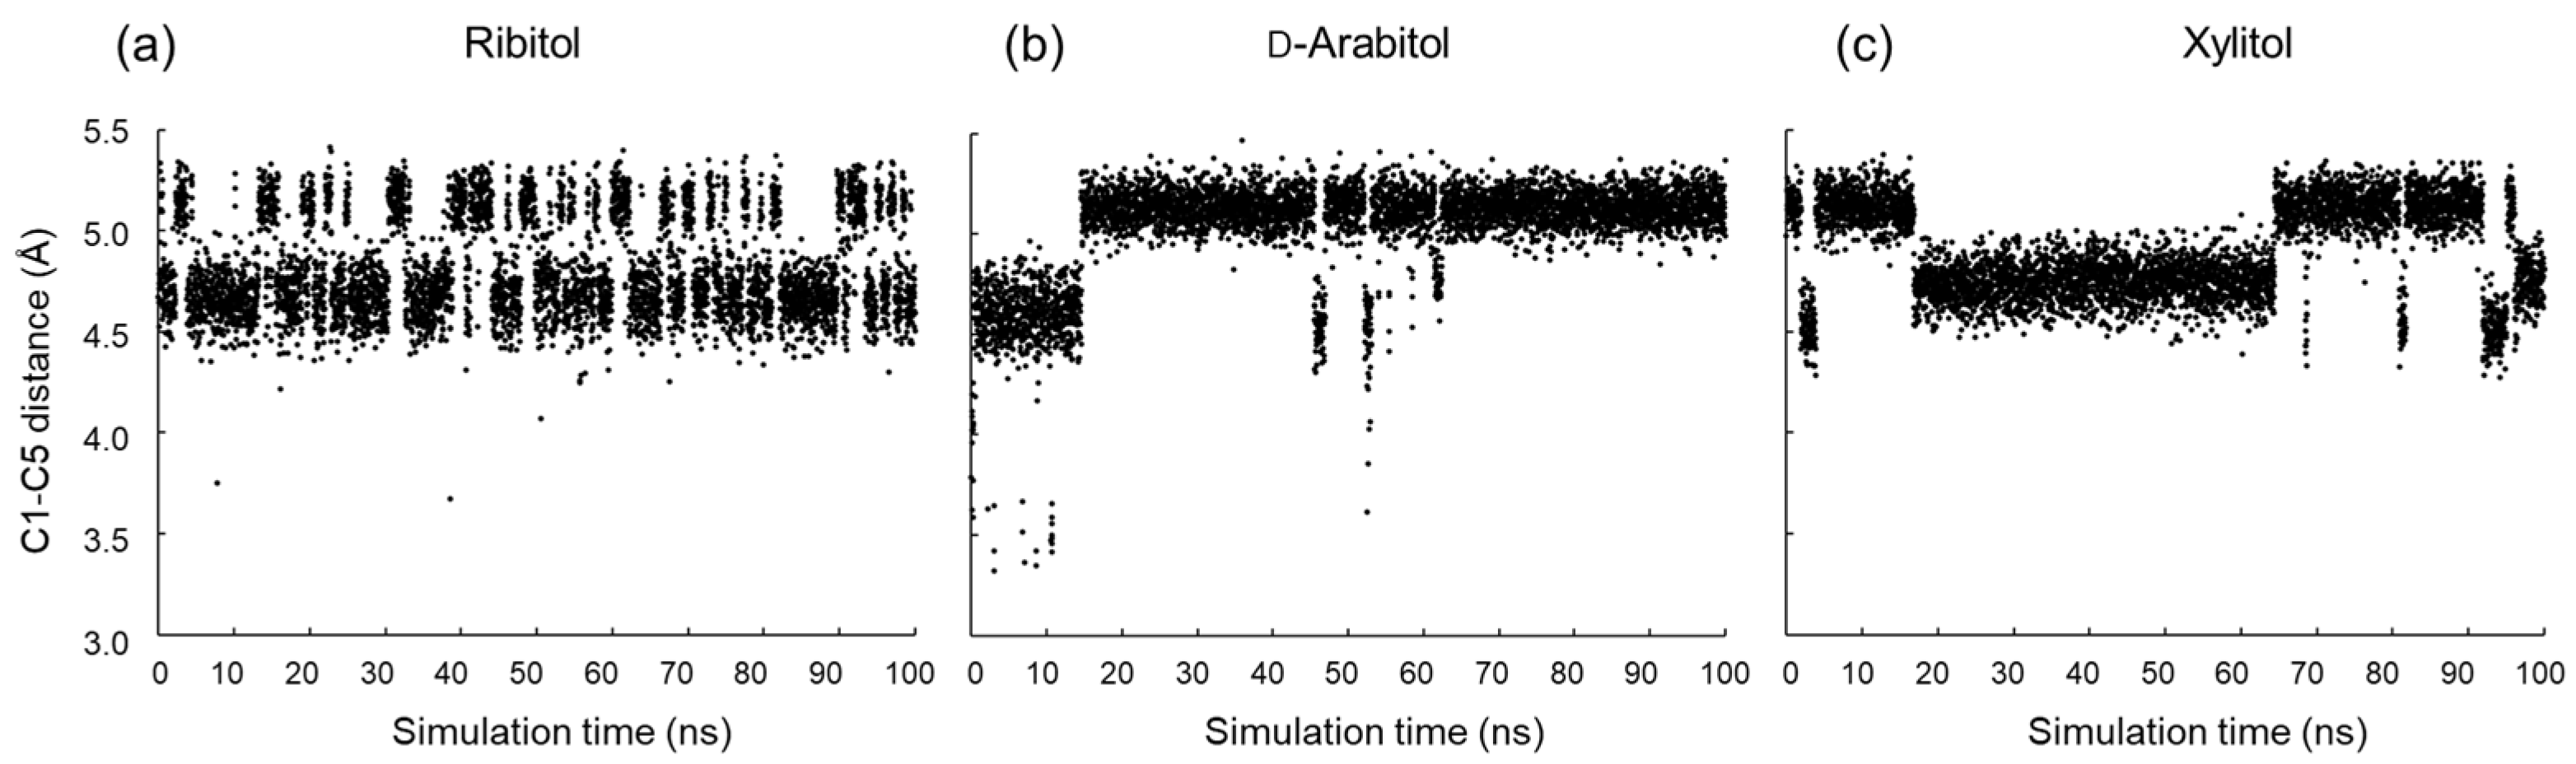
2.3. Conformational Analysis of Alditols by Molecular Dynamics Simulation
3. Materials and Methods
3.1. Database Analysis
3.2. MD Simulations
3.3. Solution NMR Analysis
Author Contributions
Funding
Institutional Review Board Statement
Informed Consent Statement
Data Availability Statement
Acknowledgments
Conflicts of Interest
References
- Endo, T. Mammalian O-mannosyl glycans: Biochemistry and glycopathology. Proc. Jpn. Acad. Ser. B Phys. Biol. Sci. 2019, 95, 39–51. [Google Scholar] [CrossRef] [PubMed]
- Yamamoto, I.; Jordan, M.J.; Gavande, N.; Doddareddy, M.R.; Chebib, M.; Hunter, L. The enantiomers of syn-2,3-difluoro-4-aminobutyric acid elicit opposite responses at the GABA(C) receptor. Chem. Commun. 2012, 48, 829–831. [Google Scholar] [CrossRef] [PubMed]
- Ohno, S.; Manabe, N.; Yamaguchi, T.; Uzawa, J.; Yamaguchi, Y. Ribitol in Solution Is an Equilibrium of Asymmetric Conformations. Molecules 2021, 26, 5471. [Google Scholar] [CrossRef] [PubMed]
- Kim, H.S.; Jeffrey, G.A.; Rosenstein, R.D. The crystal structure of ribitol. Acta Cryst. Sect. B 1969, 25, 2223–2230. [Google Scholar] [CrossRef]
- Madsen, A.Ø.; Larsen, S. Insight into Solid-State Entropy from Diffraction Data. Angew. Chem. Int. Ed. 2007, 46, 8609–8613. [Google Scholar] [CrossRef] [PubMed]
- Madsen, A.Ø.; Mattson, R.; Larsen, S. Understanding Thermodynamic Properties at the Molecular Level: Multiple Temperature Charge Density Study of Ribitol and Xylitol. J. Phys. Chem. 2011, 115, 7794–7804. [Google Scholar] [CrossRef]
- Hunter, F.D.; Rosenstein, R.D. The crystal structure of D,L-arabinitol. Acta Cryst. Sect. B 1968, 24, 1652–1660. [Google Scholar] [CrossRef]
- Kopf, J.; Morf, M.; Zimmer, B.; Köll, P. Kristall- und molekülstruktur von D-arabinitol. Carbohydr. Res. 1991, 218, 9–13. [Google Scholar] [CrossRef]
- Yao, X.; Liu, Q.; Wang, B.; Yu, J.; Aristov, M.M.; Shi, C.; Zhang, G.G.Z.; Yu, L. Anisotropic Molecular Organization at a Liquid/Vapor Interface Promotes Crystal Nucleation with Polymorph Selection. J. Am. Chem. Soc. 2022, 144, 11638–11645. [Google Scholar] [CrossRef]
- Wanat, M.; Malinska, M.; Kucia, M.; Sicinski, R.R.; Woźniak, K. Rotamers in Crystal Structures of Xylitol, D-Arabitol and L-Arabitol. Int. J. Mol. Sci. 2022, 23, 3875. [Google Scholar] [CrossRef]
- Kim, H.S.; Jeffrey, G.A. The crystal structure of xylitol. Acta Cryst. Sect. B 1969, 25, 2607–2613. [Google Scholar] [CrossRef]
- Madsen, A.O.; Mason, S.; Larsen, S. A neutron diffraction study of xylitol: Derivation of mean square internal vibrations for H atoms from a rigid-body description. Acta Cryst. Sect. B 2003, 59, 653–663. [Google Scholar] [CrossRef] [PubMed]
- Madsen, A.O.; Sorensen, H.O.; Flensburg, C.; Stewart, R.F.; Larsen, S. Modeling of the nuclear parameters for H atoms in X-ray charge-density studies. Acta Cryst. Sect. A 2004, 60, 550–561. [Google Scholar] [CrossRef] [PubMed]
- Woińska, M.; Grabowsky, S.; Dominiak, P.M.; Woźniak, K.; Jayatilaka, D. Hydrogen atoms can be located accurately and precisely by x-ray crystallography. Sci. Adv. 2016, 2, e1600192. [Google Scholar] [CrossRef]
- Wanat, M.; Malinska, M.; Gutmann, M.J.; Cooper, R.I.; Wozniak, K. HAR, TAAM and BODD refinements of model crystal structures using Cu Kα and Mo Kα X-ray diffraction data. Acta Cryst. Sect. B 2021, 77, 41–53. [Google Scholar] [CrossRef]
- Safari, F.; Katrusiak, A. Structure-property relationships of molecular shape and orientation with compression and expansion of xylitol. Acta Cryst. Sect. B 2021, 77, 205–210. [Google Scholar] [CrossRef]
- Kacper Pajak, M.M. CCDC 1898654: Experimental Crystal Structure Determination. 2020. Available online: https://www.ccdc.cam.ac.uk/structures/search?id=doi:10.5517/ccdc.csd.cc21qpxd&sid=DataCite (accessed on 26 February 2024). [CrossRef]
- Malaspina, L.A.; Genoni, A.; Jayatilaka, D.; Turner, M.J.; Sugimoto, K.; Nishibori, E.; Grabowsky, S. The advanced treatment of hydrogen bonding in quantum crystallography. J. Appl. Cryst. 2021, 54, 718–729. [Google Scholar] [CrossRef]
- Malaspina, L.A.; Genoni, A.; Grabowsky, S. lamaGOET: An interface for quantum crystallography. J. Appl. Cryst. 2021, 54, 987–995. [Google Scholar] [CrossRef]
- Jha, K.K.; Gruza, B.; Kumar, P.; Chodkiewicz, M.L.; Dominiak, P.M. TAAM: A reliable and user friendly tool for hydrogen-atom location using routine X-ray diffraction data. Acta Cryst. Sect. B 2020, 76, 296–306. [Google Scholar] [CrossRef] [PubMed]
- Wanat, M.; Malinska, M.; Hoser, A.A.; Woźniak, K. Further Validation of Quantum Crystallography Approaches. Molecules 2021, 26, 3730. [Google Scholar] [CrossRef]
- Jeffrey, G.; Kim, H. Conformations of the alditols. Carbohydr. Res. 1970, 14, 207–216. [Google Scholar] [CrossRef]
- Nurunnabi, T.R.; Nahar, L.; Al-Majmaie, S.; Rahman, S.M.M.; Sohrab, M.H.; Billah, M.M.; Ismail, F.M.D.; Rahman, M.M.; Sharples, G.P.; Sarker, S.D. Anti-MRSA activity of oxysporone and xylitol from the endophytic fungus Pestalotia sp. growing on the Sundarbans mangrove plant Heritiera fomes. Phytother. Res. 2018, 32, 348–354. [Google Scholar] [CrossRef] [PubMed]
- Hatcher, E.R.; Guvench, O.; MacKerell, A.D., Jr. CHARMM Additive All-Atom Force Field for Acyclic Polyalcohols, Acyclic Carbohydrates, and Inositol. J. Chem. Theory Comput. 2009, 5, 1315–1327. [Google Scholar] [CrossRef] [PubMed]
- Hawkes, G.E.; Lewis, D. 1H nuclear magnetic resonance spectra and conformations of alditols in deuterium oxide. J. Chem. Soc. Perkin Trans. 2 1984, 2073–2078. [Google Scholar] [CrossRef]
- Haasnoot, C.; de Leeuw, F.A.; Altona, C. The relationship between proton-proton NMR coupling constants and substituent electronegativities—I: An empirical generalization of the karplus equation. Tetrahedron 1980, 36, 2783–2792. [Google Scholar] [CrossRef]
- Garrett, E.C.; Serianni, A.S. (1-13C)Alditols: Elimination of magnetic equivalence in 1H-and 13C-n.m.r. spectra of symmetric compounds through (13C)-substitution. Carbohyr. Res. 1990, 208, 23–35. [Google Scholar] [CrossRef] [PubMed]
- Kobayashi, C.; Jung, J.; Matsunaga, Y.; Mori, T.; Ando, T.; Tamura, K.; Kamiya, M.; Sugita, Y. GENESIS 1.1: A hybrid-parallel molecular dynamics simulator with enhanced sampling algorithms on multiple computational platforms. J. Comput. Chem. 2017, 38, 2193–2206. [Google Scholar] [CrossRef] [PubMed]
- Jung, J.; Mori, T.; Kobayashi, C.; Matsunaga, Y.; Yoda, T.; Feig, M.; Sugita, Y. GENESIS: A hybrid-parallel and multi-scale molecular dynamics simulator with enhanced sampling algorithms for biomolecular and cellular simulations. WIREs Comput. Mol. Sci. 2015, 5, 310–323. [Google Scholar] [CrossRef] [PubMed]
- Momany, F.A.; Rone, R. Validation of the general purpose QUANTA ®3.2/CHARMm® force field. J. Comput. Chem. 1992, 13, 888–900. [Google Scholar] [CrossRef]
- Jorgensen, W.L.; Chandrasekhar, J.; Madura, J.D.; Impey, R.W.; Klein, M.L. Comparison of simple potential functions for simulating liquid water. J. Chem. Phys. 1983, 79, 926–935. [Google Scholar] [CrossRef]
- Furihata, K.; Tashiro, M.; Seto, H. High resolution-HMBC (HR-HMBC), a new method for measuring heteronuclear long-range coupling constants. Magn. Reson. Chem. 2010, 48, 179–183. [Google Scholar] [CrossRef] [PubMed]
- Palermo, G.; Riccio, R.; Bifulco, G. Effect of Electronegative Substituents and Angular Dependence on the Heteronuclear Spin−Spin Coupling Constant 3JC−H: An Empirical Prediction Equation Derived by Density Functional Theory Calculations. J. Org. Chem. 2010, 75, 1982–1991. [Google Scholar] [CrossRef] [PubMed]
- Aydin, R.; Günther, H. 13C, 1H spin–spin coupling. X—Norbornane: A reinvestigation of the karplus curve for 3J (13C, 1H). Magn. Reson. Chem. 1990, 28, 448–457. [Google Scholar] [CrossRef]
- Dobson, C.M.; Lian, L.-Y.; Redfield, C.; Topping, K.D. Measurement of hydrogen exchange rates using 2D NMR spectroscopy. J. Magn. Reson. (1969) 1986, 69, 201–209. [Google Scholar] [CrossRef]
- Sandström, C.; Baumann, H.; Kenne, L. The use of chemical shifts of hydroxy protons of oligosaccharides as conformational probes for NMR studies in aqueous solution. Evidence for persistent hydrogen bond interaction in branched trisaccharides. J. Chem. Soc. Perkin Trans. 2 1998, 2385–2394. [Google Scholar] [CrossRef]


| CCDC Deposition Number | φ1 | φ2 | φ3 | φ4 | C1–C5 Distance | References |
|---|---|---|---|---|---|---|
| Ribitol [3] | ||||||
| 1249410 | 171 | −62 | −172 | 71 | 4.5 | [4] |
| 662559 | 171 | −61 | −171 | 73 | 4.6 | [5] |
| 1015979 | 171 | −61 | −170 | 73 | 4.6 | [6] |
| d-Arabitol | ||||||
| 1103512 | 58 | 178 | 178 | 64 | 5.1 | [7] |
| 1287063 | 173 | 174 | 176 | 66 | 5.1 | [8] |
| 2150172 | 177 | 175 | 180 | 62 | 5.1 | [9] |
| 2076894 | 64 | 176 | 171 | 56 | 5.1 | [10] |
| Xylitol | ||||||
| 1298203 | 173 | 70 | 176 | 175 | 4.5 | [11] |
| 223330 | 173 | 70 | 176 | 175 | 4.5 | [12] |
| 1015980 | 173 | 70 | 176 | 175 | 4.5 | [6] |
| 1432562 | 173 | 70 | 176 | 175 | 4.5 | [13] |
| 1423912 | 173 | 70 | 176 | 175 | 4.5 | [14] |
| 2008303 | 173 | 70 | 176 | 175 | 4.5 | [15] |
| 2021790 | 173 | 70 | 177 | 175 | 4.5 | [16] |
| 2021791 | 175 | 176 | 70 | 174 | 4.5 | [16] |
| 2021792 | 176 | 176 | 69 | 175 | 4.4 | [16] |
| 2021793 | 175 | 177 | 70 | 176 | 4.4 | [16] |
| 2021794 | 175 | 176 | 70 | 174 | 4.4 | [16] |
| 2021795 | 175 | 176 | 71 | 177 | 4.4 | [16] |
| 2021796 | 175 | 174 | 69 | 179 | 4.4 | [16] |
| 2021798 | 178 | 163 | 72 | 179 | 4.4 | [16] |
| 2021799 | 175 | 175 | 69 | 177 | 4.4 | [16] |
| 2021800 | 172 | 173 | 69 | 173 | 4.4 | [16] |
| 1898654 | 175 | 176 | 70 | 173 | 4.5 | [17] * |
| 2008299 | 173 | 70 | 176 | 175 | 4.5 | [15] |
| 2008300 | 173 | 70 | 176 | 175 | 4.5 | [15] |
| 2008301 | 173 | 70 | 176 | 175 | 4.5 | [15] |
| 2008302 | 173 | 70 | 176 | 175 | 4.5 | [15] |
| 2008304 | 173 | 70 | 176 | 175 | 4.5 | [15] |
| 2008266 | 173 | 70 | 176 | 175 | 4.5 | [15] |
| 2008270 | 173 | 70 | 176 | 175 | 4.5 | [15] |
| 2008283 | 173 | 70 | 176 | 175 | 4.5 | [15] |
| 2008280 | 173 | 70 | 176 | 175 | 4.5 | [15] |
| 2060247 | 173 | 70 | 176 | 175 | 4.5 | [18] |
| 2085455 | 173 | 70 | 176 | 175 | 4.5 | [15] |
| 1987830 | 173 | 70 | 176 | 175 | 4.5 | [18,19] |
| 1962229 | 173 | 70 | 176 | 175 | 4.5 | [20] |
| 1962230 | 173 | 70 | 176 | 175 | 4.5 | [20] |
| 1962231 | 173 | 70 | 176 | 175 | 4.5 | [20] |
| 1962232 | 173 | 70 | 176 | 175 | 4.5 | [20] |
| 1984051 | 173 | 70 | 176 | 175 | 4.5 | [20] |
| 2081791 | 173 | 70 | 176 | 175 | 4.5 | [21] |
| 2081792 | 174 | 70 | 176 | 175 | 4.5 | [21] |
| 2081793 | 174 | 70 | 176 | 175 | 4.5 | [21] |
| 2081794 | 173 | 70 | 176 | 175 | 4.5 | [21] |
| 2076896 | 175 | 176 | 70 | 173 | 4.5 | [10] |
| 2076897 | 173 | 70 | 176 | 175 | 4.5 | [10] |
| 2008298 | 173 | 70 | 176 | 175 | 4.5 | [15] |
| 2021797 | 172 | 174 | 73 | 180 | 4.4 | [16] |
| 2081788 | 173 | 70 | 176 | 175 | 4.5 | [21] |
| 2081789 | 173 | 70 | 176 | 175 | 4.5 | [21] |
| 2081790 | 173 | 70 | 176 | 175 | 4.5 | [21] |
| Chemical Shift (ppm) | Ribitol [3] | d-Arabitol | Xylitol |
|---|---|---|---|
| H1R (pro-R) | 3.79 | 3.66 | 3.70 |
| H1S (pro-S) | 3.64 | 3.66 | 3.63 |
| H2 | 3.81 | 3.92 | 3.79 |
| H3 | 3.68 | 3.58 | 3.63 |
| H4 | - | 3.74 | - |
| H5R (pro-R) | - | 3.81 | - |
| H5S (pro-S) | - | 3.66 | - |
| C1 | 65.1 | 65.8 | 65.3 |
| C2 | 74.8 | 73.0 | 74.6 |
| C3 | 74.9 | 73.2 | 73.5 |
| C4 | - | 73.7 | - |
| C5 | - | 65.7 | - |
| Coupling constant (Hz) | |||
| 3J(H1R,H2) | 3.00 | 5.00 | 4.5 |
| 3J(H1S,H2) | 7.20 | 7.55 | 7.5 |
| 3J(H2,H3) | 6.50 | 2.00 | 4.6 |
| 3J(H3,H4) | - | 8.4 | - |
| 3J(H4,H5R) | - | 3.05 | - |
| 3J(H4,H5S) | - | 6.50 | - |
| 2J(H1R,H1S) | −12.70 | −11.55 | −11.7 |
| 2J(H5R,H5S) | - | −11.00 | - |
| 3J(C1,H3) | 3.8 * | ND | 5.4 * |
| 3J(C3,H1S) | 2.9 * | ND | - |
| 3J(C3,H1R) | ND | ND | 4.5 * |
| 3J(C3,H5) | ND | ND | - |
| 3J(C5,H2) | ND | ND | 10.0 * |
| φ1 | φ2 | |||||
|---|---|---|---|---|---|---|
| 180° | −60° | +60° | 180° | −60° | +60° | |
| Ribitol | 64 | 36 | 0 | 2 | 46 | 52 |
| d-Arabitol | 57 | 17 | 26 | N.D. | N.D. | N.D. |
| Xylitol | 59 | 21 | 19 | 55 | 45 | 0 |
| Ribitol | φ1 | φ2 | φ3 | φ4 |
|---|---|---|---|---|
| 180° | 53 (52) | 72 (74) | 58 (52) | 53 (53) |
| 60° | 38 (38) | 1 (6) | 38 (44) | 8 (7) |
| −60° | 9 (10) | 27 (21) | 4 (3) | 39 (40) |
| d-Arabitol | ||||
| 180° | 26 (18) | 85 (100) | 96 (99) | 44 (49) |
| 60° | 2 (2) | 0 (0) | 2 (1) | 12 (11) |
| −60° | 72 (80) | 15 (0) | 2 (0) | 45 (41) |
| Xylitol | ||||
| 180° | 16 (17) | 99 (89) | 43 (64) | 49 (43) |
| 60° | 81 (76) | 0 (0) | 5 (9) | 4 (3) |
| −60° | 3 (7) | 1 (11) | 51 (28) | 47 (63) |
| Ribitol | d-Arabitol | Xylitol | |
|---|---|---|---|
| O1 | 14 | 26 | 2 |
| O2 | 22 | 3 | 30 |
| O3 | 26 | 23 | 7 |
| O4 | 22 | 10 | 29 |
| O5 | 12 | 9 | 6 |
Disclaimer/Publisher’s Note: The statements, opinions and data contained in all publications are solely those of the individual author(s) and contributor(s) and not of MDPI and/or the editor(s). MDPI and/or the editor(s) disclaim responsibility for any injury to people or property resulting from any ideas, methods, instructions or products referred to in the content. |
© 2024 by the authors. Licensee MDPI, Basel, Switzerland. This article is an open access article distributed under the terms and conditions of the Creative Commons Attribution (CC BY) license (https://creativecommons.org/licenses/by/4.0/).
Share and Cite
Ohno, S.; Manabe, N.; Uzawa, J.; Yamaguchi, Y. Comparative Conformational Analysis of Acyclic Sugar Alcohols Ribitol, Xylitol and d-Arabitol by Solution NMR and Molecular Dynamics Simulations. Molecules 2024, 29, 1072. https://doi.org/10.3390/molecules29051072
Ohno S, Manabe N, Uzawa J, Yamaguchi Y. Comparative Conformational Analysis of Acyclic Sugar Alcohols Ribitol, Xylitol and d-Arabitol by Solution NMR and Molecular Dynamics Simulations. Molecules. 2024; 29(5):1072. https://doi.org/10.3390/molecules29051072
Chicago/Turabian StyleOhno, Shiho, Noriyoshi Manabe, Jun Uzawa, and Yoshiki Yamaguchi. 2024. "Comparative Conformational Analysis of Acyclic Sugar Alcohols Ribitol, Xylitol and d-Arabitol by Solution NMR and Molecular Dynamics Simulations" Molecules 29, no. 5: 1072. https://doi.org/10.3390/molecules29051072
APA StyleOhno, S., Manabe, N., Uzawa, J., & Yamaguchi, Y. (2024). Comparative Conformational Analysis of Acyclic Sugar Alcohols Ribitol, Xylitol and d-Arabitol by Solution NMR and Molecular Dynamics Simulations. Molecules, 29(5), 1072. https://doi.org/10.3390/molecules29051072