Article

Multi-Wavelength Excitable Multicolor Upconversion and Ratiometric Luminescence Thermometry of Yb3+/Er3+ Co-Doped NaYGeO4 Microcrystals

by
Hui Zeng
,
Yangbo Wang
*,
Xiaoyi Zhang
,
Xiangbing Bu
,
Zongyi Liu
and
Huaiyong Li
*
School of Materials Science and Engineering, Laboratory of Sensitive Materials and Devices Shandong Department of Education, Liaocheng University, Liaocheng 252059, China
*
Authors to whom correspondence should be addressed.
Molecules 2024, 29(20), 4887; https://doi.org/10.3390/molecules29204887
Submission received: 14 September 2024 / Revised: 12 October 2024 / Accepted: 13 October 2024 / Published: 15 October 2024
(This article belongs to the Special Issue Rare Earth Based Luminescent Materials)

Abstract

:
Excitation wavelength controllable lanthanide upconversion allows for real-time manipulation of luminescent color in a composition-fixed material, which has been proven to be conducive to a variety of applications, such as optical anti-counterfeiting and information security. However, current available materials highly rely on the elaborate core–shell structure in order to ensure efficient excitation-dependent energy transfer routes. Herein, multicolor upconversion luminescence in response to both near-infrared I and near-infrared II (NIR-I and NIR-II) excitations is realized in a novel but simple NaYGeO4:Yb3+/Er3+ phosphor. The remarkably enhanced red emission ratio under 1532 nm excitation, compared with that under 980 nm excitation, could be attributed to the Yb3+-mediated cross-relaxation energy transfers. Moreover, multi-wavelength excitable temperature-dependent (295–823 K) upconversion luminescence realizes a ratiometric thermometry relying on the thermally coupled levels (TCLs) of Er3+. Detailed investigations demonstrate that changing excitation wavelength makes little difference for the performances of TCL-based ratiometric thermometry of NaYGeO4:Yb3+/Er3+. These findings gain more insights to manipulate cross-relaxations for excitation controllable upconversion in single activator doped materials and benefit the cognition of the effect of excitation wavelength on ratiometric luminescence thermometry.

Graphical Abstract

1. Introduction

Lanthanide-activated upconversion luminescence materials extend the excitation wavelength from the traditional ultraviolet and visible region to the near-infrared (NIR) region, enabling the full utilization of the advantages of near-infrared light sources, such as low background fluorescence interference and greater biological tissue penetration ability [1,2]. The characteristic multi-peak emissions of lanthanide ions due to their abundant energy levels and electronic transitions endow lanthanide-activated materials with multicolor upconversion luminescence, allowing the broad applications in optical display, anti-counterfeiting, and information security [3]. Multicolor upconversion luminescence has usually been achieved by managing the composition of lanthanide-doped materials, for example, the types of hosts, the types and concentrations of sensitizers and activators, and the distribution of doped ions [4]. Besides this, excitation wavelength controllable multicolor upconversion luminescence offers an in situ and reversible luminescence management without the need of changing the material composition [5,6]. However, for most of the reported upconversion materials, they could only produce a luminescence of specific color when excited at a specific wavelength. Even the available excitation wavelength is added by introducing new sensitizers and energy transfer paths [7]; the emission color usually stays the same due to the same luminous ions.
Great attempts have been made to realize excitation wavelength controlled multicolor upconversion, and exciting results have been achieved. By arranging different activators and sensitizers in separate areas in multi-shell nanostructures, previous research has demonstrated a versatile excitation wavelength-dependent colorful upconversion luminescence, which is orthogonal upconversion [8]. For example, elaborately synthesized multi-shell NaGdF4:Yb/Tm@NaGdF4@NaYbF4:Nd@Na(Yb,Gd)F4:Ho@NaGdF4 nanoparticles emit green light under 808 nm excitation while blue light under 980 nm excitation [9]; NaGdF4:Yb/Er@NaYF4:Yb@NaGdF4:Yb/Nd@NaYF4@NaGdF4:Yb/Tm@NaYF4 nanoparticles exhibit prominently blue and green luminescence with 980 and 796 nm excitation, respectively [10]. Orthogonal upconversion could also be achieved by the assembly of different nanoparticles capable of producing different luminescent colors at different wavelengths of excitation [11,12]. Moreover, by managing the energy migration processes in multi-shell nanostructures with well-designed sensitizer distribution, Zhang’s group acquired switchable colorful upconversion luminescence from red to green in single activator Er3+-doped nanoparticles by changing the excitation wavelength from 980 to 808 nm [13,14]. Although great progress has been made in excitation wavelength controllable multicolor upconversion, it is always necessary to construct complex core–shell or cluster structure to reduce cross-relaxation energy loss and avoid interference between excitation-dependent energy transfer paths. Therefore, it is highly valuable and desirable to develop simple material available for excitation wavelength controlled multicolor upconversion. As well known, Er3+ ions can not only produce tunable luminescence with multiple bands covering visible and NIR regions but can also be excited by several wavelengths of NIR light, such as 808, 980, and 1532 nm, owing to their abundant equidistant energy levels [15,16]. Meanwhile, co-doping Er3+ with other lanthanide ions (Tm3+, Ho3+, Yb3+, etc.) [17,18,19,20] or transition metal ions (Mn2+, Fe3+, etc.) [21,22] could introduce special energy transfer processes to realize multicolor luminescence. So, Er3+ is an appropriate dopant to serve simultaneously as an activator and sensitizer to achieve excitation wavelength-dependent multicolor upconversion in simple single activator doped materials.
Sodium yttrium germanate (NaYGeO4) has been recently investigated as a promising optical matrix material for efficient lanthanide and bismuth luminescence because of its multiple cation sites available for accommodating various luminous ions and a wide bandgap up to 6 eV [23,24,25,26]. Meanwhile, NaYGeO4 was reported to have a relatively low phonon energy of about 800 cm−1 [27,28], which suggests its potential to host lanthanide ions for efficient upconversion luminescence. However, present research on lanthanide-doped NaYGeO4 all focus on the conventional Stokes luminescence [29,30]. Therefore, herein, we synthesized Yb3+/Er3+ co-doped NaYGeO4 phosphors and explored their upconversion luminescence properties systematically. When excited by traditional near-infrared I (NIR-I) light of 980 nm, NaYGeO4:Yb3+/Er3+ phosphors emit bright green light through the typical energy transfer upconversion (ETU) processes of the Yb3+/Er3+ ion pair. Switching the excitation source to near-infrared II (NIR-II) light of 1532 nm leads to the excited state absorption (ESA) upconversion luminescence of Er3+, where a distinct yellow or orange–yellow emission could be observed due to the significantly increased red emission ratio. Mechanistic studies combining the steady-state and transient spectroscopic analyses reveal that the bidirectional cross-relaxation energy transfers between Er3+ and Yb3+ are responsible for the enhanced red emission under 1532 nm excitation. Moreover, ratiometric luminescence thermometry is achieved in a temperature range as wide as 295–823 K under multiple excitation wavelengths by using the luminescence intensity ratio (LIR) of the thermally coupled levels (TCLs, 2H11/2, and 4S3/2) of Er3+. Results demonstrate the excellent sensitivity, uncertainty, and repeatability of ratiometric thermometry based on TCLs and the little effect of changing excitation wavelength on thermometric performances.

2. Results and Discussion

2.1. Structure, Composition and Morphology

NaYGeO4 owns an orthorhombic olivine structure with a Pnma space group. Three kinds of cationic polyhedra, GeO4 tetrahedra, NaO6 and YO6 octahedra, connect to each other by sharing a corner or edge (Figure 1a). Detailed structure information can be found in a crystallographic information file from the Inorganic Crystal Structure Database, which has been included in the Supplementary Materials. Due to the same valence and the very close ionic radii between Yb3+/Er3+ and Y3+ (1.008/1.030 Å for Yb3+/Er3+ and 1.040 Å for Y3+, coordination number = 6) [31], Yb3+ and Er3+ ions can be easily doped into the NaYGeO4 lattice through substituting Y3+ to realize upconversion luminescence. The obtained XRD patterns of synthesized NaYGeO4:xYb3+/2%Er3+ (x = 2–48%) are in good agreement with the standard patterns of orthorhombic NaYGeO4 (PDF#88-1177), as in Figure 1b. Rietveld refinement of obtained XRD patterns was performed to analyze the subtle change in crystallographic structure with the increase in Yb3+ concentration. The resulting refinement patterns and structural parameters are presented in Figure S1 and Table S1. Low and stable refinement factors (Rwp, Rp, and χ2) indicate that the obtained refinement results are reliable. Samples with 2–48% Yb3+ doping maintain the orthorhombic phase with the Pnma space group. Calculated cell volume decreases continuously from 384.7716 to 378.8438 Å3 with the increase of Yb3+ concentration (Figure 1c), demonstrating the isomorphic substitution of Y3+ ions by smaller Yb3+ ions. The XPS result of the exemplary NaYGeO4:18%Yb3+/2%Er3+ in Figure 1d reveals distinctly the existence of Na 1s, Y 3d, Ge 2p, and O 1s orbitals. Specifically, the high-resolution result of Yb 4d (183.6 eV) and Er 4d (168.0 eV) orbitals proves the successful incorporation of Yb3+/Er3+ in NaYGeO4 (the inset in Figure 1d).
The SEM image in Figure 1e shows that NaYGeO4:18%Yb3+/2%Er3+ particles are irregular lumpy microcrystals in the size of about several microns. The morphology was not significantly changed when adjusting Yb3+ concentration (Figure S2). The EDS spectrum also demonstrates the remarkable presence of Na, Y, Ge, O, and Yb elements, while no obvious peak of Er could be discerned due to the low doping concentration (Figure 1f). Based on the detected atomic percentages by the EDS spectrum, the elemental composition of Na:Y:RE:O for NaYGeO4:18%Yb3+/2%Er3+ sample could be calculated to 0.92:1.20:1:4.40, which is close to the theoretical ratio of 1:1:1:4. As the Yb3+ doping concentration increases, atomic percentages of Na, Ge, O, and Er remain almost unchanged, while those of Y and Yb go evidently opposite trends (Table S2). Therefore, the detected Yb concentration increases linearly from 2.5% to 55.9% when increasing Yb3+ doping concentration from 2% to 48%, as shown in Figure S3. Although the detected concentration of Yb3+ is not quite the same as the feed concentration, the trends are consistent. The elemental mapping images in Figure 1g show the even distribution of Na, Y, Ge, O, Yb, and Er elements in NaYGeO4:18%Yb3+/2%Er3+.

2.2. Upconversion Properties

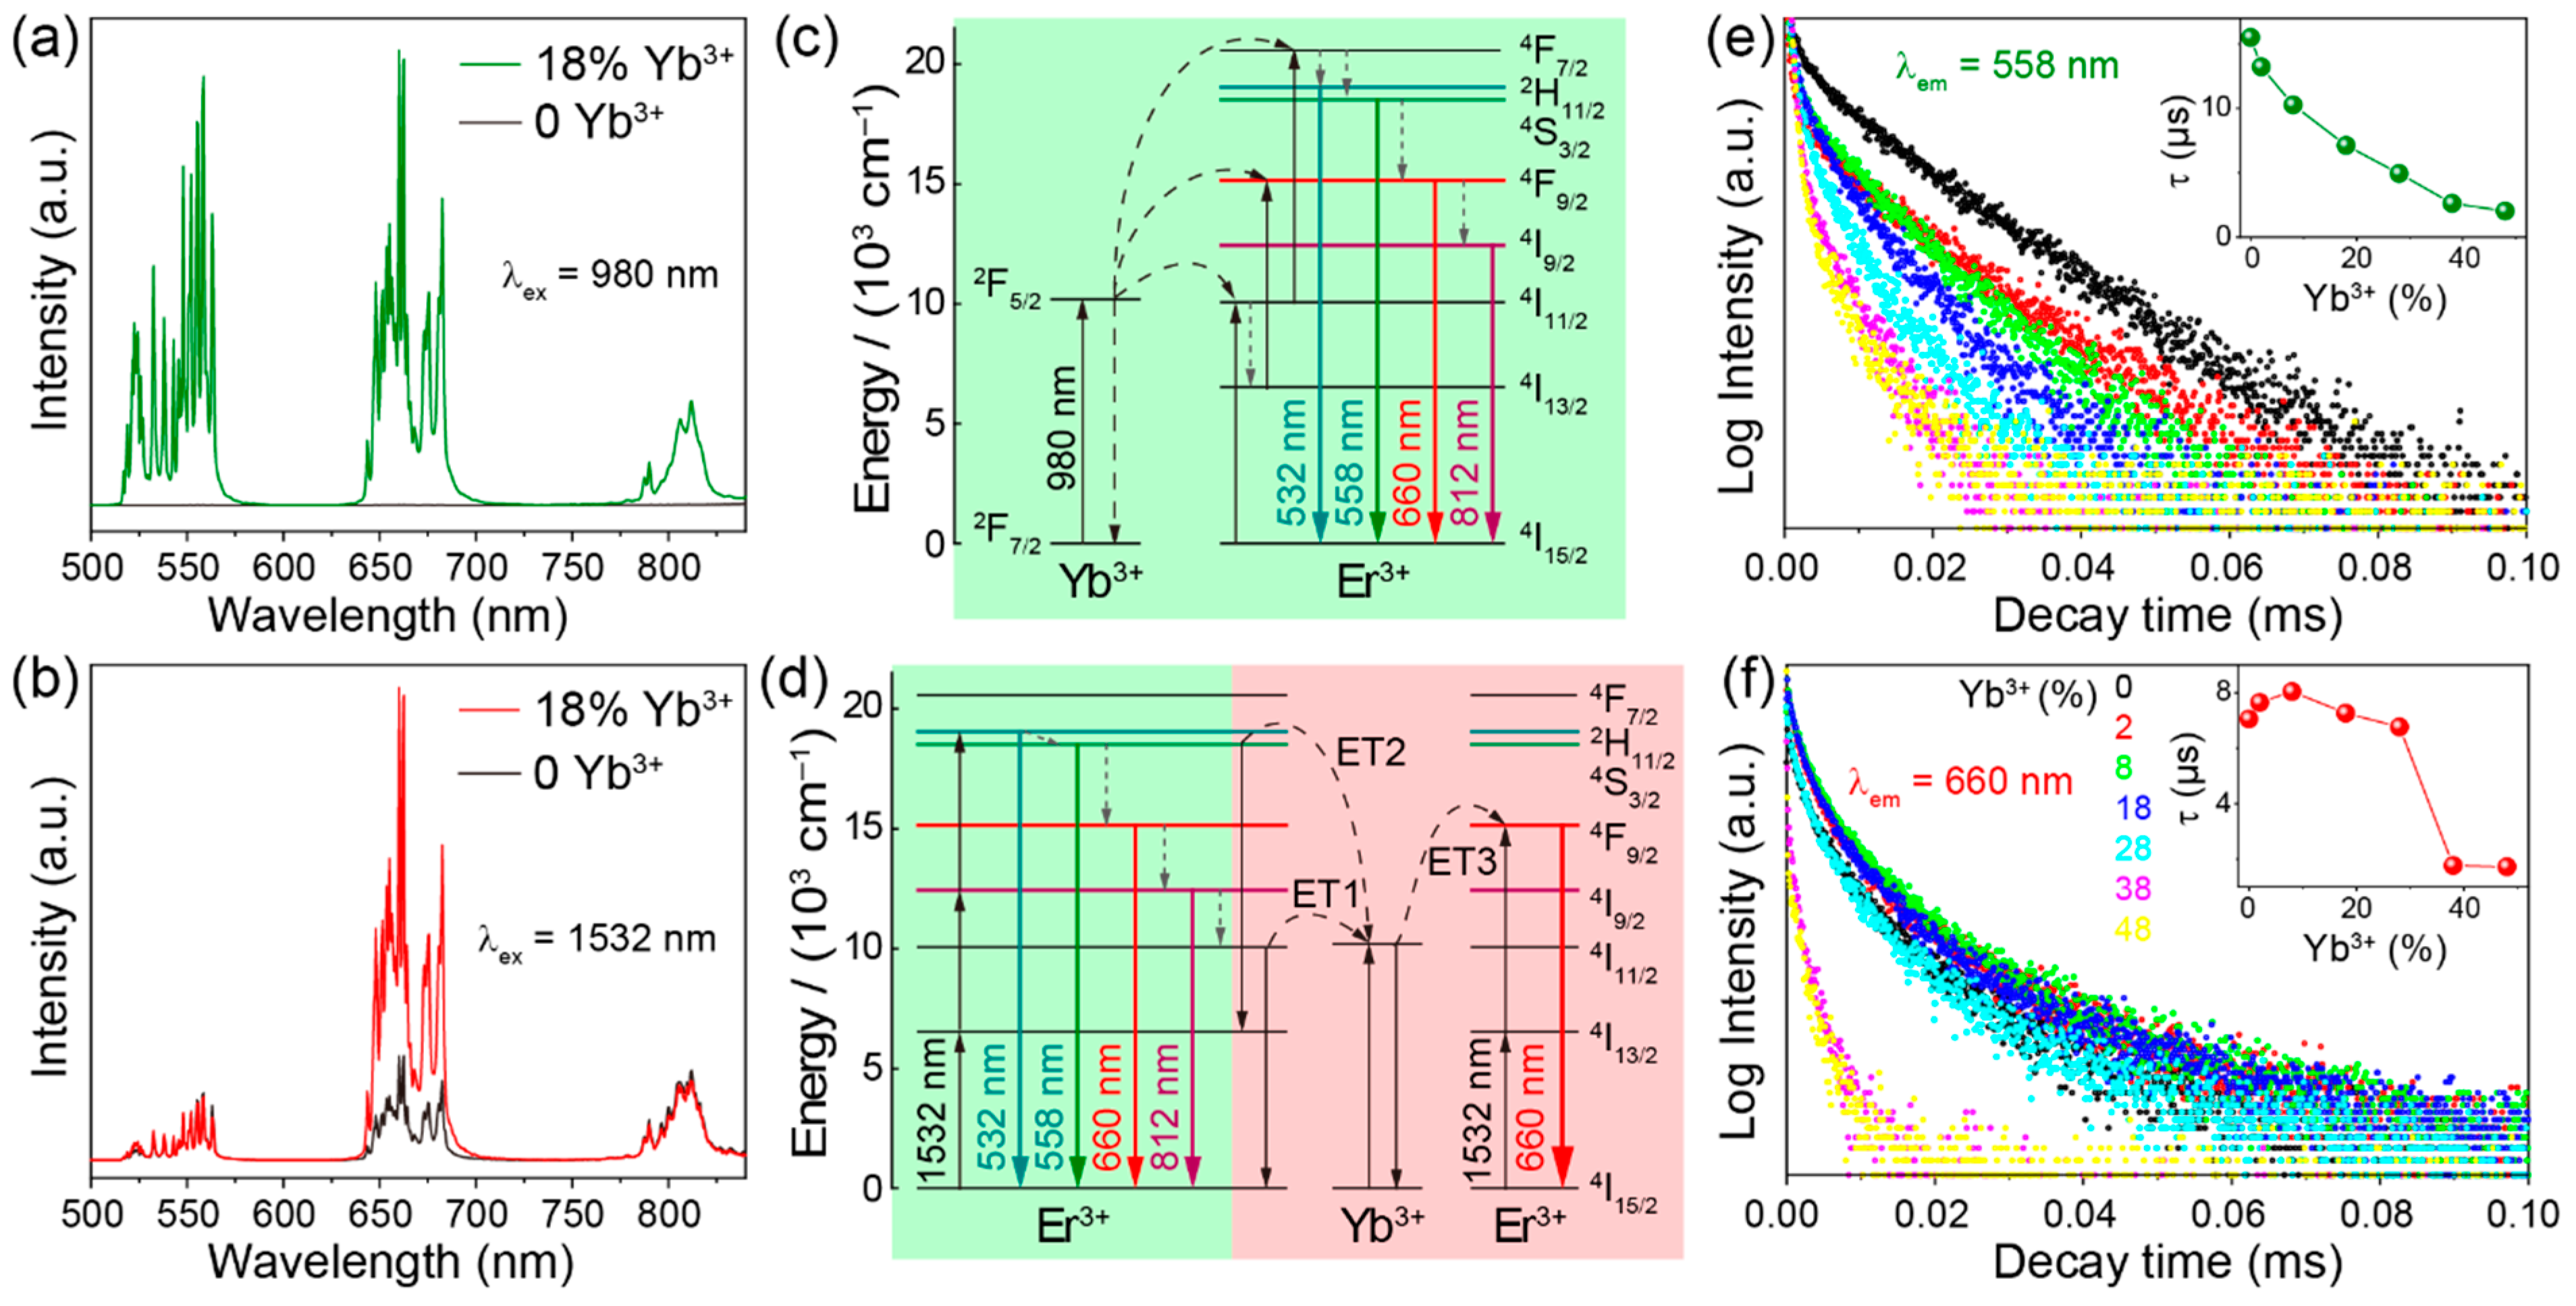
As expected, NaYGeO4:Yb3+/Er3+ produces the typical upconversion luminescence of Er3+ under excitations of both 980 nm NIR-I and 1532 nm NIR-II light. Figure 2a shows the upconversion spectra of NaYGeO4:18%Yb3+/2%Er3+ under 980 and 1532 nm excitations. Three main emission bands at 515–570, 634–705, and 783–826 nm, respectively, are from the 2H11/2/4S3/24I15/2, 4F9/24I15/2, and 4I9/24I15/2 energy level transitions of Er3+. It is noticeable that 980 nm excitation gives rise to comparable intensity for green (515–570 nm) and red (634–705 nm) emissions, while 1532 nm excitation leads to red emission much stronger than green. The red/green ratios relying on the integral intensity are calculated to 1.1 and 9.0 for 980 and 1532 nm excitations, respectively. This implies a different luminescence color under different excitation conditions.
Three main emission bands enhance first and then weaken with the rising of Yb3+ doping concentration under both 980 and 1532 nm excitations (Figure 2b,c). The highest upconversion emission intensity is obtained at 18% Yb3+ doping for 980 nm excitation, while 8% Yb3+ doping gives the highest emission for 1532 nm excitation. Higher Yb3+ doping brings about obvious concentration quenching effects under both excitation wavelengths. The influence of Er3+ concentration on luminescence was also considered. Variation of Er3+ concentration has little effect on the luminescence intensity under 980 nm excitation, and the highest intensity is achieved at 2% Er3+ doping (Figure S4a,b). This is because heavy activator content may result in cross-relaxation energy loss rather than more emissions. Increasing Er3+ concentration continuously enhances 1532 nm excited upconversion luminescence due to the increasing absorption for excitation light (Figure S4c,d). This is because 1532 nm excitation leads to the self-sensitization luminescence of Er3+, which can be found in the following luminescence mechanisms. Taking into account the stronger luminescence under 980 nm excitation and larger red/green ratio under 1532 nm excitation, the concentration of Er3+ was chosen as 2%. As presented in Figure 2d, the red/green ratio increases gradually and slightly from 0.7 to 2.0 with the increased Yb3+ doping from 2% to 48% under 980 nm excitation, while it increases drastically from 3.6 to 11.9 for 2–28% Yb3+ doping and then decreases to 6.4 under 1532 nm excitation. Apparently, the red/green ratios obtained by 980 nm excitation are lower than those obtained by 1532 nm excitation at all Yb3+ doping concentrations. The biggest difference in red/green ratios (1.6 and 11.9 for 980 and 1532 nm excitations, respectively) is achieved at 28% Yb3+ doping. Accordingly, the upconversion luminescence color of NaYGeO4:xYb3+/2%Er3+ (x = 2–48%) changes from green to yellow or orange–yellow when switching the excitation from 980 nm NIR-I to 1532 nm NIR-II light, as explicitly shown in Figure 2e. This excitation wavelength-dependent multicolor luminescence is indicative of a potential of this material for luminescent anti-counterfeiting application.
We compared the upconversion spectra of samples with and without Yb3+ doping. Under 980 nm excitation, NaYGeO4:2%Er3+ shows absolutely negligible emissions compared with the 18% Yb3+ co-doped counterpart, as given in Figure 3a. This corresponds to the much lower absorption cross-section of Er3+ (~10−21 cm2) than Yb3+ (~10−20 cm2) for 980 nm excitation light [32]. So, the ETU mechanism is undoubtedly the dominant mechanism for 980 nm excited upconversion luminescence of NaYGeO4:Yb3+/Er3+. For the upconversion spectra under 1532 nm excitation, Figure 3b displays noticeable emissions of NaYGeO4:2%Er3+ with comparable intensity to NaYGeO4:18%Yb3+/2%Er3+. This is because 1532 nm photons could only be absorbed by Er3+ while Yb3+ has no matched energy levels [3]. Nonetheless, the upconversion red/green ratio of NaYGeO4:2%Er3+ (calculated as 2.2) is significantly lower than that of NaYGeO4:18%Yb3+/2%Er3+ (calculated as 9) and those of samples with 2–48% Yb3+ doping (calculated as 3.6–11.9). This implies the key role of Yb3+ in the red predominant upconversion luminescence under 1532 nm excitation.
To further sketch out the energy processes for the upconversion luminescence under both excitation wavelengths, the excitation photon numbers (n) required for main emissions were then figured out by analyzing the double logarithmic relationships between emission intensity (I) and excitation power (P). According to the equation I P n , the value of n can be determined as the slope of the linear fit of the double logarithmic relationship [33]. From the results in Figure S5a–c, under 980 nm excitation, the n values for three main emissions at 515–570, 634–705, and 783–826 nm are calculated near to 2. This indicates that 980 nm excitation mainly leads to two-photon upconversion luminescence. Based on the results in Figure S5d–f, three main emissions under 1532 nm excitation could be determined as three-photon predominant upconversion processes.
The upconversion luminescence mechanisms are schematically illustrated in Figure 3c,d. The luminescence of NaYGeO4:Yb3+/Er3+ under 980 nm excitation involves the typical ETU upcoversion processes as shown in Figure 3c. Yb3+ ions absorb the energy of 980 nm photons and are excited, then, two successive energy transfer processes from Yb3+ to Er3+ excite the later to 4F7/2 level. Er3+ ions at 4F7/2 level may reach 2H11/2, 4S3/2, 4F9/2, and 4I9/2 levels by several nonradiative relaxations. The second-step energy transfer may also excite Er3+ from the 4I13/2 to 4F9/2 level. Finally, for Er3+ ions at 2H11/2, 4S3/2, 4F9/2, and 4I9/2 levels, radiative transitions to the ground state level take place and corresponding emission bands around 532, 558, 660, and 812 nm are generated, respectively. Figure 3d describes the self-sensitization luminescence mechanism of Er3+ under 1532 nm excitation. 1532 nm photons are absorbed by Er3+ ions due to their suitable equidistant energy levels. Ground state absorption (GSA) of 4I15/24I13/2 and the subsequent ESA process of 4I13/24I9/2 populates Er3+ ions at the 4I9/2 level. Er3+ ions are further excited to the 2H11/2 level through the following ESA process of 4I9/22H11/2, and then may also relax nonradiatively to 4S3/2, 4F9/2, and 4I9/2 levels [34,35]. Finally, radiative transitions from 2H11/2, 4S3/2, 4F9/2, and 4I9/2 levels to the ground state level produce corresponding emissions as marked.
To the distinctly enhanced proportion of red luminescence after Yb3+ doping under 1532 nm excitation, following cross-relaxation energy transfer processes may be reasonable (Figure 3d): ET1, 4I11/2 (Er3+) + 2F7/2 (Yb3+) → 4I15/2 (Er3+) + 2F5/2 (Yb3+); ET2, 4S3/2 (Er3+) + 2F7/2 (Yb3+) → 4I13/2 (Er3+) + 2F5/2 (Yb3+); ET3, 4I13/2 (Er3+) + 2F5/2 (Yb3+) → 4F9/2 (Er3+) + 2F7/2 (Yb3+). Energy transfer from Er3+ to Yb3+ is a prerequisite for Yb3+ participating in the energy processes and subsequently affecting the populations of Er3+ at green and red emission levels. ET1 is likely to occur due to the highly resonant energy levels involved [36,37]. ET2 may also happen with the assistance of lattice phonon [38,39]. These energy transfer processes from Er3+ to Yb3+ could be verified by the gradually shortened lifetime of the green emission level 4S3/2 from 15.5 to 2.0 μs as increasing Yb3+ concentrations (Figure 3e), because these processes could suppress the population of Er3+ at 4S3/2 level directly (ET2) or indirectly (ET1, which deactivates 4I11/2 level thus affects the population of the higher level 4S3/2). The lifetime of the red emission level 4F9/2 should also be shortened due to the energy transfer from Er3+ to Yb3+, but there is a distinctly different trend at low Yb3+ concentrations of 0–8% (Figure 3f). This incipient upward trend indicates a further energy transfer from Yb3+ to Er3+, promoting the population of Er3+ at red emission level 4F9/2. So, ET3 probability takes place because Er3+ ions are prone to reach 4I13/2 levels by GSA processes [40]. The ultimate shortening in the lifetimes of red emission level 4F9/2 could be attributed to the suppressed energy transfer from Yb3+ to Er3+, which is due to the excitation energy loss caused by the concentration quenching effect at high Yb3+ concentrations. On the whole, these cross-relaxation energy transfer processes between Er3+ and Yb3+ shall boost the population of Er3+ ions at the 4F9/2 level and, thus, increase the red emission ratio.

2.3. Ratiometric Temperature Sensing Using Thermally Coupled Levels

The change in upconversion spectra with temperature suggests that NaYGeO4:Yb3+/Er3+ can be applied for ratiometric luminescent thermometry. As shown in Figure 4a,d and Figure S6, the upconversion luminescence intensity at different bands of NaYGeO4:18%Yb3+/2%Er3+ evidently reduces as increasing temperature from 295 to 823 K, excepting the noteless variation of 515–541 nm emission. Different change rates for different emission bands allow for ratiometric luminescent temperature sensing. We explored the ratiometric temperature sensing based on the well-known TCLs 2H11/2 and 4S3/2 of Er3+. The upconversion spectra in the green region normalized to 558 nm in Figure 4b,e distinctly show the gradually increased ratio for 515–541 nm emission (from 2H11/24I15/2 transitions of Er3+) relative to 541–575 nm emission (from 4S3/24I15/2 transition of Er3+), when increasing temperature from 295 to 823 K under both 980 and 1532 nm excitation. This could be ascribed to the thermally promoted population of Er3+ ions at the 2H11/2 level from 4S3/2 level following the Boltzmann distribution [41,42].
The corresponding LIR relying on the TCLs 2H11/2 and 4S3/2 at different temperature, T, can be usually determined by:
LIR = I 532 I 558 = C   exp ( Δ E k B T )
where I532 and I558 represent the integral emission intensity at 515–541 and 541–575 nm, respectively; C is a constant; ΔE is the energy gap between two emission levels 2H11/2 and 4S3/2; kB is the Boltzmann constant (1.3806 × 10⁻²³ J/K) [43,44,45]. Furthermore, Equation (1) can be mathematically transformed into Equation (2):
Ln   LIR = Ln C Δ E k B T
which reflects a simple linear relationship between Ln LIR and 1/T. Dependences of Ln LIR (I532/I558) against 1/T in Figure 4c,f are perfectly linear relationships, being fitted well by Equation 2 with high fitting coefficients of 0.9977 and 0.9990 for 980 and 1532 nm excitation, respectively. Detailed fitting equations have been included in Figure 4c,f, and it is clear that different excitation wavelengths give highly similar mathematical relationships between LIR (I532/I558) and temperature. The ΔE values between 2H11/2 and 4S3/2 levels were calculated as 709.6 and 713.6 cm−1 for 980 and 1532 nm excitation, respectively. These values agree with those usually reported in previous works of about 600–900 cm−1 [46]. Above analyses indicate that LIRs of TCLs under both 980 and 1532 nm excitation show excellent mathematical relationships with temperature in a wide range of 295–823 K, which suggests a promising application of synthesized NaYGeO4:Yb3+/Er3+ for temperature sensing.
In order to evaluate the thermometric sensitivity, the absolute sensitivity (Sa) and relative sensitivity (Sr), reflecting the change rate of the parameter LIR with temperature, were quantified using the following equations [47]:
S a = dLIR d T =   LIR   Δ E   k B T 2
S r = 1 LIR · dLIR d T 100 % = Δ E   k B T 2   100 %
For LIR (I532/I558) of NaYGeO4:18%Yb3+/2%Er3+ under both 980 and 1532 nm excitation, obtained Sa values first increase and then decrease, while Sr values decrease continuously (Figure 5a,d). The optimal Sr are 1.17% and 1.18% K−1 for 980 and 1532 nm excitation, respectively. These are two very close results owing to the highly similar change trends in LIR (I532/I558) with temperature under 980 and 1532 nm excitation, as presented above in Figure 4c,f. Another important performance parameter of a thermometric method is the temperature uncertainty (δT), which was calculated by the following equation:
δ T = 1 S r δ LIR LIR
where δLIR/LIR is the relative uncertainty of obtained LIR [48]. The value of δLIR/LIR was determined by several measurements at 298 K. The calculated δT increases continuously with temperature increasing under both 980 and 1532 nm excitation (Figure 5b,e), and the minimal values are 0.20 and 0.14 K, respectively. Moreover, periodic tests of two heating–cooling cycles in Figure 5c,f show excellent repeatability of LIR (I532/I558) at a range of selected temperatures, implying a reliable ratiometric temperature sensing method. These results, as summarized in Table 1, demonstrate a little effect of changing excitation wavelength on the performance of TCL-based thermometry, which is because different excitation wavelengths mainly affect the population routes of green and red emission levels rather than TCLs, as discussed in the above luminescent mechanism section.

3. Materials and Methods

3.1. Materials

Reagents including sodium carbonate (Na2CO3, 99.5%), yttrium oxide (Y2O3, 99.99%), germanium oxide (GeO2, 99.99%), ytterbium oxide (Yb2O3, 99.99%), and erbium oxide (Er2O3, 99.99%), were all purchased from Shanghai Aladdin Biochemical Technology Co., Ltd., (Shanghai, China). These raw materials without any purification were directly used for synthesis.

3.2. Synthesis

NaYGeO4:Yb3+/Er3+ samples were synthesized by the high-temperature solid-state method. Dopants Yb3+ and Er3+ were intendedly introduced to replace Y3+, and all the doping concentrations are molar percentages in this work. In a typical process, raw materials including Na2CO3, Y2O3, GeO2, Yb2O3, and Er2O3, were weighed accurately according to the stoichiometry ratio. The mixture of raw materials was fully ground with an agate mortar, and then transferred into an aluminum oxide crucible and placed in a furnace at 800 ℃ in atmosphere for 12 h pre-sintering. The obtained powder was ground again and sintered at 1200 ℃ in atmosphere for 12 h. All the heating and cooling rates were 5 ℃/min. After cooling to room temperature, the resulting sample was ground again for 10 min and collected for later use.

3.3. Characterization

Powder X-ray diffraction patterns of obtained samples were acquired on a D8 Advance diffractometer (Bruker, Karlsruhe, Germany) with Cu Kα radiation as the incident beam, with 2θ range of 10–75°, step angle of 0.01°, and dwell time of 0.2 s. X-ray photoelectron spectroscopy (XPS) results were collected on an XPS Microprobe (Thermo SCIENTIFIC ESCALAB Xi+, Waltham, MA, USA). Morphology and the energy-dispersive X-ray spectroscopy (EDS) characterization were conducted on a Field Emission Scanning Electron Microscope (Zeiss Merlin, Oberkochen, Germany). Upconversion luminescence spectra were measured on a FLS1000 fluorescent spectrometer (Edinburgh, Livingston, UK) with CW 980 and 1532 nm diode lasers (Changchun New Industries Optoelectronics Technology Co., Ltd., Changchun, China) as excitation sources. The upconversion luminescence spectra at 295–823 K were collected on the same spectrometer equipped with a HCP621G gas-tight thermal plate (Instec, Bergen, Norway).

4. Conclusions

In summary, excitation controlled multicolor upconversion has been realized in NaYGeO4:Yb3+/Er3+ phosphors. The traditional 980 nm NIR-I excitation produces bright green luminescence, whereas 1532 nm NIR-II excitation leads to distinct yellow/orange–yellow emission. Mechanistic analyses revealed Yb3+ induced cross-relaxation energy transfers that accelerate the generation of Er3+ at red emission level under 1532 nm excitation. Temperature-dependent upconversion luminescence studies established a ratiometric thermometry relying on the TCLs (2H11/2 and 4S3/2) of Er3+, under multi-wavelength excitations of 980 and 1532 nm. It was found that switching excitation wavelength has a very small effect on the performance of TCL-based thermometry. Finally, high relative sensitivity up to 1.18% K−1, low uncertainty as low as 0.14 K, and a wide working temperature range of 295–823 K were achieved. These results provide a novel but simple material, NaYGeO4:Yb3+/Er3+, allowing not only excitation wavelength controlled multicolor upconversion luminescence in a fixed material but also excellent ratiometric luminescence thermometry.

Supplementary Materials

The following supporting information can be downloaded at: https://www.mdpi.com/article/10.3390/molecules29204887/s1, Figure S1: Rietveld refinement results of XRD patterns of NaYGeO4:xYb3+/2%Er3+ microcrystals, x = 2–48%; Figure S2: SEM images of NaYGeO4:xYb3+/2%Er3+ microcrystals, x = 2–48%; Figure S3: Variation of detected Yb concentration on Yb3+ doping concentration; Figure S4: (a,c) Upconversion emission spectra and (b,d) corresponding integral intensity evolutions with increased Er3+ concentrations of NaYGeO4:18%Yb3+/yEr3+, y = 1–8%, under (a,b) 980 and (c,d) 1532 nm laser excitation; Figure S5: The double logarithmic plots of the integral intensities for 515–570, 634–705, and 783–826 nm upconversion emissions of NaYGeO4:xYb3+/2%Er3+ microcrystals: (a–c) 980 nm excitation, (d–f) 1532 nm excitation; Figure S6: Temperature dependences (295–823 K) of integral intensities for 515–541, 541–570, 634–705, and 783–826 nm upconversion emissions of NaYGeO4:18%Yb3+/2%Er3+ microcrystals, under (a) 980 and (b) 1532 nm excitation; Table S1: Rietveld refinement data of XRD patterns for NaYGeO4:xYb3+/2%Er3+ microcrystals, x = 2–48%; Table S2: Detected atomic percentages by EDS spectra of NaYGeO4:xYb3+/2%Er3+ microcrystals, x = 2–48%; A crystallographic information file of NaYGeO4.

Author Contributions

Methodology, H.Z., X.Z., X.B. and Z.L.; validation, H.Z. and Y.W.; resources, Y.W.; data curation, H.Z. and Y.W.; writing—original draft preparation, Y.W.; writing—review and editing, H.L.; supervision, Y.W.; project administration, Y.W. and H.L.; funding acquisition, Y.W. All authors have read and agreed to the published version of the manuscript.

Funding

This research was funded by the Natural Science Foundation of Shandong Province (grant number ZR2021QA057).

Institutional Review Board Statement

Not applicable.

Informed Consent Statement

Not applicable.

Data Availability Statement

Data are available from authors upon reasonable requirement.

Conflicts of Interest

The authors declare no conflicts of interest.

References

  1. Du, P.; Wei, Y.; Liang, Y.; An, R.; Liu, S.; Lei, P.; Zhang, H. Near-Infrared-Responsive Rare Earth Nanoparticles for Optical Imaging and Wireless Phototherapy. Adv. Sci. 2023, 11, 2305308. [Google Scholar] [CrossRef] [PubMed]
  2. Malhotra, K.; Hrovat, D.; Kumar, B.; Qu, G.; Houten, J.V.; Ahmed, R.; Piunno, P.A.E.; Gunning, P.T.; Krull, U.J. Lanthanide-Doped Upconversion Nanoparticles: Exploring A Treasure Trove of NIR-Mediated Emerging Applications. ACS Appl. Mater. Interfaces 2023, 15, 2499–2528. [Google Scholar] [CrossRef] [PubMed]
  3. Zheng, B.; Fan, J.; Chen, B.; Qin, X.; Wang, J.; Wang, F.; Deng, R.; Liu, X. Rare-Earth Doping in Nanostructured Inorganic Materials. Chem. Rev. 2022, 122, 5519–5603. [Google Scholar] [CrossRef]
  4. Huang, J.; Yan, L.; Liu, S.; Tao, L.; Zhou, B. Expanding the toolbox of photon upconversion for emerging frontier applications. Mater. Horiz. 2022, 9, 1167–1195. [Google Scholar] [CrossRef]
  5. Wang, Y.; Zheng, K.; Song, S.; Fan, D.; Zhang, H.; Liu, X. Remote manipulation of upconversion luminescence. Chem. Soc. Rev. 2018, 47, 6473–6485. [Google Scholar] [CrossRef] [PubMed]
  6. Wang, Y.; Zhou, J.; Gao, J.; Zhang, K.; Gao, C.; Xie, X.; Huang, L. Physical Manipulation of Lanthanide-Activated Photoluminescence. Ann. Phys. 2019, 531, 1900026. [Google Scholar] [CrossRef]
  7. Cheng, X.; Zhou, J.; Yue, J.; Wei, Y.; Gao, C.; Xie, X.; Huang, L. Recent Development in Sensitizers for Lanthanide-Doped Upconversion Luminescence. Chem. Rev. 2022, 122, 15998–16050. [Google Scholar] [CrossRef]
  8. Zhang, Z.; Zhang, Y. Orthogonal Emissive Upconversion Nanoparticles: Material Design and Applications. Small 2021, 17, 2004552. [Google Scholar] [CrossRef]
  9. Wen, H.; Zhu, H.; Chen, X.; Hung, T.F.; Wang, B.; Zhu, G.; Yu, S.F.; Wang, F. Upconverting near-infrared light through energy management in core-shell-shell nanoparticles. Angew. Chem. Int. Ed. 2013, 52, 13419–13423. [Google Scholar] [CrossRef]
  10. Li, X.; Guo, Z.; Zhao, T.; Lu, Y.; Zhou, L.; Zhao, D.; Zhang, F. Filtration Shell Mediated Power Density Independent Orthogonal Excitations-Emissions Upconversion Luminescence. Angew. Chem. Int. Ed. 2016, 55, 2464–2469. [Google Scholar] [CrossRef]
  11. Zhang, Z.; Jayakumar, M.K.G.; Zheng, X.; Shikha, S.; Zhang, Y.; Bansal, A.; Poon, D.J.J.; Chu, P.L.; Yeo, E.L.L.; Chua, M.L.K.; et al. Upconversion superballs for programmable photoactivation of therapeutics. Nat. Commun. 2019, 10, 4586. [Google Scholar] [CrossRef] [PubMed]
  12. Zhang, Z.; Jayakumar, M.K.G.; Shikha, S.; Zhang, Y.; Zheng, X.; Zhang, Y. Modularly Assembled Upconversion Nanoparticles for Orthogonally Controlled Cell Imaging and Drug Delivery. ACS Appl. Mater. Interfaces 2020, 12, 12549–12556. [Google Scholar] [CrossRef] [PubMed]
  13. Lei, Z.; Ling, X.; Mei, Q.; Fu, S.; Zhang, J.; Zhang, Y. An Excitation Navigating Energy Migration of Lanthanide Ions in Upconversion Nanoparticles. Adv. Mater. 2020, 32, 1906225. [Google Scholar] [CrossRef] [PubMed]
  14. Mei, Q.; Bansal, A.; Jayakumar, M.K.G.; Zhang, Z.; Zhang, J.; Huang, H.; Yu, D.; Ramachandra, C.J.A.; Hausenloy, D.J.; Soong, T.W.; et al. Manipulating energy migration within single lanthanide activator for switchable upconversion emissions towards bidirectional photoactivation. Nat. Commun. 2019, 10, 4416. [Google Scholar] [CrossRef] [PubMed]
  15. Johnson, N.J.; He, S.; Diao, S.; Chan, E.M.; Dai, H.; Almutairi, A. Direct Evidence for Coupled Surface and Concentration Quenching Dynamics in Lanthanide-Doped Nanocrystals. J. Am. Chem. Soc. 2017, 139, 3275–3282. [Google Scholar] [CrossRef]
  16. Cheng, X.; Pan, Y.; Yuan, Z.; Wang, X.; Su, W.; Yin, L.; Xie, X.; Huang, L. Er3+ Sensitized Photon Upconversion Nanocrystals. Adv. Funct. Mater. 2018, 28, 1800208. [Google Scholar] [CrossRef]
  17. Chen, Q.; Xie, X.; Huang, B.; Liang, L.; Han, S.; Yi, Z.; Wang, Y.; Li, Y.; Fan, D.; Huang, L.; et al. Confining Excitation Energy in Er3+-Sensitized Upconversion Nanocrystals through Tm3+ Mediated Transient Energy Trapping. Angew. Chem. Int. Ed. 2017, 56, 7605–7609. [Google Scholar] [CrossRef]
  18. Cheng, X.; Ge, H.; Wei, Y.; Zhang, K.; Su, W.; Zhou, J.; Yin, L.; Zhan, Q.; Jing, S.; Huang, L. Design for Brighter Photon Upconversion Emissions via Energy Level Overlap of Lanthanide Ions. ACS Nano 2018, 12, 10992–10999. [Google Scholar] [CrossRef]
  19. Zhao, J.; Chang, J.; Wang, N.; Zhao, P.; Zhu, M.; Liu, Y.; Guo, D.; Wang, Y.; Li, P.; Wang, Z.; et al. Thermal Enhancement of Er3+ NIR-II Luminescence by Ho3+-Mediated Energy-Trapping in Negative Thermal Expansion Nanocrystals. Laser Photonics Rev. 2024, 2400151, online version of record. [Google Scholar] [CrossRef]
  20. Liu, X.; Liu, T.; Tu, L.; Zuo, J.; Li, J.; Feng, Y.; Yao, C.J. Enhancing NIR-II Upconversion Monochromatic Emission for Temperature Sensing. Small 2024, 20, 2308748. [Google Scholar] [CrossRef]
  21. Bi, S.; Deng, Z.; Huang, J.; Wen, X.; Zeng, S. NIR-II Responsive Upconversion Nanoprobe with Simultaneously Enhanced Single-Band Red Luminescence and Phase/Size Control for Bioimaging and Photodynamic Therapy. Adv. Mater. 2023, 35, 2207038. [Google Scholar] [CrossRef] [PubMed]
  22. Tang, J.; Chen, L.; Li, J.; Wang, Z.; Zhang, J.; Zhang, L.; Luo, Y.; Wang, X. Selectively enhanced red upconversion luminescence and phase/size manipulation via Fe3+ doping in NaYF4:Yb,Er nanocrystals. Nanoscale 2015, 7, 14752–14759. [Google Scholar] [CrossRef]
  23. Lyu, T.; Dorenbos, P. Vacuum-Referred Binding Energies of Bismuth and Lanthanide Levels in ARE(Si,Ge)O4 (A = Li, Na; RE = Y, Lu): Toward Designing Charge-Carrier-Trapping Processes for Energy Storage. Chem. Mater. 2020, 32, 1192–1209. [Google Scholar] [CrossRef]
  24. Zhao, W.; Feng, X.; Fan, B. Novel color tunable phosphors NaYGeO4:Tm3+, Tb3+, Eu3+ for ultraviolet excited white LEDs with good thermal stability. J. Mater. Sci. Mater. Electron. 2020, 31, 14434–14442. [Google Scholar] [CrossRef]
  25. Lyu, T.; Dorenbos, P.; Li, C.; Li, S.; Xu, J.; Wei, Z. Unraveling electron liberation from Bi2+ for designing Bi3+-based afterglow phosphor for anti-counterfeiting and flexible X-ray imaging. Chem. Eng. J. 2022, 435, 135038. [Google Scholar] [CrossRef]
  26. Wang, E.; Feng, K.; Li, J.; Zhou, X.; Sun, X. Luminescence characteristics of NaYGeO4:Bi3+/Tb3+/Eu3+ phosphors. J. Lumin. 2022, 250, 119108. [Google Scholar] [CrossRef]
  27. Melentsova, A.A.; Lipina, O.A.; Melkozerova, M.A.; Enyashin, A.N.; Chufarov, A.Y.; Tyutyunnik, A.P.; Zubkov, V.G. Infrared luminescence properties and energy transfer mechanism in NaYGeO4:Tm3+ powders. Ceram. Int. 2024, 50, 18681–18688. [Google Scholar] [CrossRef]
  28. Fan, B.; Zhou, W.; Qi, S.; Zhao, W. Eu3+-doped NaYGeO4: A novel red-emitting phosphors for ultraviolet or blue chips excited white LEDs. J. Solid State Chem. 2020, 283, 121158. [Google Scholar] [CrossRef]
  29. Ma, J.; Li, Y.; Hu, W.; Wang, W.; Zhang, J.; Yang, J.; Wang, Y. A terbium activated multicolour photoluminescent phosphor for luminescent anticounterfeiting. J. Rare Earths 2020, 38, 1039–1043. [Google Scholar] [CrossRef]
  30. Zhang, J.; Liu, B.; Dai, Y.; Han, B. Synthesis and luminescence properties of novel host-sensitized germanate phosphors NaYGeO4:Ln (Ln = Eu3+, Sm3+, Dy3+). Optik 2020, 203, 163944. [Google Scholar] [CrossRef]
  31. SHANNON, R.D. Revised effective ionic radii and systematic studies of interatomie distances in halides and chaleogenides. Acta Cryst. 1976, 32, 751–767. [Google Scholar] [CrossRef]
  32. Tu, L.; Liu, X.; Wu, F.; Zhang, H. Excitation energy migration dynamics in upconversion nanomaterials. Chem. Soc. Rev. 2015, 44, 1331–1345. [Google Scholar] [CrossRef]
  33. Liu, X.; Deng, R.; Zhang, Y.; Wang, Y.; Chang, H.; Huang, L.; Liu, X. Probing the nature of upconversion nanocrystals: Instrumentation matters. Chem. Soc. Rev. 2015, 44, 1479–1508. [Google Scholar] [CrossRef] [PubMed]
  34. Zheng, K.; Han, S.; Zeng, X.; Wu, Y.; Song, S.; Zhang, H.; Liu, X. Rewritable Optical Memory Through High-Registry Orthogonal Upconversion. Adv. Mater. 2018, 30, 1801726. [Google Scholar] [CrossRef]
  35. Ryszczyńska, S.; Trejgis, K.; Marciniak, Ł.; Grzyb, T. Upconverting SrF2:Er3+ Nanoparticles for Optical Temperature Sensors. ACS Appl. Nano Mater. 2021, 4, 10438–10448. [Google Scholar] [CrossRef]
  36. Zhou, B.; Yan, L.; Huang, J.; Liu, X.; Tao, L.; Zhang, Q. NIR II-responsive photon upconversion through energy migration in an ytterbium sublattice. Nat. Photonics 2020, 14, 760–766. [Google Scholar] [CrossRef]
  37. Wang, H.; Xu, Y.; Pang, T.; Chen, B.; Xin, F.; Xing, M.; Tian, M.; Fu, Y.; Luo, X.; Tian, Y. Engineering Er3+-sensitized nanocrystals to enhance NIR II-responsive upconversion luminescence. Nanoscale 2022, 14, 962–968. [Google Scholar] [CrossRef] [PubMed]
  38. Dong, H.; Sun, L.D.; Wang, Y.F.; Ke, J.; Si, R.; Xiao, J.W.; Lyu, G.M.; Shi, S.; Yan, C.H. Efficient Tailoring of Upconversion Selectivity by Engineering Local Structure of Lanthanides in NaxREF3+x Nanocrystals. J. Am. Chem. Soc. 2015, 137, 6569–6576. [Google Scholar] [CrossRef] [PubMed]
  39. Wang, Y.; Li, H.; Ma, H.; Huang, L. Colour modulation and enhancement of upconversion emissions in K2NaScF6:Yb/Ln (Ln = Er, Ho, Tm) nanocrystals. J. Rare Earths 2021, 39, 1477–1483. [Google Scholar] [CrossRef]
  40. Xiao, Q.; Dong, X.; Yin, X.; Wang, H.; Zhong, H.; Dong, B.; Luo, X. Dual-color up-conversion luminescence and temperature sensing of novel Na3Y(VO4)2: Yb3+, Er3+ phosphor under multi-wavelength excitation. Mater. Res. Bull. 2021, 141, 111326. [Google Scholar] [CrossRef]
  41. Ramos, T.J.S.; Longo, R.L.; Brites, C.D.S.; Ferreira, R.A.S.; Malta, O.L.; Carlos, L.D. Exploring the intra-4f and the bright white light upconversion emissions of Gd2O3:Yb3+,Er3+-based materials for thermometry. Nanoscale 2023, 15, 9993–10003. [Google Scholar] [CrossRef] [PubMed]
  42. Brites, C.D.S.; Balabhadra, S.; Carlos, L.D. Lanthanide-Based Thermometers: At the Cutting-Edge of Luminescence Thermometry. Adv. Opt. Mater. 2019, 7, 1801239. [Google Scholar] [CrossRef]
  43. Zhu, J.; Yang, T.; Li, H.; Xiang, Y.; Song, R.; Zhang, H.; Wang, B. Improving the up/down-conversion luminescence via cationic substitution and dual-functional temperature sensing properties of Er3+ doped double perovskites. Chem. Eng. J. 2023, 471, 144550. [Google Scholar] [CrossRef]
  44. Wang, Y.; Pan, Y.; Ma, Y.; Sun, X.; Zhang, Y.; Li, H. Simultaneous evolutions in composition, structure, morphology, and upconversion luminescence of BiOxFy:Yb/Er microcrystals and their application for ratiometric temperature sensing. J. Alloys Compd. 2024, 992, 174596. [Google Scholar] [CrossRef]
  45. Brites, C.D.S.; Marin, R.; Suta, M.; Carneiro Neto, A.N.; Ximendes, E.; Jaque, D.; Carlos, L.D. Spotlight on Luminescence Thermometry: Basics, Challenges, and Cutting-Edge Applications. Adv. Mater. 2023, 35, 2302749. [Google Scholar] [CrossRef]
  46. Wang, C.; Jin, Y.; Zhang, R.; Yao, Q.; Hu, Y. A review and outlook of ratiometric optical thermometer based on thermally coupled levels and non-thermally coupled levels. J. Alloys Compd. 2022, 894, 162494. [Google Scholar] [CrossRef]
  47. Jia, M.; Sun, Z.; Zhang, M.; Xu, H.; Fu, Z. What determines the performance of lanthanide-based ratiometric nanothermometers? Nanoscale 2020, 12, 20776–20785. [Google Scholar] [CrossRef]
  48. Savchuk, O.A.; Carvajal, J.J.; Brites, C.D.S.; Carlos, L.D.; Aguilo, M.; Diaz, F. Upconversion thermometry: A new tool to measure the thermal resistance of nanoparticles. Nanoscale 2018, 10, 6602–6610. [Google Scholar] [CrossRef]
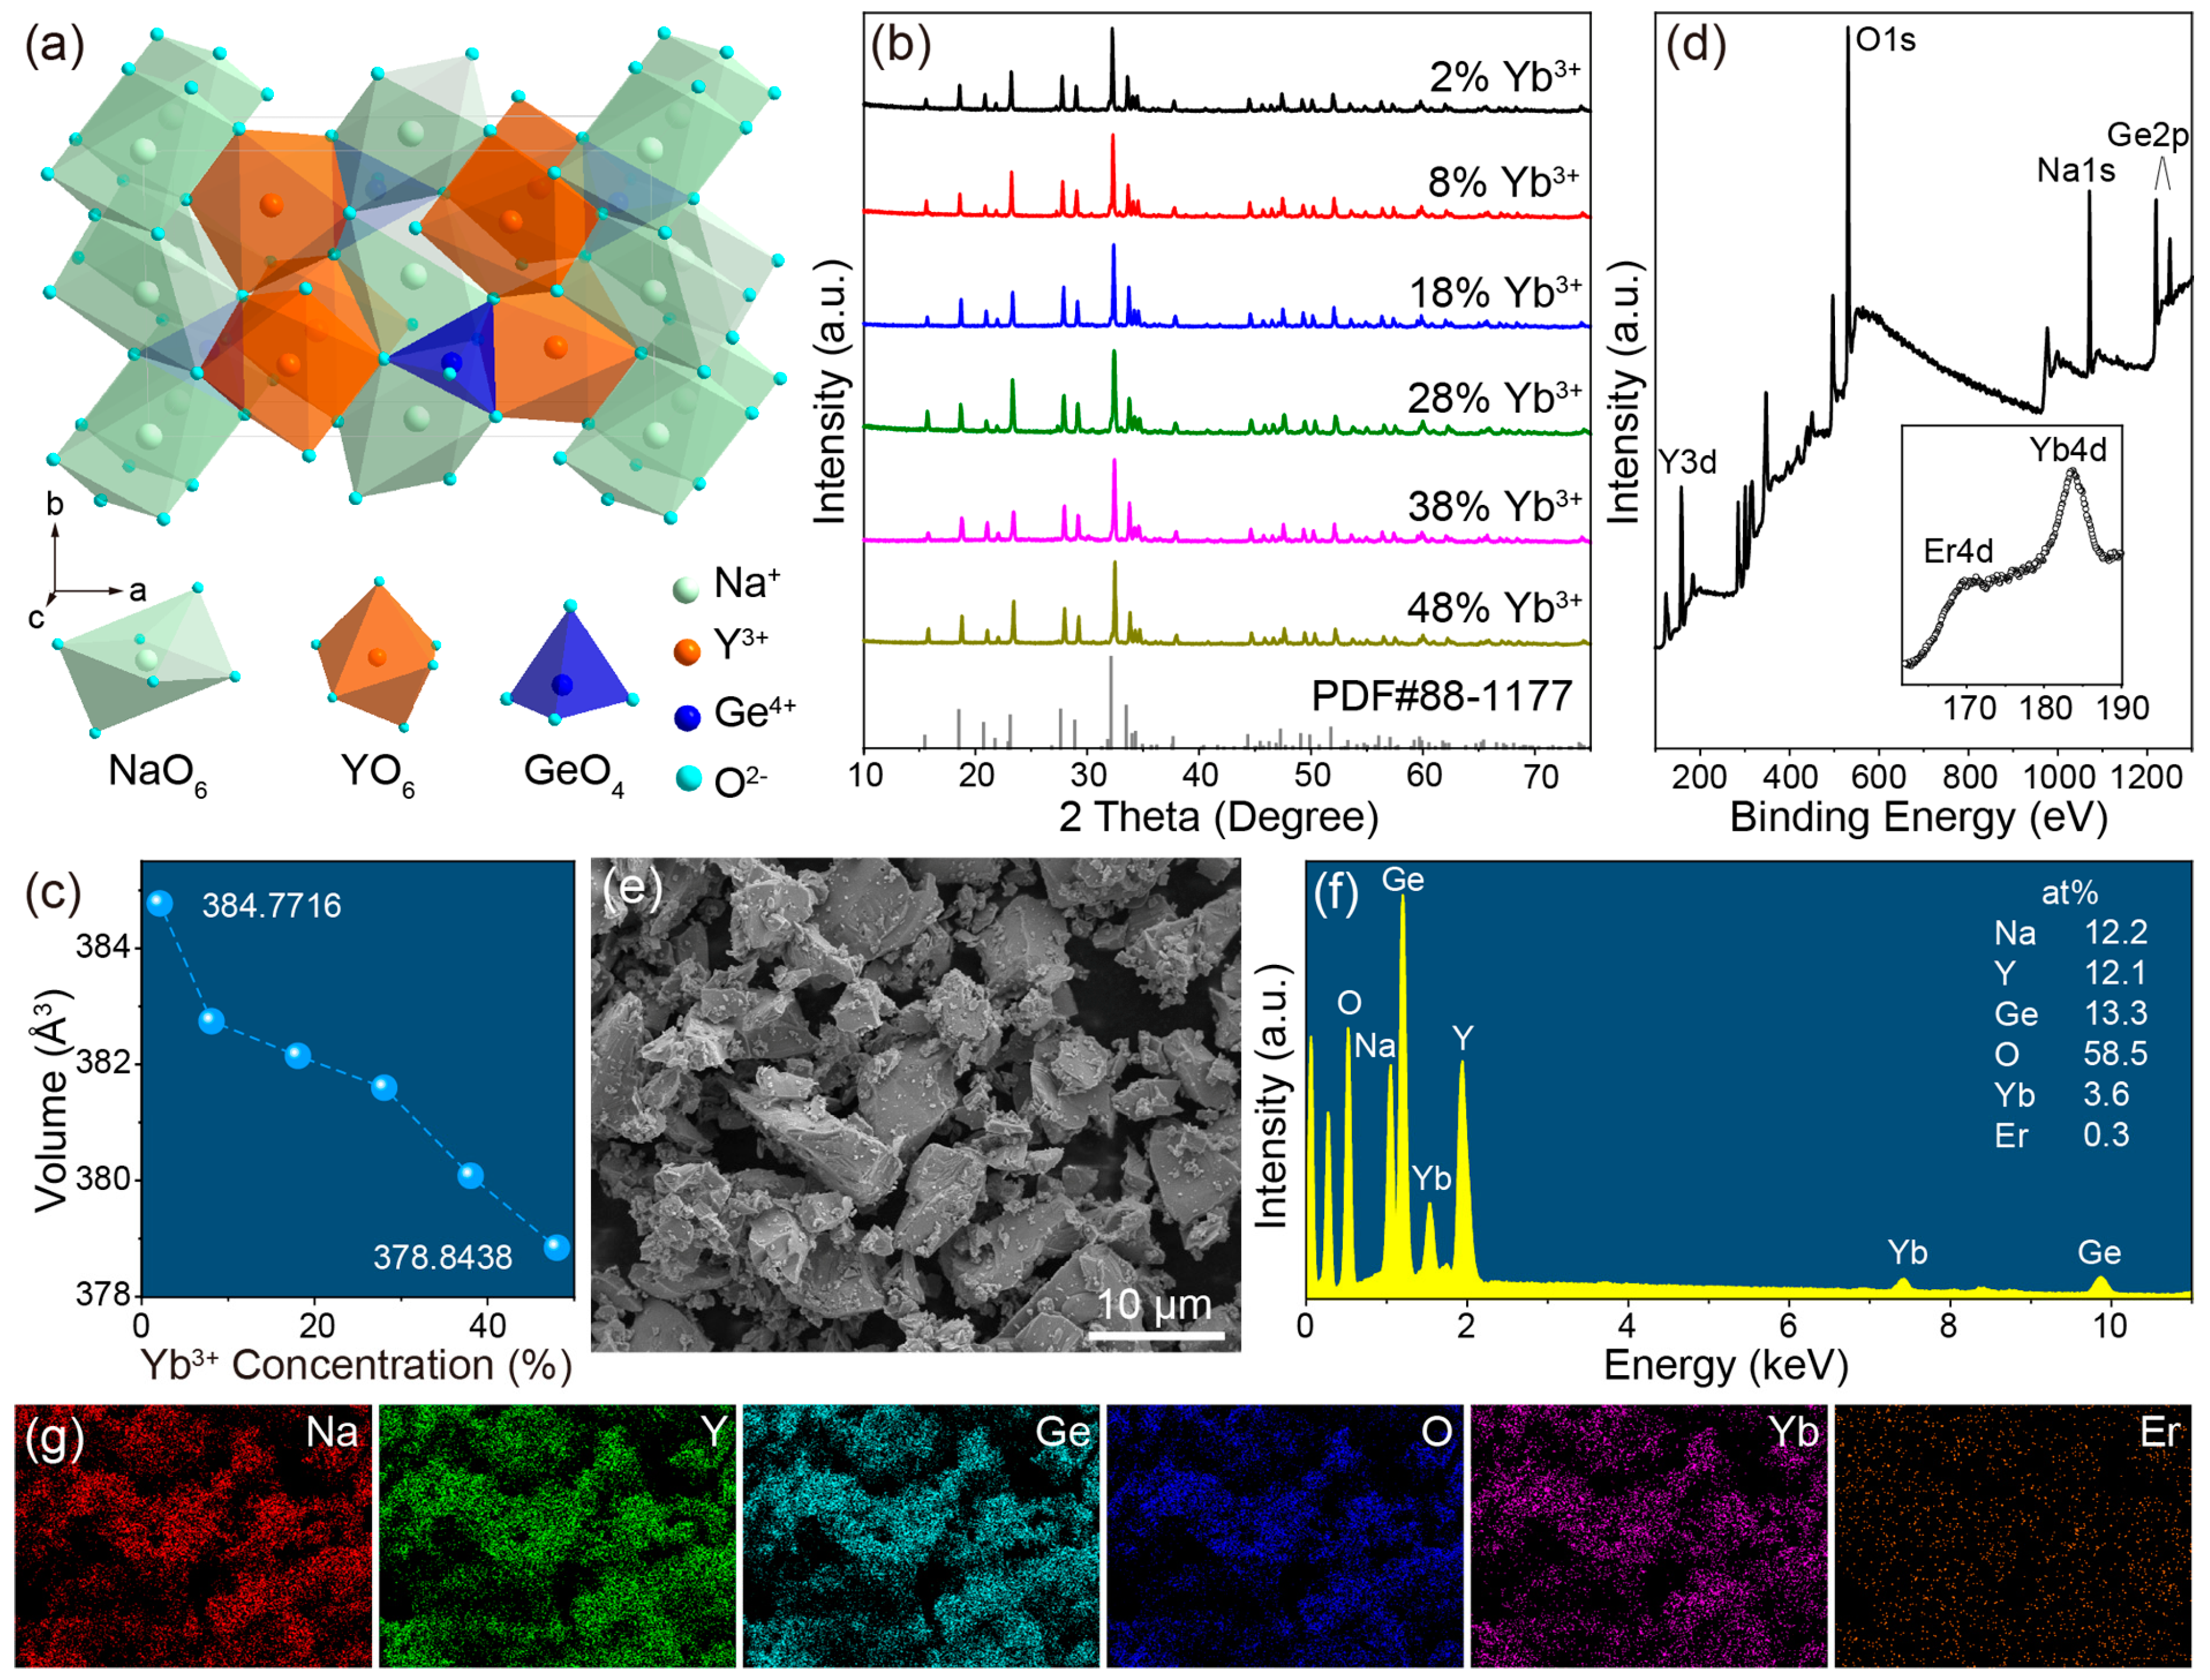
Figure 1. (a) Crystal structure of NaYGeO4 and the coordination polyhedra of NaO6, YO6, and GeO4. (b) XRD patterns of NaYGeO4:xYb3+/2%Er3+ microcrystals, x = 2–48%. The bar-like diffraction patterns at the bottom represent the standard data of orthorhombic NaYGeO4 (PDF#88–1177). (c) Unit cell volume calculated from Rietveld refinement results as a function of Yb3+ doping concentration. (d) XPS spectrum, (e) SEM image, and (f) EDS spectrum of NaYGeO4:18%Yb3+/2%Er3+. The inset in (d) is the high-resolution XPS spectrum in the range of 165–190 eV. (g) Elemental mappings corresponding to the SEM image in (e).
Molecules 29 04887 g001
Figure 2. (a) Upconversion emission spectra of NaYGeO4:18%Yb3+/2%Er3+, under 980 and 1532 nm laser excitation. The integral intensity evolutions of 515–570, 634–705, and 783–826 nm emissions for NaYGeO4: xYb3+/2%Er3+ at increased Yb3+ concentrations, under (b) 980 and (c) 1532 nm excitation. (d) The upconversion red/green ratios and (e) luminescence photographs of NaYGeO4:xYb3+/2%Er3+ at increased Yb3+ concentrations under 980 and 1532 nm excitation.
Molecules 29 04887 g002
Figure 3. Upconversion emission spectra of NaYGeO4:18%Yb3+/2%Er3+ and NaYGeO4:2%Er3+, under (a) 980 and (b) 1532 nm excitation. Schematic upconversion luminescence mechanisms of NaYGeO4:Yb3+/Er3+ with (c) 980 and (d) 1532 nm excitation. Decay curves of NaYGeO4: xYb3+/2%Er3+ under 1532 nm excitation at (e) 558 and (f) 660 nm emissions; the insets show the calculated lifetimes as a function of Yb3+ concentration.
Molecules 29 04887 g003
Figure 4. (a,d) Upconversion luminescence spectra, (b,e) normalized green upconversion spectra, and (c,f) calculated Ln LIR (I532/I558) of NaYGeO4:18%Yb3+/2%Er3+ in the temperature range of 295–823 K, under (ac) 980 and (df) 1532 nm excitation.
Molecules 29 04887 g004
Figure 5. (a,d) Absolute sensitivity, Sa, and relative sensitivity, Sr. (b,e) Temperature uncertainty δT relying on LIR (I532/I558) of NaYGeO4:18%Yb3+/2%Er3+ at different temperatures. (c,f) LIR (I532/I558) at selected temperatures for two heating–cooling cycles between 323 and 823 K. Under (ac) 980 and (df) 1532 nm excitation.
Molecules 29 04887 g005
Table 1. Main parameters including the temperature range, Sr, and δT of ratiometric thermometry using the upconversion luminescence from TCLs of NaYGeO4:18%Yb3+/2%Er3+.
Excitation
Wavelength (nm)
LIR UsedTemperature Range (K)Sr (% K−1)δT (K)
980I532/I558 (TCLs)295–8230.15–1.170.20–1.59
1532I532/I558 (TCLs)295–8230.15–1.180.14–1.12
Disclaimer/Publisher’s Note: The statements, opinions and data contained in all publications are solely those of the individual author(s) and contributor(s) and not of MDPI and/or the editor(s). MDPI and/or the editor(s) disclaim responsibility for any injury to people or property resulting from any ideas, methods, instructions or products referred to in the content.