Article

Theoretical Study on Vibrationally Resolved Electronic Spectra of Chiral Nanographenes

School of Chemistry and Chemical Engineering, Zhejiang Sci-Tech University, Hangzhou 310000, China
*
Author to whom correspondence should be addressed.
Molecules 2024, 29(17), 3999; https://doi.org/10.3390/molecules29173999
Submission received: 6 August 2024 / Revised: 19 August 2024 / Accepted: 22 August 2024 / Published: 23 August 2024

Abstract

:
Nanographenes are of increasing importance owing to their potential applications in the photoelectronic field. Meanwhile, recent studies have primarily focused on the pure electronic spectra of nanographenes, which have been found to be inadequate for describing the experimental spectra that contain vibronic progressions. In this study, we focused on the vibronic effect on the electronic transition of a range of chiral nanographenes, especially in the low-energy regions with distinct vibronic progressions, using theoretical calculations. All the calculations were performed at the PBE0-D3(BJ)/def2-TZVP level of theory, adopting both time-dependent and time-independent approaches with Franck–Condon approximation. The resulting calculated curves exhibited good alignment with the experimental data. Notably, for the nanographenes incorporating helicene units, owing to the increasing π-extension, the major vibronic modes in the vibrationally resolved spectra differed significantly from those of the primitive helicenes. This investigation suggests that calculations that account for the vibronic effect could have better reproducibility compared with calculations based solely on pure electronic transitions. We anticipate that this study could pave the way for further investigations into optical and chiroptical properties, with a deeper understanding of the vibronic effect, thereby providing theoretical explanations with higher precision on more sophisticated nanographenes.

1. Introduction

Nanographenes with atomically precise structures have emerged as pivotal candidates in photoelectronic devices [1,2,3,4], sensing [5,6], as well as single molecular devices [7]. Over the past decades, remarkable progress in synthetic methods has largely facilitated the creation of a rich array of structurally diverse nanographenes that possess unique physical and chemical properties [8,9,10,11,12,13]. Notably, nanographenes with helical [14,15], curved [16,17,18], or twisted configurations are attracting increasing scrutiny [19,20], as the non-planar designs of these molecules not only enhanced the solubility, but also imparted distinctive properties such as chirality [21], dynamic structures [22], or unique packing modes to the molecular skeletons [23]. For example, certain nanographenes reported recently contain one or multiple helicene units [24,25,26,27,28]. these structures, by integrating helicene chirality into the π-conjugated backbone, demonstrated pronounced electronic circular dichroism (ECD) and circularly polarized luminescence (CPL) signals, thereby highlighting a notably high CPL brightness (BCPL) [29,30,31]. Within this research domain, theoretical calculations are gaining increasing importance. Through the utilization of theoretical calculations, a comprehensive exploration of nanographene properties became possible, encompassing the synthetic mechanisms [32], interconversion barriers [33], aromaticity [34], electronic structures [35,36], as well as optical and chiroptical spectra [37,38].
The calculations on electronic spectra, including UV-vis absorption (ABS), emission (EMI), as well as their chiroptical correlatives ECD and CPL, reveal immense significance, as they not only assist in determining the configurations of diastereomers but also provide convincing evidence for assigning absolute configurations between enantiomers [39]. Additionally, they offer detailed insights into molecular excitations, thereby enabling the explanation of the experimental spectra and guiding the design of new nanographene structures with tunable optical properties. Meanwhile, in certain cases of nanographenes or smaller polycyclic arenes, owing to their rigid π-skeleton, the electronic spectra were found to be structured, showing several sharp peaks emerging closely. This could be attributed to the vibronic effect on electronic transitions. Taking a polycyclic arene benzo[ghi]perylene (BP) for example, the experimental ABS spectra showed that the curve contained four peaks at 386, 365, 347, and 330 nm [40]. These peaks could be ascribed to the vibronic progression of transition S1. However, according to the theoretical calculation of the pure electronic transition spectrum, only a single band could be simulated, which led to a significant deviation from the experimental result. Larger hexabenzocoronene (HBC) also showed similar ABS patterns with structured bands at low-energy regions [41]. Besides, their EMI spectra also exhibited structured curves in a similar manner. Such a phenomenon, caused by the vibronic influence on the electronic excitations, was revealed to be relatively obvious in large π-conjugated systems. However, in recent research, most spectral calculations solely focused on electronic excitations, overlooking the vibronic impact on the spectra. In certain cases, substantial disparities between the experimental and calculated spectra could be observed, especially in the low-energy regions, which brought obstacles in analyzing their optical and chiroptical properties.
Recently, a series of investigations exploring the vibrationally resolved spectra have focused on simple π-conjugated molecules [42,43,44]. Notably, investigations into several planar compounds have yielded impressive predictions of their optical spectra [40]. Later, in the domain of chiroptical spectra, research on helicenes and their derivatives has also shown strong agreement with both the optical and chiroptical spectra [39,42,43,44]. However, to the best of our knowledge, theoretical calculations regarding the vibrationally resolved optical and chiroptical spectra of chiral nanographenes remain unexplored. In this study, we delve into a series of chiral nanographenes that we have previously synthesized and investigated experimentally (Figure 1) [45]. These compounds showed structured optical and chiroptical electronic spectra, which could serve as valuable objects for studies on vibrationally resolved spectra. The results showed good agreement between the experimental and calculated ABS, EMI, ECD, and CPL spectra after considering the vibronic effect. We anticipate that this study will open up new research avenues in exploring the structure–property relationships of nanographenes with the assistance of theoretical calculations, thereby ultimately guiding the design of innovative nanographene structures with tunable optical and chiroptical properties.

2. Results and Discussion

In this study, we have primarily investigated nanographenes O7H (the oxidized product of [7] helicene 7H via an oxidative rearrangement), O8H (oxidized from [8] helicene 8H), O9H (oxidized from [9] helicene 9H), OO7H (oxidized from O7H), and OO9H (oxidized from O9H) (Figure 1), which we have synthesized via oxidative cyclo-rearrangement and have studied experimentally previously [45]. From the experimental electronic spectra, these nanographenes show a significant vibronic effect in both ABS and EMI spectra. Besides, the enantiomers of O8H and O9H also exhibit structured ECD and CPL spectra with vibronic progression. In contrast, our previous theoretical calculations primarily focused on the pure ABS and ECD spectra of these compounds. Thus, a significant discrepancy has been observed between the experimental and calculated spectra, especially in the low-energy region, primarily due to the strong vibronic effect on the electronic transitions [46]. Besides, investigations into the excited states of these molecules have also been conducted. Therefore, we focus on the vibronic impact on the low-energy region of these compounds; we simulate their ABS and EMI spectra for all five compounds and ECD and CPL spectra for the enantiomers of O8H and O9H, which are involved in the report. In addition, Refs. [5,6,7] helicenes (5H to 7H), as well as BP, have also been studied theoretically in this research for comparison.

2.1. Pure Electronic Transition of O7H, O8H, and O9H

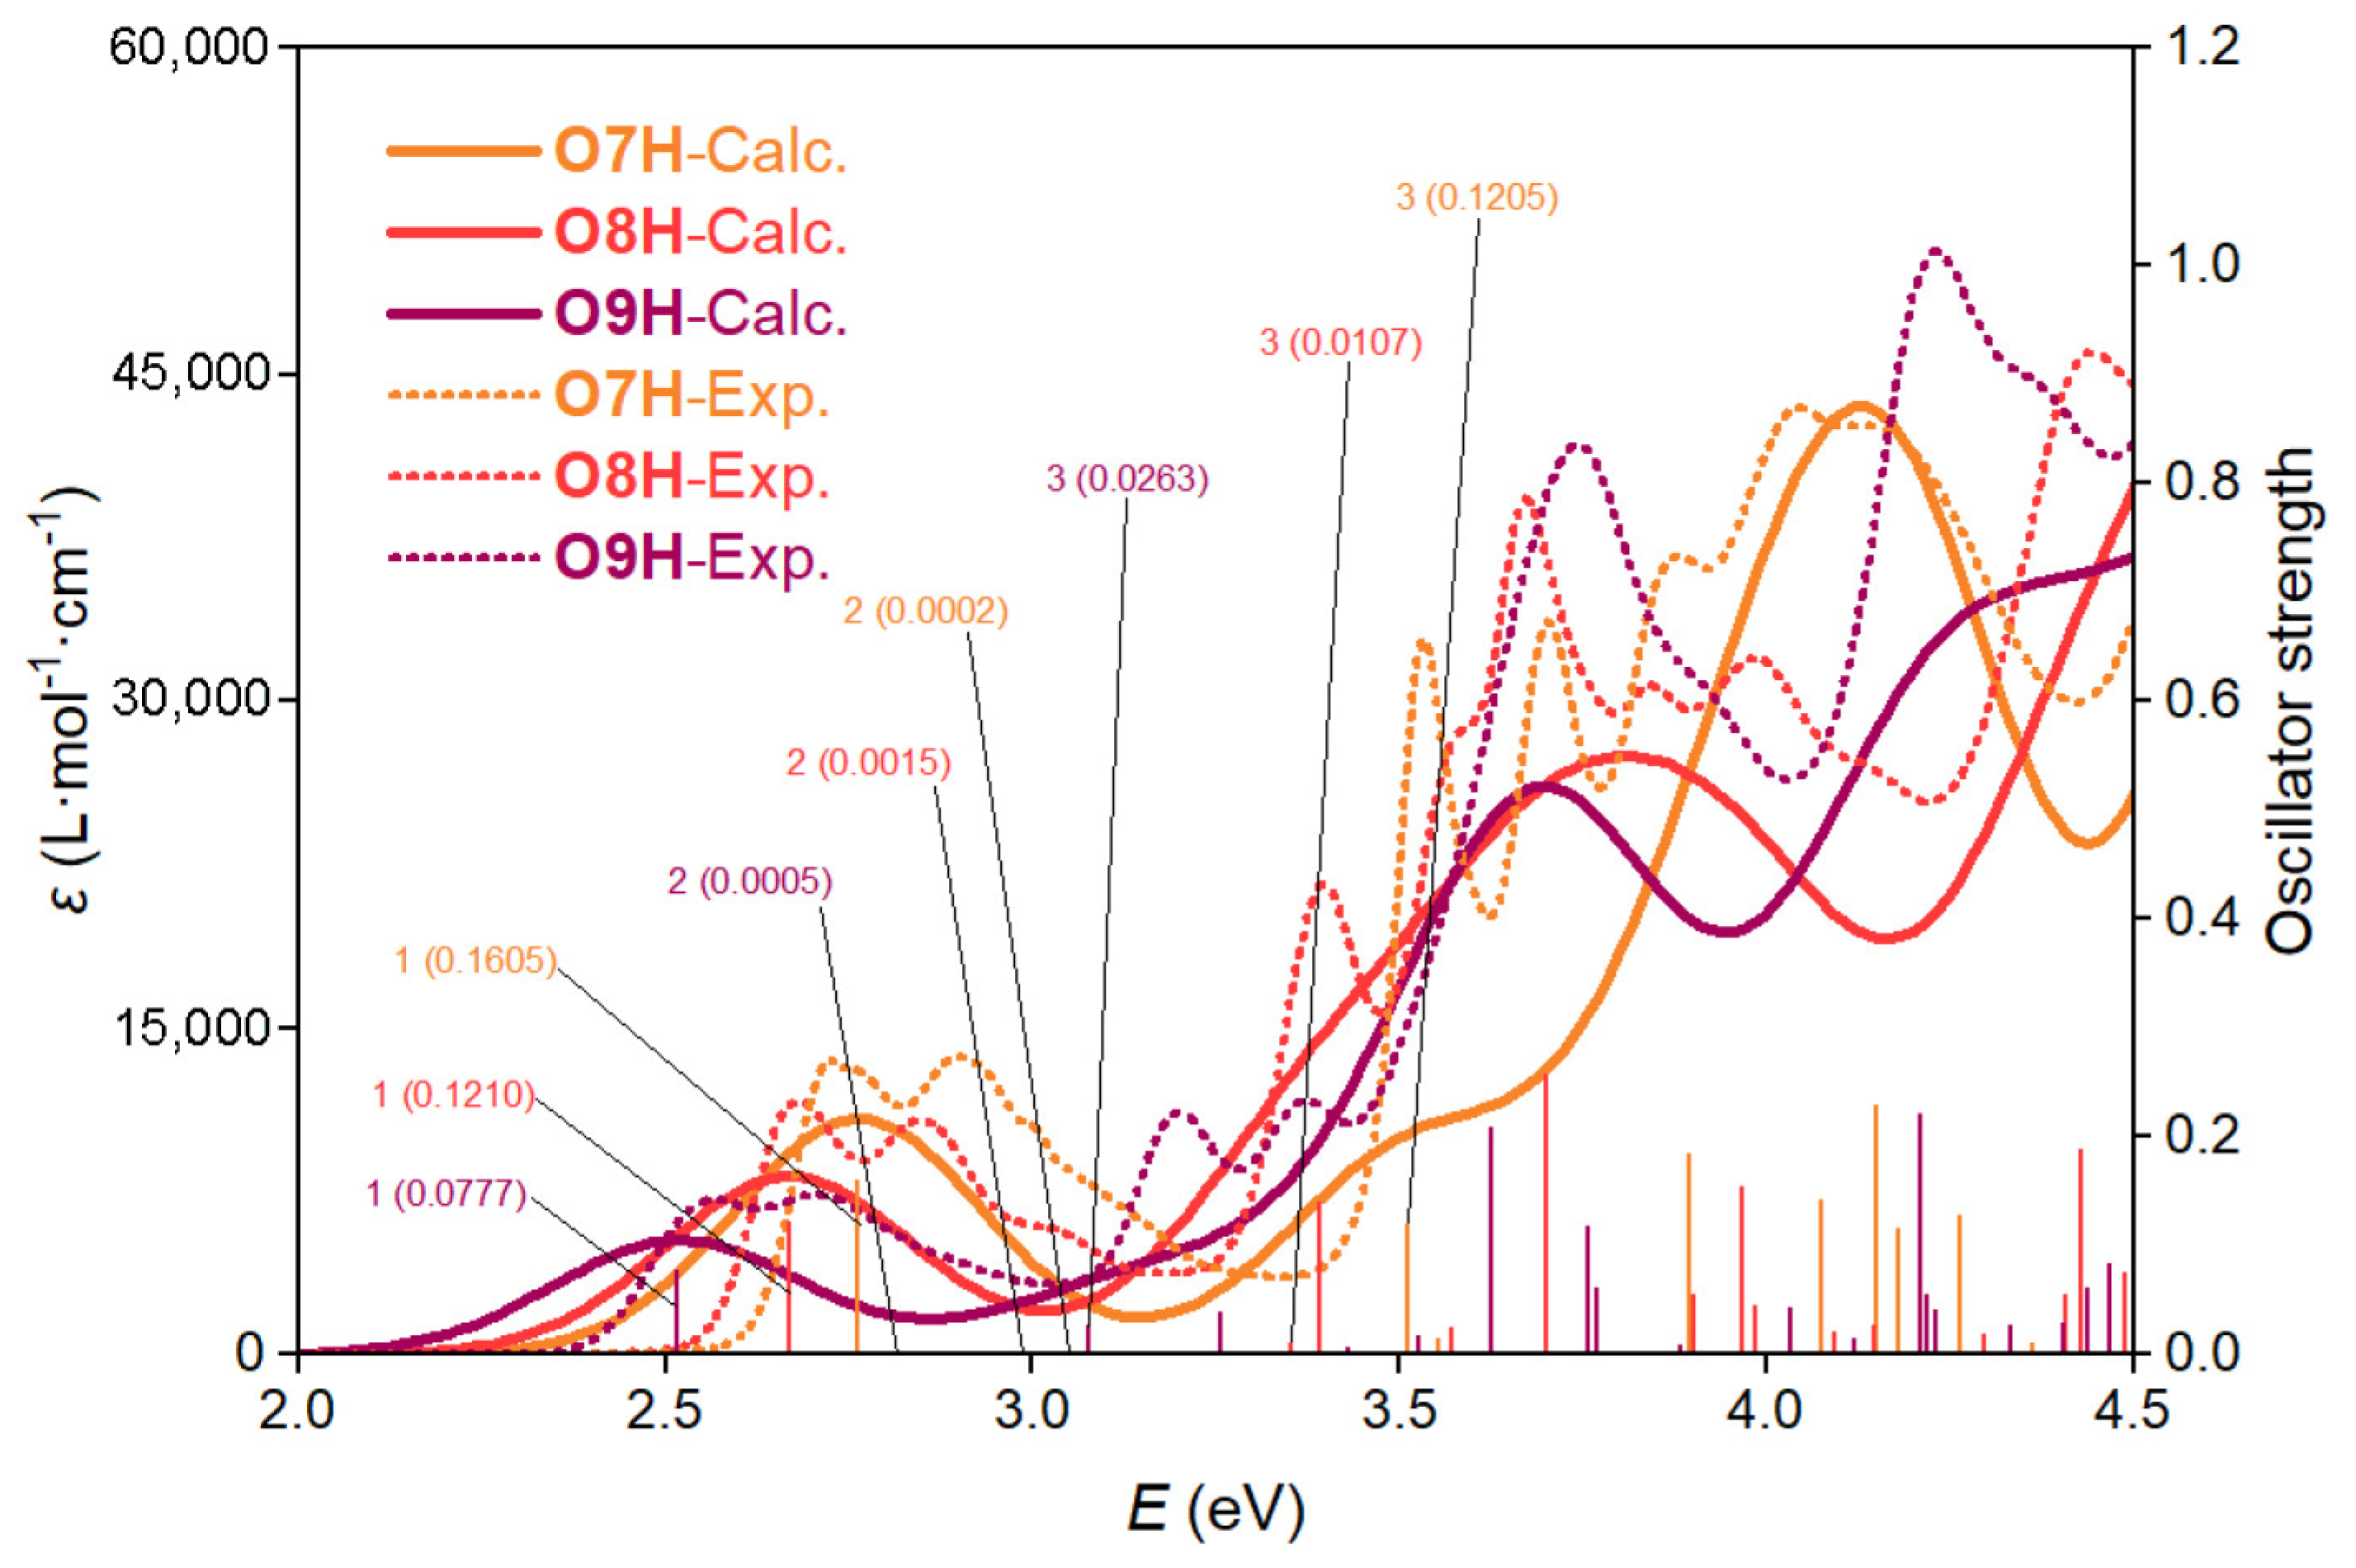
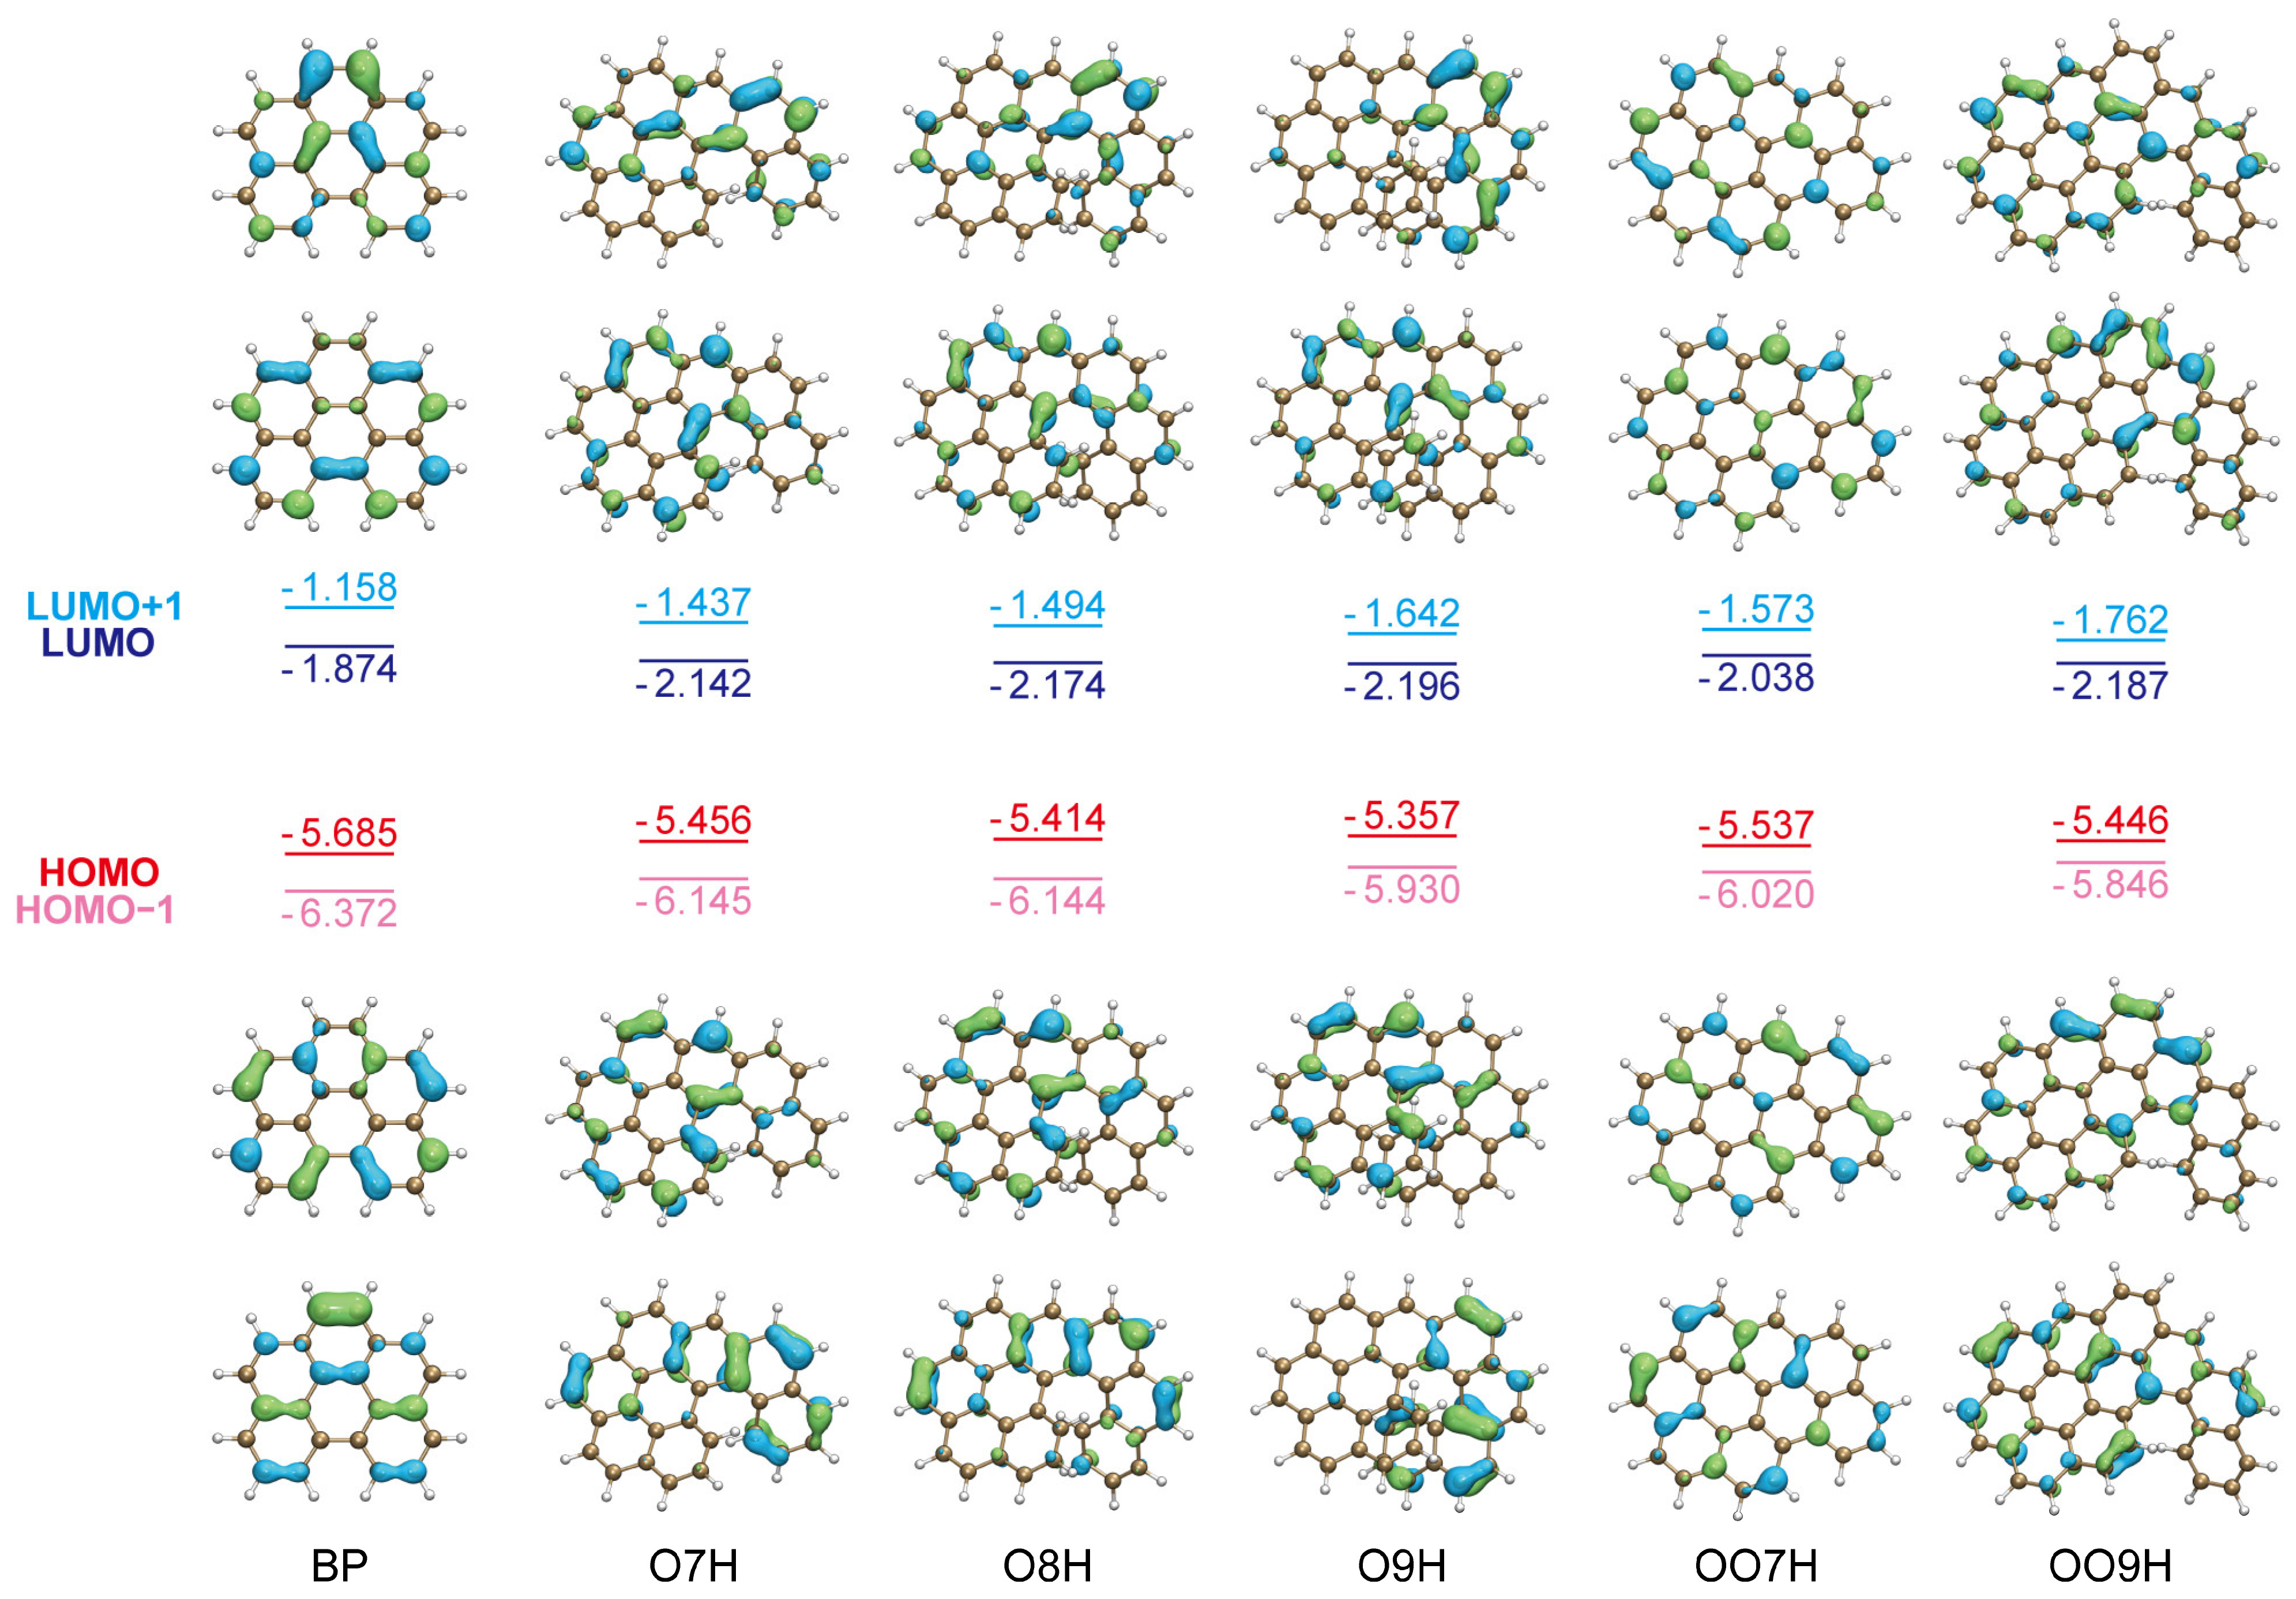
We initially investigated the phenanthrene-fused helicene derivatives O7H, O8H, and O9H, each containing a [5], [6], or [7] helicene moiety (5H, 6H, and 7H), respectively. Detailed analysis of the pure electronic ABS spectrum reveals that these nanographenes exhibit the lowest energy transition S1 at 2.76, 2.67, and 2.52 eV, respectively (Figure 2). These values closely match the experimental results (Table 1). Besides, this transition also demonstrates a relatively large oscillator strength f, ranging from 0.078 to 0.161, consistent with the intense absorption observed in the experimental ABS spectra. Upon the examination of the molecular orbital contribution, we have found that this transition is primarily attributed to the HOMO to LUMO transition with proportions exceeding 95% in all three molecules. The distribution of HOMO and LUMO for O7H, O8H, and O9H are revealed to be similar to BP (Figure 3), indicating that their S1 transitions are less similar to the primitive helicenes but rather similar to BP, where the S1 transition is intense with strong vibronic effect. In addition, the second-lowest energy transition S2 for these nanographenes is located at 3.05, 2.99, and 2.81 eV, respectively, which is distanced from the first transition. Their oscillator strengths f also exhibit extremely low (less than 0.002), indicating that such transitions are almost inhibited. Thus, we suggest that the experimental ABS spectra in the low-energy region (ca. 2.0 to 3.0 eV) are dominantly attributed to the transition S1. These electronic transition patterns are much different from their homologs, the primitive helicenes 5H, 6H, and 7H (Table S2a–f and Figure S3), where the S1 transition exhibits low oscillator strength and might be disturbed by the neighboring S2 and S3 transitions. Obviously, such simple transition patterns of O7H, O8H, and O9H could facilitate the investigation of the vibronic effect on the electronic transitions, and, therefore. we would focus primarily on the transition S1 for the ABS spectrum study.

2.2. Vibrationally Resolved Electronic Transition of O7H, O8H, and O9H

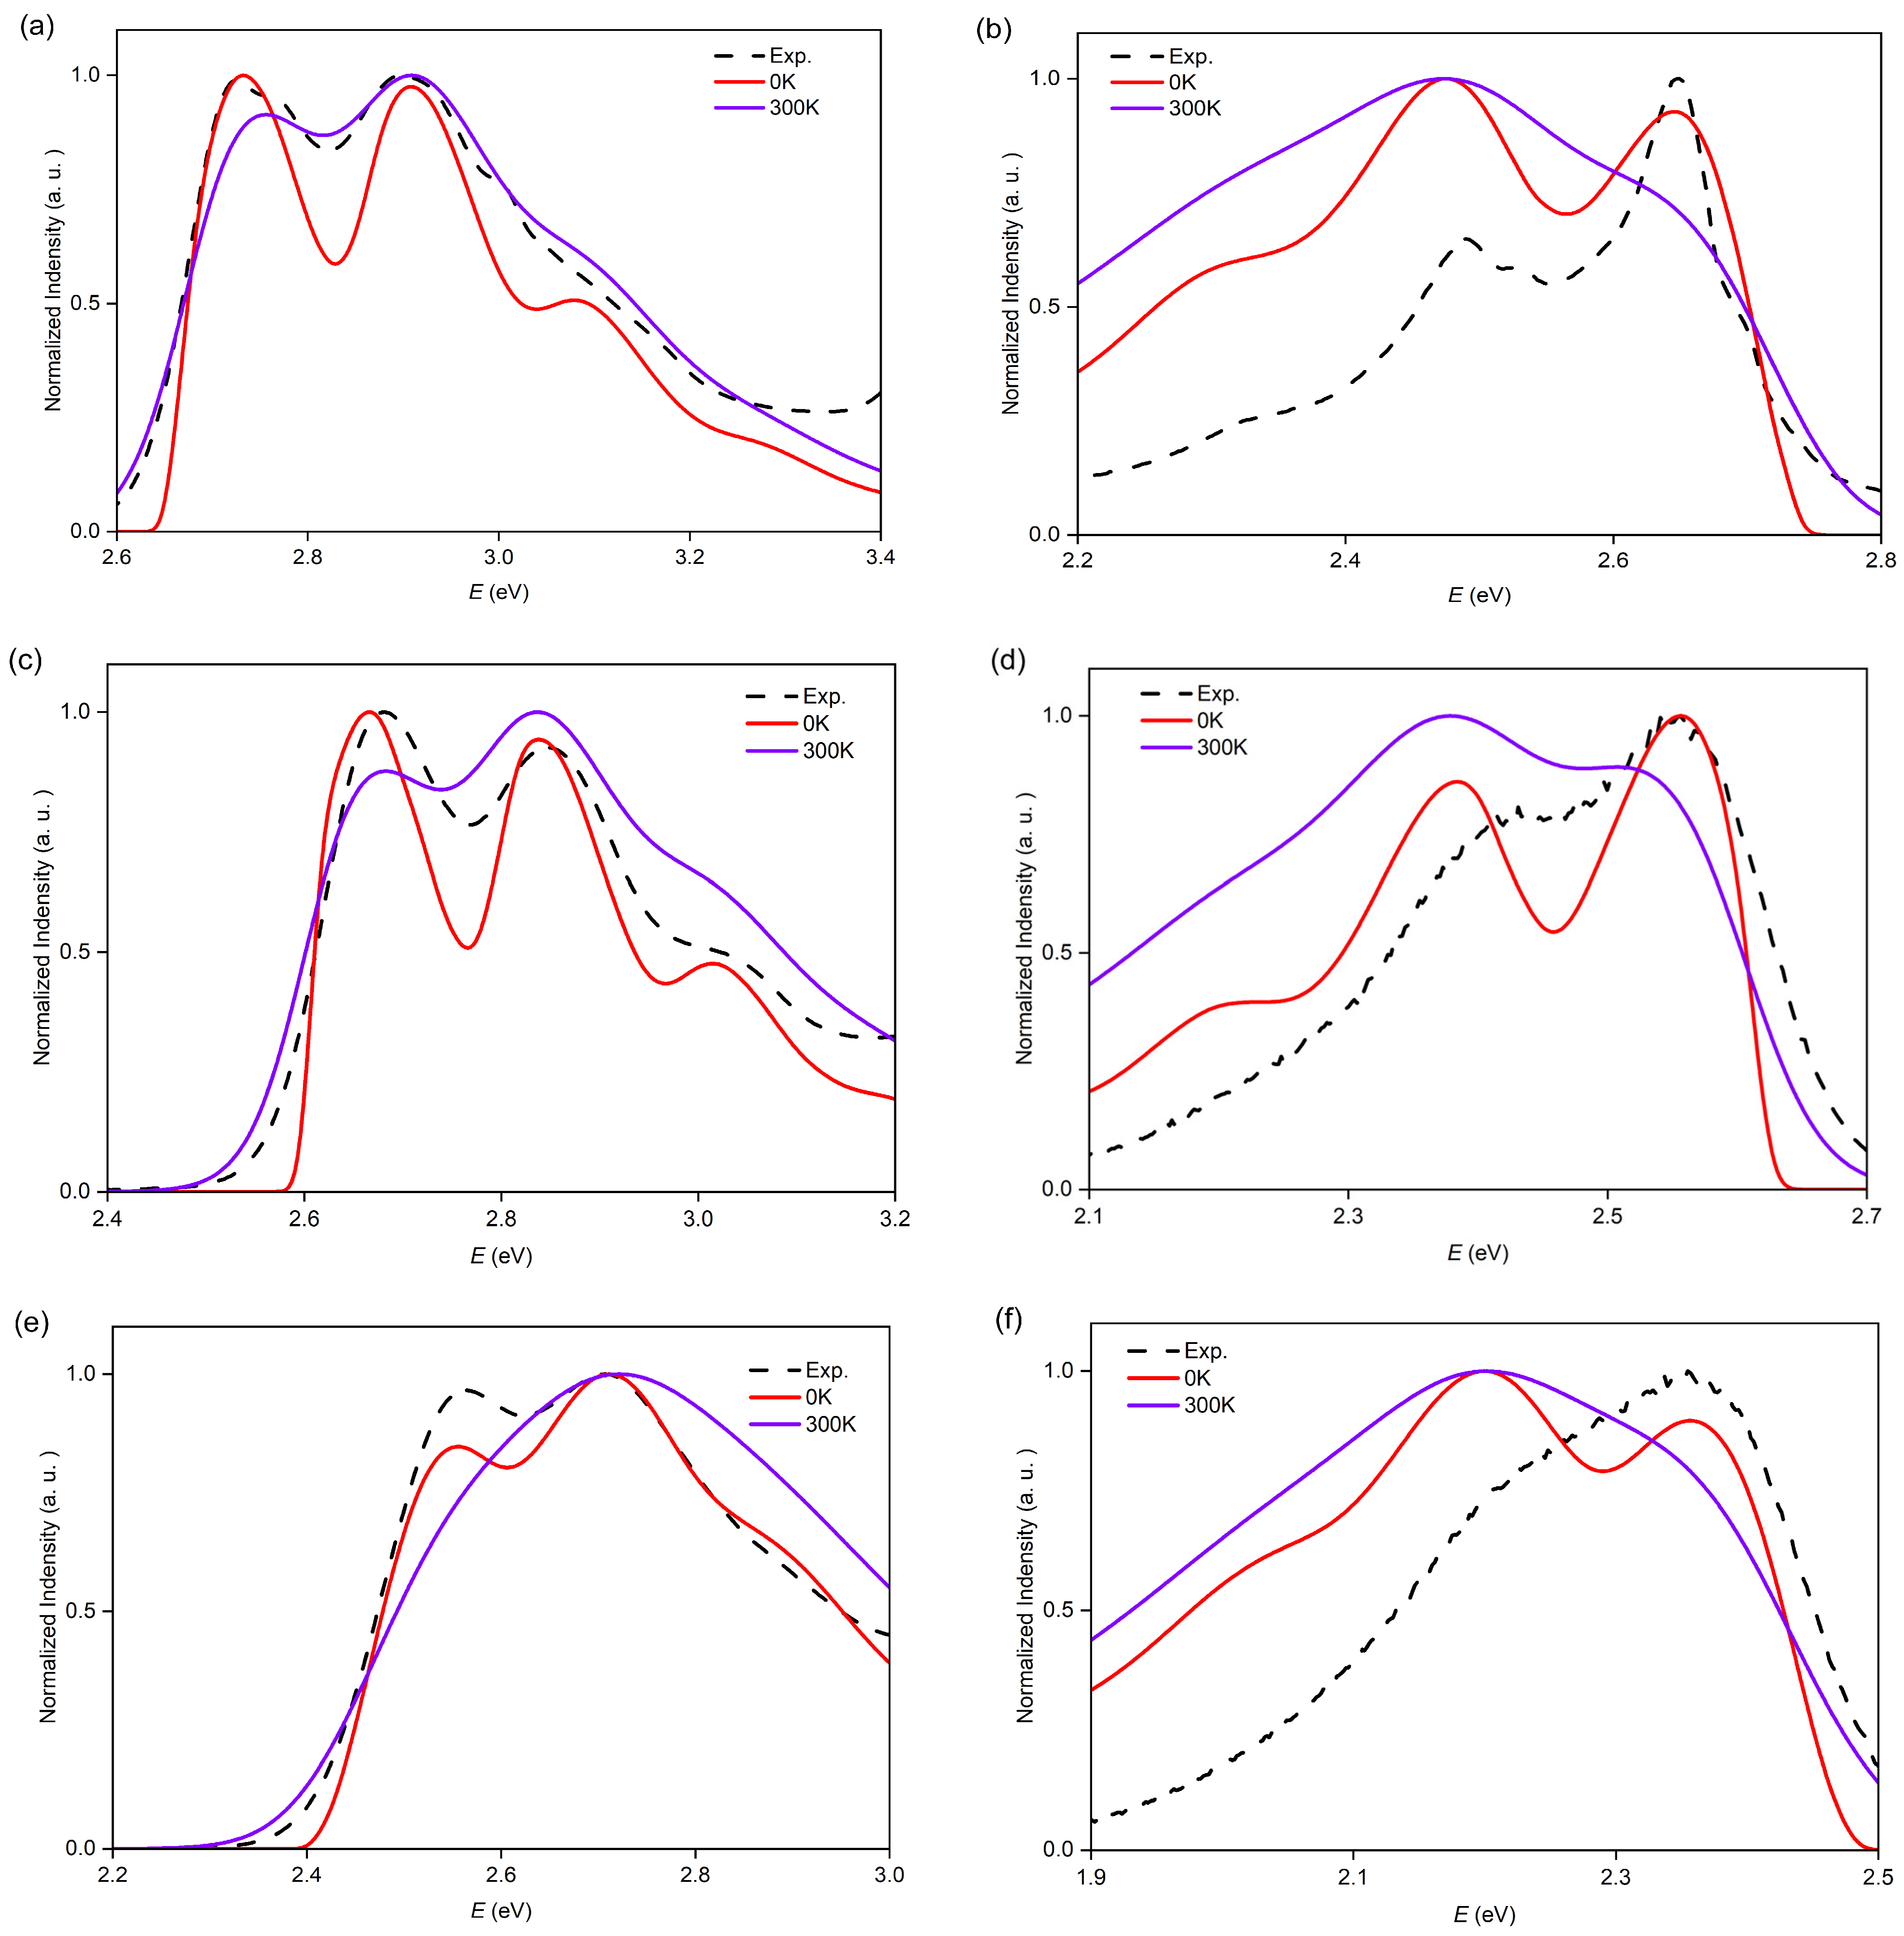
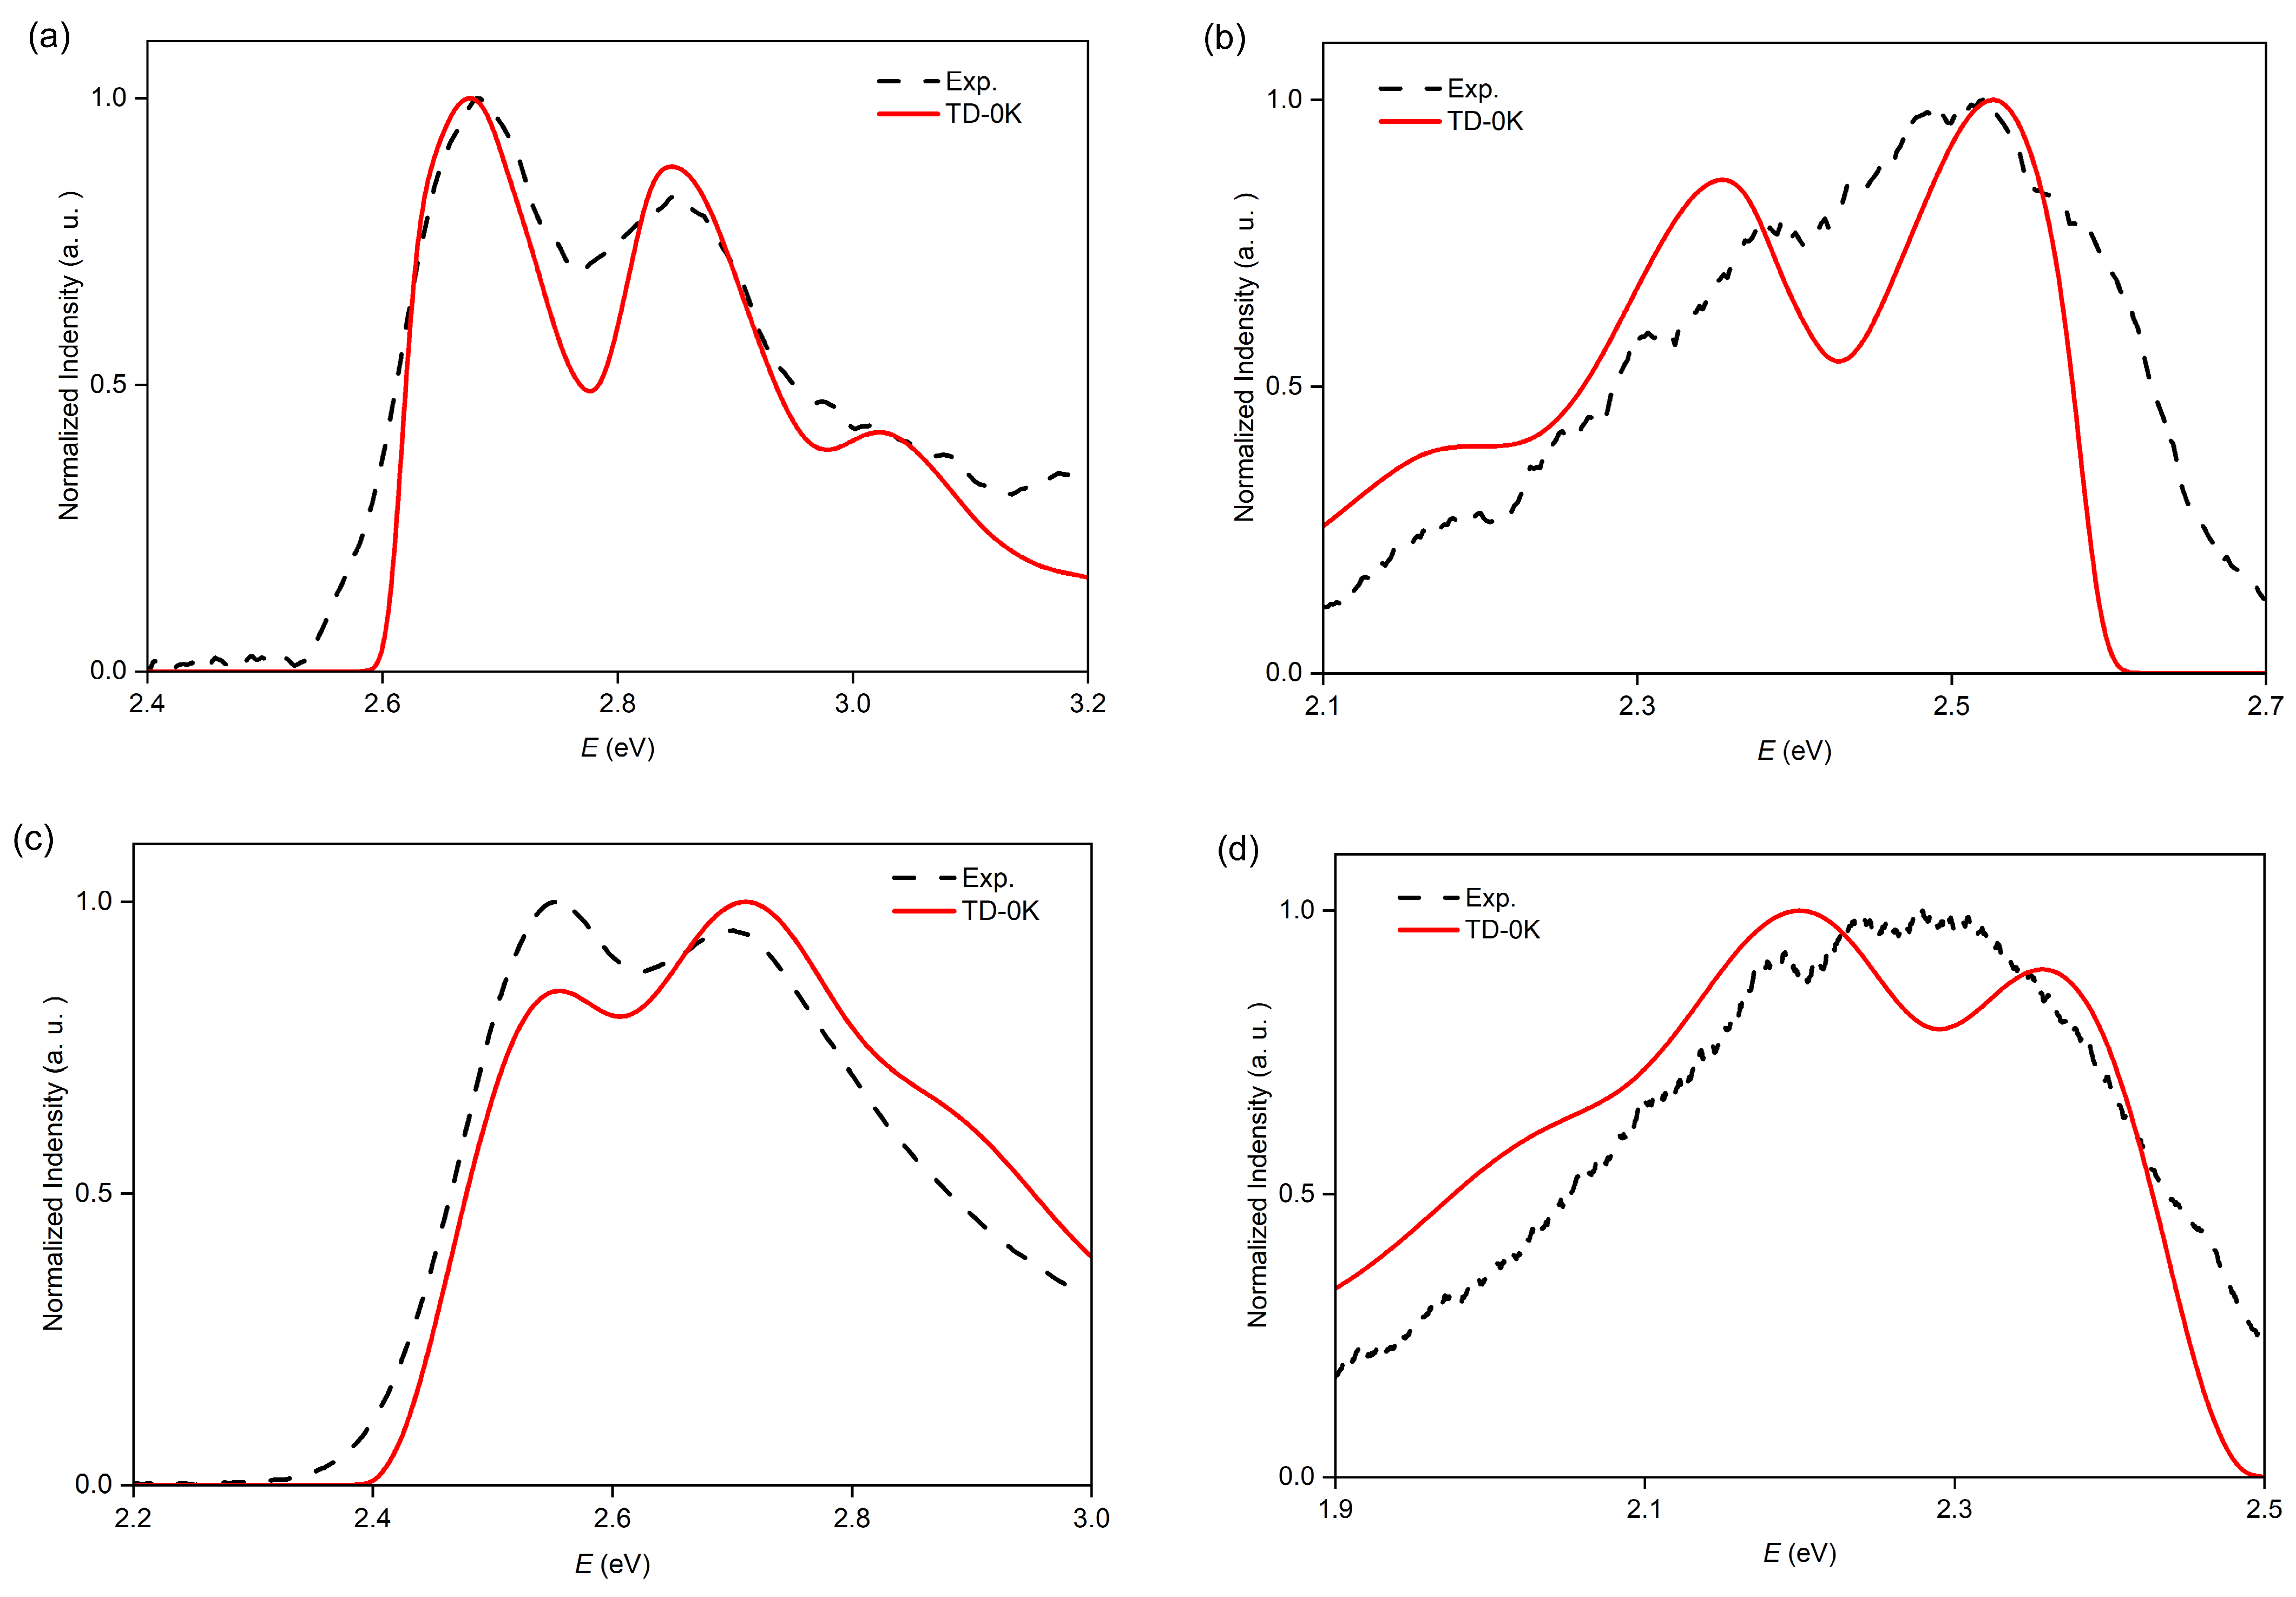
We first calculated the vibrationally resolved ABS spectra based on a time-dependent (TD) approach for better enhancing the spectral line shape [47]. The calculated ABS spectra using Franck–Condon (FC) approximation and Adiabatic Hessian (AH) model for O7H, O8H, and O9H are presented in Figure 4. To have a better comparison with the experimental spectra, we applied a blueshift to the calculated FC|AH spectra. Specifically, the theoretical spectrum of O7H at 0 K exhibits desirable alignment with the experimental curves in the energy range of 2.60 to 3.20 eV, accurately replicating three vibronic peaks at 2.73, 2.90, and 3.08 eV. Taking into account the thermal effect, the spectrum at 300 K shows broadening compared with the curve at 0 K. Besides, the relative height of the peak is also changed. As for larger homologs O8H and O9H, similar results were observed, with the structured bands reproduced in the calculations at 0 K in low-energy regions. However, for the calculations at 300 K, O9H shows severe deviation from the experimental curve.

2.3. TI Spectrum and Assignment of the Main Vibronic Bands

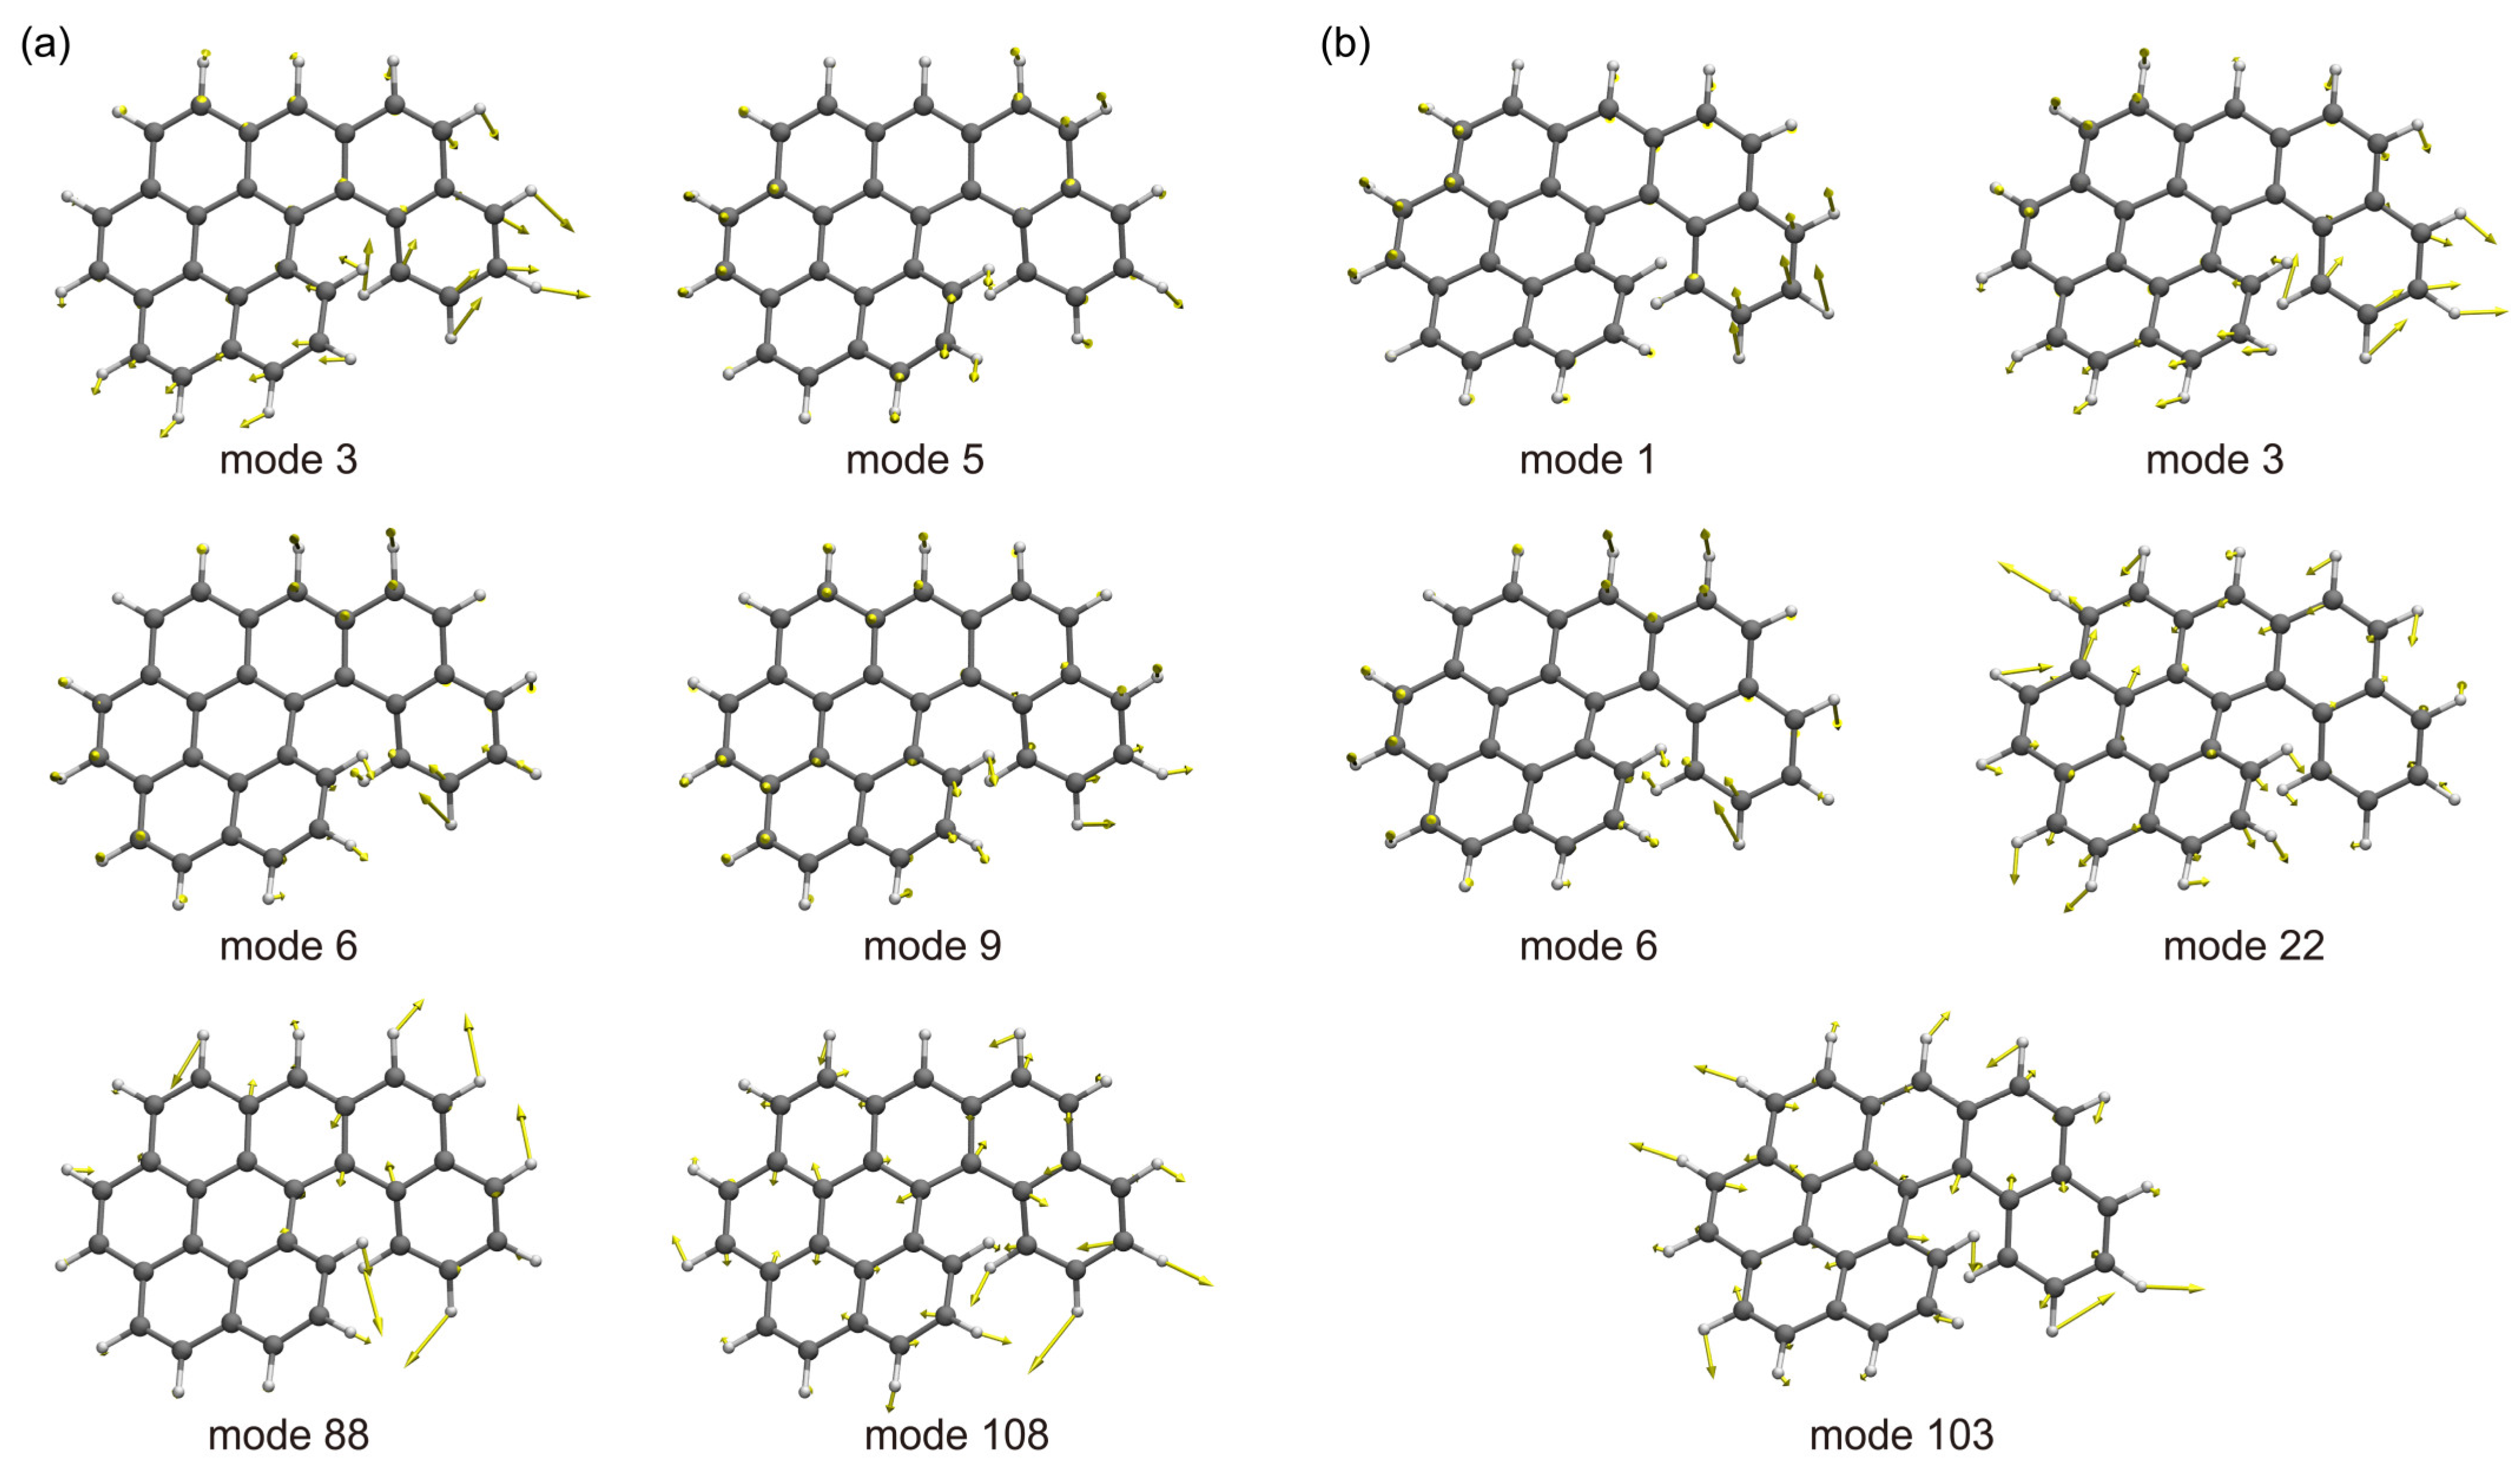
To gain a deeper understanding of the vibronic coupling effects and identify the specific vibrational modes responsible for the vibronic progressions, we performed the calculations based on a time-independent (TI) approach, which is grounded in the sum-over-state principle [48,49,50]. The detailed ABS curves and related vibronic transitions are shown in Table 2 and Figure 5. In the TI spectra of O7H, the first peak between 2.40 eV and 2.60 eV, primarily originating from the lowest band at 2.46 eV, is associated with the 0-0 transition and combines with a series of S1 low-frequency modes: 1 (44 cm−1), 3 (88 cm−1), 6 (156 cm−1), and 22 (443 cm−1). These low-frequency modes could be characterized as the movements of CC and CCH out-of-plane bendings (Figure 6a). Notably, mode 3 demonstrates a distinctive motion involving both the shrinking of the 5H unit and the bending of the BP unit. The second peak between 2.60 and 2.80 eV, with noticeably lower intensity, is mainly composed of the fundamentals of S1 mode 103 (1502 cm−1) in conjunction with the aforementioned low-frequency vibrational modes. These bands typically involve C = C stretching combined with C-H rocking in both the helicene and BP units (Figure 6a). Therefore, the interaction between the BP and 5H units likely contributes to the unique vibronic pattern of O7H.
The homologs O8H and O9H also exhibit similar shapes for their ABS curves but with redshifts owing to the extended π-conjugation. For instance, O8H displayed three calculated vibronic peaks at 2.67, 2.84, and 3.02 eV, which aligned well with the experimental spectrum (at 2.68, 2.85, and 3.01 eV, Figure 4c). Likewise, the calculated TD spectrum of O9H has reproduced the vibronic peaks at 2.55 and 2.71 (Figure 4e). In the case of O8H, the first peak is predominantly influenced by the 0-0 transition and low-frequency modes, especially modes 1 (34 cm−1), 3 (64 cm−1), 5 (99 cm−1), and 13 (270 cm−1), which correspond to the movements of CC and CCH out-of-plane bending (Figure S5). Similarly, the second peak shows a large contribution of frequency mode 108 (1422 cm−1), associated with the motion of C = C stretching and C-H rocking (Figure S5). Comparable results were also observed for O9H. Notably, mode 3 of O8H and mode 3 of O9H exhibited a similar vibronic pattern to that of O7H.
In the vibrationally resolved EMI spectra, these nanographenes exhibit nearly mirror-image curves compared with the ABS spectra, albeit with slight variations in shape. To illustrate, the calculated TD spectrum of O7H at 0 K presents three distinct peaks at 2.64, 2.47, and 2.31 eV, which align almost perfectly with the experimental spectra, where peaks occur at 2.65, 2.49, and 2.33 eV (Figure 4b). However, the spectrum at 300 K shows excessive broadening with a loss of the vibronic information. Similar to the ABS spectra, the first peak with the highest energy is primarily attributed to the 0-0 transition, accompanied by bands related to the S0 low-frequency modes 3 (44 cm−1), 5 (88 cm−1), 6 (156 cm−1), and 9 (443 cm−1). Notably, these modes are more concentrated on the BP framework. The second peak reflects the contribution of vibrational modes 88 (1315 cm−1) and 108 (1592 cm−1), which could be assigned to C = C stretching and C-H rocking (Figure 6b). In the cases of O8H and O9H, the calculated EMI curves using the TD approach at 0 K also exhibit sound concordance with the experimental results compared with the curves at 300 K, where the curves at 300 K are found to be excessively broadened. Furthermore, the contributions of vibrational modes, as determined through calculations utilizing the TI approach, have been found to be analogous to those observed in ABS spectra.

2.4. Electronic Transition of OO7H and OO9H

In the case of the planar OO7H, and its derivative OO9H featuring two additional rings that form a 5H unit, the experimental spectra exhibit more structured shapes compared with previous phenanthrene-fused helicenes, probably owing to their increased structural rigidity. Specifically, for OO7H, the experimental spectrum displays three sharp absorption peaks at 3.01, 3.18, and 3.34 eV, while OO9H exhibits a similar absorption pattern but with a redshift to 2.75, 2.93, and 3.11 eV. Upon conducting a pure electronic ABS analysis, we found that the lowest transition S1 exhibited large oscillator strength (0.1212 for OO7H and 0.2254 for OO9H) at 3.03 eV for OO7H and 2.60 eV for OO9H. Besides, transition S2, located close to transition S1, also exhibits noticeable oscillator strength, but it is much weaker (0.0354 for OO7H and 0.0702 for OO9H). Concurrently, the transition S3 is found to be distanced from both S1 and S2. Consequently, for the low-energy bands of OO7H and OO9H, the structured peaks (ranging from 2.80 to 3.20 eV for OO7H and from 2.50 to 3.00 eV for OO9H) could be mainly contributed by transition S1, with a minor contribution from transition S2. Thus, we focused on the transition S1 for further investigation.
Regarding OO7H, the vibrationally resolved calculations on the transition S1 show good agreement between the calculated and experimental ABS spectra in the region between 2.70 and 3.30 eV for OO7H, reproducing the sharp peaks at 2.84, 3.02, and 3.21 eV in both 0 K and 300 K. Due to its rigid planar molecular structure, the first major peak in the ABS spectrum of OO7H is almost entirely dominated by the 0-0 transition. Additionally, there are minor contributions from the S1 vibrational modes 12 (312 cm−1) and 22 (459 cm−1), both of which are in-plane C-C and C-H stretching vibrations (Figure S5). The second peak is contributed by in-plane C = C stretching vibrations, such as vibrational modes 88 (1383 cm−1), 90 (1413 cm−1), and 112 (1656 cm−1) (Figure S5). The EMI spectrum generally mirrors the absorption spectrum but with some differences. The first peak is still mainly contributed by the 0-0 transition, but it is clearly observed that the S0 vibrational modes 12 (323 cm−1) and 14 (334 cm−1), which are also in-plane C-C and C-H stretching vibrations, make significant contributions as well (Figure S5). OO9H exhibits characteristics like those of OO7H, with the first peaks in both its absorption and emission spectra primarily dominated by the 0-0 transition. However, in the first peaks of the absorption and emission spectra of OO9H, the contributing vibrational modes are like the CC and CCH out-of-plane bendings observed in O7H (Figure S5). This indicates that the introduction of 5H affects OO7H but does not alter the overall spectral shape and transition properties.

2.5. Vibrationally Resolved ECD and CPL of O8H and O9H

Subsequently, we studied the chiroptical properties of the configurationally stable nanographenes O8H and O9H and calculated their vibrationally resolved ECD and CPL spectra. From the calculated ECD spectra using the TD approach at 0 K, we observed a similar shape of the curves compared with the experimental spectra for both p-enantiomers (Figure 7). Notably, in the case of O8H, the lowest peak is mainly contributed to 0-0 transition with progressions along S1 low-frequency modes 3 (44 cm−1), 5 (88 cm−1), 6 (156 cm−1), and 9 (443 cm−1) according to the calculation using the TI approach. This result is similar to the ABS calculations. For the calculated CPL spectra, the results show less accordance with the experimental curves. This might be due to the large noise and broadening in the experimental results.

3. Methods

Computational Details

Density functional theory (DFT) calculations were performed using the Gaussian 09 program [51]. Geometrical optimization calculations were conducted using the PBE0 exchange–correlation functional [52] in combination with the def-TZVP [53] basis set, which employed Grimme’s D3 dispersion approximation [54] (PBE0-D3(BJ)/def-TZVP level) in the gas phase. Harmonic vibration frequency analysis was performed on the optimized geometries to ensure they corresponded to local minima without imaginary frequencies.
Time-dependent density functional theory (TD-DFT) calculations were performed at the PBE0-D3(BJ)/def2-TZVP level in the gas phase. The vibrationally resolved electronic spectra were calculated using the FCclasses 3.0.1 program [55]. Molecular orbitals and hole-electron analyses [56] were generated using the Multiwfn 3.8-dev program [57] and VMD 1.9.3 program [58].
To further investigate the influence of different exchange–correlation functionals, we conducted a benchmark study using the PBE0-D3(BJ), CAM-B3LYP-D3(BJ) [59], M06-2X-D3 [60], and ωB97XD [61] functionals on BP; details are provided in the Supplementary Information.
To directly compare the results with experimental spectra, transition energies and intensities were computed at 0 K and 300 K, respectively, and then convoluted with Gaussian functions with a full width at half-maximum (FWHM) of 0.01 eV. The stick bands of the spectra, depicted as bars in Figure 5 using the TI approach, are expressed as “nx”, where “x” stands for the quanta deposited in the final state (S1 for ABS spectra and S0 for EMI spectra) of the normal mode n.

4. Conclusions

In conclusion, we have employed vibrationally resolved spectral analysis to investigate a range of nanographenes that exhibited pronounced vibronic structures in both optical and chiroptical experimental spectroscopy. The calculations were performed using the FC|AH model at the PBE0-D3(BJ)/def2-TZVP level of theory, and both the TD and TI approaches were adopted for the calculations. The calculated results obtained via the TD approach at 0 K exhibited good agreement with the experimental spectra in terms of relative height and width. However, for the calculations at 300 K, owing to the broadening of the spectra, the results were less accurate. Additionally, through the calculations with the TI approach, we discovered that several important vibronic modes contributed largely to the vibrationally resolved spectra of phenanthrene-fused helicenes O7H, O8H, and O9H, which were largely related to the embedded BP unit and differed from the primitive helicenes. Unlike the previous computations that solely focused on pure electronic transitions, which led to notable discrepancies, particularly in the low-energy regions of both ABS and ECD spectra, this study underscores the importance and feasibility of examining the vibronic effect in electronic transitions. Consequently, we firmly believe that the introduction of the vibrationally resolved spectral analysis represents a valuable and indispensable tool for future optical and chiroptical studies of nanographenes.

Supplementary Materials

The following supporting information can be downloaded at: https://www.mdpi.com/article/10.3390/molecules29173999/s1, References [51,52,53,54,59,60,61] are cited in Supplementary Materials.

Author Contributions

Conceptualization, C.S. and Y.M.; methodology, Y.M.; software, Y.M.; investigation, Y.M.; data curation, Y.M., X.F. and W.Y.; writing—original draft preparation, Y.M.; writing—review and editing, C.S.; funding acquisition, C.S. All authors have read and agreed to the published version of the manuscript.

Funding

This research was funded by the Zhejiang Provincial Natural Science Foundation, China (grant number LY23B040003) and the Science Foundation of Zhejiang Sci-Tech University, China (grant number 22062026-Y).

Institutional Review Board Statement

Not applicable.

Informed Consent Statement

Not applicable.

Data Availability Statement

The data are included within the article.

Conflicts of Interest

The authors declare no conflicts of interest.

References

  1. Liu, Z.; Fu, S.; Liu, X.; Narita, A.; Samorì, P.; Bonn, M.; Wang, H.I. Small Size, Big Impact: Recent Progress in Bottom-Up Synthesized Nanographenes for Optoelectronic and Energy Applications. Adv. Sci. 2022, 9, 2106055. [Google Scholar] [CrossRef]
  2. Xu, Z.; Liu, Y.; Chandresh, A.; Pati, P.B.; Monnier, V.; Heinke, L.; Odobel, F.; Diring, S.; Haldar, R.; Wöll, C. Nanographene-Based Metal-Organic Framework Thin Films: Optimized Packing and Efficient Electron-Hole Separation Yielding Efficient Photodetector. Adv. Funct. Mater. 2024, 34, 2308847. [Google Scholar] [CrossRef]
  3. Castro-Fernández, S.; Cruz, C.M.; Mariz, I.F.A.; Márquez, I.R.; Jiménez, V.G.; Palomino-Ruiz, L.; Cuerva, J.M.; Maçôas, E.; Campaña, A.G. Two-Photon Absorption Enhancement by the Inclusion of a Tropone Ring in Distorted Nanographene Ribbons. Angew. Chem. Int. Ed. 2020, 59, 7139–7145. [Google Scholar] [CrossRef] [PubMed]
  4. Matsui, K.; Oda, S.; Yoshiura, K.; Nakajima, K.; Yasuda, N.; Hatakeyama, T. One-Shot Multiple Borylation toward BN-Doped Nanographenes. J. Am. Chem. Soc. 2018, 140, 1195–1198. [Google Scholar] [CrossRef] [PubMed]
  5. Lin, H.-A.; Sato, Y.; Segawa, Y.; Nishihara, T.; Sugimoto, N.; Scott, L.T.; Higashiyama, T.; Itami, K. A Water-Soluble Warped Nanographene: Synthesis and Applications for Photoinduced Cell Death. Angew. Chem. Int. Ed. 2018, 57, 2874–2878. [Google Scholar] [CrossRef]
  6. Zhu, X.; Chen, Q.; Zhao, H.; Yang, Q.; Goudappagouda; Gelléri, M.; Ritz, S.; Ng, D.; Koynov, K.; Parekh, S.H.; et al. Intrinsic Burst-Blinking Nanographenes for Super-Resolution Bioimaging. J. Am. Chem. Soc. 2024, 146, 5195–5203. [Google Scholar] [CrossRef]
  7. Song, S.; Pinar Solé, A.; Matěj, A.; Li, G.; Stetsovych, O.; Soler, D.; Yang, H.; Telychko, M.; Li, J.; Kumar, M.; et al. Highly entangled polyradical nanographene with coexisting strong correlation and topological frustration. Nat. Chem. 2024, 16, 938–944. [Google Scholar] [CrossRef]
  8. Borissov, A.; Maurya, Y.K.; Moshniaha, L.; Wong, W.-S.; Żyła-Karwowska, M.; Stępień, M. Recent Advances in Heterocyclic Nanographenes and Other Polycyclic Heteroaromatic Compounds. Chem. Rev. 2022, 122, 565–788. [Google Scholar] [CrossRef]
  9. Anderson, H.V.; Gois, N.D.; Chalifoux, W.A. New advances in chiral nanographene chemistry. Org. Chem. Front. 2023, 10, 4167–4197. [Google Scholar] [CrossRef]
  10. Jassas, R.S.; Mughal, E.A.; Sadiq, A.; Alsantali, L.I.; Al-Rooqi, M.M.; Naeem, N.; Moussa, Z.; Ahmed, S.A. Scholl reaction as a powerful tool for the synthesis of nanographenes: A systematic review. RSC Adv. 2021, 11, 32158–32202. [Google Scholar] [CrossRef]
  11. Muzammil, E.M.; Halilovic, D.; Stuparu, M.C. Synthesis of corannulene-based nanographenes. Commun. Chem. 2019, 2, 58. [Google Scholar] [CrossRef]
  12. Li, R.; Wang, D.; Li, S.; An, P. Construction of hexabenzocoronene-based chiral nanographenes. Beilstein J. Org. Chem. 2023, 19, 736–751. [Google Scholar] [CrossRef] [PubMed]
  13. Narita, A.; Wang, X.-Y.; Feng, X.; Müllen, K. New advances in nanographene chemistry. Chem. Soc. Rev. 2015, 44, 6616–6643. [Google Scholar] [CrossRef] [PubMed]
  14. Izquierdo-García, P.; Fernández-García, J.M.; Fernández, I.; Perles, J.; Martín, N. Helically Arranged Chiral Molecular Nanographenes. J. Am. Chem. Soc. 2021, 143, 11864–11870. [Google Scholar] [CrossRef]
  15. Evans, P.J.; Ouyang, J.; Favereau, L.; Crassous, J.; Fernández, I.; Perles, J.; Martín, N. Synthesis of a Helical Bilayer Nanographene. Angew. Chem. Int. Ed. 2018, 57, 6774–6779. [Google Scholar] [CrossRef]
  16. Yamamoto, K.; Saitho, Y.; Iwaki, D.; Ooka, T. [7.7]Circulene, a Molecule Shaped Like a Figure of Eight. Angew. Chem. Int. Ed. Engl. 1991, 30, 1173–1174. [Google Scholar] [CrossRef]
  17. Pun, S.H.; Wang, Y.; Chu, M.; Chan, C.K.; Li, Y.; Liu, Z.; Miao, Q. Synthesis, Structures, and Properties of Heptabenzo[7]circulene and Octabenzo[8]circulene. J. Am. Chem. Soc. 2019, 141, 9680–9686. [Google Scholar] [CrossRef]
  18. Pun, S.H.; Miao, Q. Toward Negatively Curved Carbons. Acc. Chem. Res. 2018, 51, 1630–1642. [Google Scholar] [CrossRef]
  19. Chueng, K.Y.; Chan, C.K.; Liu, Z.; Qian, M. A Twisted Nanographene Consisting of 96 Carbon Atoms. Angew. Chem. Int. Ed. 2017, 56, 9003–9007. [Google Scholar] [CrossRef]
  20. Dong, Y.; Zhang, Z.; Hashikawa, Y.; Meng, H.; Bai, F.; Itami, K.; Chaolumen. A Double Twisted Nanographene with a Contorted Pyrene Core. Angew. Chem. Int. Ed. 2024, 136, e202406927. [Google Scholar] [CrossRef]
  21. Li, J.-K.; Chen, X.-Y.; Zhao, W.-L.; Guo, Y.-L.; Zhang, Y.; Wang, X.-C.; Sue, A.C.-H.; Cao, X.-Y.; Li, M.; Chen, C.-F.; et al. Synthesis of Highly Luminescent Chiral Nanographene. Angew. Chem. Int. Ed. 2023, 62, e202215367. [Google Scholar] [CrossRef]
  22. Gan, F.; Shen, C.; Cui, W.; Qiu, H. [1,4]Diazocine-Embedded Electron-Rich Nanographenes with Cooperatively Dynamic Skeletons. J. Am. Chem. Soc. 2023, 145, 5952–5959. [Google Scholar] [CrossRef] [PubMed]
  23. Zhang, G.; Zhang, J.; Tao, Y.; Gan, F.; Lin, G.; Liang, J.; Shen, C.; Zhang, Y.; Qiu, H. Facile fabrication of recyclable robustnoncovalent porous crystals from low-symmetry helicene derivative. Nat. Commun. 2024, 15, 5469. [Google Scholar] [CrossRef] [PubMed]
  24. Berezhnaia, V.; Roy, M.; Vanthuyne, N.; Villa, M.; Naubron, J.-V.; Rodriguez, J.; Coquerel, Y.; Gingras, M. Chiral Nanographene Propeller Embedding Six Enantiomerically Stable [5]Helicene Units. J. Am. Chem. Soc. 2017, 139, 18508–18511. [Google Scholar] [CrossRef]
  25. Shen, Y.-J.; Yao, N.-T.; Diao, L.-N.; Yang, Y.; Chen, X.-L.; Gong, H.-Y. A π-Extended Pentadecabenzo[9]helicene. Angew. Chem. Int. Ed. 2023, 62, e202300840. [Google Scholar] [CrossRef] [PubMed]
  26. Qiu, Z.; Asako, S.; Hu, Y.; Ju, C.W.; Liu, T.; Rondin, L.; Schollmeyer, D.; Lauret, J.S.; Müllen, K.; Narita, A. Negatively Curved Nanographene with Heptagonal and [5]Helicene Units. J. Am. Chem. Soc. 2020, 142, 14814–14819. [Google Scholar] [CrossRef]
  27. Qiu, Z.; Ju, C.W.; Frederic, L.; Hu, Y.; Schollmeyer, D.; Pieters, G.; Müllen, K.; Narita, A. Amplification of Dissymmetry Factors in π-Extended [7]- and [9]Helicenes. J. Am. Chem. Soc. 2020, 143, 4661–4667. [Google Scholar] [CrossRef]
  28. Chen, Y.; Lin, C.; Luo, Z.; Yin, Z.; Shi, H.; Zhu, Y.; W, J. Double π-Extended Undecabenzo[7]helicene. Angew. Chem. Int. Ed. 2021, 60, 7796–7801. [Google Scholar] [CrossRef]
  29. Sánchez-Carnerero, E.M.; Agarrabeitia, A.R.; Moreno, F.; Maroto, B.L.; Muller, G.; Ortiz, M.J.; de la Moya, S. Circularly polarized luminescence from simple organic molecules. Chem. Eur. J. 2015, 21, 13488–13500. [Google Scholar] [CrossRef]
  30. Bai, W.; Liang, M.; Xuan, T.; Gong, T.; Bian, L.; Li, H.; Xie, R.-J. Ligand Engineering Enables Efficient Pure Red Tin-Based Perovskite Light-Emitting Diodes. Angew. Chem. Int. Ed. 2023, 62, e202312728. [Google Scholar] [CrossRef]
  31. Niu, W.; Fu, Y.; Deng, Q.; Qiu, Z.-L.; Liu, F.; Popov, A.A.; Komber, H.; Ma, J.; Feng, X. Enhancing Chiroptical Responses in Helical Nanographenes via Geometric Engineering of Double [7]Helicenes. Angew. Chem. Int. Ed. 2024, 63, e202319874. [Google Scholar] [CrossRef] [PubMed]
  32. Wang, J.; Shen, C.; Zhang, G.; Gan, F.; Ding, Y.; Qiu, H. Transformation of Crowded Oligoarylene into Perylene-Cored Chiral Nanographene by Sequential Oxidative Cyclization and 1,2-Phenyl Migration. Angew. Chem. Int. Ed. 2022, 61, e202115979. [Google Scholar] [CrossRef]
  33. Barroso, J.; Cabellos, J.L.; Pan, S.; Murillo, F.; Zarate, X.; Fernandez-Herrera, M.A.; Merino, G. Revisiting the Racemization Mechanism of Helicenes. Chem. Commun. 2017, 54, 188–191. [Google Scholar] [CrossRef] [PubMed]
  34. Ruan, L.; Luo, W.; Zhang, H.; Liu, P.; Shi, Y.; An, P. Cycl[2,2,4]azine-embedded non-alternant nanographenes containing fused antiaromatic azepine ring. Chem. Sci. 2024, 15, 1511–1519. [Google Scholar] [CrossRef]
  35. Minkin, V.I.; Starikov, A.G.; Starikova, A.A.; Gapurenko, O.A.; Minyaev, R.M.; Boldyrev, A.I. Electronic Structure and Magnetic Properties of the Triangular Nanographenes with Radical Substituents: A DFT Study. Phys. Chem. Chem. Phys. 2020, 22, 1288–1298. [Google Scholar] [CrossRef] [PubMed]
  36. Escayola, S.; Poater, A.; Muñoz-Castro, A.; Solà, M. An Unprecedented π-Electronic Circuit Involving an Odd Number of Carbon Atoms in a Grossly Warped Non-Planar Nanographene. Chem. Commun. 2021, 57, 3087–3090. [Google Scholar] [CrossRef]
  37. Guido, C.A.; Zinna, F.; Pescitelli, G. CPL calculations of [7]helicenes with alleged exceptional emission dissymmetry values. J. Mater. Chem. C 2023, 11, 10474–10482. [Google Scholar] [CrossRef]
  38. Yang, Z.; Gai, X.; Zou, Y.; Jiang, Y. The Physical Mechanism of Linear and Nonlinear Optical Properties of Nanographene-Induced Chiral Inversion. Molecules 2024, 29, 1053. [Google Scholar] [CrossRef]
  39. Liu, Y.; Cerezo, J.; Mazzeo, G.; Lin, N.; Zhao, X.; Longhi, G.; Abbate, S.; Santoro, F. Vibronic Coupling Explains the Different Shape of Electronic Circular Dichroism and of Circularly Polarized Luminescence Spectra of Hexahelicenes. J. Chem. Theory Comput. 2016, 12, 2799–2819. [Google Scholar] [CrossRef]
  40. Bhattacharyya, P.; Rai, D.K.; Shukla, A. Pariser–Parr–Pople Model Based Configuration-Interaction Study of Linear Optical Absorption in Lower-Symmetry Polycyclic Aromatic Hydrocarbon Molecules. J. Phys. Chem. C 2020, 124, 14297–14305. [Google Scholar] [CrossRef]
  41. Weber, I.; Lee, Y.-P. Fluorescence Excitation and Dispersed Fluorescence Spectra of the First Electronic Excited (S1) State of peri-Hexabenzocoronene (C42H18) Isolated in Solid para-Hydrogen. J. Phys. Chem. A 2024, 128, 4984–4991. [Google Scholar] [CrossRef] [PubMed]
  42. Xu, Q.; Liu, Y.; Zhao, X.; Chen, S.; Li, Q.; Wang, M.; Yang, C. Vibrationally resolved electronic circular dichroism and circularly polarized luminescence spectra of a boron-fused double helicene: A theoretical study. Spectrochim. Acta Part A 2020, 231, 118132. [Google Scholar] [CrossRef] [PubMed]
  43. Liu, Y.; Xu, Q.; Sun, J.; Wang, L.; He, D.; Wang, M.; Yang, C. Insights for vibronic effects on spectral shapes of electronic circular dichroism and circularly polarized luminescence of aza[7]helicene. Spectrochim. Acta Part A 2020, 239, 118475. [Google Scholar] [CrossRef] [PubMed]
  44. Mori, T. Significance of Vibronic Coupling that Shapes Circularly Polarized Luminescence of Double Helicenes. Angew. Chem. Int. Ed. 2024, 63, e202319702. [Google Scholar] [CrossRef]
  45. Shen, C.; Zhang, G.; Ding, Y.; Yang, N.; Gan, F.; Crassous, J.; Qiu, H. Oxidative cyclo-rearrangement of helicenes into chiral nanographenes. Nat. Commun. 2021, 12, 2786. [Google Scholar] [CrossRef]
  46. Qiu, S.; Valdivia, A.C.; Zhuang, W.; Hung, F.F.; Che, C.M.; Casado, J.; Liu, J. Nonalternant Nanographenes Containing N- Centered Cyclopenta[ef]heptalene and Aza[7]Helicene Units. J. Am. Chem. Soc. 2024, 146, 16161–16172. [Google Scholar] [CrossRef]
  47. Avila Ferrer, F.J.; Cerezo, J.; Soto, J.; Improta, R.; Santoro, F. First-principle computation of absorption and fluorescence spectra in solution accounting for vibronic structure, temperature effects and solvent inhomogenous broadening. Comput. Theo. Chem. 2014, 1040, 328–337. [Google Scholar] [CrossRef]
  48. Santoro, F.; Lami, A.; Improta, R.; Bloino, J.; Barone, V. Effective method for the computation of optical spectra of large molecules at finite temperature including the Duschinsky and Herzberg-Teller effect: The Q(x) band of porphyrin as a case study. J. Chem. Phys. 2008, 128, 224311. [Google Scholar] [CrossRef]
  49. Santoro, F.; Improta, R.; Lami, A.; Bloino, J.; Barone, V. Effective method to compute Franck-Condon integrals for optical spectra of large molecules in solution. J. Chem. Phys. 2007, 126, 084509. [Google Scholar] [CrossRef]
  50. Santoro, F.; Lami, A.; Improta, R.; Barone, V. Effective method to compute vibrationally resolved optical spectra of large molecules at finite temperature in the gas phase and in solution. J. Chem. Phys. 2007, 126, 184102. [Google Scholar] [CrossRef]
  51. Frisch, M.J.; Trucks, G.W.; Schlegel, H.B.; Scuseria, G.E.; Robb, M.A.; Cheeseman, J.R.; Scalmani, G.; Barone, V.; Mennucci, B.; Petersson, G.A.; et al. Gaussian, version 09, Revision E.01; Gaussian Inc.: Wallingford, CT, USA, 2013. [Google Scholar]
  52. Adamo, C.; Barone, V. Toward Reliable Density Functional Methods without Adjustable Parameters: The PBE0Model. J. Chem. Phys. 1999, 110, 6158–6170. [Google Scholar] [CrossRef]
  53. Weigend, F.; Ahlrichs, R. Balanced basis sets of split valence, triple zeta valence and quadruple zeta valence quality for H to Rn: Design and assessment of accuracy. Phys. Chem. Chem. Phys. 2005, 7, 3297–3305. [Google Scholar] [CrossRef] [PubMed]
  54. Grimme, S. Density functional theory with London dispersion corrections. Wiley Interdiscip. Rev. Comput. Mol. Sci. 2011, 1, 211–228. [Google Scholar] [CrossRef]
  55. Cerezo, J.; Santoro, F. FCclasses3: Vibrationally-resolved spectra simulated at the edge of the harmonic approximation. J. Comput. Chem. 2023, 44, 626–643. [Google Scholar] [CrossRef] [PubMed]
  56. Liu, Z.; Lu, T.; Chen, Q. An sp-hybridized all-carboatomic ring, cyclo[18]carbon: Electronic structure, electronic spectrum, and optical nonlinearity. Carbon 2020, 165, 461–467. [Google Scholar] [CrossRef]
  57. Lu, T.; Chen, F. Multiwfn: A multifunctional wavefunction analyzer. J. Comput. Chem. 2012, 33, 580–592. [Google Scholar] [CrossRef]
  58. Humphrey, W.; Dalke, A.; Schulten, K. VMD: Visual molecular dynamics. J. Mol. Graph. 1996, 14, 33–38. [Google Scholar] [CrossRef]
  59. Yanai, T.; Tew, D.P.; Handy, N.C. A New Hybrid Exchange–Correlation Functional Using the Coulomb-Attenuating Method (CAM-B3LYP). Chem. Phys. Lett. 2004, 393, 51–57. [Google Scholar] [CrossRef]
  60. Zhao, Y.; Truhlar, D.G. The M06 Suite of Density Functionals for Main Group Thermochemistry, Thermochemical Kinetics, Noncovalent Interactions, Excited States, and Transition Elements: Two New Functionals and Systematic Testing of Four M06-Class Functionals and 12 Other Functionals. Theor. Chem. Acc. 2008, 120, 215–241. [Google Scholar]
  61. Chai, J.-D.; Head-Gordon, M. Long-Range Corrected Hybrid Density Functionals with Damped Atom–Atom Dispersion Corrections. Phys. Chem. Chem. Phys. 2008, 10, 6615–6620. [Google Scholar] [CrossRef]
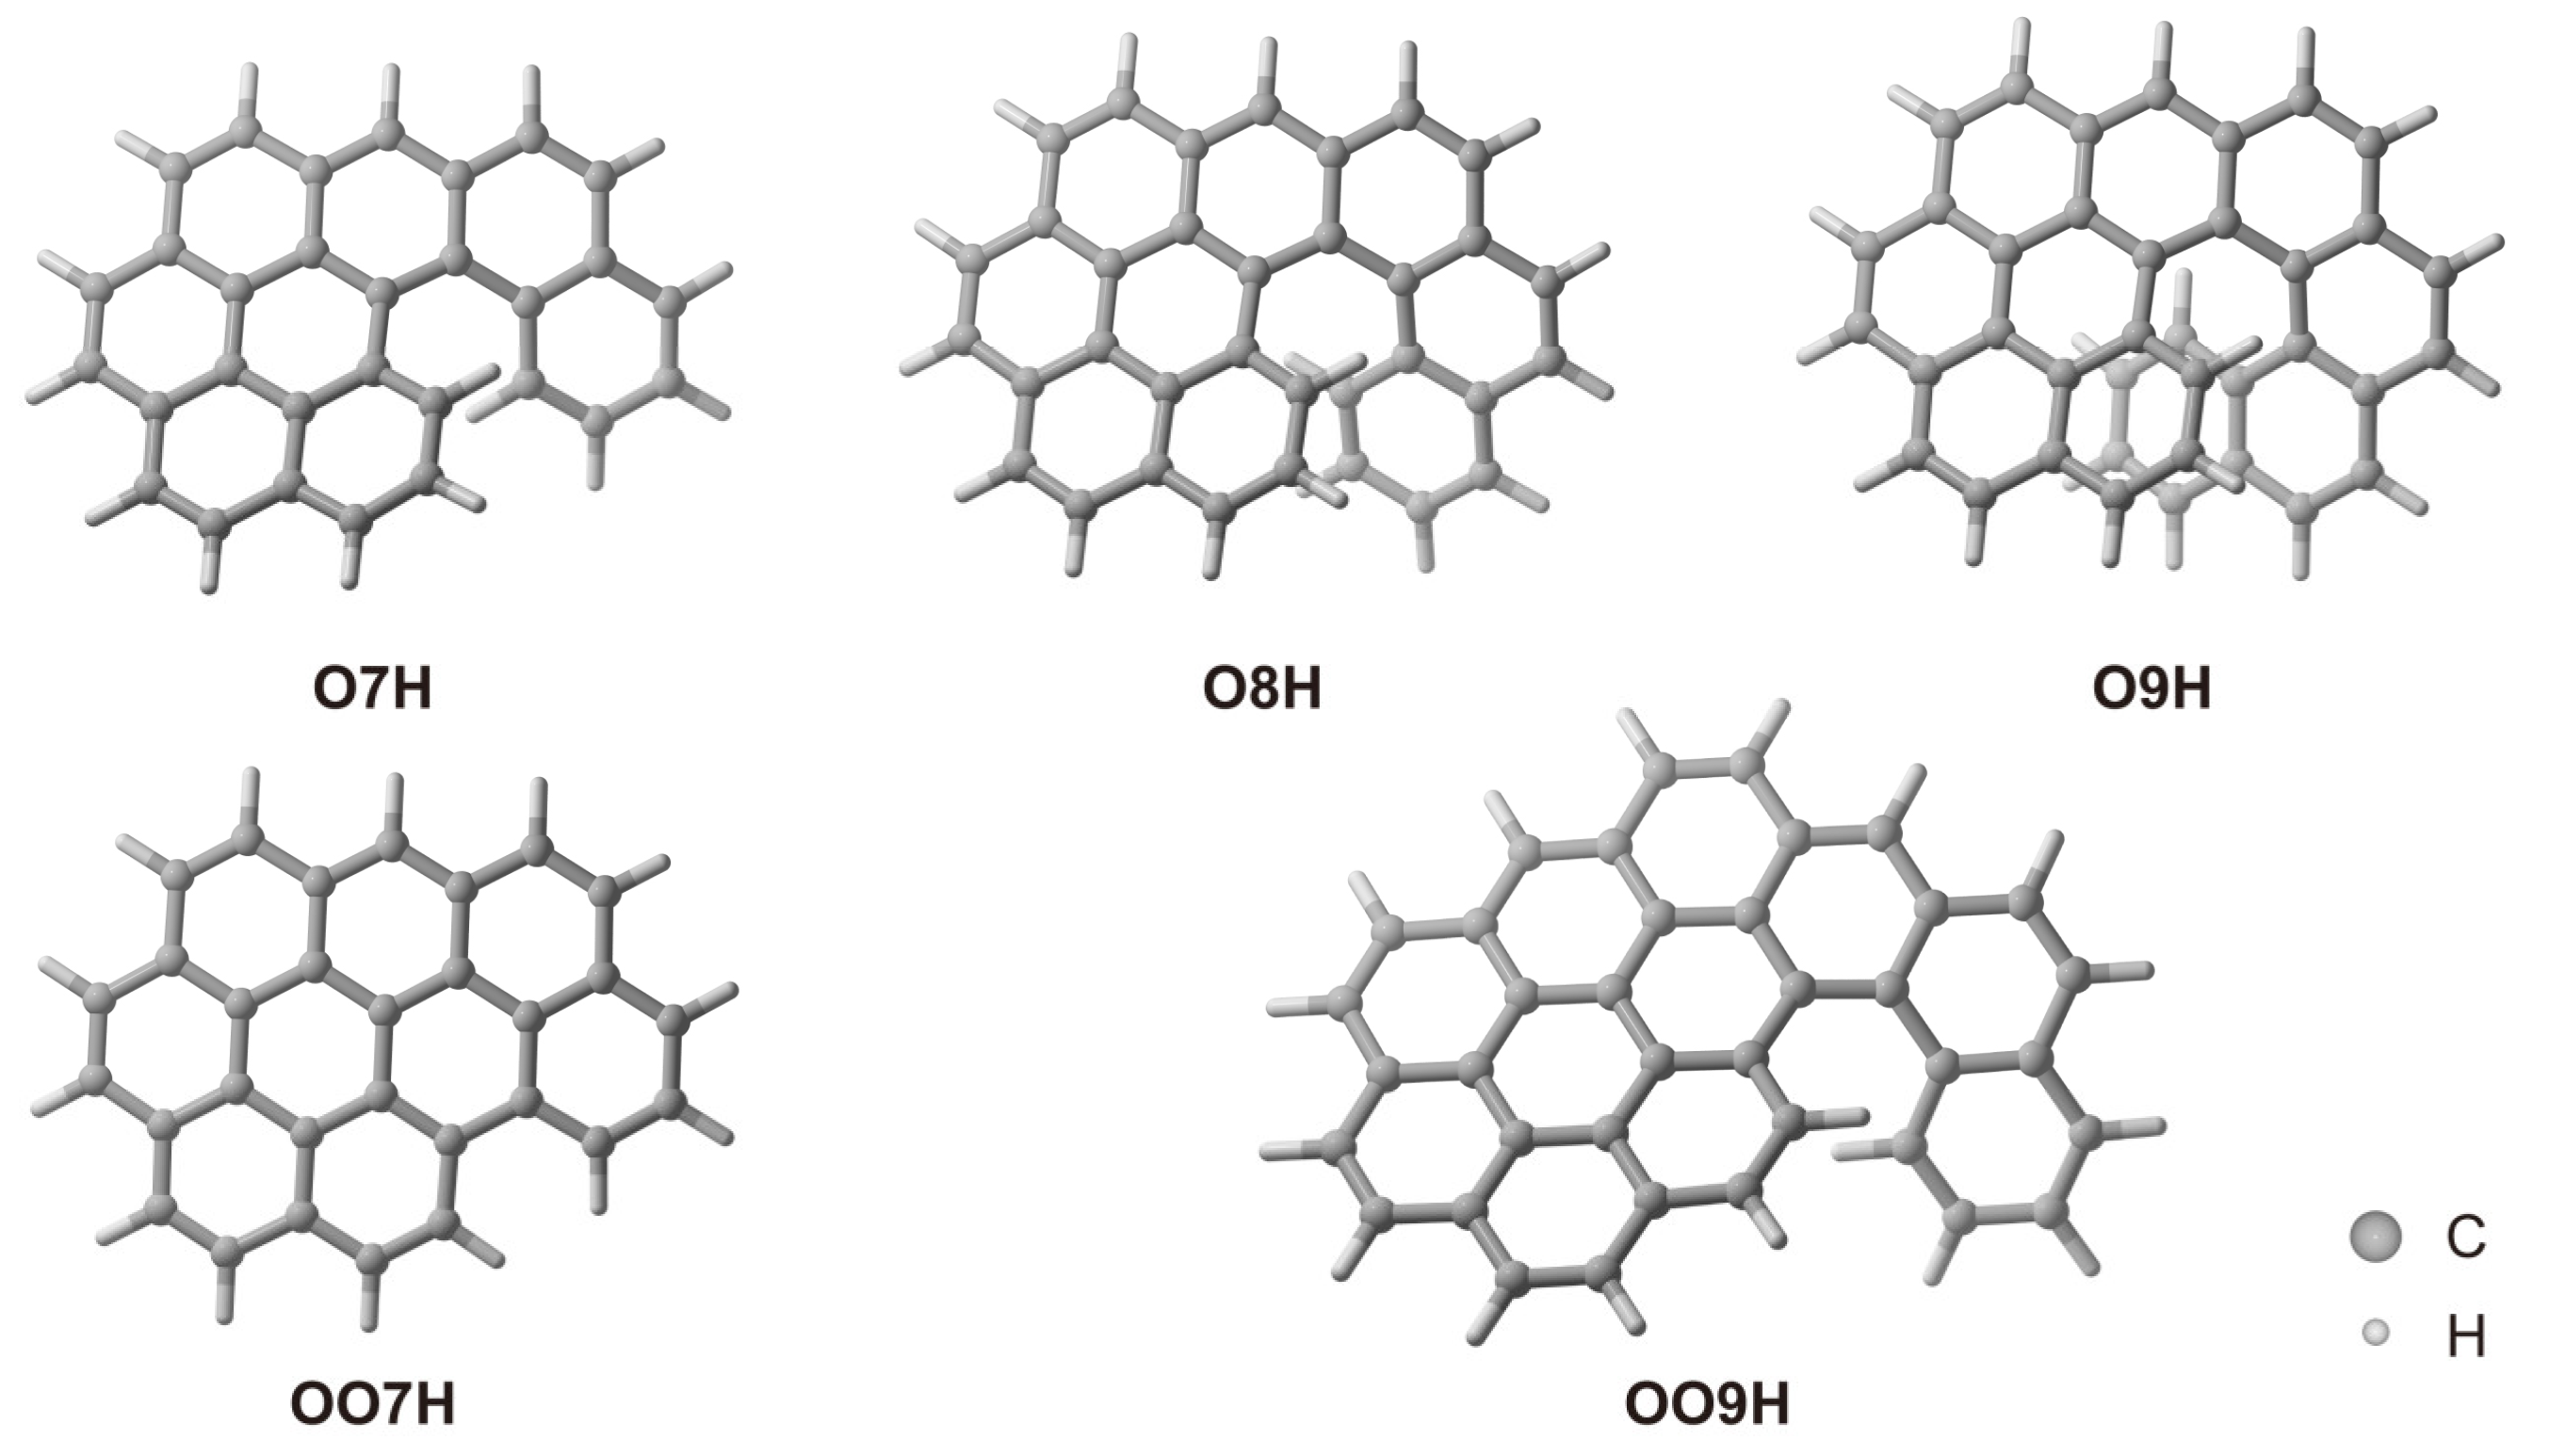
Figure 1. Optimized structure of O7H, O8H, O9H, OO7H, and OO9H.
Molecules 29 03999 g001
Figure 2. Pure calculated electronic spectra of O7H, O8H, and O9H compared to experimental data from Ref. [45].
Molecules 29 03999 g002
Figure 3. Molecular orbitals and energies (in eV) for BP, O7H, O8H, O9H, OO7H, and OO9H. Calculated using PBE0-D3(BJ)/def2-TZVP level with the isovalue set to 0.05 Å−3.
Molecules 29 03999 g003
Figure 4. Calculated normalized ABS and EMI spectra of O7H, O8H, and O9H for the transition S1 using the TD approach at 0 K and 300 K, with a comparison to the experimental results from Ref. [45]. (a) ABS spectrum of O7H, with a blueshift of 0.20 eV; (b) EMI spectrum of O7H, with a blueshift of 0.27 eV; (c) ABS spectrum of O8H, with a blueshift of 0.21 eV; (d) EMI spectrum of O8H, with a blueshift of 0.23 eV; (e) ABS spectrum of O9H, with a blueshift of 0.23 eV; (f) EMI spectrum of O9H, with a blueshift of 0.30 eV.
Molecules 29 03999 g004
Figure 5. Calculated ABS and EMI spectra of O7H, O8H, and O9H for the transition S1 using the TI approach at 0 K, with assignments of the main stick bands of ABS and EMI for O7H, O8H, and O9H. (a) ABS spectrum of O7H; (b) EMI spectrum of O7H; (c) ABS spectrum of O8H; (d) EMI spectrum of O8H; (e) ABS spectrum of O9H; (f) EMI spectrum of O9H.
Molecules 29 03999 g005
Figure 6. Selected normal modes of vibrations of O7H. (a) Selected normal modes of vibrations of O7H at the S0 state; (b) selected normal modes of vibrations of O7H at the S1 state.
Molecules 29 03999 g006
Figure 7. Calculated ECD and CPL spectra of O8H and O9H for the transition S1 using the TD approach at 0 K, with a comparison to the experimental results from Ref. [45]. (a) ECD spectrum of O8H, with a blueshift of 0.22 eV; (b) CPL spectrum of O8H, with a blueshift of 0.20 eV; (c) ECD spectrum of O9H, with a blueshift of 0.23 eV; (d) CPL spectrum of O9H, with a blueshift of 0.30 eV.
Molecules 29 03999 g007
Table 1. Absorption and emission information of nanographenes.
AbsorptionEmissionStokes Shift (nm)
E (eV)λ (nm)fE (eV)λ (nm)f
O7H2.764490.16052.225580.1302109
O8H2.674650.12102.225590.126394
O9H2.524930.07771.896570.0495164
OO7H3.034090.12122.804430.188334
OO9H2.604770.08241.936410.0554164
Table 2. Selected vibrational modes relevant to the vibronic structures of O7H, O8H, and O9H.
O7HO8HO9H
S0 Modeω0 (cm−1)S1 Modeω1 (cm−1)S0 Modeω0 (cm−1)S1 Modeω1 (cm−1)S0 Modeω0 (cm−1)S1 Modeω1 (cm−1)
387144139134356364
511438836536471127110
61526156486599916810182
92172244320400132701324415281
8813151031502991292108142213815911221423
1081592 1081427 1361562
Disclaimer/Publisher’s Note: The statements, opinions and data contained in all publications are solely those of the individual author(s) and contributor(s) and not of MDPI and/or the editor(s). MDPI and/or the editor(s) disclaim responsibility for any injury to people or property resulting from any ideas, methods, instructions or products referred to in the content.