
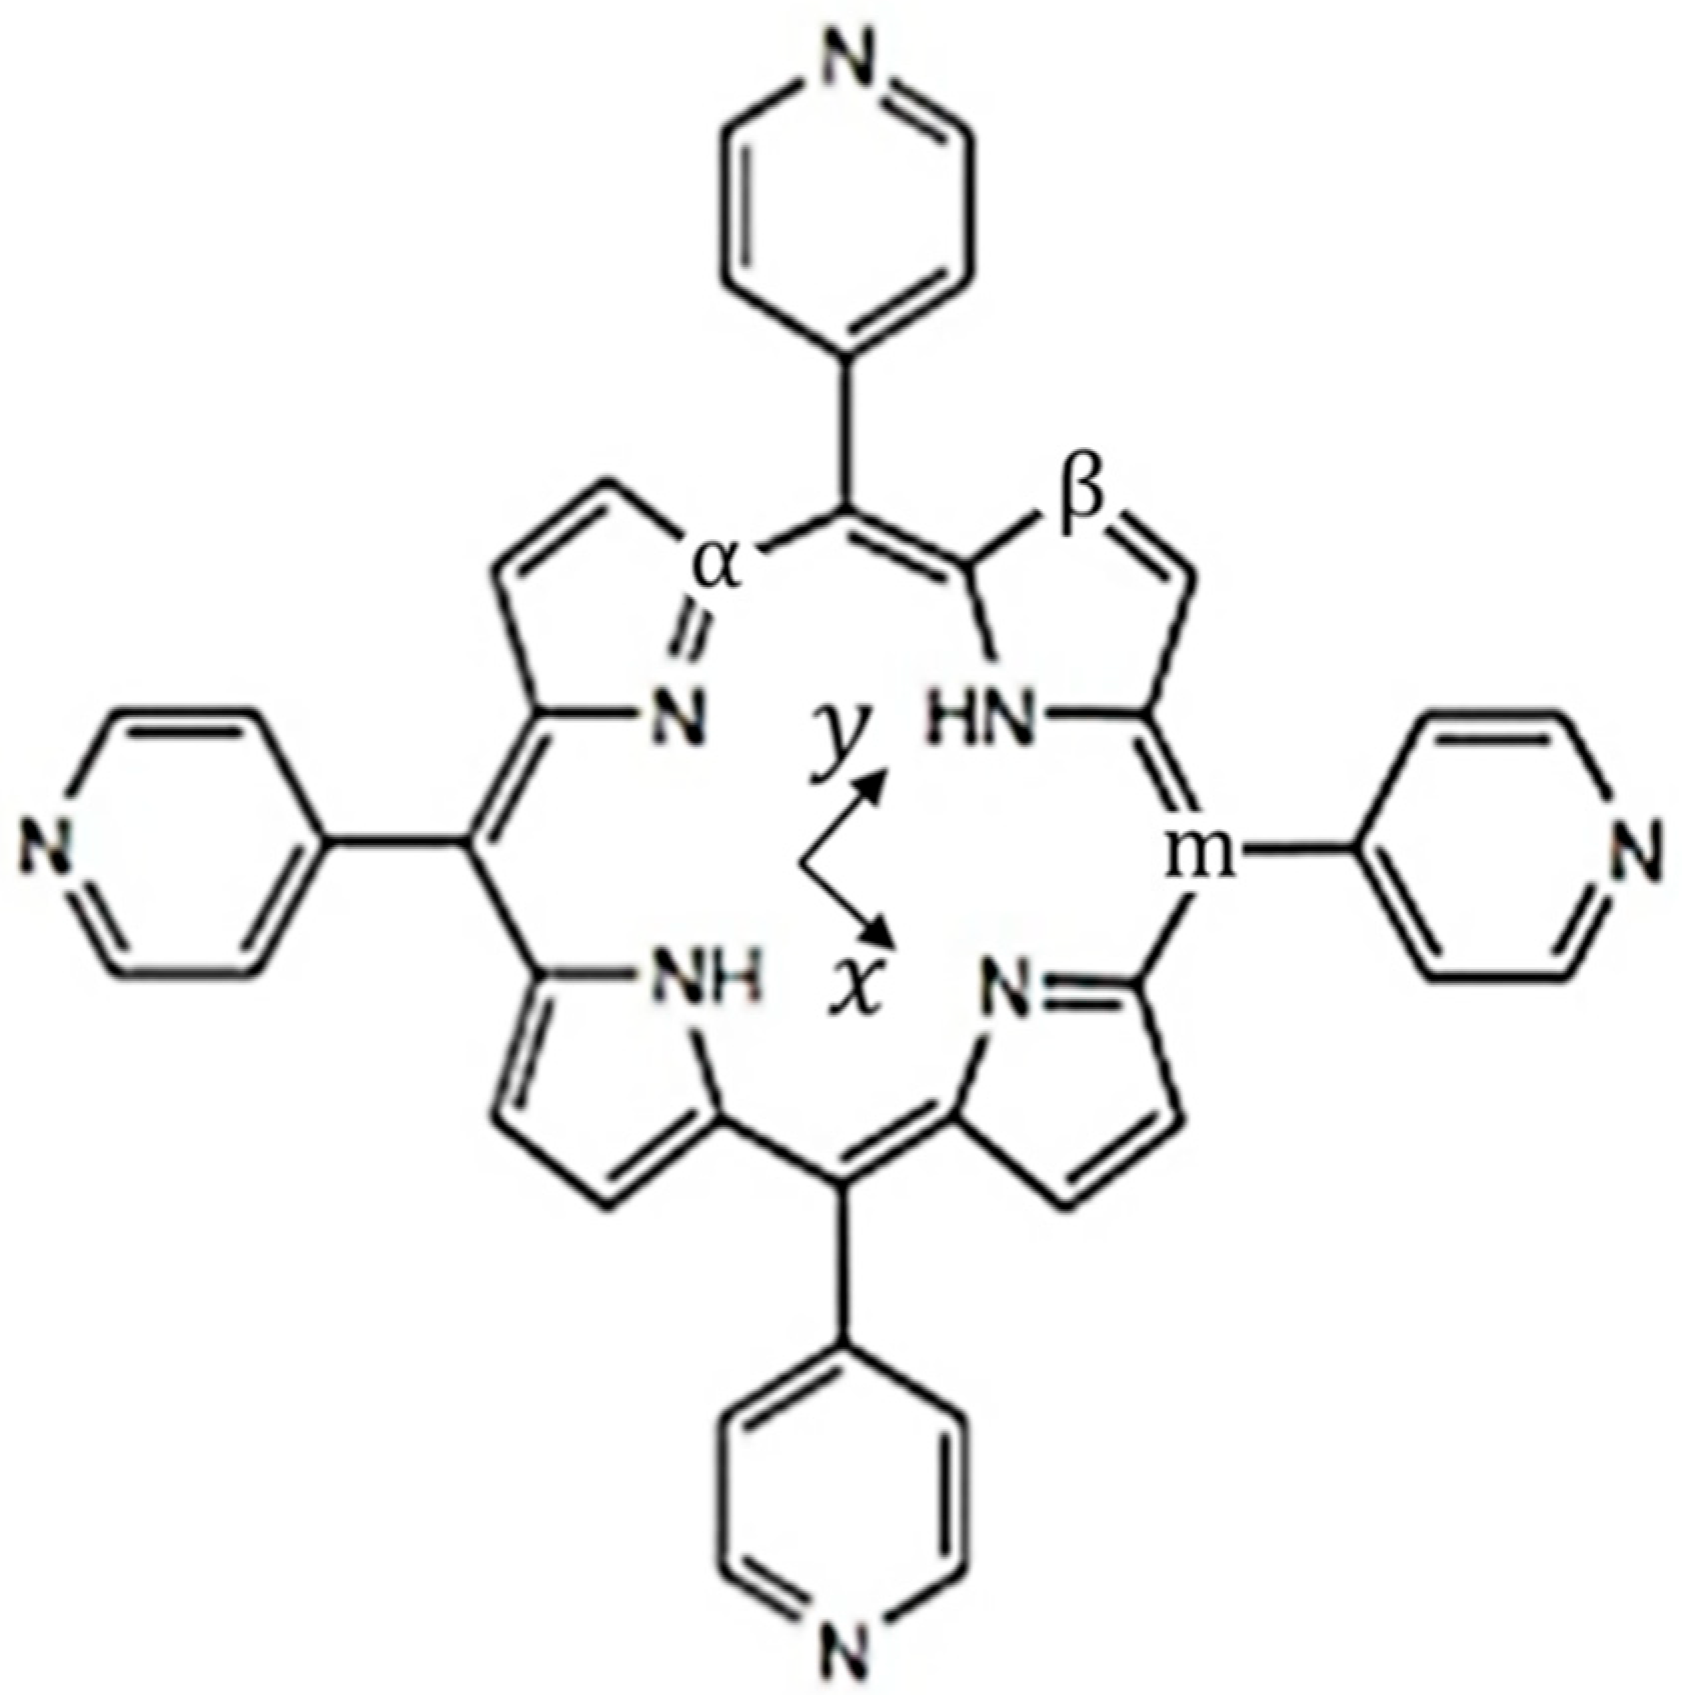
Raman Spectroscopy on Free-Base Meso-tetra(4-pyridyl) Porphyrin under Conditions of Low Temperature and High Hydrostatic Pressure
 , , and
Abstract
1. Introduction
2. Results and Discussion
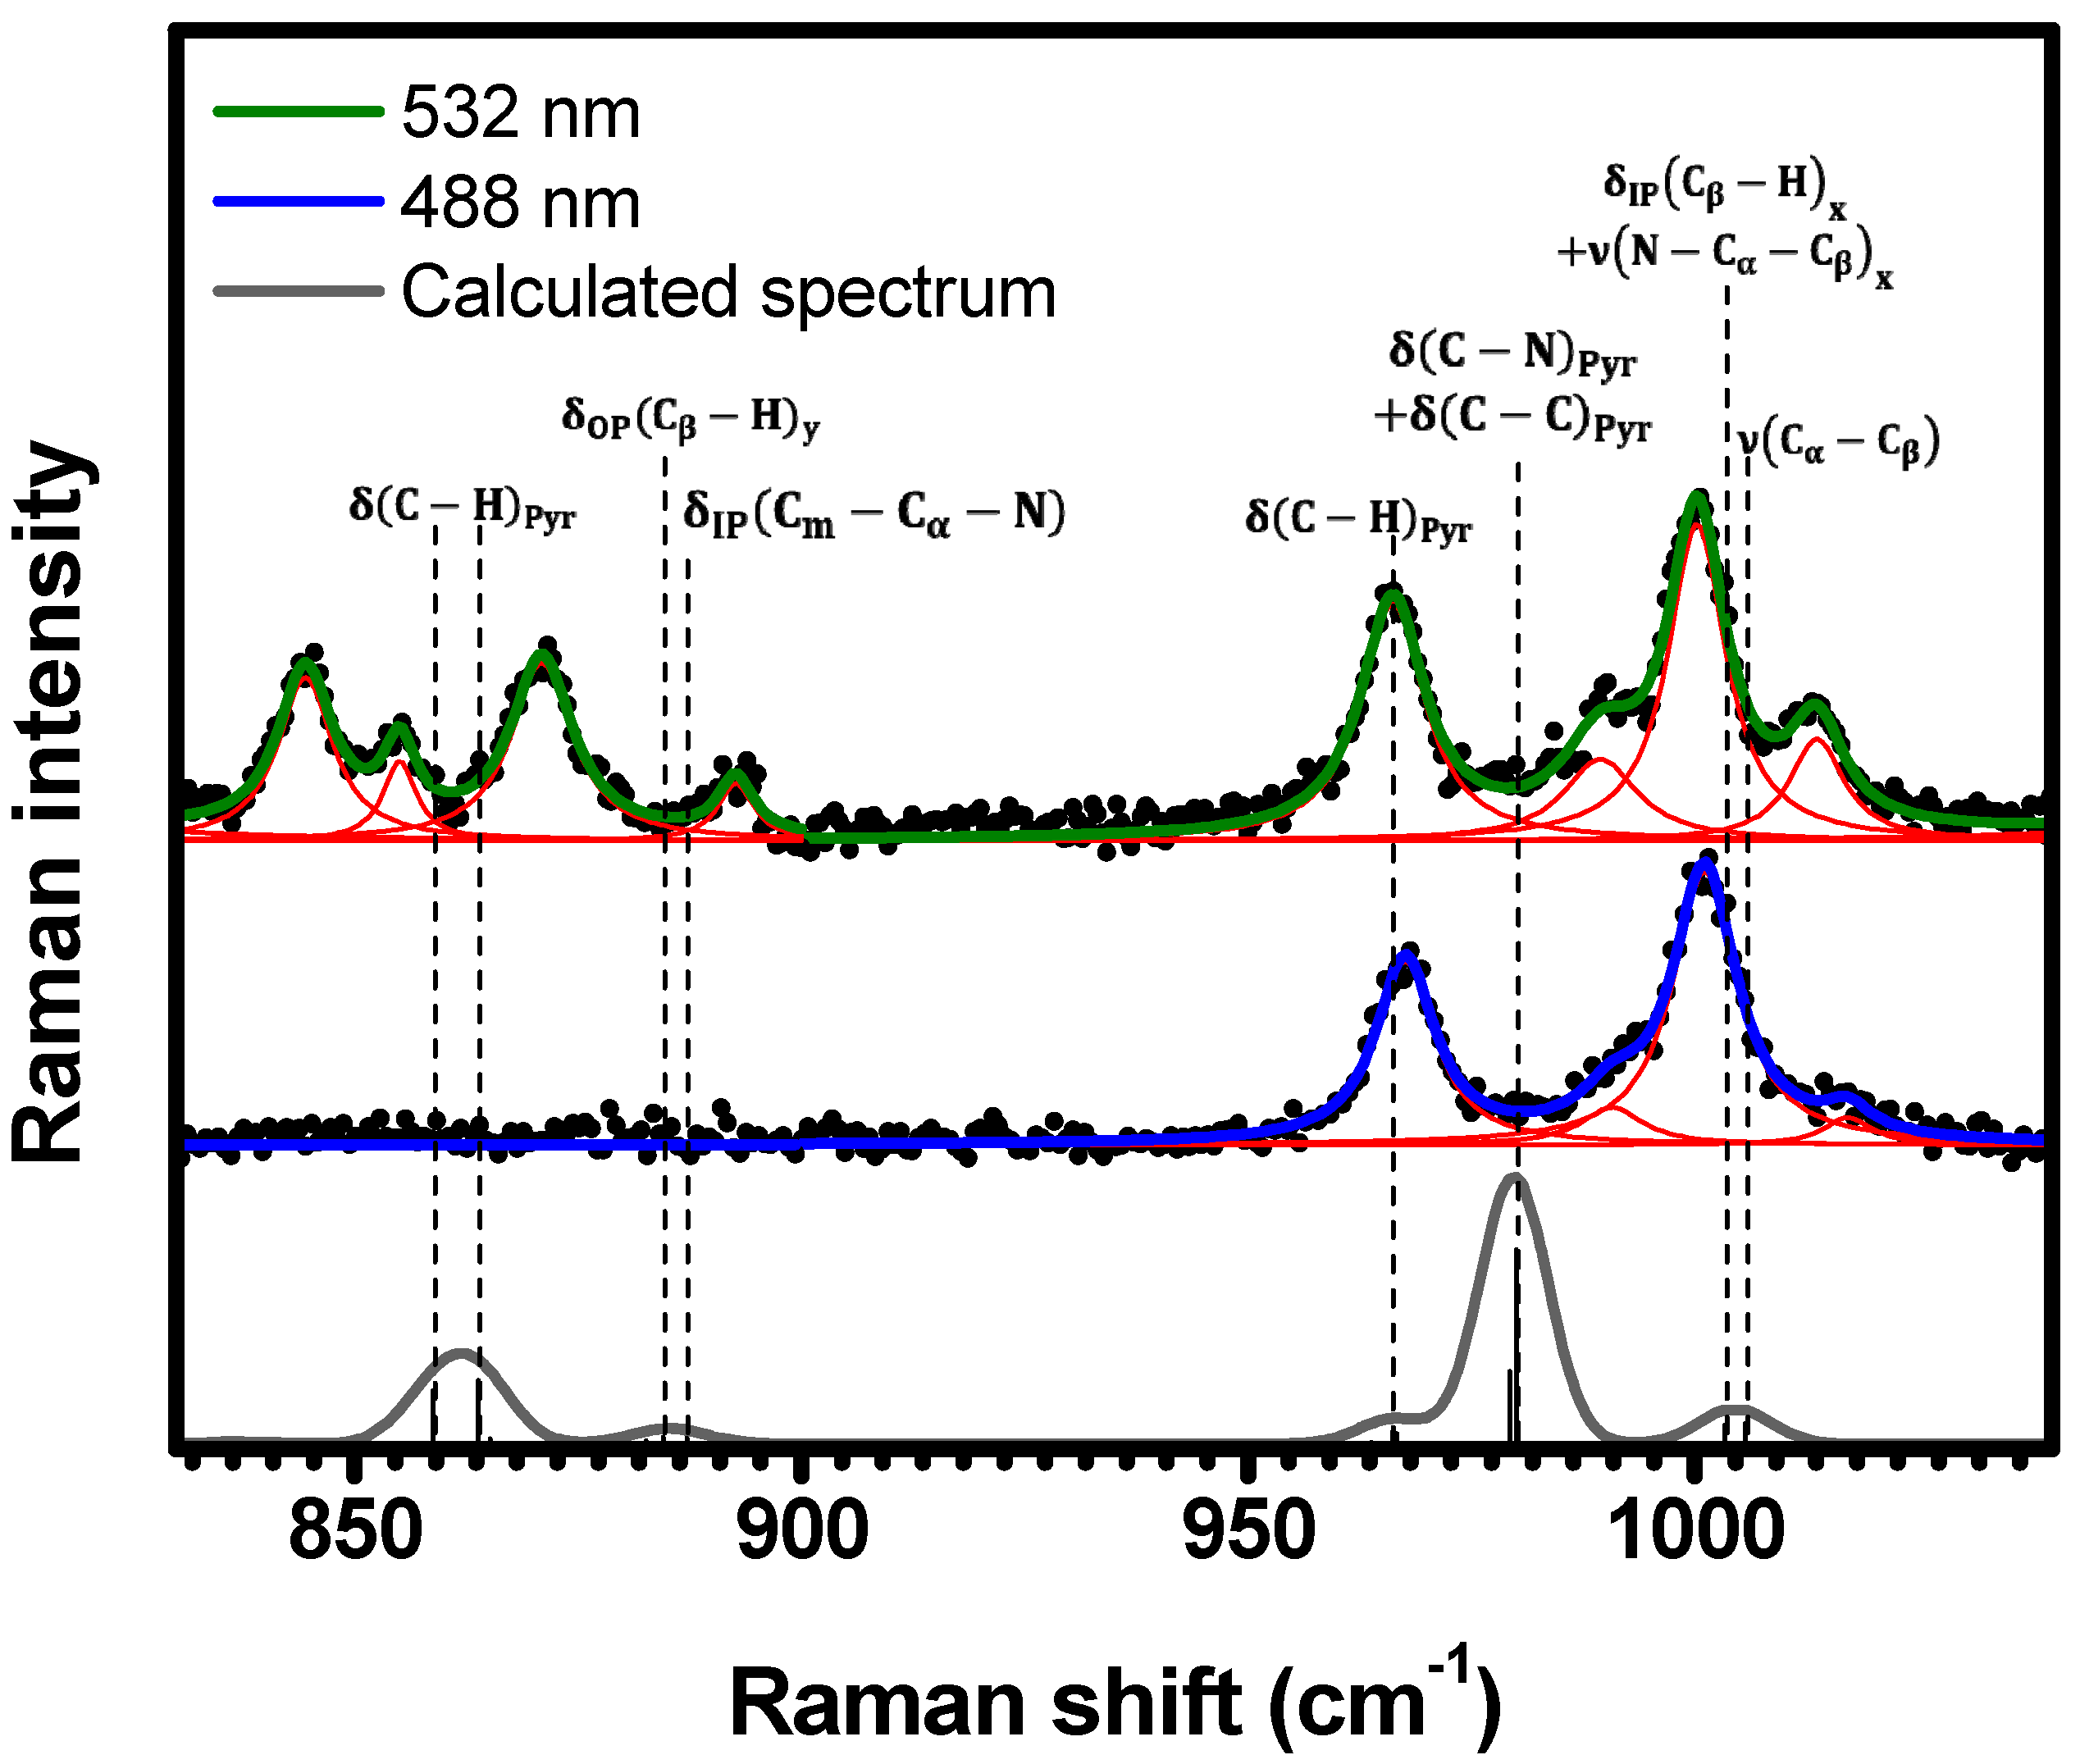
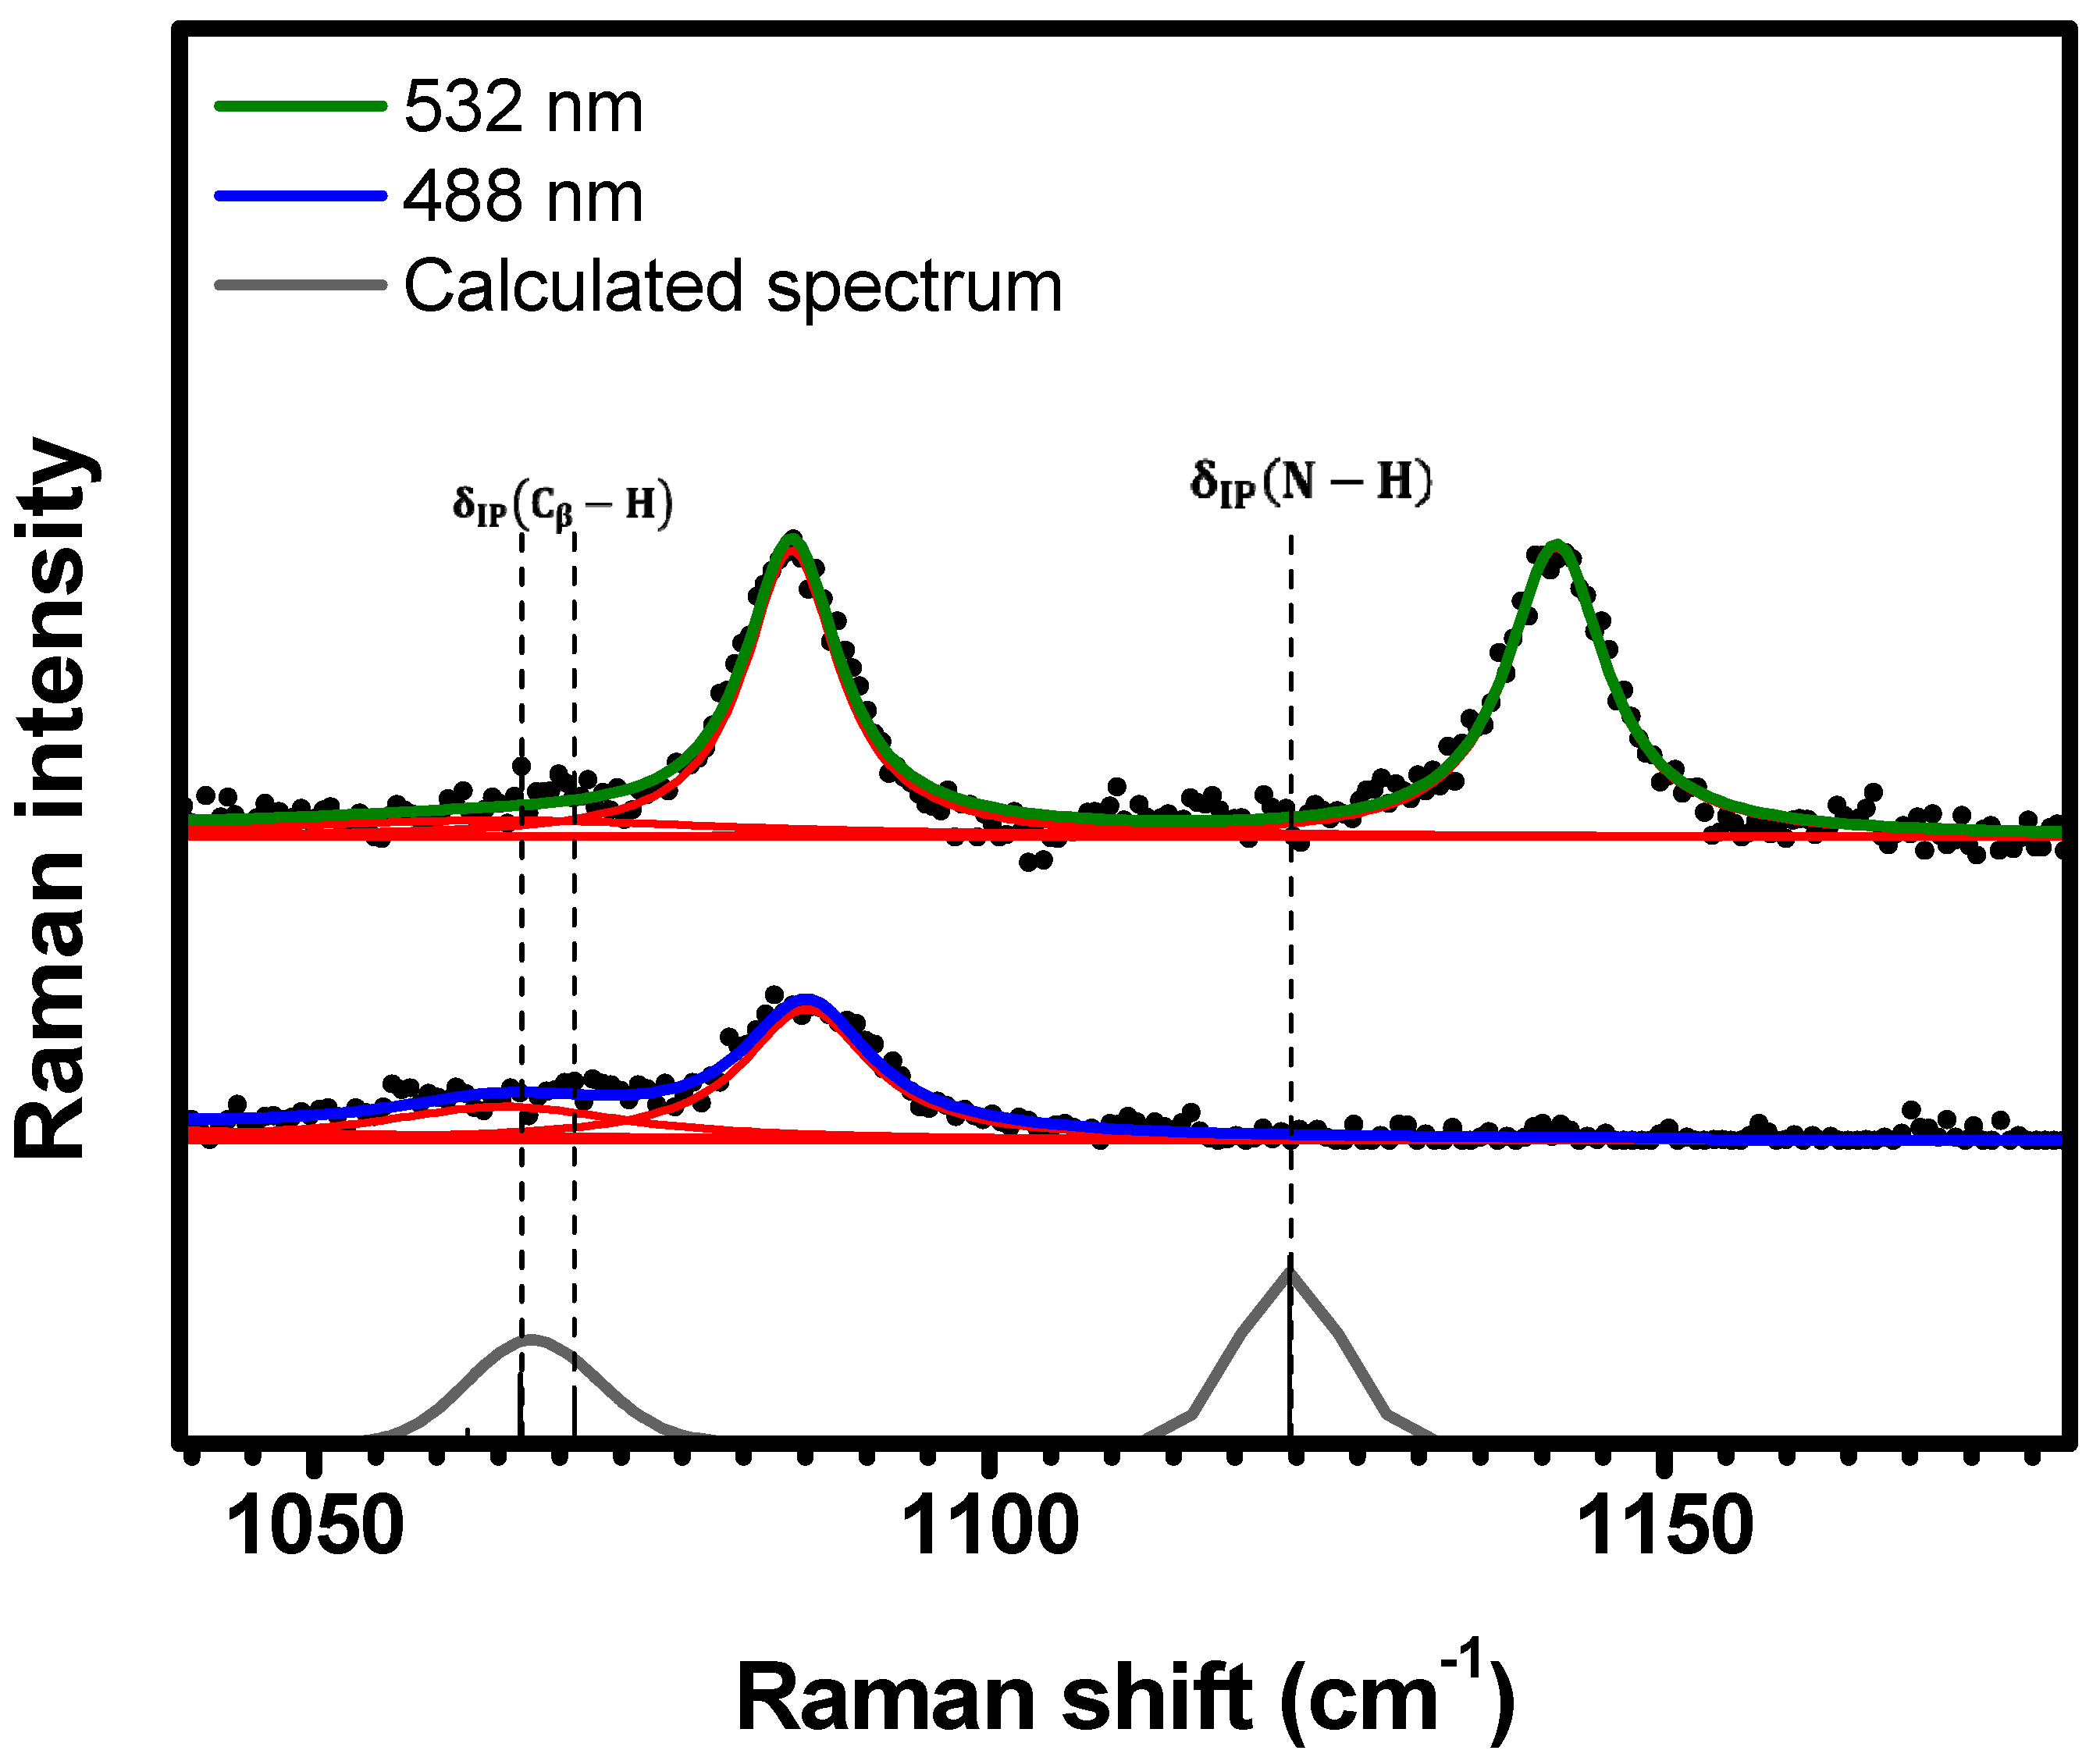
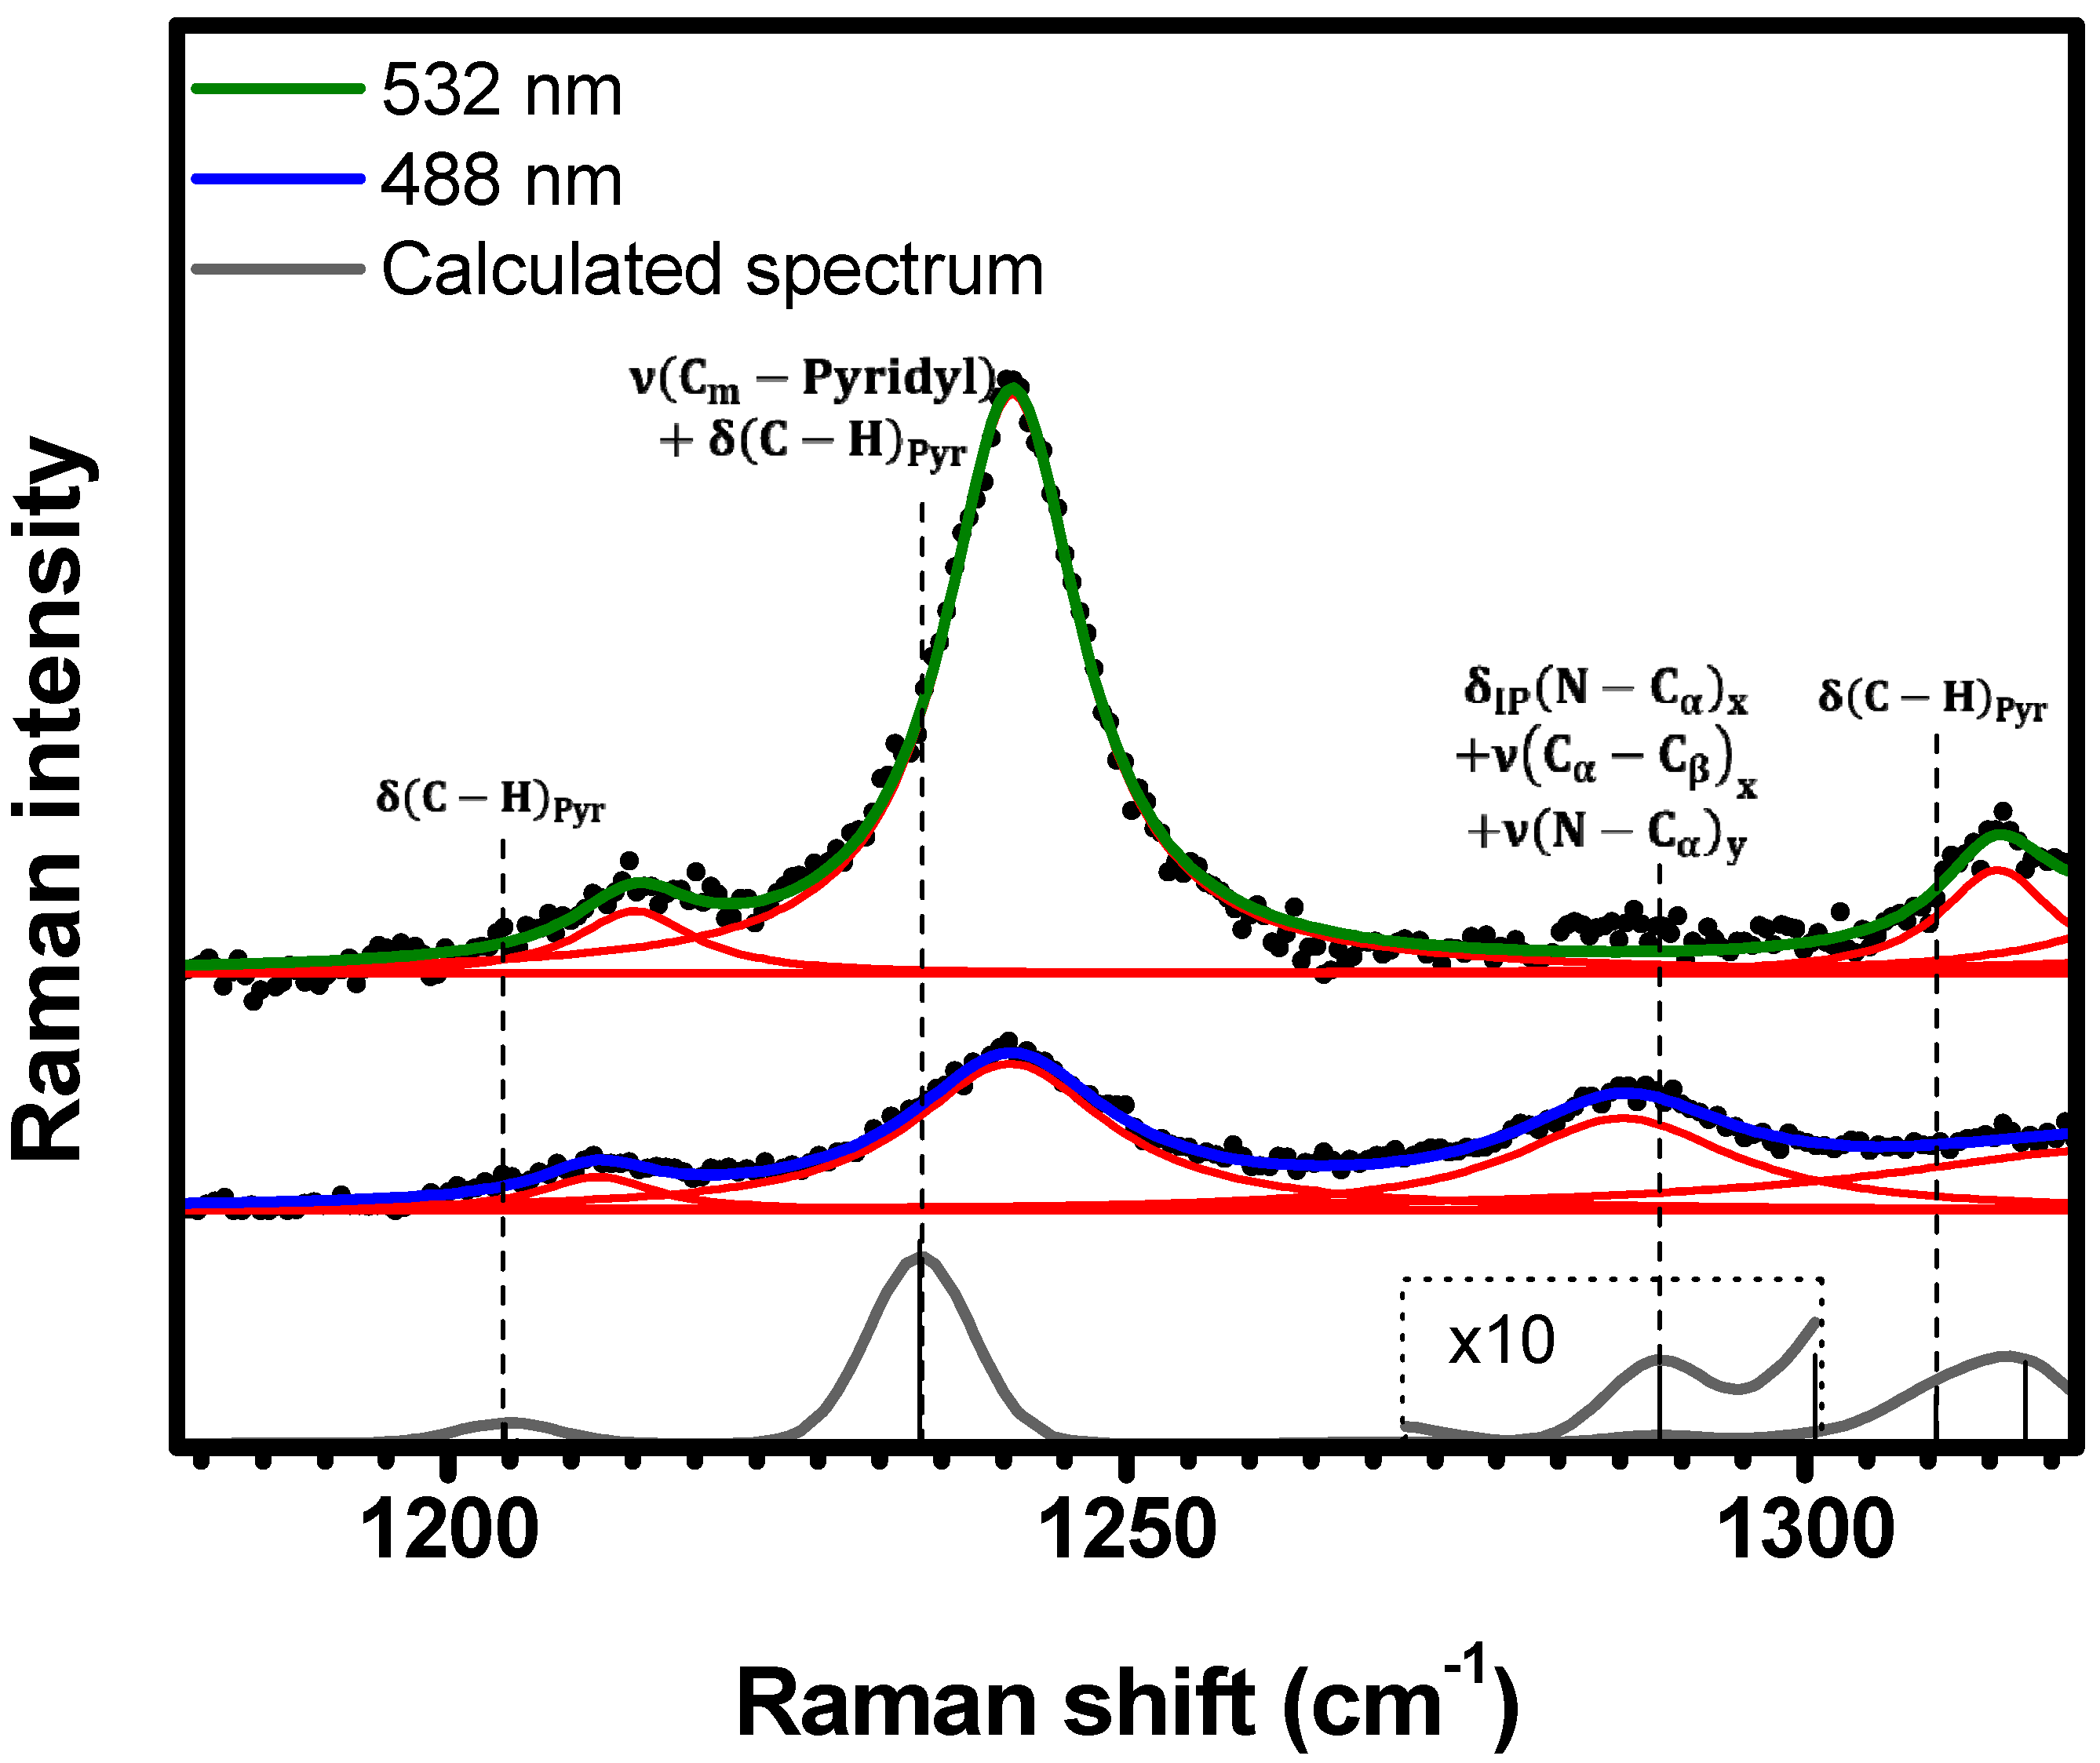
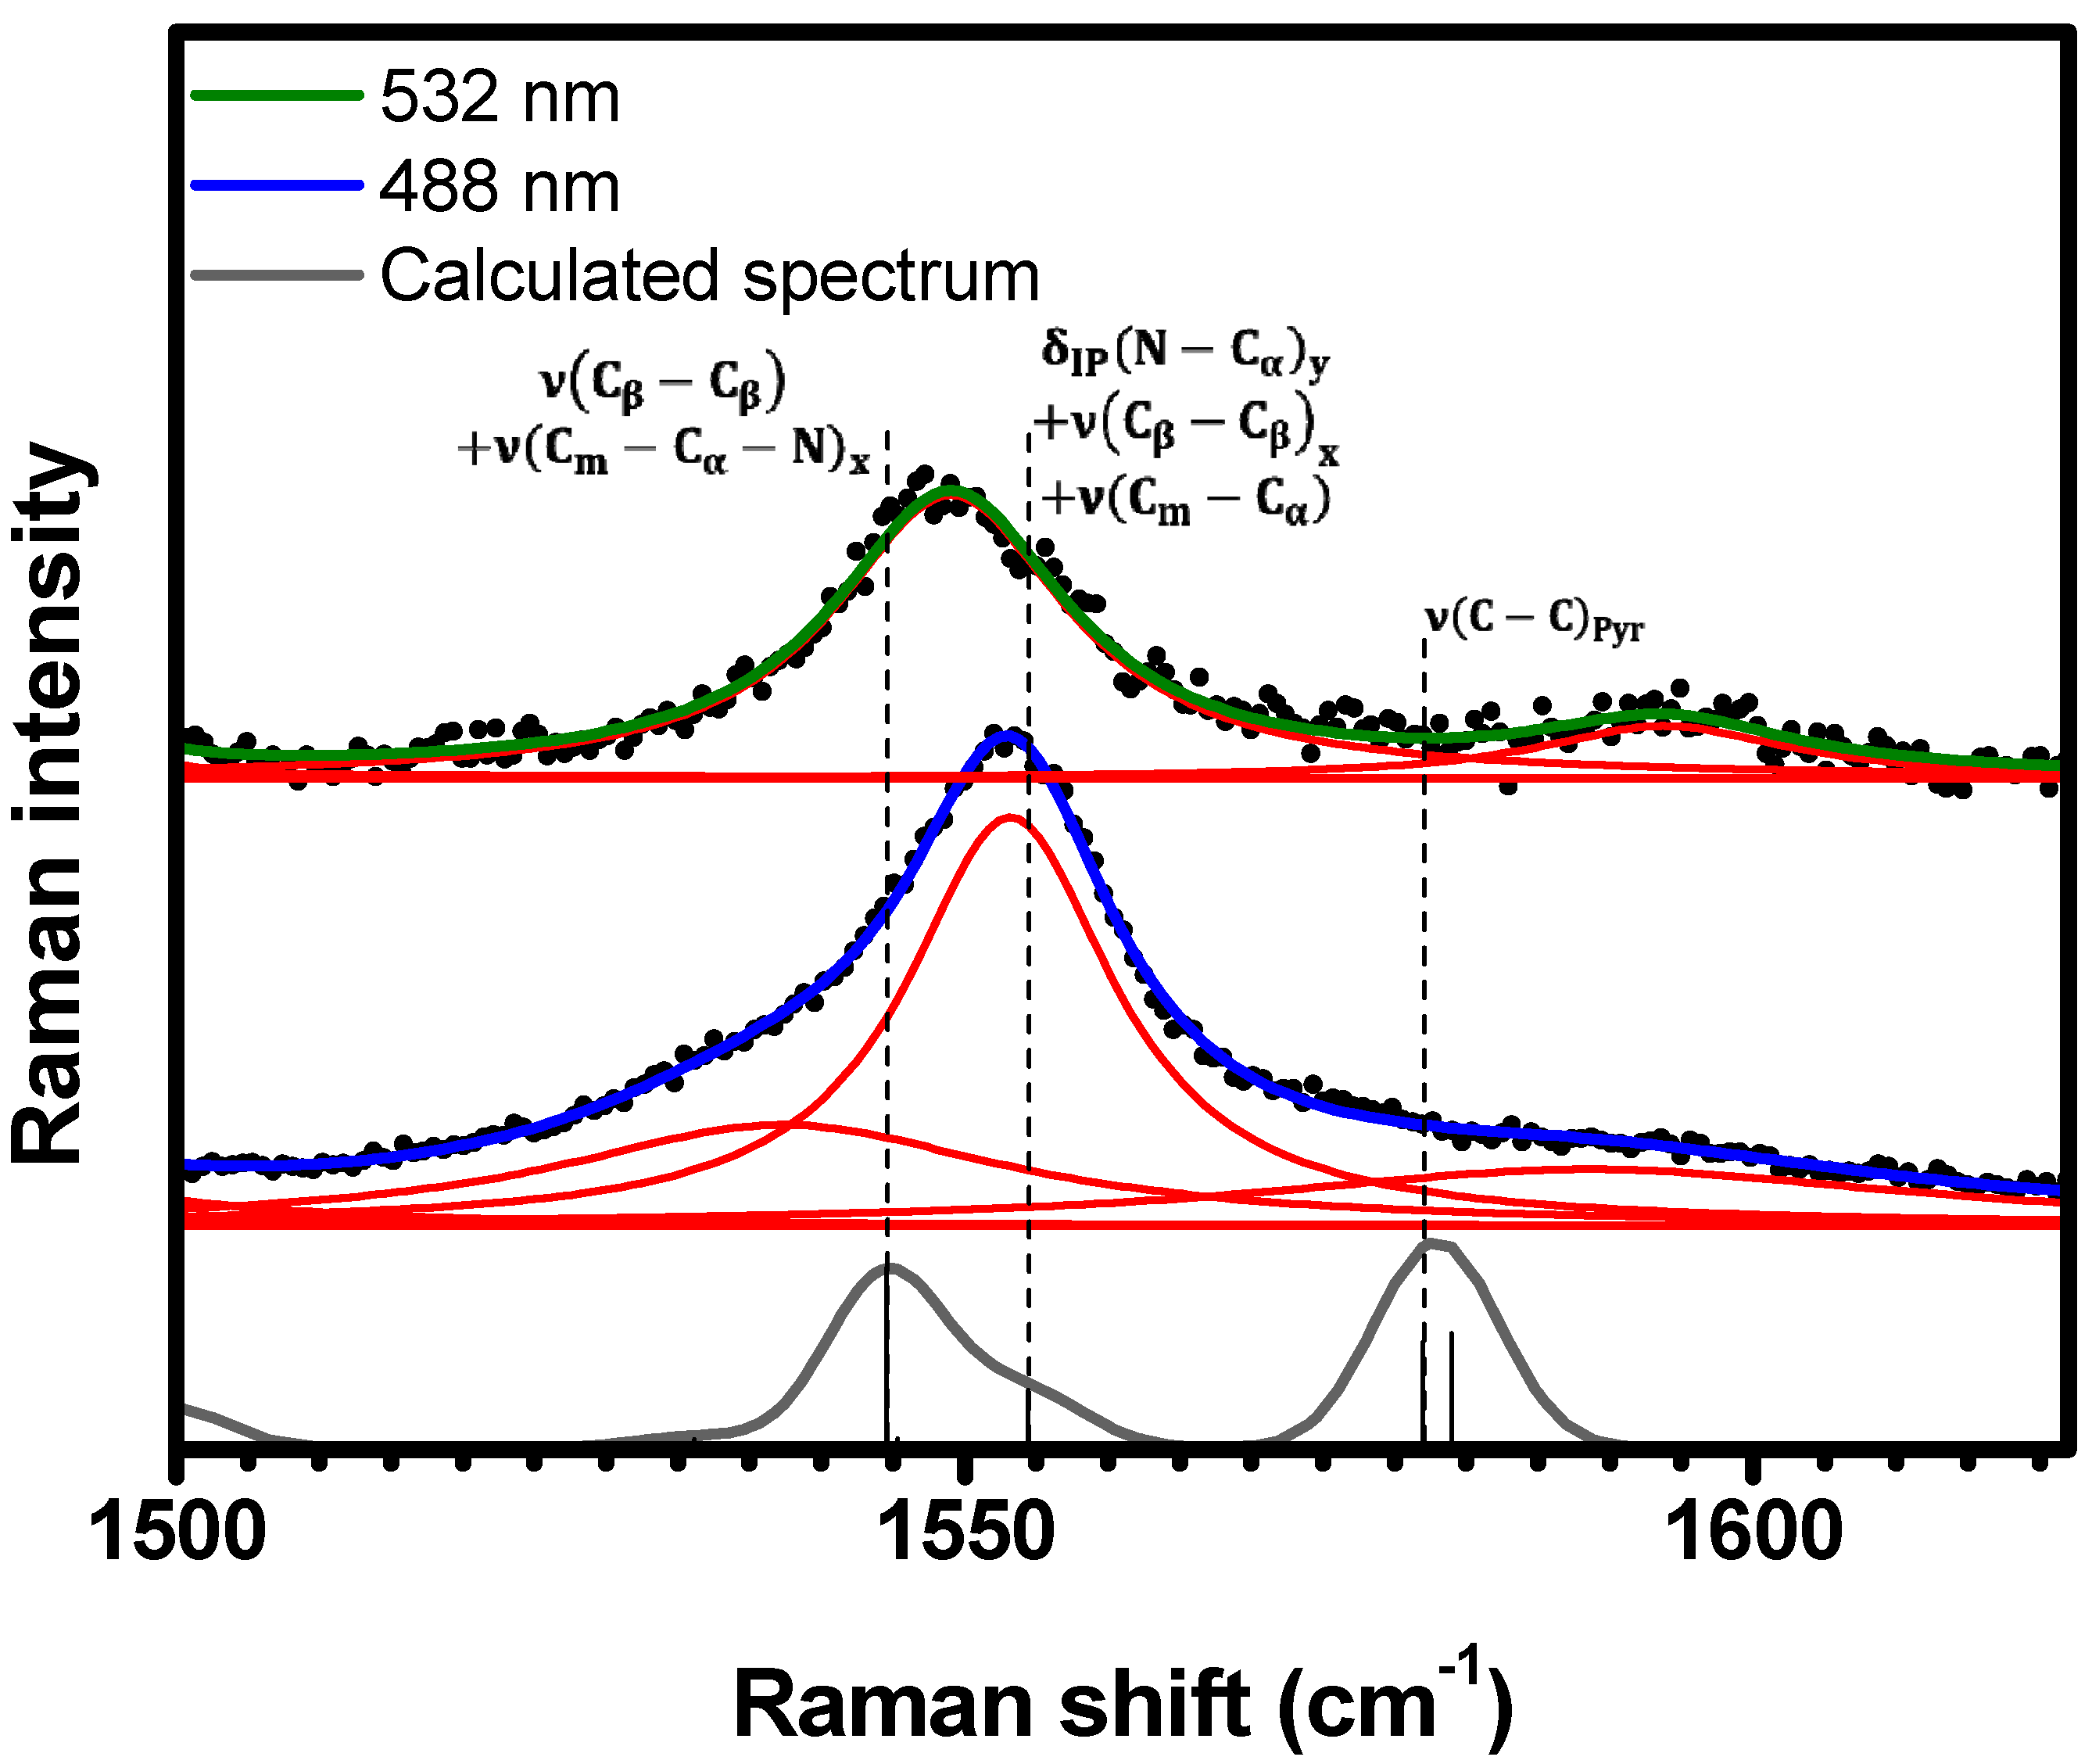
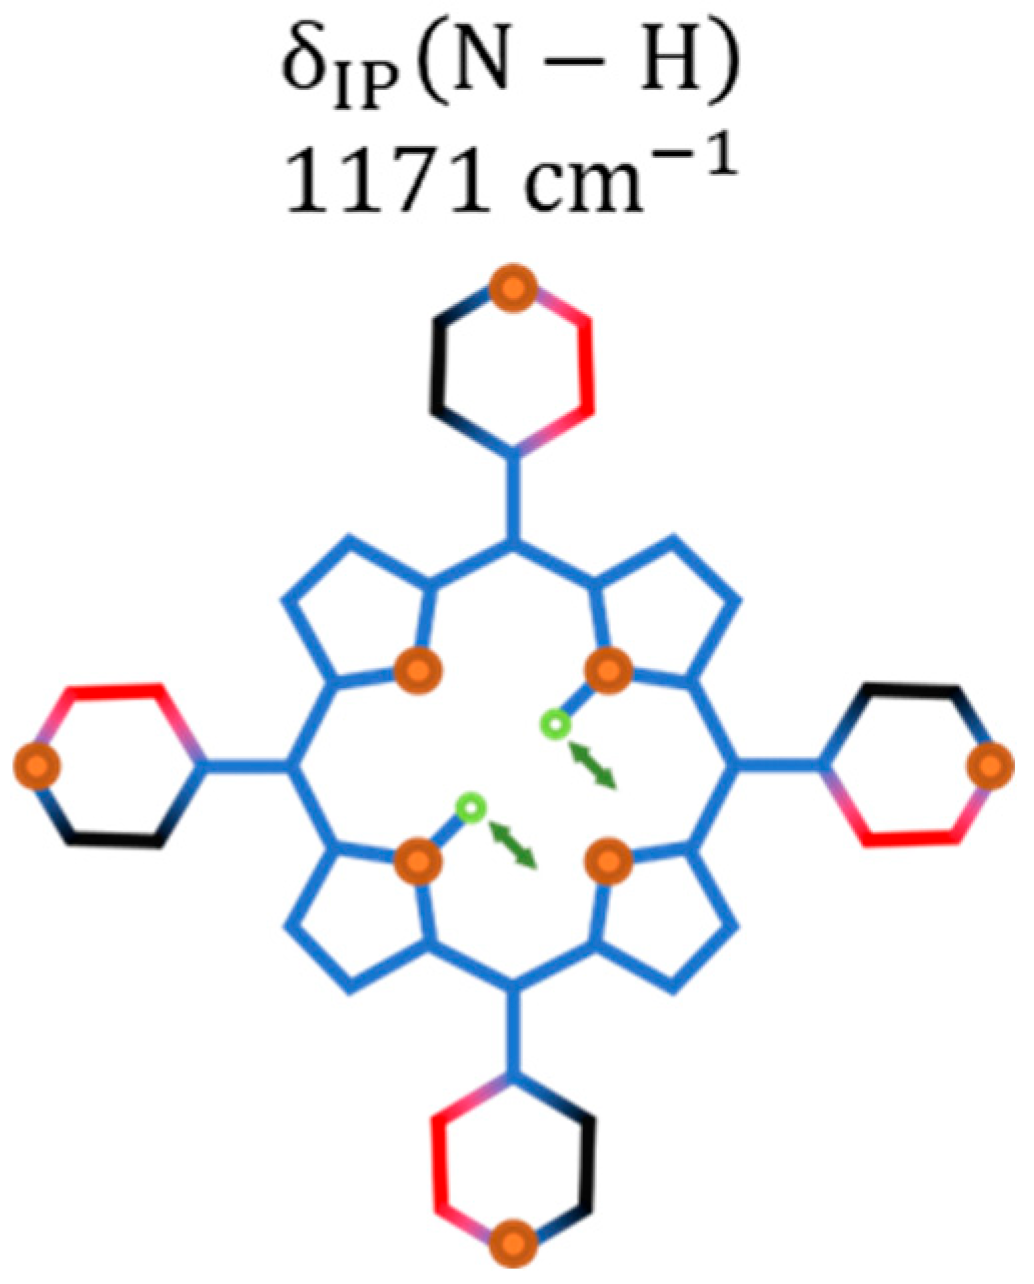
2.1. Raman Bands Assignments
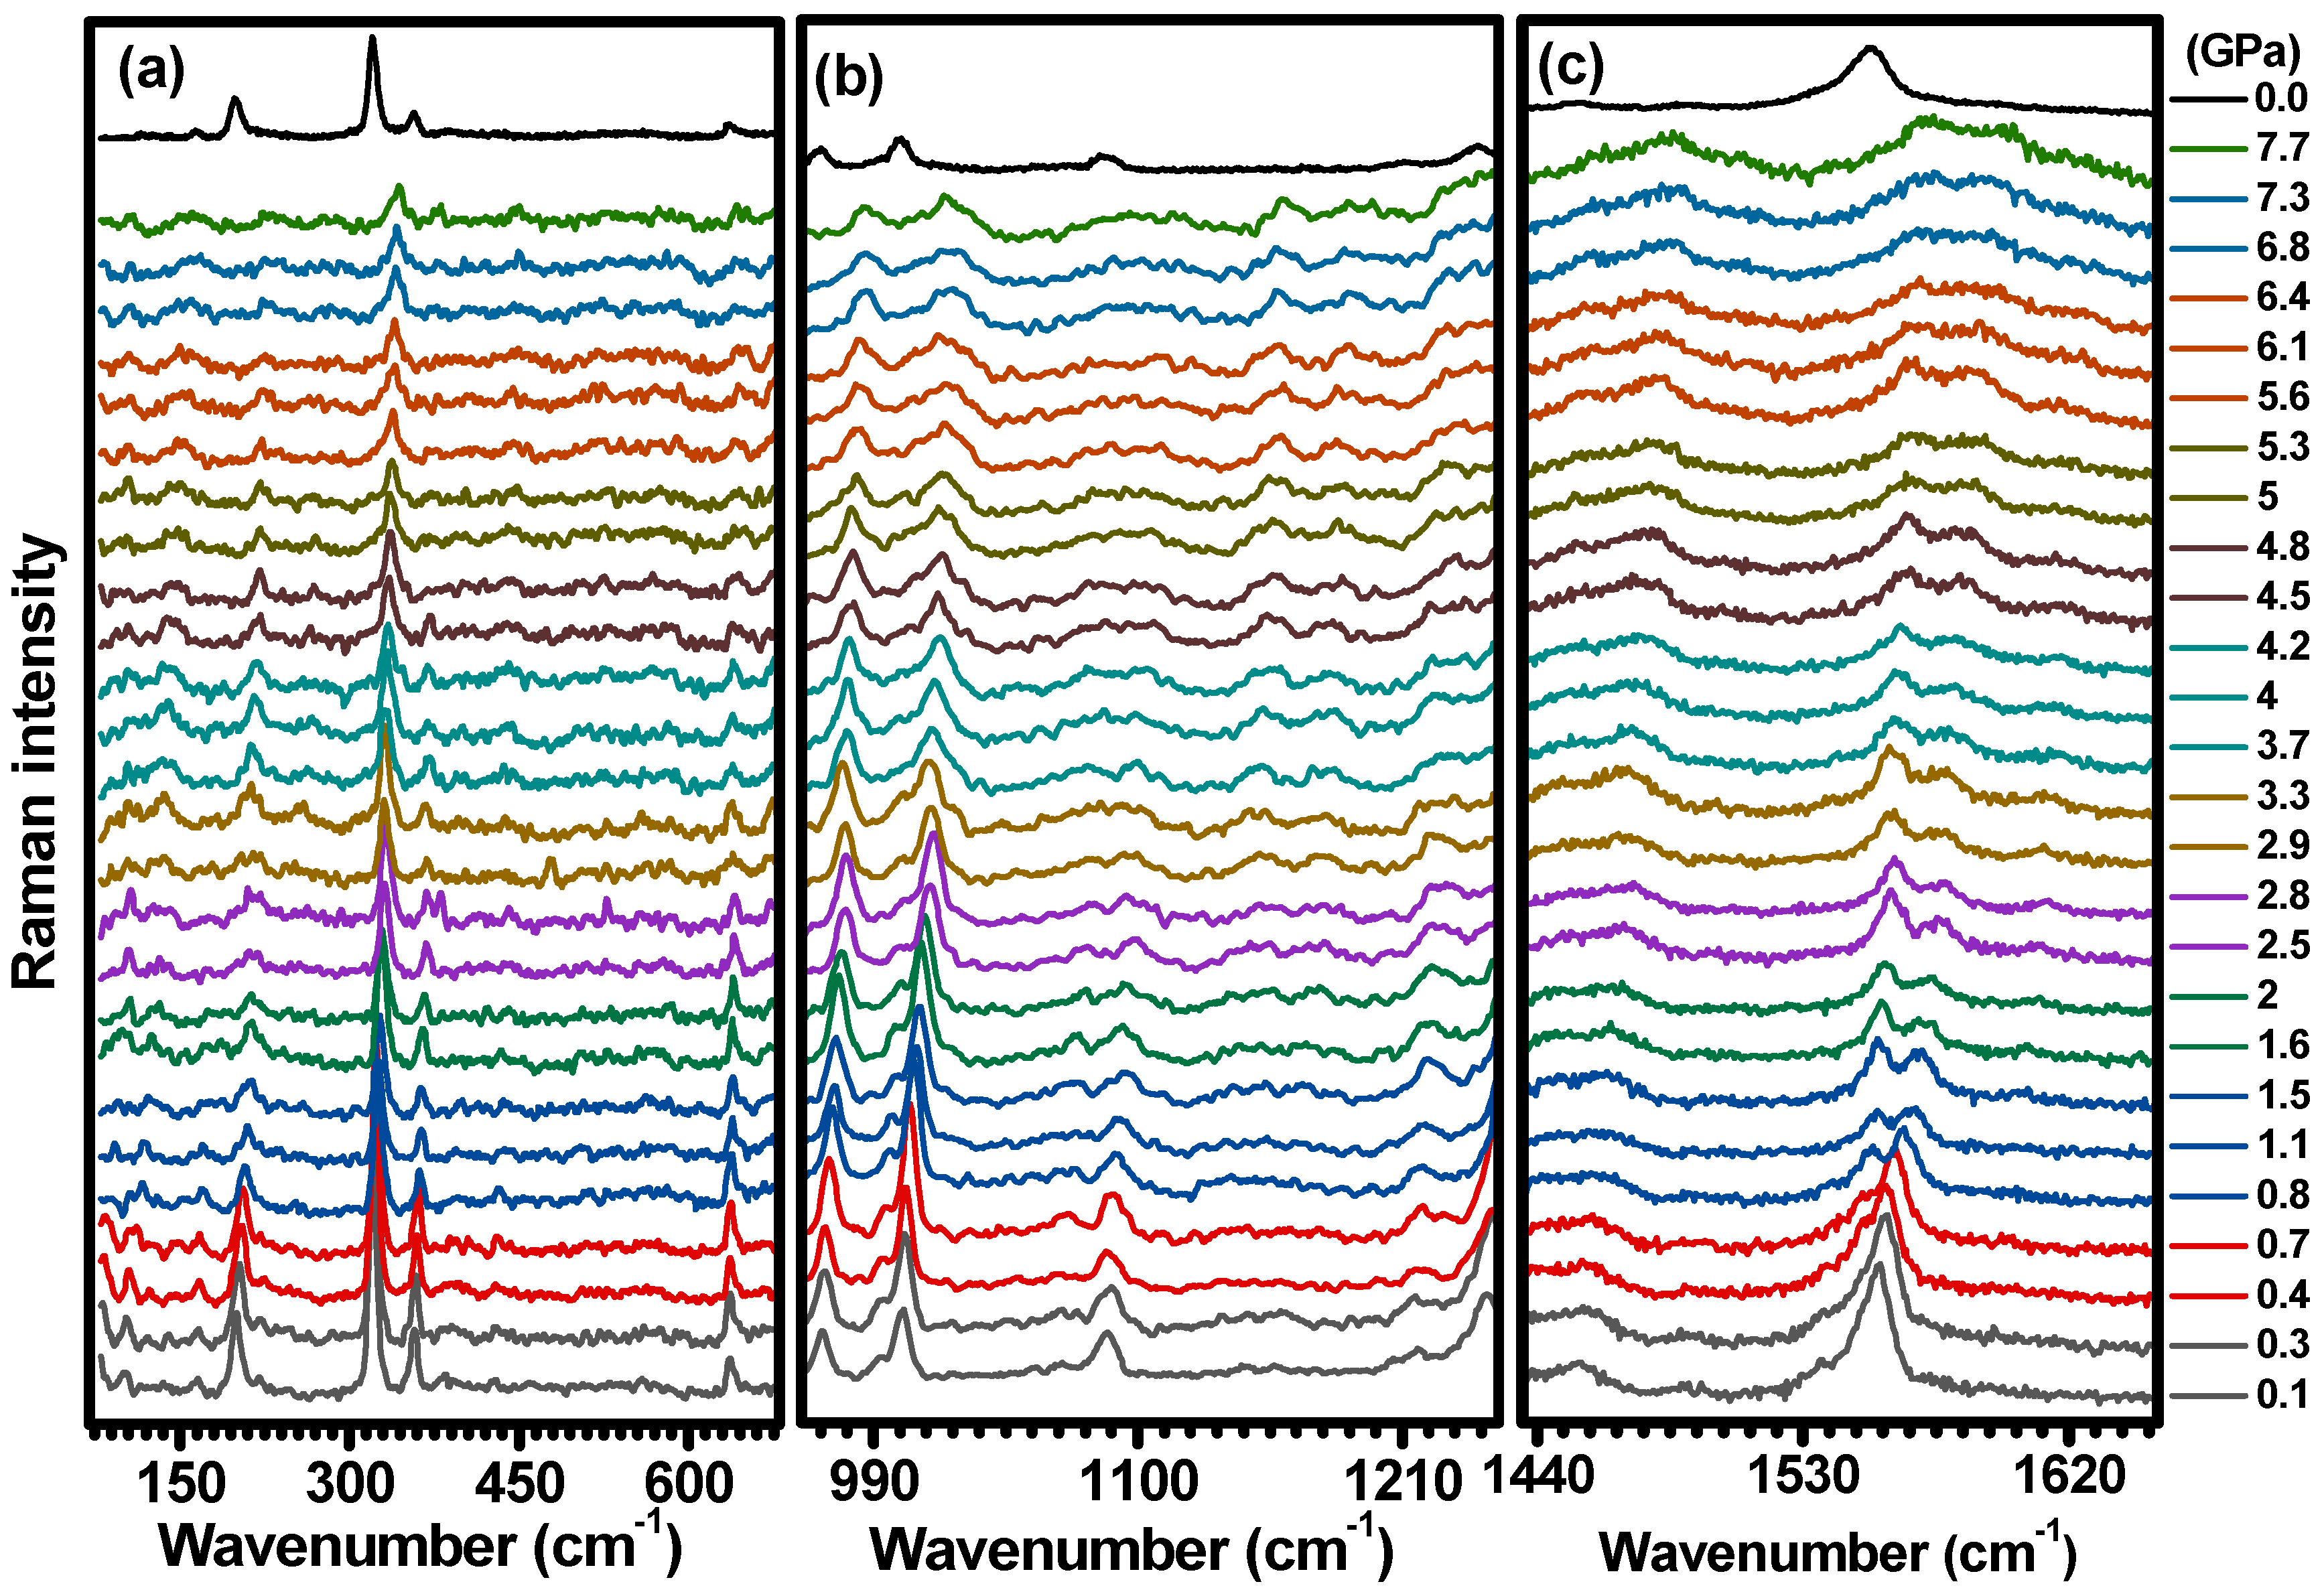
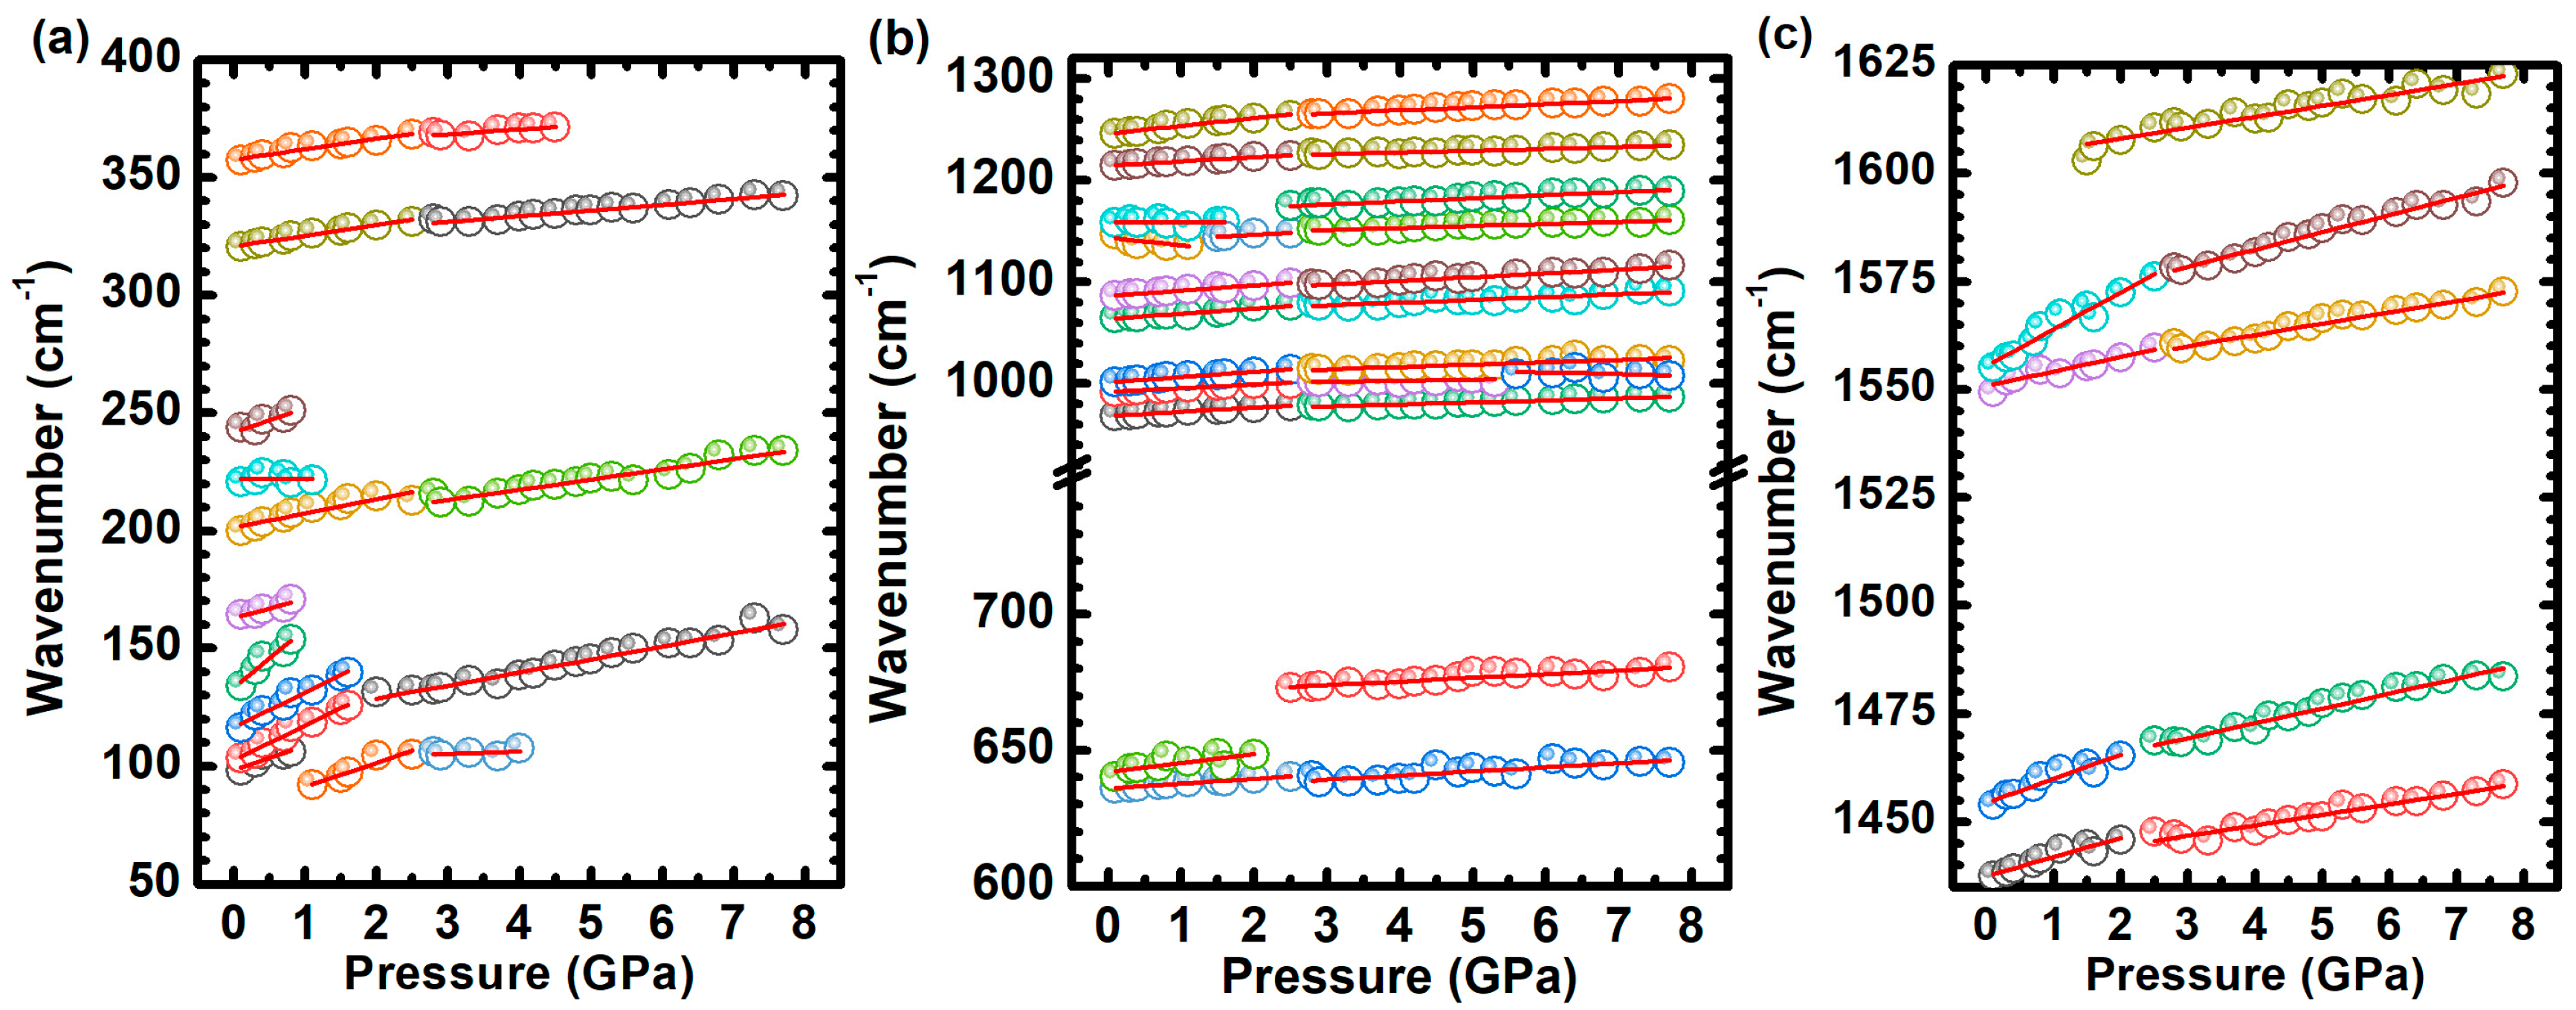
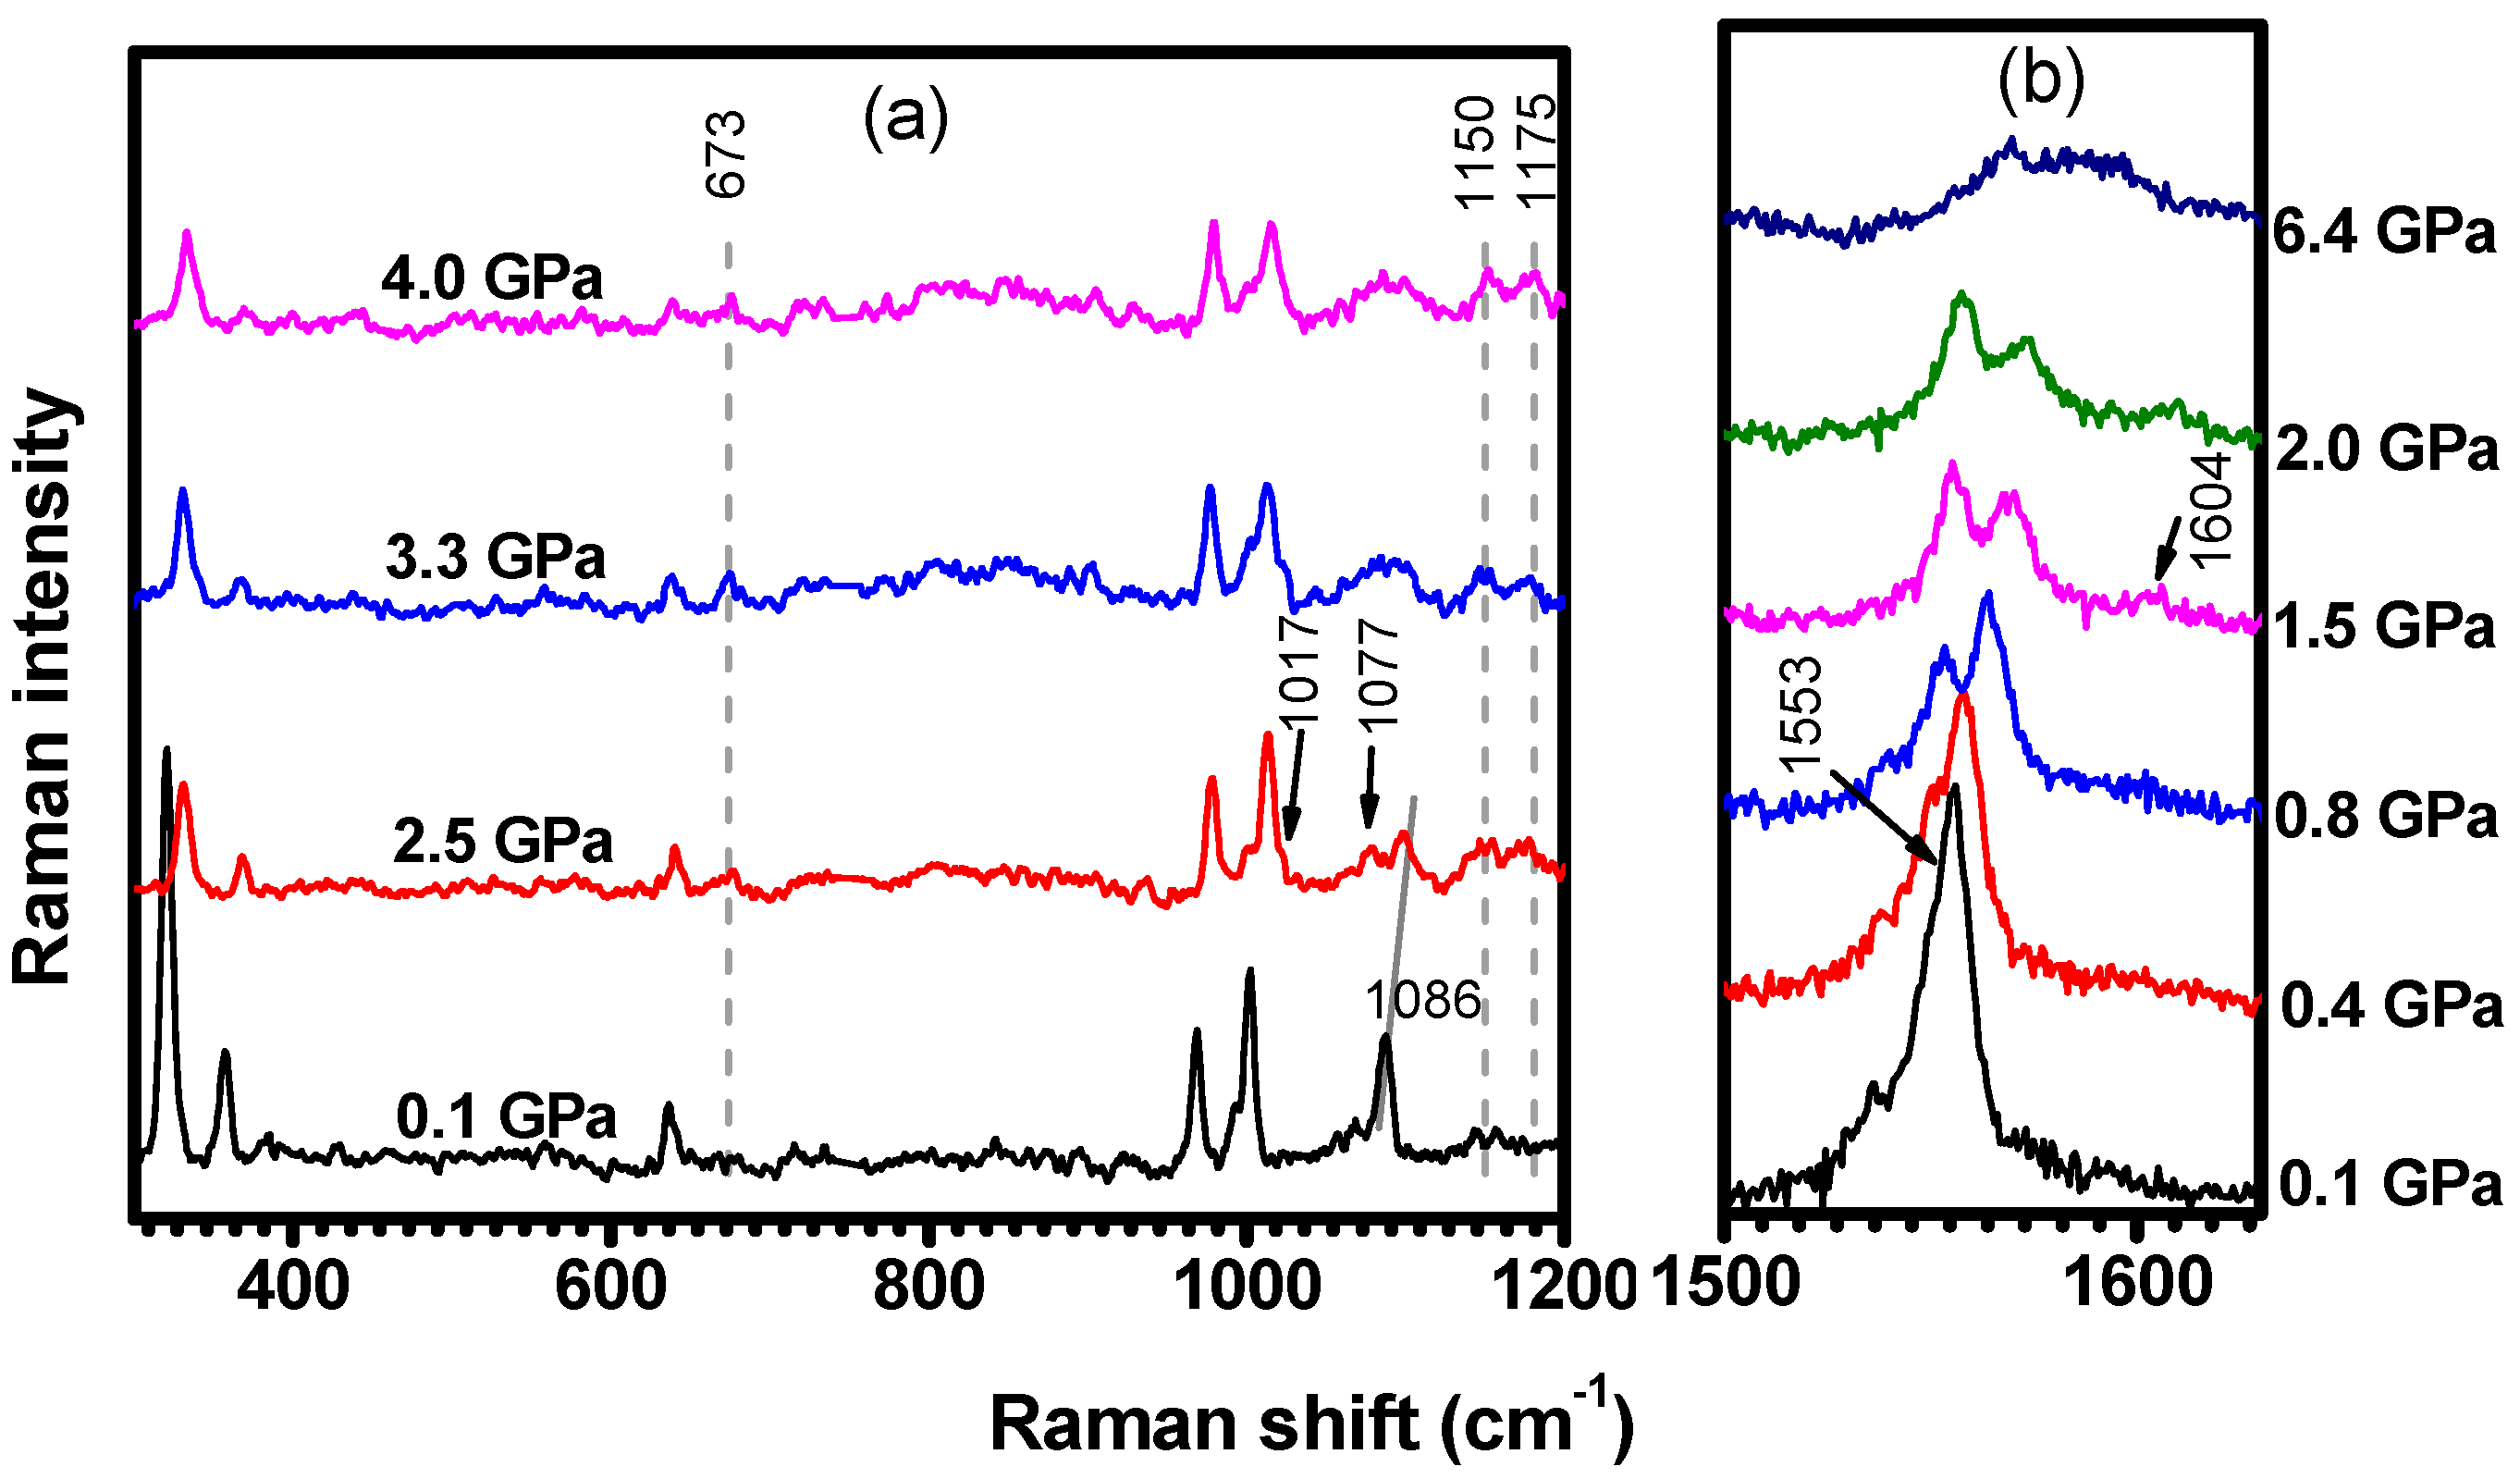
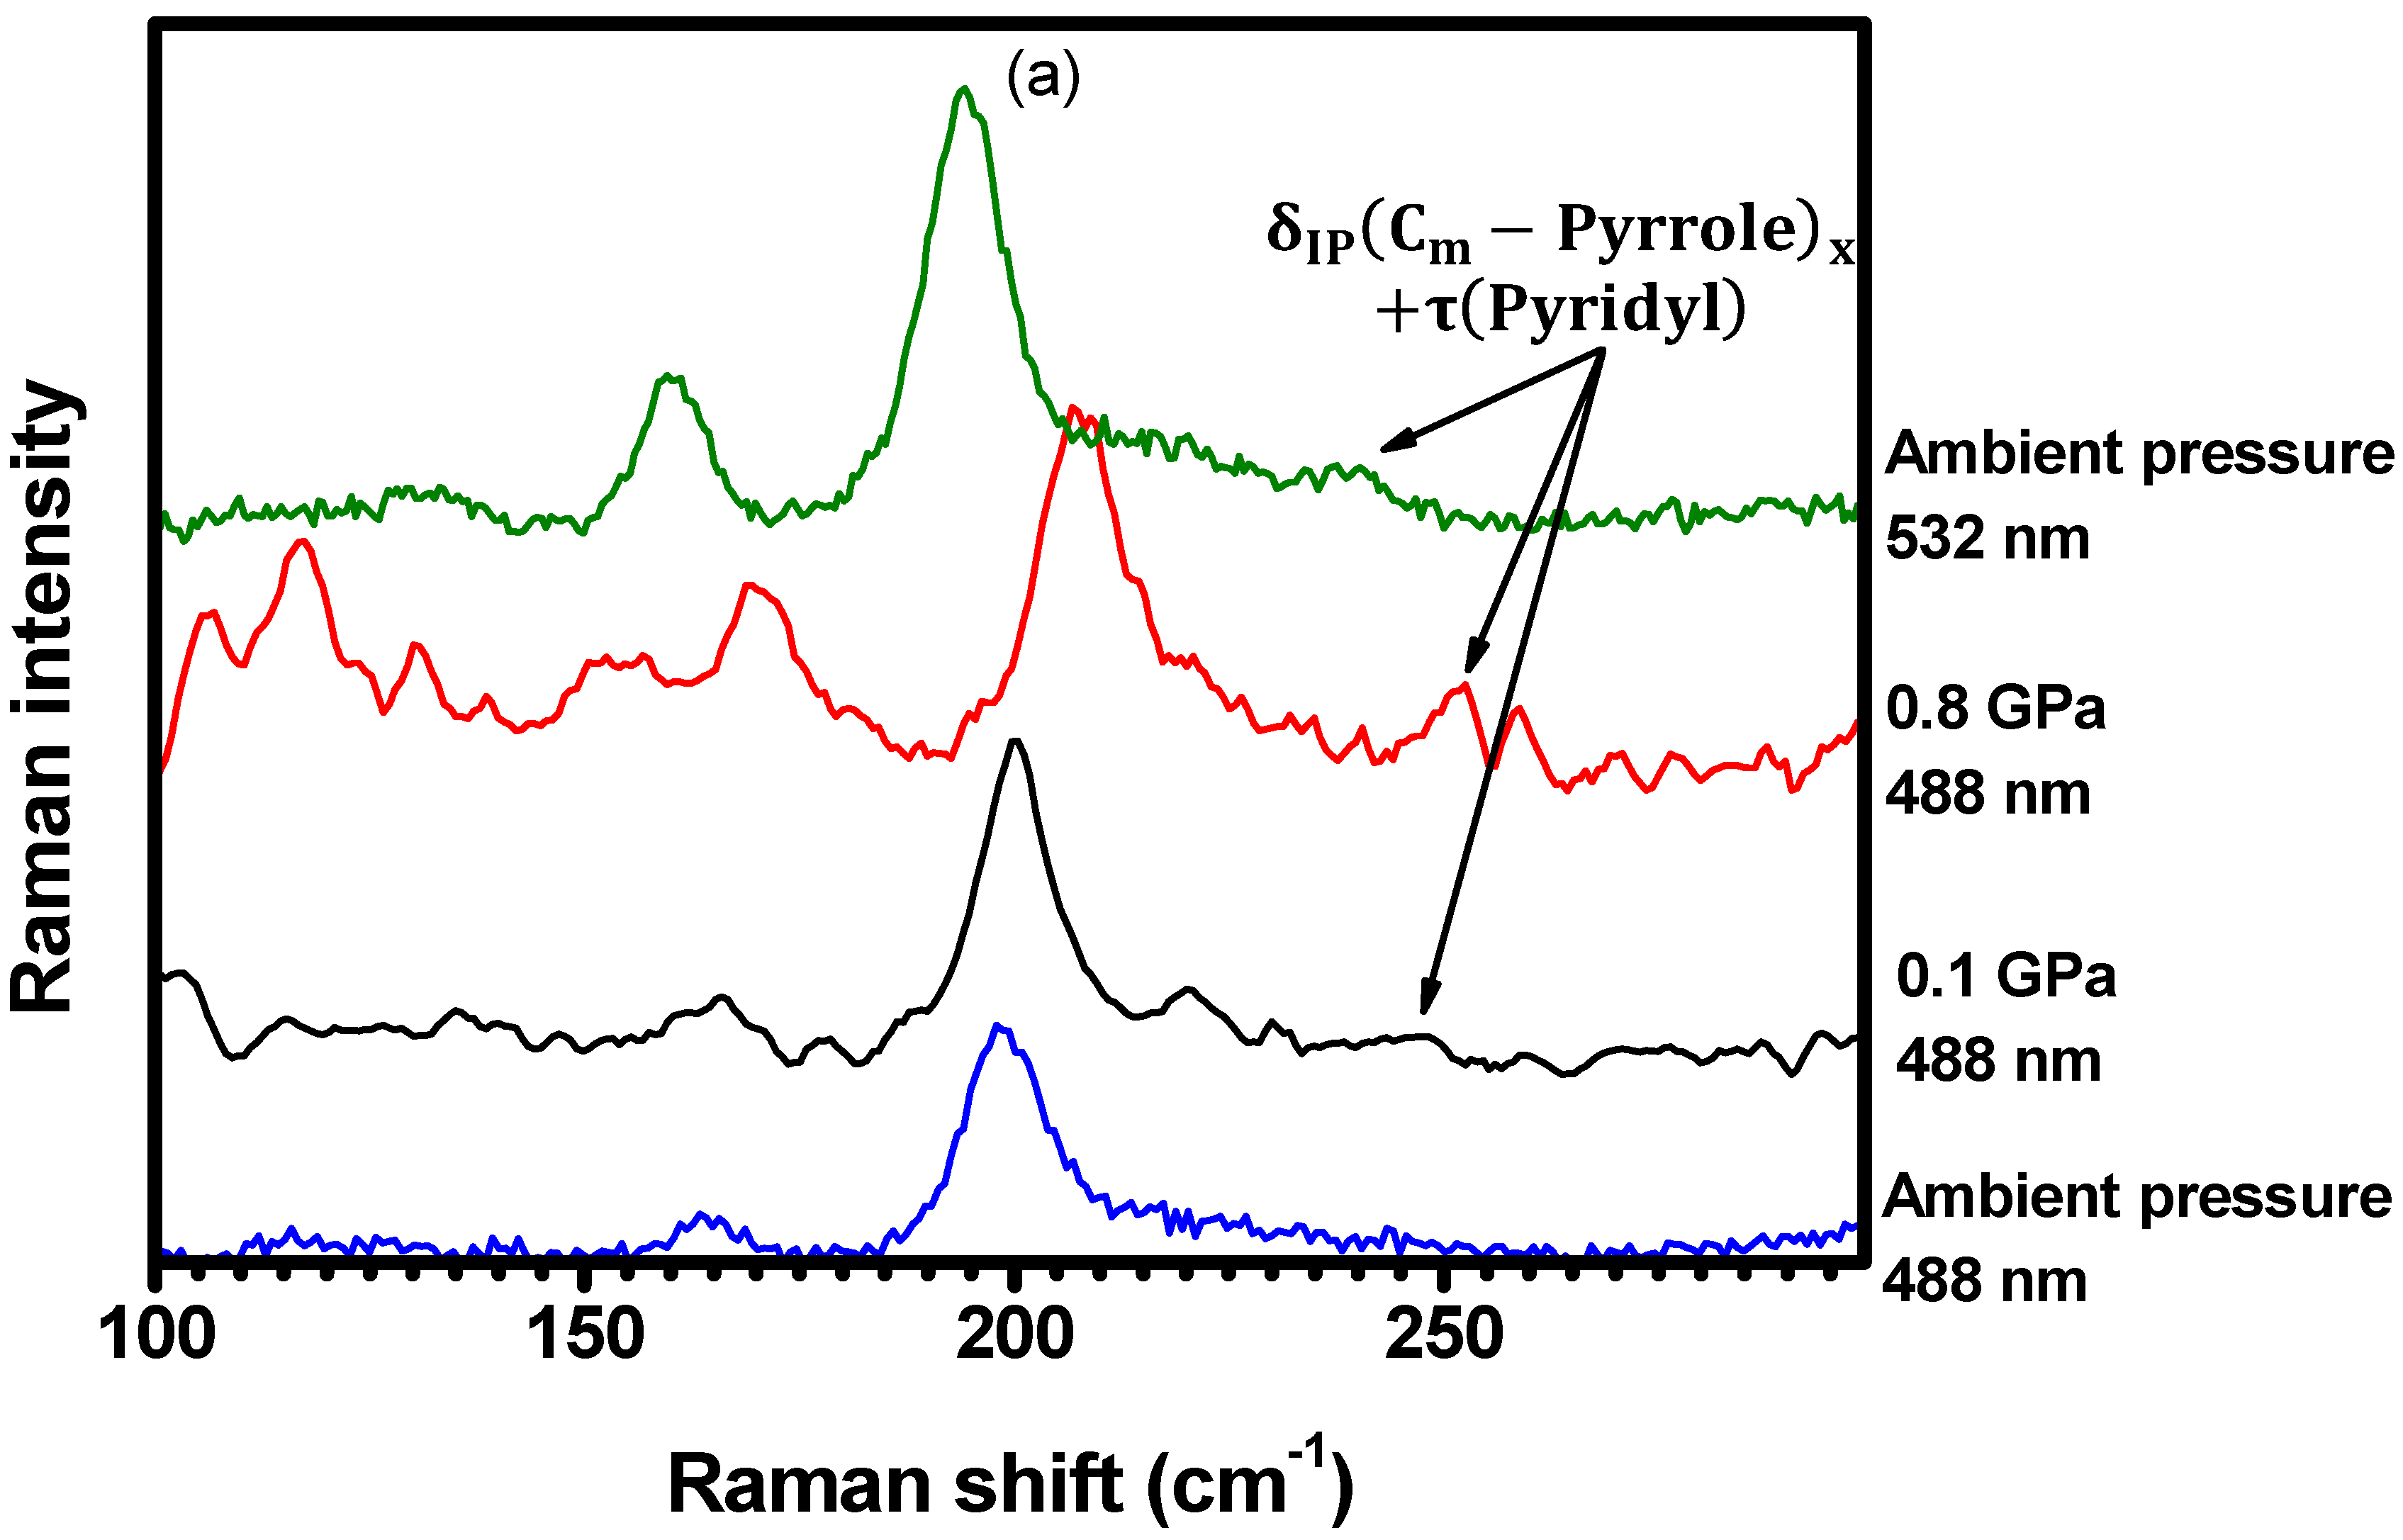
2.2. Hydrostatic Pressure Experiments
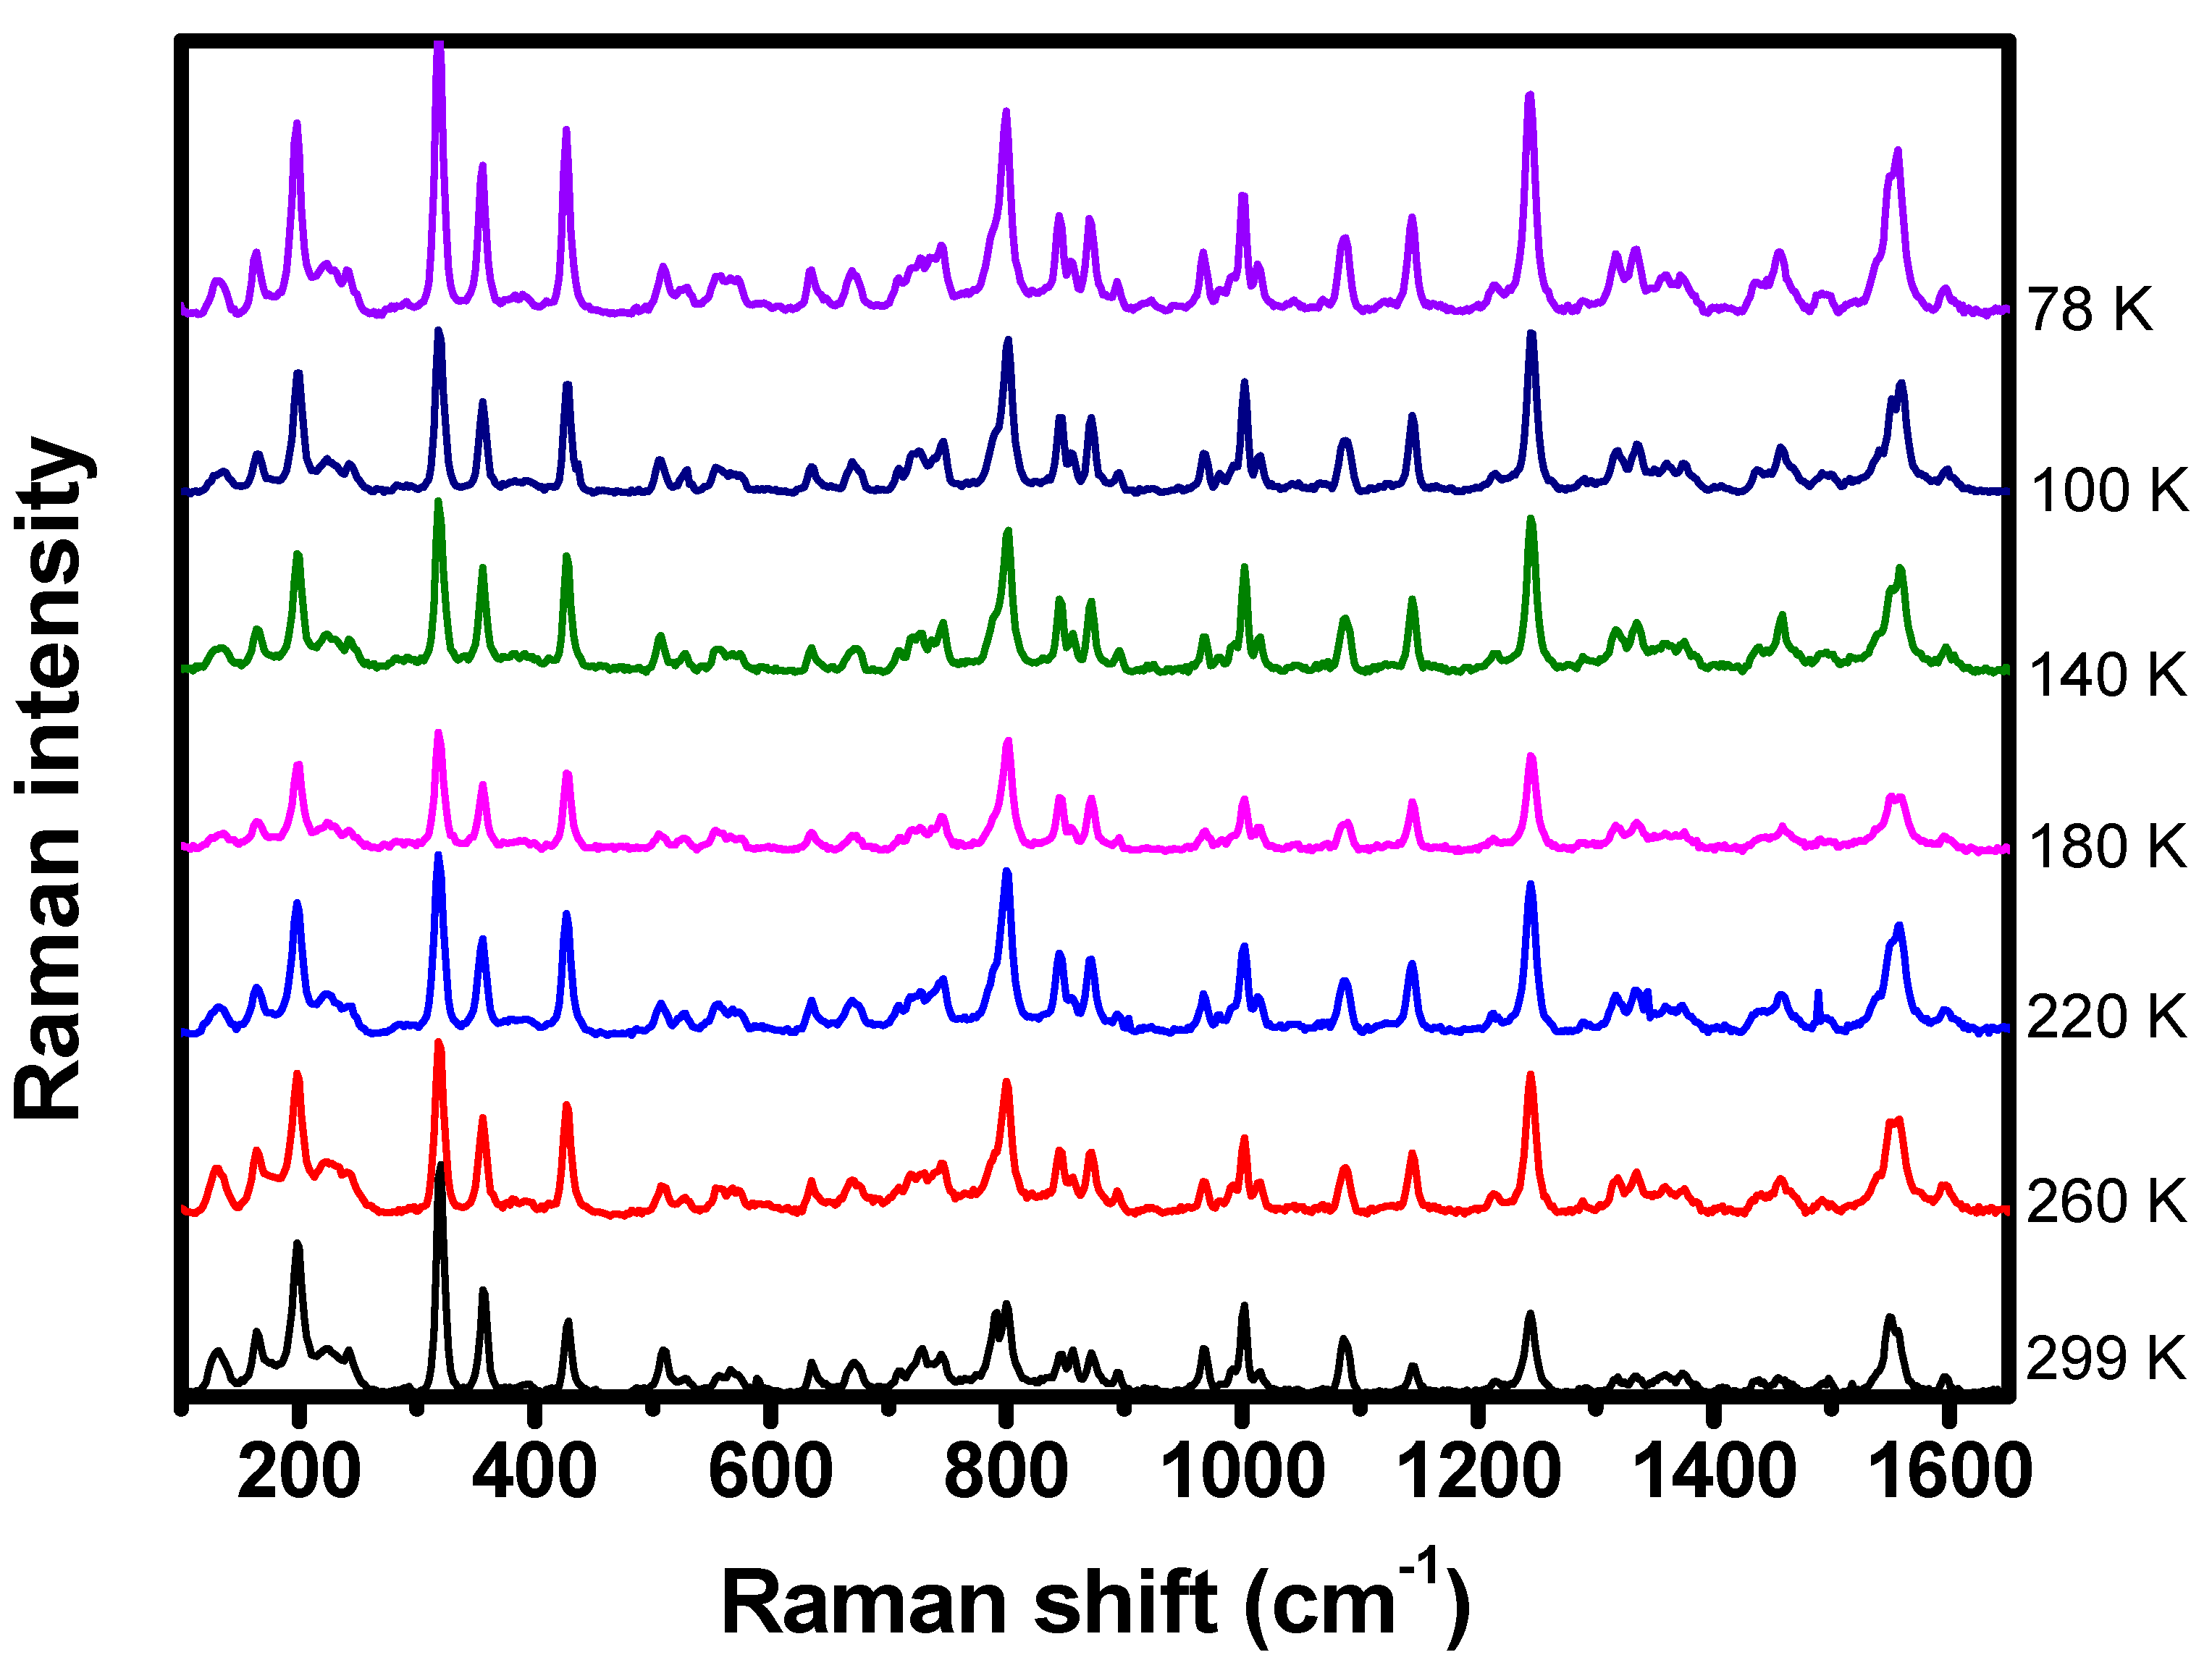
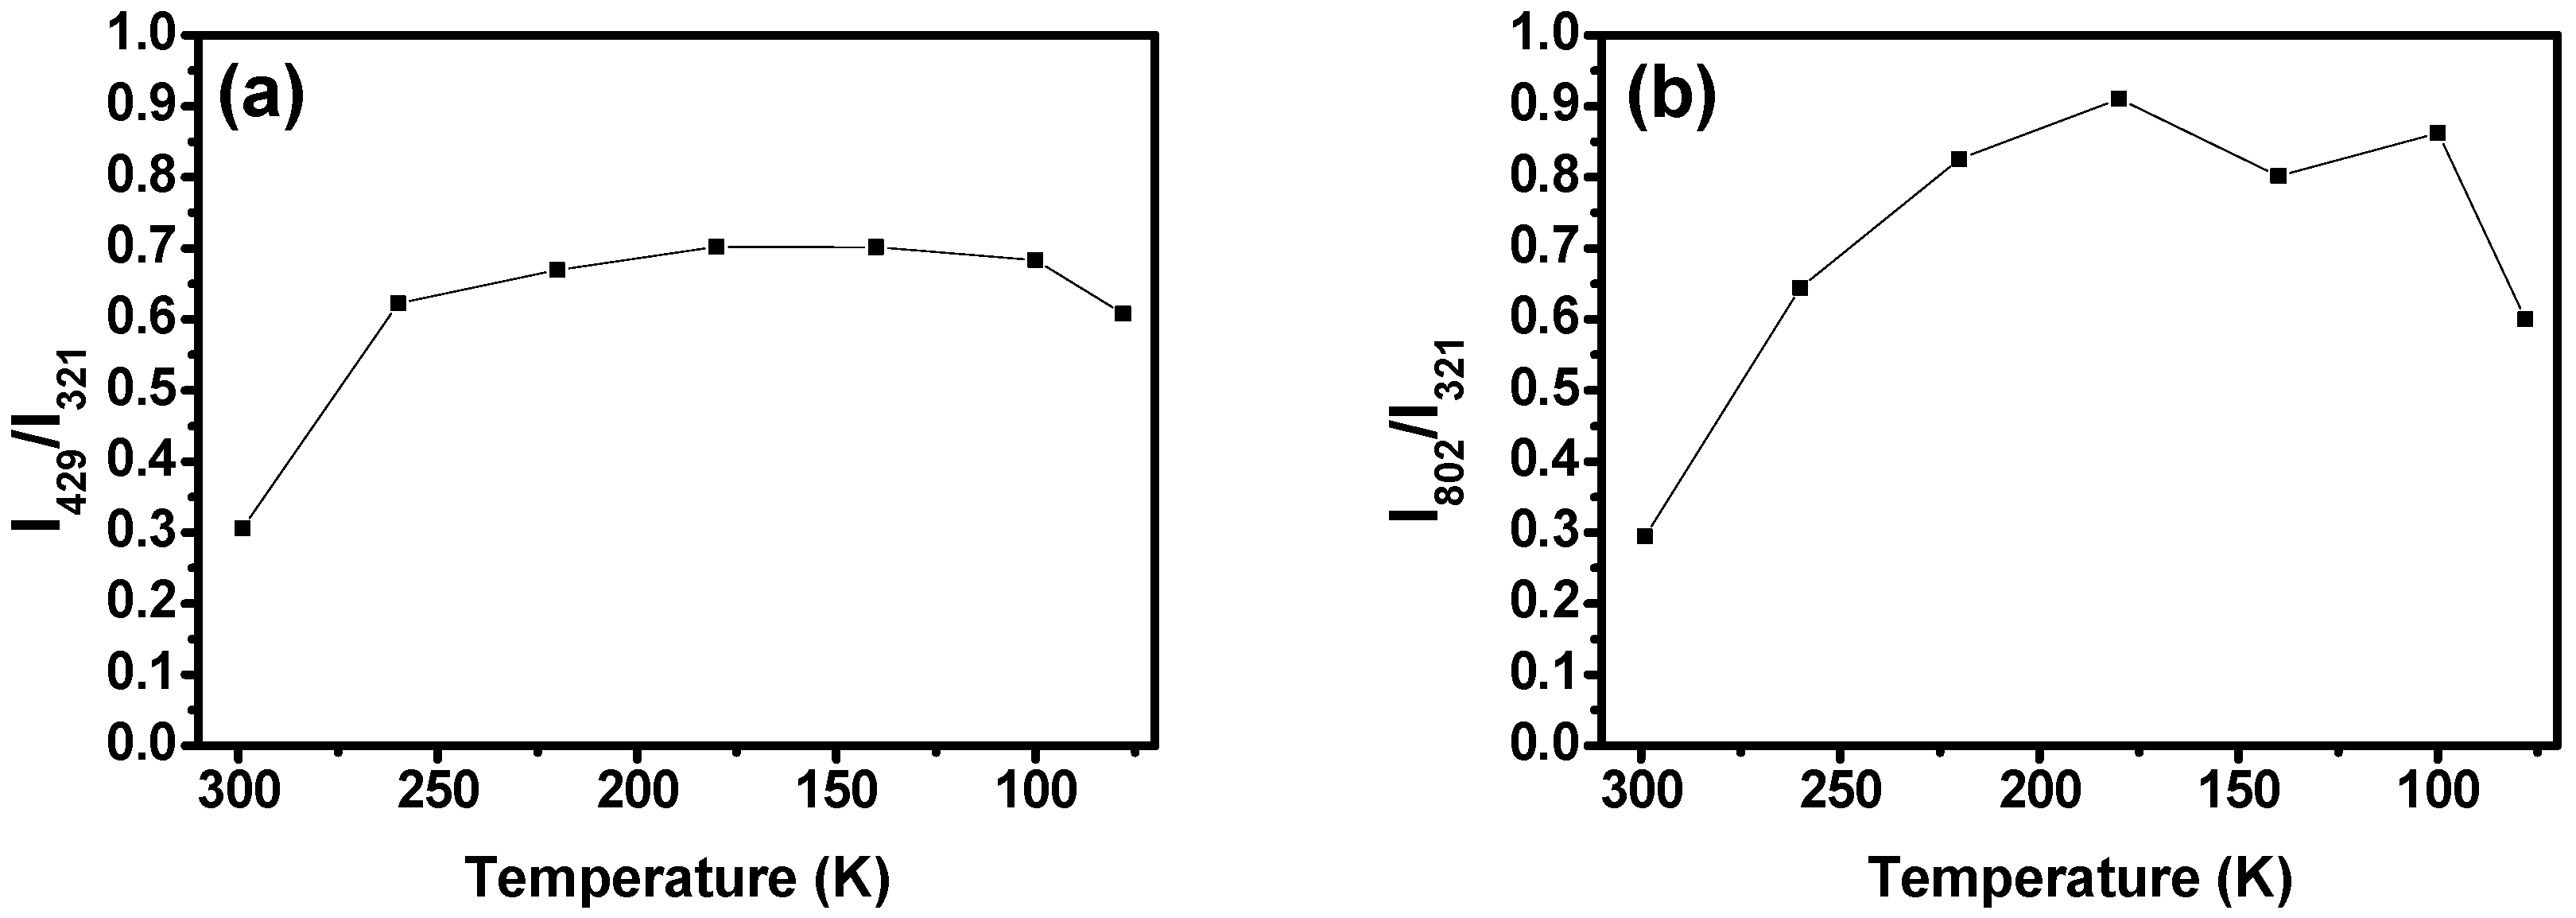
2.3. Low-Temperature Experiments
3. Materials and Methods
4. Conclusions
Supplementary Materials
Author Contributions
Funding
Institutional Review Board Statement
Informed Consent Statement
Data Availability Statement
Conflicts of Interest
References
- Milgrom, L.R. The Colours of Life: An Introduction to the Chemistry of Porphyrins and Related Compounds, 1st ed.; Oxford University Press Inc.: Oxford, UK, 1997. [Google Scholar]
- Mills, A.; Lepre, A. Controlling the Response Characteristics of Luminescent Porphyrin Plastic Film Sensors for Oxygen. Anal. Chem. 1997, 69, 4653–4659. [Google Scholar] [CrossRef]
- Imahori, H.; Matsubara, Y.; Iijima, H.; Umeyama, T.; Matano, Y.; Ito, S.; Niemi, M.; Tkachenko, N.V.; Lemmetyinen, H. Effects of meso-Diarylamino Group of Porphyrins as Sensitizers in Dye-Sensitized Solar Cells on Optical, Electrochemical, and Photovoltaic Properties. J. Phys. Chem. C 2010, 114, 10656–10665. [Google Scholar] [CrossRef]
- Kalyanasundaram, K. Photochemistry of Polypyridine and Porphyrin Complexes; Academic Press: San Diego, CA, USA, 1992. [Google Scholar]
- Vijisha, M.V.; Ramesh, J.; Arunkumar, C.; Chandrasekharan, K. Nonlinear optical absorption and refraction properties of fluorinated trans-dicationic pyridinium porphyrin and its metal complexes. Opt. Mater. 2019, 98, 109474. [Google Scholar] [CrossRef]
- Neto, N.M.B.; De Boni, L.; Mendonça, C.R.; Misoguti, L.; Queiroz, S.L.; Dinelli, L.R.; Batista, A.A.; Zilio, S.C. Nonlinear Absorption Dynamics in Tetrapyridyl Metalloporphyrins. J. Phys. Chem. B 2005, 109, 17340–17345. [Google Scholar] [CrossRef] [PubMed]
- Gouterman, M. Spectra of porphyrins. J. Mol. Spectrosc. 1961, 6, 138–163. [Google Scholar] [CrossRef]
- Gouterman, M.; Wagnière, G.H.; Snyder, L.C. Spectra of porphyrins: Part II. Four orbital model. J. Mol. Spectrosc. 1963, 11, 108–127. [Google Scholar] [CrossRef]
- Senge, M.O.; Medforth, C.J.; Forsyth, T.P.; Lee, D.A.; Olmstead, M.M.; Jentzen, W.; Pandey, R.K.; Shelnutt, J.A.; Smith, K.M. Comparative Analysis of the Conformations of Symmetrically and Asymmetrically Deca- and Undecasubstituted Porphyrins Bearing Meso-Alkyl or -Aryl Groups. Inorg. Chem. 1997, 36, 1149–1163. [Google Scholar] [CrossRef] [PubMed]
- Lopes, J.M.S.; Sampaio, R.N.; Ito, A.; Batista, A.; Machado, A.; Araujo, P.; Neto, N.M.B. Evolution of electronic and vibronic transitions in metal(II) meso-tetra(4-pyridyl)porphyrins. Spectrochim. Acta A Mol. Biomol. Spectrosc. 2019, 215, 327–333. [Google Scholar] [CrossRef] [PubMed]
- Birel, Ö.; Nadeem, S.; Duman, H. Porphyrin-Based Dye-Sensitized Solar Cells (DSSCs): A Review. J. Fluoresc. 2017, 27, 1075–1085. [Google Scholar] [CrossRef]
- Higashino, T.; Imahori, H. Porphyrins as excellent dyes for dye-sensitized solar cells: Recent developments and insights. Dalton Trans. 2015, 44, 448–463. [Google Scholar] [CrossRef] [PubMed]
- Urbani, M.; Grätzel, M.; Nazeeruddin, M.K.; Torres, T. Meso-Substituted Porphyrins for Dye-Sensitized Solar Cells. Chem. Rev. 2014, 114, 12330–12396. [Google Scholar] [CrossRef] [PubMed]
- Pavinatto, F.J.; Gameiro, A.; Hidalgo, A.; Dinelli, L.; Romualdo, L.; Batista, A.; Neto, N.M.B.; Ferreira, M.; Oliveira, O. Langmuir and Langmuir–Blodgett (LB) films of tetrapyridyl metalloporphyrins. Appl. Surf. Sci. 2008, 254, 5946–5952. [Google Scholar] [CrossRef]
- Dolmans, D.E.J.G.J.; Fukumura, D.; Jain, R.K. Photodynamic therapy for cancer. Nat. Rev. Cancer 2003, 3, 380–387. [Google Scholar] [CrossRef]
- Sternberg, E.D.; Dolphin, D.; Brückner, C. Porphyrin-based photosensitizers for use in photodynamic therapy. Tetrahedron 1998, 54, 4151–4202. [Google Scholar] [CrossRef]
- Ethirajan, M.; Chen, Y.; Joshi, P.; Pandey, R.K. The role of porphyrin chemistry in tumor imaging and photodynamic therapy. Chem. Soc. Rev. 2011, 40, 340–362. [Google Scholar] [CrossRef] [PubMed]
- Pollock, M.E.; Eugene, J.; Hammer-Wilson, M.; Berns, M.W. Photosensitization of experimental atheromas by porphyrins. J. Am. Coll. Cardiol. 1987, 9, 639–646. [Google Scholar] [CrossRef] [PubMed]
- Schneckenburger, H.; Rück, A.; Bartos, B.; Steiner, R. Intracellular distribution of photosensitizing porphyrins measured by video-enhanced fluorescence microscopy. J. Photochem. Photobiol. B 1988, 2, 355–363. [Google Scholar] [CrossRef] [PubMed]
- Lopes, J.M.S.; Sharma, K.; Sampaio, R.N.; Batista, A.; Ito, A.; Machado, A.; Araújo, P.; Neto, N.M.B. Novel insights on the vibronic transitions in free base meso-tetrapyridyl porphyrin. Spectrochim. Acta A Mol. Biomol. Spectrosc. 2019, 209, 274–279. [Google Scholar] [CrossRef]
- Sampaio, R.N.; Gomes, W.R.; Araujo, D.M.S.; Machado, A.E.H.; Silva, R.A.; Marletta, A.; Borissevitch, I.E.; Ito, A.S.; Dinelli, L.R.; Batista, A.A.; et al. Investigation of ground- and excited-state photophysical properties of 5,10,15,20-tetra(4-pyridyl)-21H,23H-porphyrin with ruthenium outlying complees. J. Phys. Chem. A 2012, 116, 18–26. [Google Scholar] [CrossRef]
- Li, X.Y.; Czernuszewicz, R.S.; Kincaid, J.R.; Su, Y.O.; Spiro, T.G. Consistent porphyrin force field. 1. Normal-mode analysis for nickel porphine and nickel tetraphenylporphine from resonance Raman and infrared spectra and isotope shifts. J. Phys. Chem. 1990, 94, 31–47. [Google Scholar] [CrossRef]
- Li, X.Y.; Czernuszewicz, R.S.; Kincaid, J.R.; Stein, P.; Spiro, T.G. Consistent porphyrin force field. 2. Nickel octaethylporphyrin skeletal and substituent mode assignments from nitrogen-15, meso-d4, and methylene-d16 Raman and infrared isotope shifts. J. Phys. Chem. 1990, 94, 47–61. [Google Scholar] [CrossRef]
- Li, X.Y.; Czernuszewicz, R.S.; Kincaid, J.R.; Spiro, T.G. Consistent porphyrin force field. 3. Out-of-plane modes in the resonance Raman spectra of planar and ruffled nickel octaethylporphyrin. J. Am. Chem. Soc. 1989, 111, 7012–7023. [Google Scholar] [CrossRef]
- Aydin, M. DFT and Raman spectroscopy of porphyrin derivatives: Tetraphenylporphine (TPP). Vib. Spectrosc. 2013, 68, 141–152. [Google Scholar] [CrossRef]
- Šloufová-Srnová, I.; Vlčková, B. Two-dimensional Assembling of Au Nanoparticles Mediated by Tetrapyridylporphine Molecules. Nano Lett. 2002, 2, 121–125. [Google Scholar] [CrossRef]
- Siskova, K.; Vlckova, B.; Turpin, P.Y.; Thorel, A.; Grosjean, A. Porphyrins as SERRS spectral probes of chemically functionalized Ag nanoparticles. Vib. Spectrosc. 2008, 48, 44–52. [Google Scholar] [CrossRef]
- Maczka, M.; Paraguassu, W.; Freire, P.T.C.; Filho, A.G.S.; Filho, J.M.; Hanuza, J. High-pressure Raman scattering study of ferroelectric K3Nb3O6(BO3)2. Phys. Rev. B 2010, 82, 014106. [Google Scholar] [CrossRef]
- Jayaraman, A.; Wang, S.Y.; Sharma, S.K.; Ming, L.C. Pressure-induced phase transformations in HfO2 to 50 GPa studied by Raman spectroscopy. Phys. Rev. B 1993, 48, 9205–9211. [Google Scholar] [CrossRef] [PubMed]
- Pawbake, A.; Bellin, C.; Pawbake, A.; Paulatto, L.; Béneut, K.; Biscaras, J.; Narayana, C.; Narayana, D.J.; Shukla, A. Pressure-Induced Phase Transitions in Germanium Telluride: Raman Signatures of Anharmonicity and Oxidation. Phys. Rev. Lett. 2019, 122, 145701. [Google Scholar] [CrossRef]
- Chen, D.-M.; He, T.; Cong, D.-F.; Zhang, Y.-H.; Liu, F.-C. Resonance Raman Spectra and Excited-State Structure of Aggregated Tetrakis(4-sulfonatophenyl)porphyrin Diacid. J. Phys. Chem. A 2001, 105, 3981–3988. [Google Scholar] [CrossRef]
- Jorio, A.; Bellin, C.; Paulatto, L.; Béneut, K.; Biscaras, J.; Narayana, C.; Late, D.J.; Shukla, A. G-band resonant Raman study of 62 isolated single-wall carbon nanotubes. Phys. Rev. B 2002, 65, 155412. [Google Scholar] [CrossRef]
- Wood, B.R.; McNaughton, D. Raman excitation wavelength investigation of single red blood cells in vivo. J. Raman Spectrosc. 2002, 33, 517–523. [Google Scholar] [CrossRef]
- Ferraro, J.R.; Nakamoto, K.; Brown, C.W. Introductory Raman Spectroscopy, 2nd ed.; Elsevier: Amsterdam, The Netherlands, 2003. [Google Scholar] [CrossRef]
- Li, J.M.; Yao, Y.K.; Sun, L.H.; Shan, X.Y.; Wang, C.; Lu, X.H. Double Resonance Raman Scattering in Single-Layer MoSe2 under Moderate Pressure. Chin. Phys. Lett. 2019, 36, 048201. [Google Scholar] [CrossRef]
- Saha, P.; Ghosh, B.; Mazumder, A.; Mukherjee, G.D. High pressure anomalies in exfoliated MoSe2: Resonance Raman and X-ray diffraction studies. Mater. Res. Express 2020, 7, 025902. [Google Scholar] [CrossRef]
- Khisa, J.; Derese, S.; Mack, J.; Amuhaya, E.; Nyokong, T. Synthesis, photophysical properties and photodynamic antimicrobial activity of meso 5,10,15,20-tetra(pyren-1-yl)porphyrin and its indium(III) complex. J. Porphyr. Phthalocyanines 2021, 25, 794–799. [Google Scholar] [CrossRef]
- Dresselhaus, M.S.; Dresselhaus, G.; Jorio, A.A. Group Theory: Application to the Physics of Condensed Matter; Springer: Berlin/Heidelberg, Germany, 2008. [Google Scholar]
- Rousseau, D.L.; Bauman, R.P.; Porto, S.P.S. Normal mode determination in crystals. J. Raman Spectrosc. 1981, 10, 253–290. [Google Scholar] [CrossRef]
- Kingsbury, C.J.; Senge, M.O. The shape of porphyrins. In Coordination Chemistry Reviews; Elsevier B.V.: Amsterdam, The Netherlands, 2021; Volume 431. [Google Scholar] [CrossRef]
- Neto, N.M.B.; De Boni, L.; Rodrigues, J.J.; Misoguti, L.; Mendonça, C.R.; Dinelli, L.R.; Batista, A.A.; Zilio, S.C. Dynamic saturable optical nonlinearities in free base tetrapyridylporphyrin. J. Porphyr. Phthalocyanines 2003, 07, 452–456. [Google Scholar] [CrossRef]
- Fleischer, E.B. α,β,γ,δ-Tetra-(4-pyridyl)-porphine and Some of its Metal Complexes. Inorg. Chem. 1962, 1, 493–495. [Google Scholar] [CrossRef]
- Klotz, S.; Chervin, J.-C.; Munsch, P.; Le Marchand, G. Hydrostatic limits of 11 pressure transmitting media. J. Phys. D Appl. Phys. 2009, 42, 075413. [Google Scholar] [CrossRef]
- Silvera, I.F.; Chijioke, A.D.; Nellis, W.J.; Soldatov, A.; Tempere, J. Calibration of the ruby pressure scale to 150 GPa. Phys. Status Solidi B 2007, 244, 460–467. [Google Scholar] [CrossRef]
- Mao, H.K.; Xu, J.; Bell, P.M. Calibration of the ruby pressure gauge to 800 kbar under quasi-hydrostatic conditions. J. Geophys. Res. Solid Earth 1986, 91, 4673–4676. [Google Scholar] [CrossRef]
- Neese, F. The ORCA program system. WIREs Comput. Mol. Sci. 2012, 2, 73–78. [Google Scholar] [CrossRef]
- Finkelshtein, E.I.; Shamsiev, R.S. Spectral and structural properties of carotenoids—DFT and thermochemical calculations. J. Mol. Struct. 2019, 1197, 583–593. [Google Scholar] [CrossRef]


| Raman Mode | Symmetry (C2v) | Calculated (cm−1) | Experimental (cm−1) | ||
|---|---|---|---|---|---|
| 488 nm Qy(0,2) | 532 nm Qy(0,0) | ||||
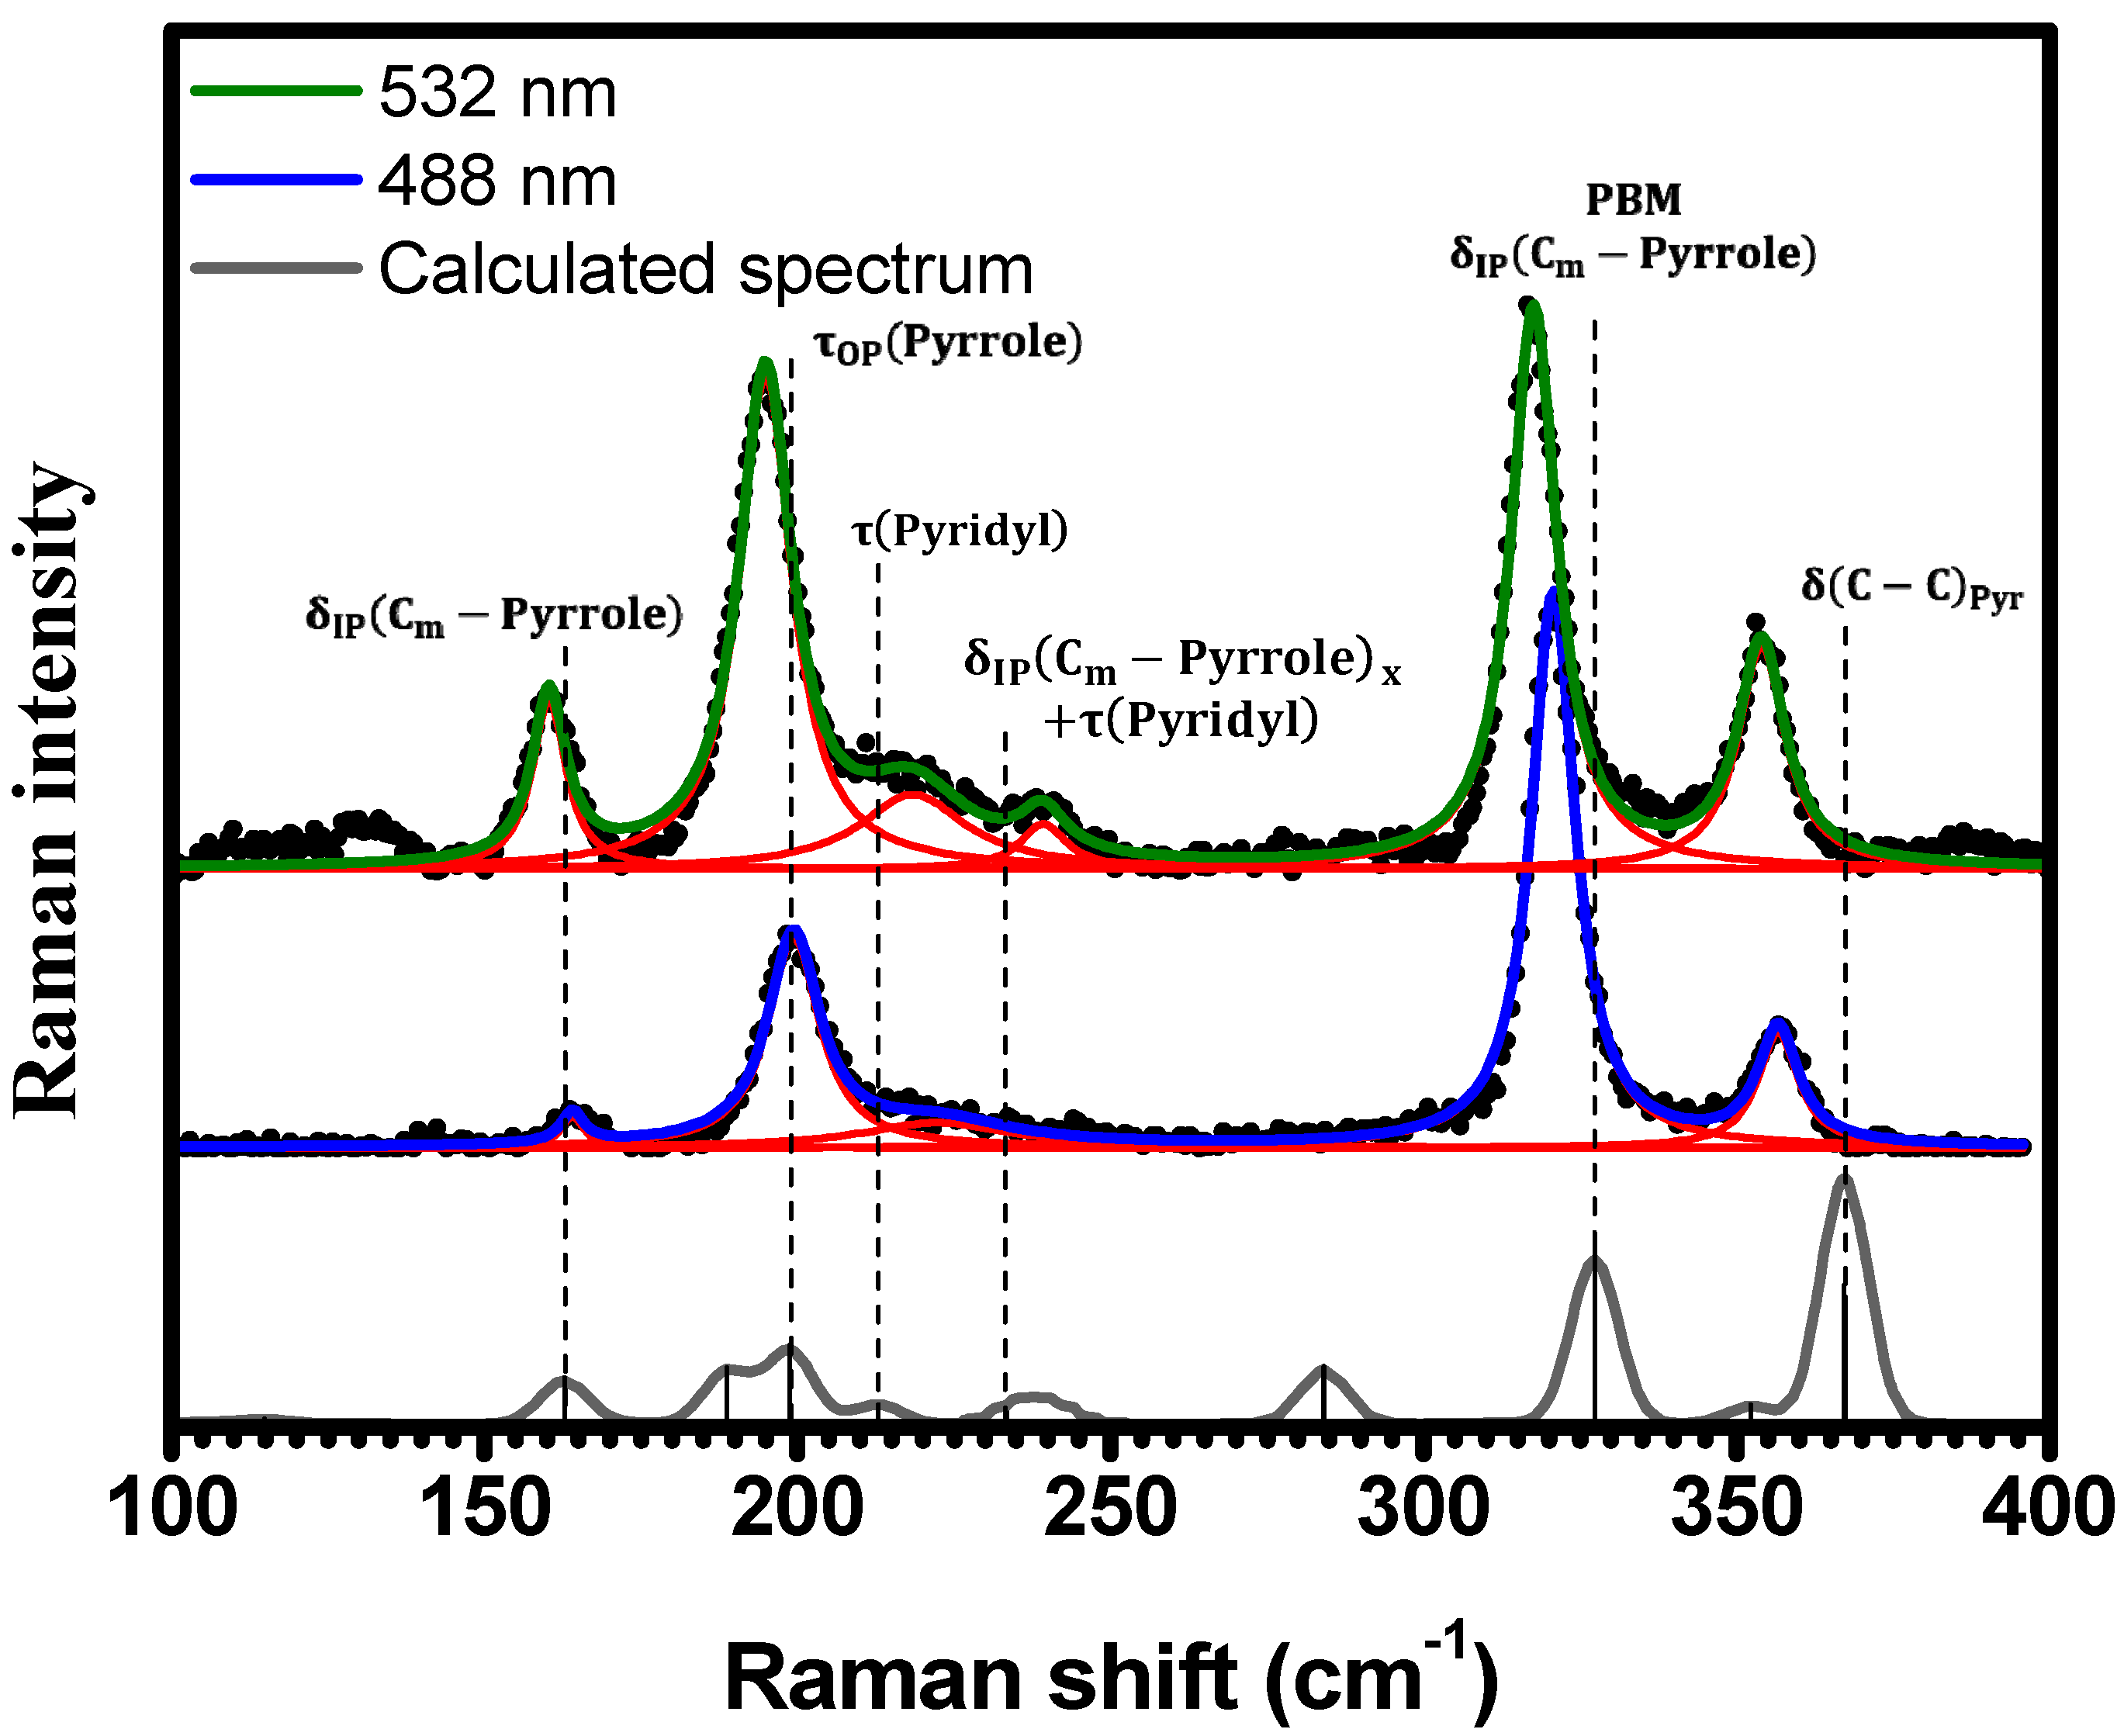
| 163 | 164 | 160 | Out-of-phase (XY) bending of the angles between the pyrrole groups. | ||
| 199 | 199 | 195 | Out-of-phase twist of the pyrrole groups. | ||
| 213 | 223 | 218 | In-phase twist of the pyridyl groups. | ||
| 233 | - | 239 | Bending of the angles between the and the X pyrrole groups and out-of-phase twist of the pyridyl groups. | ||
|
| 327 | 321 | 317 | Porphyrin Breathing Mode (PBM): In-phase bending of the angles between the pyrrole groups. | |
| 367 | 357 | 354 | In-phase bending of the bonds in pyridyl groups. | ||
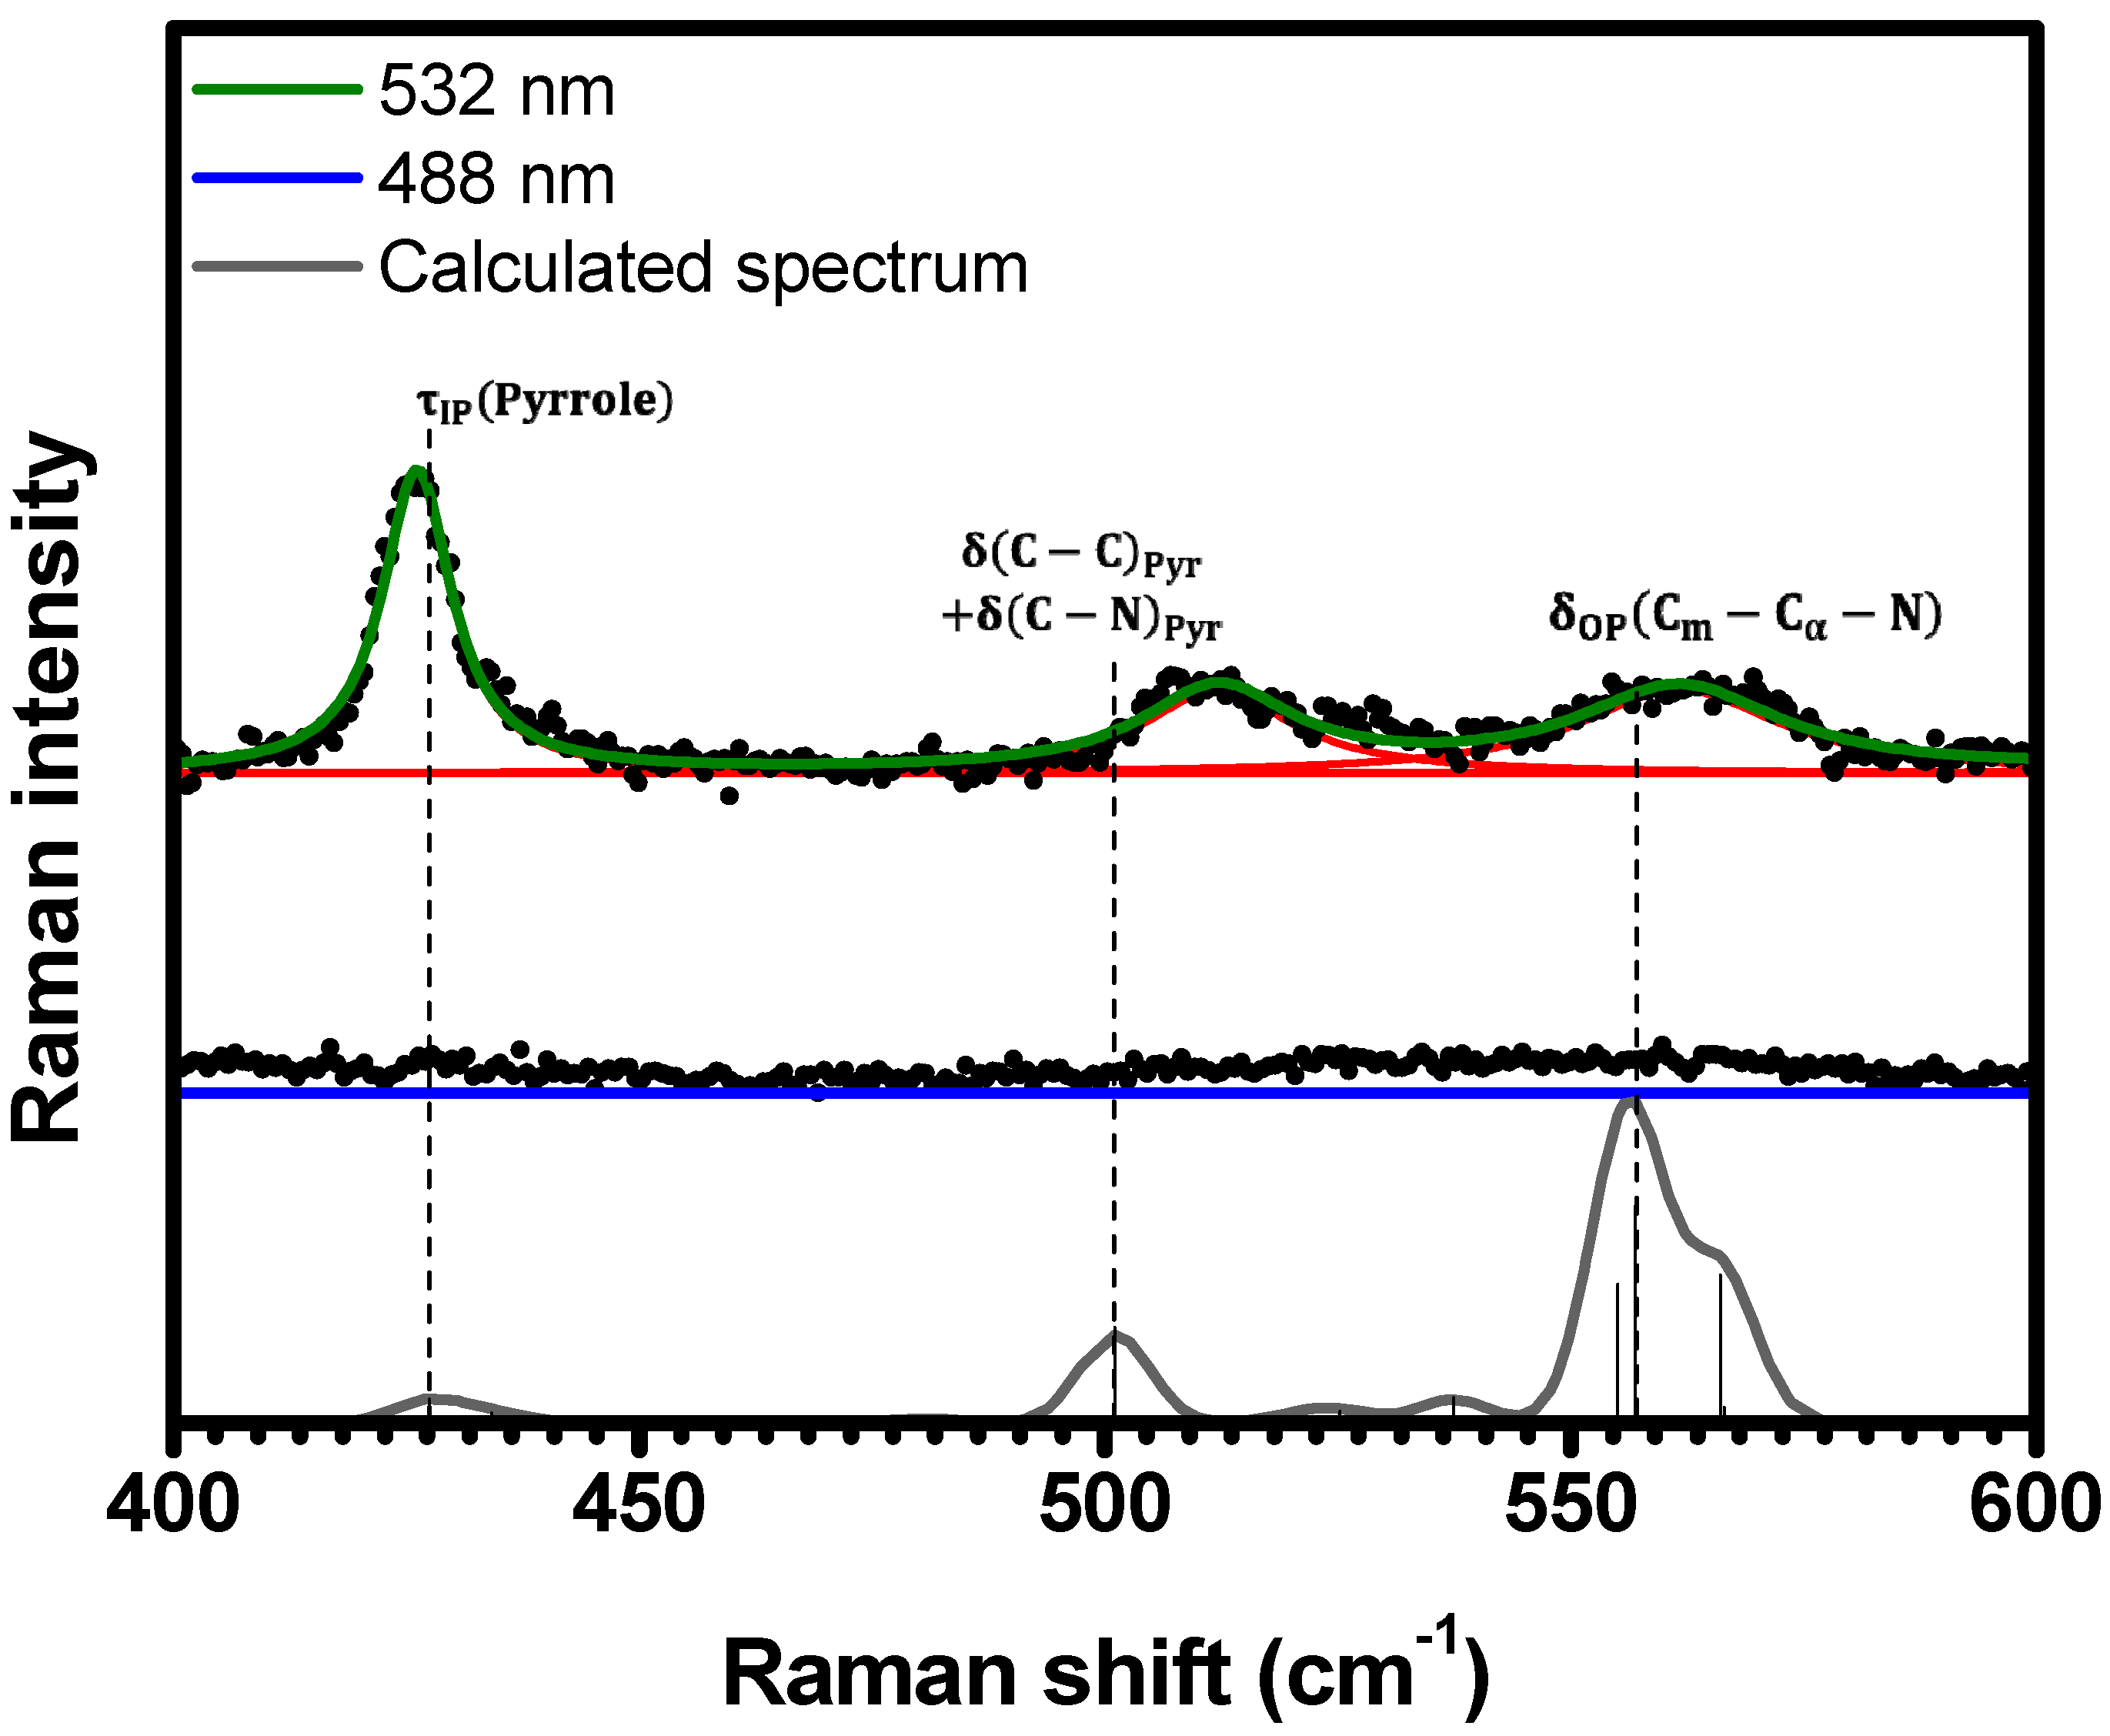
| 427 | - | 426 | Twist of the Y pyrrole groups. | ||
| 501 | - | 511 | Out-of-phase bending of the and bonds in the pyridyl groups. | ||
| 557 | - | 561 | In-phase bending of the angles between the and bonds. | ||
| 630 | 636 | 633 | Out-of-phase bending of the and bonds. | ||
| 672 | - | 666 | In-phase bending of angles between the and bonds. | ||
| 719 | - | 710 | In-phase bending of the and bonds. | ||
| 739 | - | 730 | Out-of-phase bending of angles between the and bonds. | ||
| 752 | - | 744 | In-phase bending of the bonds in the pyridyl groups. | ||
| 772 | - | 786 | Out-of-phase bending of the bonds. | ||
| 789 | - | 797 | In-phase bending of the bonds in the pyridyl groups. | ||
| 859 | - | 844 | In-phase bending of the bonds in the pyridyl groups. | ||
| 864 | - | 855 | Out-of-phase bending of the bonds in the pyridyl groups. | ||
| 884 | - | 871 | Bending of the in the Y pyrrole groups. | ||
| 887 | - | 892 | In-phase bending of the angles between the and bonds. | ||
| 966 | 967 | 966 | Out-of-phase bending of the bonds in the pyridyl groups. | ||
| 980 | 991 | 989 | In-phase bending of the and bonds. | ||
| 1003 | 1001 | 1000 | Bending of the bonds and stretching of the bonds in the X pyrrole groups. | ||
| 1006 | 1017 | 1014 | Out-of-phase stretching of the bonds. | ||
| 1065 | 1063 | 1063 | In-phase bending of the bonds. | ||
| 1069 | 1086 | 1085 | Out-of-phase bending of the bonds. | ||
| 1122 | - | 1142 | Bending of the bonds. | ||
| 1206 | 1211 | 1213 | Out-of-phase bending of the bonds in the pyridyl groups. | ||
| 1235 | 1241 | 1241 | In-phase stretching of the bonds and bending of the bonds in the pyridyl groups. | ||
| 1289 | 1287 | - | Bending of the bonds and stretching of the bonds in the X pyrrole groups. Stretching of the bonds in the Y pyrrole groups. | ||
| 1310 | 1324 | 1314 | Out-of-phase bending of the bonds in the pyridyl groups. | ||
| 1316 | 1324 | 1330 | In-phase bending of the bonds. Stretching of the in the X pyrrole groups | ||
| 1356 | 1357 | 1357 | In-phase bending of the angles between the bonds and stretching of the bonds. | ||
| 1366 | 1373 | 1373 | Bending of the bonds. Stretching of the and bonds in the Y pyrrole groups. | ||
| 1438 | 1436 | 1434 | In-phase stretching of the , , and bonds. | ||
| 1448 | 1454 | 1451 | Stretching of the and bonds in the X pyrrole groups. | ||
| 1474 | 1470 | - | Out-of-phase bending of the bonds in the pyridyl groups. | ||
| 1499 | 1489 | 1495 | Out-of-phase stretching of the . Stretching of the and bonds in the Y pyrrole groups. | ||
| 1545 | 1538 | - | In-phase stretching of the bonds. Stretching of the and bonds in the X pyrrole groups. | ||
| 1554 | 1553 | 1549 | Bending of the angles between the bonds in the Y pyrrole groups. Stretching of the bonds in the X pyrrole groups. Out-of-phase stretching of the bonds. | ||
| 1581 | 1589 | 1580 | In-phase stretching of the bonds in the pyridyl groups. | ||
| Raman Mode | Intercept Position at 0.1 GPa (cm−1) | (cm−1/GPa) |
|---|---|---|
| CLV | 81.2 (3.6); 100.4 (2.6) * | 10.1 (2.0); 1.6 (0.8) * |
| CLV | 98.5 (1.4) | 10.1 (2.7) |
| CLV | 102.6 (0.9); 117.6 (1.4) ** | 14.6 (0.9); 5.6 (0.3) ** |
| CLV | 116.6 (1.0) | 14.7 (1.1) |
| CLV | 133.2 (2.2) | 25.0 (4.3) |
| 162.9 (1.1) | 8.1 (2.1) | |
| 203.1 (0.8) | 3.8 (0.2) | |
| 221.4 (0.4) | 2.1 (0.6) | |
| 242.0 (1.7) | 10.1 (3.2) | |
| 322.8 (0.4) | 2.7 (0.1) | |
| 358.9 (0.5) | 3.1 (0.2) | |
| 636.1 (0.5) | 1.3 (0.1) | |
| 642.0 (1.2); 670.0 (0.8) * | 3.3 (1.1); 1.3 (0.2) * | |
| 970.4 (0.4); 1017.6 (5.0) $ | 2.3 (0.1); −1.1 (0.7) $ | |
| 993.8 (0.7) | 2.3 (0.2) | |
| 1004.1 (0.7) | 2.9 (0.2) | |
| 1066.4 (0.8) | 3.3 (0.2) | |
| 1088.0 (0.5) | 3.5 (0.1) | |
| 1145.9 (0.8); 1142.7 (0.8) ** | −8.8 (1.2); 2.5 (0.2) ** | |
| 1167.5 (1.0) * | 3.0 (0.2) * | |
| 1216.8 (0.5) | 2.5 (0.1) | |
| 1250.5 (0.9) | 4.2 (0.2) | |
| 1438.7 (0.4) | 2.6 (0.1) | |
| 1455.8 (0.5) | 4.0 (0.1) | |
| 1488.6 (1.1) | 11.7 (2.1) | |
| 1537.4 (0.3); 1550.8 (0.4) # | 11.4 (0.7); 2.9 (0.1) # | |
| 1555.5 (0.7); 1563.5 (0.6) # | 7.5 (1.6); 4.5(0.1) # | |
| 1602.9 (0.8) | 2.5 (0.2) |
Disclaimer/Publisher’s Note: The statements, opinions and data contained in all publications are solely those of the individual author(s) and contributor(s) and not of MDPI and/or the editor(s). MDPI and/or the editor(s) disclaim responsibility for any injury to people or property resulting from any ideas, methods, instructions or products referred to in the content. |
© 2024 by the authors. Licensee MDPI, Basel, Switzerland. This article is an open access article distributed under the terms and conditions of the Creative Commons Attribution (CC BY) license (https://creativecommons.org/licenses/by/4.0/).
Share and Cite
dos Reis, J.R.T.; Leite, F.F.; Sharma, K.; Ribeiro, G.A.S.; Silva, W.H.N.; Batista, A.A.; Paschoal, A.R.; Paraguassu, W.; Mazzoni, M.; Barbosa Neto, N.M.; et al. Raman Spectroscopy on Free-Base Meso-tetra(4-pyridyl) Porphyrin under Conditions of Low Temperature and High Hydrostatic Pressure. Molecules 2024, 29, 2362. https://doi.org/10.3390/molecules29102362
dos Reis JRT, Leite FF, Sharma K, Ribeiro GAS, Silva WHN, Batista AA, Paschoal AR, Paraguassu W, Mazzoni M, Barbosa Neto NM, et al. Raman Spectroscopy on Free-Base Meso-tetra(4-pyridyl) Porphyrin under Conditions of Low Temperature and High Hydrostatic Pressure. Molecules. 2024; 29(10):2362. https://doi.org/10.3390/molecules29102362
Chicago/Turabian Styledos Reis, Jhon Rewllyson Torres, Fabio Furtado Leite, Keshav Sharma, Guilherme Almeida Silva Ribeiro, Welesson Henrique Natanael Silva, Alzir Azevedo Batista, Alexandre Rocha Paschoal, Waldeci Paraguassu, Mario Mazzoni, Newton Martins Barbosa Neto, and et al. 2024. "Raman Spectroscopy on Free-Base Meso-tetra(4-pyridyl) Porphyrin under Conditions of Low Temperature and High Hydrostatic Pressure" Molecules 29, no. 10: 2362. https://doi.org/10.3390/molecules29102362
APA Styledos Reis, J. R. T., Leite, F. F., Sharma, K., Ribeiro, G. A. S., Silva, W. H. N., Batista, A. A., Paschoal, A. R., Paraguassu, W., Mazzoni, M., Barbosa Neto, N. M., & Araujo, P. T. (2024). Raman Spectroscopy on Free-Base Meso-tetra(4-pyridyl) Porphyrin under Conditions of Low Temperature and High Hydrostatic Pressure. Molecules, 29(10), 2362. https://doi.org/10.3390/molecules29102362