Abstract
Among the vegetables that stand out for their high concentration of anthocyanins, red cabbage appears as one of the most-used sources of these pigments in food production and it is considered a suitable raw material for the extraction of natural dye. Therefore, the objective was to carry out the production of natural extracts from red cabbage, under different conditions, varying the solvent, type of pre-treatment, pH range, and processing temperature during the concentration of the extracts. The anthocyanins were extracted from red cabbage using the following solvents: distilled water, 25% ethyl alcohol, and 70% ethyl alcohol. The raw material was divided into two groups, the first was subjected to a drying pre-treatment at 70 °C for 1 h and for the second group, the extraction was performed with the raw material in natura. Two pH ranges of 4.0 and 6.0 and extraction temperatures of 25 °C and 75 °C were used in the extracts, resulting in 24 formulations. The extracts obtained were analyzed for colorimetric parameters and anthocyanins. The results of anthocyanins show that the methodology that uses 25% alcohol, pH 4.0, and processing temperature of 25 °C produces a reddish extract and better results in the extraction, presenting average values of 191.37 mg/100 g of anthocyanins, being 74% higher compared to the highest values obtained in the other extracts where the same raw material was used and the solvents differed.
1. Introduction
In the food industry, dyes are the additives used to check, intensify, or standardize the color, which can restore the color lost during processing and storage [1]. The intent to maintain or add color to food can be considered one of the main applications of dyes, whether natural or artificial. Although the food ingredients industry is more committed to the development of synthetic dyes, as they have greater stability, attractive color, and their production is low cost, natural food dyes are gradually gaining ground in this segment due to the change in the lifestyle of consumers, adoption of healthy eating, and increased concerns about possible adverse health effects and environmental damage caused by artificial colors [2].
As an example, consumption of some artificial dyes is associated with an increase in hyperactive behavior in children. Studies that report cases of allergic reactions by susceptible individuals who consume artificially colored foods are also common. In addition, the preference for the application of natural dyes in food products can provide technological resources and bioactive functionalities, resulting in a final product with greater added value [3]. In this sense, the processing of natural raw materials, still little explored, should be considered by the food industry for the development of new products such as dyes, as it may attract new customers according to the needs of consumers [4].
In the USA and the European Union, different natural dyes have been extracted and exploited commercially, and anthocyanins are among them [5]. Despite the large number of natural dyes intended for application in the food industry, anthocyanins, carotenoids, phycobiliproteins, betalains, and chlorophylls stand out, being the most common pigments for applications in food [6].
Anthocyanins are flavonoids and can appear in colors ranging from red to blue, depending on the pH at which they are found; these pigments are recognized for several bioactive properties such as antioxidant, anti-inflammatory, hypoglycemic, and chemopreventive effects [7]. Similar to other natural pigments, the anthocyanins are unstable and could decompose during the extraction, purification, production, and storage. The factors that affect the potent of anthocyanin could include the chemical structure of color, pH, and temperature [8]. However, the endurance of anthocyanin depends on many other factors such as ascorbic acid, metals, sugar, oxygen, light, and enzymes in the manufacturing process and polymerization [9].
According to studies on raw materials with high potential for pigmentation, red cabbage is one of the vegetables that make up the group of vegetables rich in anthocyanins. For this and other characteristics, such as the low commercial value and the ease of extracting pigments, the anthocyanins of this vegetable still present another differential in relation to the others, which is the greater stability due to its acidic environment. Another important feature is that their application is not restricted to acidic foods, and can also color neutral foods. Currently, its applicability has focused on coloring drinks, sweets, dry mixed concentrates, chewing gum, yogurts, and sauces [10]. To obtain natural dyes, it is necessary to carry out an extraction process for these compounds. However, some natural bioactives that are present in these dyes can be degraded due to the applied processing conditions [11].
From a scientific point of view, considering red cabbage as a promising source for the extraction of natural pigments, as it is a vegetable rich in anthocyanins, of low cost and wide availability, the present study aims to define favorable conditions for the extraction of anthocyanins using solvents of reduced high value, thus, producing natural extracts of red cabbage, under different conditions, varying the type of solvent, type of pre-treatment of the raw material, pH range, and processing temperature.
2. Results and Discussion
In Table 1 the quantitative results of anthocyanins present in the extracts obtained from different solvents (water, 25 and 70% alcohol) and under different extraction conditions are presented, showing the variations in the treatment of the raw material before extraction (in natura and with pre-drying), the pH range of the solution (4.0 and 6.0), and the extraction processing temperature (25 and 75 °C).

Table 1.
Anthocyanin content in red cabbage extracts obtained from different solvents (water, 25 and 70% alcohol) and under different extraction conditions.
It is observed that all the results present minimum significant deviation and a coefficient of variation lower than 0.35. The extracts 02 and 08 do not differ from each other as both use water as the extractor solvent and raw material with pre-drying in an oven at 70 °C for 1 h. The variation in these formulations occurs only by pH and processing temperature.
All results obtained in this study are higher than the anthocyanin value reported by Vergara et al. [12], who quantified 9.32 mg/100 g of anthocyanins in formulation from blackberry, butia, and red pitanga pulps. In the studies, the authors proposed the study of bioactives in a mix of pulps used to formulate chewable candies. The anthocyanin content presented here also exceeds those obtained by Barbosa et al. [13], in which the authors report 4.0 mg/100 g of anthocyanins in an aqueous extract obtained from diluted powdered hibiscus.
The values for extracts 09, 11, and 15 (96.47, 191.37, and 171.34 mg/100 g, respectively), with 25% alcohol in the formulation, are close to the value quantified by Huaranca-Huarchaya et al. [14], who obtain 147.99 mg/100 g of anthocyanins in an acidified alcoholic extract obtained from Alaybili (Vaccinium floribundum kunth) when they study the kinetics of thermal degradation of anthocyanins. These values are also close to the result obtained by Moura et al. [15], who quantify 138.96 mg/100 g of anthocyanins in a 50% hydroalcoholic extract obtained from hibiscus calyx when characterizing and quantifying bioactive compounds in the plant.
The averages of the other extracts are similar to the results obtained by Silva et al. [16], who report 20.60 mg and 62.57 mg/100 g of anthocyanins for hydroalcoholic extracts (80%) obtained from the dried and ground pomace of malbec and petit verdot grape varieties, respectively. Wang et al. [17], when studying extraction of total anthocyanins in purple sweet potato through ultrasound-assisted enzymatic extraction (UAEE), obtain the best results of 2.27 mg/g in 78% ethanol concentration, material-liquid ratio of 1:15 g/mL, and pH 4.5.
According to the arrangement of the data in Table 1, it is observed that there is no standardization from the highest to the lowest value or the opposite, in relation to the statistical difference. However, it is noticeable that the highest values of anthocyanins in each table are always associated with the extract with pH 4.0 and temperature of 25 °C. This fact corroborates what was described by Barbosa et al. [18], where the authors mention that the highest results of anthocyanins are generally associated with lower pH numbers, since phenolic compounds have greater affinity with acidified media/environments. Temperature is one of the factors that most influence the stability of anthocyanins, more specifically, monomeric anthocyanins and the intensity of the corresponding dye tend to decrease with the time-temperature combination [19].
Table 2 shows the values of the colorimetric parameters for the extracts that use water, 25% alcohol, and 70% alcohol as extracting solvent.
Table 2.
Values of luminosity (L*), red intensity (a*), yellow/blue intensity (b*), Chroma and hue angle in red cabbage extracts obtained from different solvents (water, 25 and 70% alcohol) and under different extraction conditions.
It is noticed that the luminosity (L*) is directly influenced by the pH and the extraction temperature in all the solvents used. The lowest values of L* are found when we use 25% alcohol as solvent, indicating that less translucent extracts are obtained when this solvent is used at this concentration. This phenomenon can be explained when we look at the table with the values of anthocyanins present, where the extracts that are have 25% alcohol applied have higher values than the others, showing greater pigmentation, that is, a more efficient extraction. Rigolon and Stringheta et al. [20], when analyzing juçara fruits, found a luminosity of 24.32 ± 0.08, a value close to that presented in the extraction method with 25% alcohol and lower pH (4.0), using a temperature of 25 °C.
The parameter a* demonstrates great variation both within the type of solvent and also in the variables studied, where the maximum value shown is 24.433 and the minimum is 0.3566. This parameter is responsible for indicating the presence of the red color in the extracts, so the greater the value of a*, the greater the influence of red on the color of the extracts, while the b* parameter indicates the incidence of yellow/blue in the sample, as Barretto et al. [21] state. Thuy et al. [22], when studying the colorimetric parameters of blackberry pulp powders (Morus sp.) obtained at temperatures of 60 and 70 °C, found lower values for a* between 4.55 to 6.00 and higher values for L* of 59.93 and 64.13, respectively. The chroma corresponds to the color saturation of the samples, that is, their intensity. Values close to zero correspond to neutral colors (gray tones), while values close to 60 indicate bright colors, being considered a quantitative attribute of the color and used to determine the degree of difference of a tone in comparison with a gray color with the same luminosity. The higher the chroma values, the greater the color intensity of the samples perceived by humans [23]. Therefore, the chromaticity results in values ranging from 7.917 to 22.566, which corresponds to low saturation, indicating neutral colors, less bright to human perception. It is also noticed that the a* parameter has a greater influence on the color saturation of the extracts, a result also found by Madalão [24] for the analysis of juçara pulp.
The hue angle, according to the CIELab system, translates the tone and can vary from 0° to 360°, where at 0° there is a predominance of the red color, and at 90° the predominant tone is yellow. At 180°, there is a predominance of the green tone and at 270° the predominant blue tone is perceived [25]. Thus, we can observe that, according to the results found in this study, the extracts do not show a defined behavior, but remain in the first quadrant of the colored solid, with a predominant shade of red.
3. Materials and Methods
3.1. Obtaining and Processing Raw Materials
The red cabbages were purchased at a local market and transported to the Laboratory for the Storage and Processing of Agricultural Products (LAPPA) at the Federal University of Campina Grande (UFCG), PB, Brazil, where they were received and selected according to size and weight.
In the preparation of the raw material, the cabbages were defoliated, the external and damaged leaves were discarded, and the central stalks were removed and sanitized (200 ppm of active chlorine/10 min).
3.2. Obtaining Red Cabbage Extracts
To obtain the extracts, three types of solvents were used: water, 25% ethyl alcohol, and 70% ethyl alcohol. In the preparation of the raw material, part of the leaves were submitted to a pre-treatment before contact with the extracting solvent, performing a pre-drying in an air circulation oven (Fanem, model 320, Guarulhos, São Paulo, Brazil) at a temperature of 70 °C for 1 h. From this procedure, two raw materials for extraction were obtained: the fresh leaves of red cabbage in natura and the leaves that received pre-drying.
To obtain the extract, the methodology described by Nazaré et al. [26] was used, in the proportion 1:2 w/v, in which for every 50 g of raw material, 100 mL of extracting solvent was added. After homogenization of the leaves with the solvent in a blender (Arno, model Power max 1000 W, Itapevi, São Paulo, Brazil) for 5 min, the extracts had the pH adjusted with hydrochloric acid (HCl) 1.0 N until reaching the range of pH 4.0 and with sodium hydroxide (NaOH) 1.0 N until reaching the pH 6.0 range (Figure 1). In this pH adjustment step, the extracts underwent changes in color.

Figure 1.
Red cabbage extracts with pH 6.0 and 4.0.
After pH adjustments, the extracts were submitted to different temperatures and kept under these conditions for 30 min, applying two temperatures, 25 and 75 °C. Samples subjected to a temperature of 75 °C were heated in a water bath (SPLabbor, Model SP-06/100ED, São Paulo, Brazil). The mixtures were kept at rest for 24 h at a refrigerated temperature of 10 °C (±2), in glass containers with lids and wrapped in aluminum foil, being homogenized by manual and slow stirring every 6 h.
After resting, the extracts were subjected to two filtrations, the first in a stainless steel sieve and the second in a vacuum, with the aid of a Büchner funnel. The samples were concentrated in a vacuum rotary evaporator (QUIMIS, Model Q-344B2, Diadema, São Paulo, Brazil) until the solvent was completely removed. Figure 2 describes the steps for obtaining red cabbage extracts.
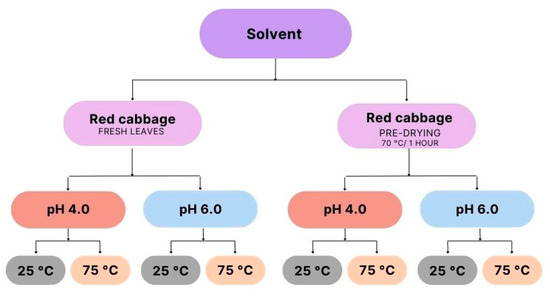
Figure 2.
Steps for obtaining red cabbage extracts.
The experiment consisted of a total of 24 samples of extracts under different extraction conditions, with (eight) samples for each type of solvent used, two types of treatments for the raw material, two pH ranges, and two different temperatures.
For a better organization of the data, the extracts were coded with numbers from 1 to 24, where extracts 01 to 08 are the extracts where water was used as an extracting agent, extracts 09 to 16 refer to the extracts where 25% alcohol was used as extractor solvent, and extracts number 17 to 24 are the extracts with 70% alcohol in their formulation.
Table 3 shows the codification and specifications of the samples with their respective extraction conditions.
Table 3.
Specification coding of red cabbage extracts.
3.3. Characterization of Extracts
The extracts obtained were evaluated for total anthocyanin content and colorimetric parameters. The determination of anthocyanins was performed according to the method described by Francis [27], in which 0.2 g of the sample was dissolved in 10 mL of the extracting solution, ethanol–HCL (1.5 N) in the proportion 85:15, in a dark environment and left to rest for 24 h under refrigeration. Readings were performed in a spectrophotometer (Coleman, model 35-D, Santo André, São Paulo, Brazil) and the results expressed in mg tannic acid equivalent (TAE) at a wavelength defined as 535 nm for absorbance.
The color characteristics were evaluated using the Minolta colorimeter (Chroma meter CR400 model) by measuring the color parameters L* (brightness, which varies from black to white), a* (chromaticity that changes from green to red, where +a indicates red and −a indicates green), and b* (chromaticity from blue to yellow, where +b indicates yellow and –b indicates blue). The chroma C* (saturation index) and the hue angle h* (tonality angle) were determined by Equations (1) and (2), respectively:
where a* = parameter variation a*; b* = parameter variation b*.
3.4. Statistical Analysis
Statistical analysis of the parameters studied were carried out in plots divided into groups according to the types of solvents applied and the condition of the raw material, with the entire experiment being carried out in triplicate.
The data obtained were submitted to analysis of variance (ANOVA), and mean comparison test according to Tukey’s test at 5% probability, using the statistical program Sisvar version 5.6 [28].
4. Conclusions
Alcohol 25% is a viable and efficient extractor solvent for obtaining anthocyanin extracts. Purple cabbage in its in natura state is a raw material suitable for extracting pigments. The lowest pH (4.0) and processing temperature of 25 °C are the most favorable conditions for the extraction and maintenance of anthocyanins in red cabbage extracts. The extracts obtained in this study show a predominance of reddish coloration.
With the results expressed in the present work, it can be concluded that the extract that presents the best result in relation to the quantification of anthocyanins is the alcoholic extract 25% in natura, since it is non-toxic and has a low cost.
The present work is a very promising preliminary result that serves as a starting point for future projects, where the conditions of toxicity and microbiological safety of the extracts can be evaluated for the conduction of an applicability test in a food matrix. In addition, other ways of obtaining the final product can be researched, such as a powdered dye, an anthocyanin-enriched dyestuff, and others.
Author Contributions
Conceptualization, A.C.d.A. and J.P.G.; data curation, A.C.d.A., F.B.d.S. and F.S.d.S.; formal analysis, W.P.d.S., A.J.d.M.Q., R.M.F.d.F., L.A.d.A.S., J.S.N. and A.P.T.R.; investigation, A.C.d.A., G.S.d.L., F.B.d.S. and F.S.d.S.; methodology, A.C.d.A., W.P.d.S., A.J.d.M.Q., G.S.d.L. and J.S.N.; supervision, J.P.G.; validation, R.M.F.d.F., L.A.d.A.S., J.S.N., F.S.d.S. and A.P.T.R.; visualization, W.P.d.S., A.J.d.M.Q. and R.M.F.d.F.; writing—original draft, A.C.d.A.; writing—review and editing, W.P.d.S., J.P.d.L.F., A.J.d.M.Q. and A.G.B.d.L.; funding acquisition, J.P.G. All authors have read and agreed to the published version of the manuscript.
Funding
This research received external funding from FAPESQ-PB/CAPES, grant number 18/2020 and CNPQ, grant numbers 308255/2022-4 and 305643/2013-4 (Brazilian research agencies).
Institutional Review Board Statement
Not applicable.
Informed Consent Statement
Not applicable.
Data Availability Statement
The data presented in this study are available on request from the corresponding authors.
Conflicts of Interest
There are no conflicts to declare.
Sample Availability
Samples of the extracts obtained in this study are available from the authors.
References
- Oliveira, C.F.D.; da Costa, J.P.V.; Vendruscolo, F. Maltose Syrup Residue as the Substrate for Monascus Pigments Production. Biocatal. Agric. Biotechnol. 2019, 18, 101101. [Google Scholar] [CrossRef]
- Albuquerque, B.R.; Oliveira, M.B.P.P.; Barros, L.; Ferreira, I.C.F.R. Could fruits be a reliable source of food colorants? Pros and cons of these natural additives. Crit. Rev. Food Sci. Nutr. 2021, 61, 805–835. [Google Scholar] [CrossRef] [PubMed]
- Rodriguez-Amaya, D.B. Natural Food Pigments and Colorants. Curr. Opin. Food Sci. 2016, 7, 20–26. [Google Scholar] [CrossRef]
- Alves de Oliveira, E.N.; da Costa Santos, D.; Gomes, J.P.; Rocha, A.P.T.; da Silva, W.P. Physicochemical Stability of Diet Umbu-Caja Jams Stored under Ambient Conditions: Physicochemical Stability of Diet Umbu-Caja Jams. J. Food Process. Preserv. 2015, 39, 70–79. [Google Scholar] [CrossRef]
- Sigurdson, G.T.; Tang, P.; Giusti, M.M. Natural Colorants: Food Colorants from Natural Sources. Annu. Rev. Food Sci. Technol. 2017, 8, 261–280. [Google Scholar] [CrossRef]
- Luzardo-Ocampo, I.; Ramírez-Jiménez, A.K.; Yañez, J.; Mojica, L.; Luna-Vital, D.A. Technological Applications of Natural Colorants in Food Systems: A Review. Foods 2021, 10, 634. [Google Scholar] [CrossRef]
- Potera, C. Diet and nutrition: The Artificial Food Dye Blues. Environ. Health Perspect. 2010, 118, 428–431. [Google Scholar] [CrossRef]
- Gould, K.; Davies, K.M.; Winefield, C. Anthocyanins Biosynthesis, Functions, and Applications; Springer: New York, NY, USA, 2009. [Google Scholar]
- Le, X.T.; Huynh, M.T.; Pham, T.N.; Than, V.T.; Toan, T.Q.; Bach, L.G.; Trung, N.Q. Optimization of Total Anthocyanin Content, Stability and Antioxidant Evaluation of the Anthocyanin extract from Vietnamese Carissa Carandas L. Fruits. Processes 2019, 7, 468. [Google Scholar] [CrossRef]
- Zhang, J.; Wang, Z.; Liu, X. Characterization of Acylated Anthocyanins in Red Cabbage via Comprehensive Two-Dimensional High Performance Liquid Chromatography and HPLC-MS: Analysis of Anthocyanins in Red Cabbage by 2DLC. J. Food Process. Preserv. 2017, 41, e13129. [Google Scholar] [CrossRef]
- Labuschagne, P. Impact of Wall Material Physicochemical Characteristics on the Stability of Encapsulated Phytochemicals: A Review. Food Res. Int. 2018, 107, 227–247. [Google Scholar] [CrossRef]
- Vergara, L.P.; Oliveira, R.M.; Franzon, R.C.; Chim, J.F.; Zambiazi, R.C. Effect of retention of bioactive compounds and sensory profile in chewable candies made with blend pulp/effect of retention of bioactive compounds and sensory profile in chewable candies made with blend pulp. BJD 2020, 6, 90148–90159. [Google Scholar] [CrossRef]
- Barbosa, D.R.R.; Boyarski, D.R.S.; Macena, T.F.S.; Clemente, R.C. Quantification of phenolic compounds, antioxidant power and sugar content in infusion and soluble extract of Hibiscus sabdarifa L. Desafios Interdiscip. J. Fed. Univ. Tocantins 2020, 7, 108–123. [Google Scholar] [CrossRef]
- Huarancca-Huarcaya, E.; Paredes-Quiroz, L.R.; Pilares-Estrada, N.M.; Barragán-Condori, M.; Huamaní-Meléndez, V.J. Cinética Da Degradação Térmica de Antocianinas de Alaybilí (Vaccinium Floribundum Kunth) e Macha-Macha (Gaultheria Glomerata (Cav.) Sleumer). Braz. J. Food Technol. 2022, 25, e2021106. [Google Scholar] [CrossRef]
- Moura, S.C.S.R.; Hubinger, M.D.; Alvim, I.D.; Germer, S.P.M.; Souza, E.C.G.; Berling, C.L. Characterization and quantification of hibiscus (Hibiscus sabdarifa L.) bioactive compounds. In Proceedings of the XXV Brazilian Congress of Food Science and Technology, Electronic Proceedings, Gramado, Brazil, 24–27 October 2016. [Google Scholar]
- Silva, L.F.; Silva, M.M.; Ribeiro, D.S. Antioxidant activity and anthocyanin content of hydroalcoholic extracts of pomace of red grapes grown in the agreste region of Pernambuco. REBRAGO 2017, 7, 248–253. [Google Scholar]
- Wang, F.; Zhang, S.; Deng, G.; Xu, K.; Xu, H.; Liu, J. Extracting Total Anthocyanin from Purple Sweet Potato Using an Effective Ultrasound-Assisted Compound Enzymatic Extraction Technology. Molecules 2022, 27, 4344. [Google Scholar] [CrossRef]
- Oliveira, L.M.d.; Antelo, F. Thermostability of the Visual Color and Anthocyanins from Rio-Grande-Cherry (Eugenia Involucrata DC). Braz. J. Food Technol. 2020, 23, e2019140. [Google Scholar] [CrossRef]
- Remini, H.; Dahmoune, F.; Sahraoui, Y.; Madani, K.; Kapranov, V.N.; Kiselev, E.F. Recent Advances on Stability of Anthocyanins. RUDN J. Agron. Anim. Ind. 2018, 13, 257–286. [Google Scholar] [CrossRef]
- Rigolon, T.C.B.; Stringheta, P.C. Prediction of total anthocyanins, total phenolics and antioxidant capacity using colorimetric parameters for strawberry, raspberry and juçara. In Teaching, Research and Extension in Food Engineering; Pires, C.V., Ed.; Even3 Publications: Recife, Brazil, 2021; pp. 96–109. [Google Scholar] [CrossRef]
- Barretto, F.J.d.F.P.; Clemente, H.A.; Santana, A.L.B.D.; Vasconcelo, M.A.d.S. Stability of Encapsulated and Non-Encapsulated Anthocyanin in Yogurt Produced with Natural Dye Obtained from Solanum melongena L. Bark. Rev. Bras. Frutic. 2020, 42, e137. [Google Scholar] [CrossRef]
- Thuy, N.M.; Tien, V.Q.; Tuyen, N.N.; Giau, T.N.; Minh, V.Q.; Tai, N.V. Optimization of Mulberry Extract Foam-Mat Drying Process Parameters. Molecules 2022, 27, e8570. [Google Scholar] [CrossRef]
- Mendonça, A.P.; Silva, L.M.M.; Sousa, F.C.; Silva, J.R.; Rosa, J.C. Mathematical modeling of the drying curves of seeds of two andiroba species. Eng. Agric. 2019, 27, 293–303. [Google Scholar] [CrossRef]
- Madalão, M.C.M.; Lima, E.M.F.; Benincá, D.B.; Saraiva, S.H.; Carvalho, R.V.d.; Silva, P.I. Extraction of Bioactive Compounds from Juçara Pulp (Euterpe edulis M.) Is Affected by Ultrasonic Power and Temperature. Ciênc. Agrotec. 2021, 45, e024820. [Google Scholar] [CrossRef]
- Silva, M.I.; Martins, J.N.; Alves, J.E.A.; Costa, F.F.P. Physical-chemical characterization of umbu pulp in foam layer. Rev. Sem. Visu 2015, 3, 82–91. [Google Scholar] [CrossRef]
- Nazaré, R.F.R.; Oliveira, M.S.P.D.; Carvalho, J.E.U.D. Evaluation of açaí tree progenies as a source of natural dyes for food. In Proceedings of the Brazilian Congress of Fruit Culture, Belém, PA, USA, 17 November 2002; SBF: Bethlehem, PA, USA, 2002. [Google Scholar]
- Francis, F.J. Analysis of anthocyanins in foods. In Anthocyanins as Food Colors; Markakis, P., Ed.; Academic Press: New York, NY, USA, 1982; pp. 181–207. [Google Scholar] [CrossRef]
- Ferreira, D.F. Sisvar: A Guide for Its Bootstrap Procedures in Multiple Comparisons. Ciênc. Agrotec. 2014, 38, 109–112. [Google Scholar] [CrossRef]
Disclaimer/Publisher’s Note: The statements, opinions and data contained in all publications are solely those of the individual author(s) and contributor(s) and not of MDPI and/or the editor(s). MDPI and/or the editor(s) disclaim responsibility for any injury to people or property resulting from any ideas, methods, instructions or products referred to in the content. |
© 2023 by the authors. Licensee MDPI, Basel, Switzerland. This article is an open access article distributed under the terms and conditions of the Creative Commons Attribution (CC BY) license (https://creativecommons.org/licenses/by/4.0/).