Abstract
The existing study pronounces two newly developed spectrofluorimetric probes for the assay of ambroxol hydrochloride in its authentic and commercial formulations using an aluminum chelating complex and a biogenically mediated and synthesized aluminum oxide nanoparticles (Al2O3NPs) from Lavandula spica flower extract. The first probe is based on the formation of an aluminum charge transfer complex. However, the second probe is based on the effect of the unique optical characteristics of Al2O3NPs in the enhancement of fluorescence detection. The biogenically synthesized Al2O3NPs were confirmed using various spectroscopic and microscopic investigations. The fluorescence detections in the two probes were measured at a λex of 260 and 244 and a λem of 460 and 369 nm for the two suggested probes, respectively. The findings showed that the fluorescence intensity (FI) covered linear concentration ranges of 0.1–200 ng mL−1 and 1.0–100 ng mL−1 with a regression of ˃0.999 for AMH-Al2O3NPs-SDS and AMH-Al(NO3)3-SDS, respectively. The lower detection and quantification limits were evaluated and found to be 0.04 and 0.1 ng mL−1 and 0.7 and 0.1 ng/mL−1 for the abovementioned fluorescence probes, respectively. The two suggested probes were successfully applied for the assay of ambroxol hydrochloride (AMH) with excellent percentage recoveries of 99.65% and 99.85%, respectively. Excipients such as glycerol and benzoic acid used as additives in pharmaceutical preparations, several common cations, and amino acids, as well as sugars, were all found to have no interference with the approach.
1. Introduction
Lung diseases, often known as respiratory disorders, include tuberculosis, lung cancer, mesothelioma, cystic fibrosis, asthma, and cystic fibrosis. Lung disease can cause serious health issues, troubling symptoms, and potentially fatal situations if it is not treated [1]. Mycobacterium tuberculosis (TB) affects around one-third of the global population, and it causes 2 million deaths annually. According to the National Institutes of Health, TB kills more people than any other disease brought on by a single infectious agent [2].
The drug ambroxol hydrochloride (AMH) is a member of the group of medications known as “mucolytic agents” (cough/sputum thinner), and it is primarily used to treat acute (short-term) and chronic (long-term) respiratory disorders characterized by an excess of mucus. Laryngitis, tracheitis, acute and recurrent bronchitis (infection of the airways), and chronic disorders, including chronic bronchitis and chronic obstructive pulmonary disease, are all treated with ambroxol hydrochloride [3].
A careful survey of the literature revealed the presence of various techniques that have been addressed for the assay of AMH in different matrices, including bulk powder, dosage forms, and biosamples. Among these is the simultaneous determination of AMH in combination with other drugs using chromatographic separation methods [4,5]. Al Syed et al. described facile spectrofluorimetric probes for the estimation of AMH as an active metabolite of bromhexine hydrochloride [6]. Other spectrophotometric methods have been suggested for the determination of AMH in its pharmaceuticals and biological fluids [7,8,9]. Few electrochemical approaches for the determination of AMH have been reported, including voltametric and wireless sensors [10,11]. The majority of the techniques described in the literature possess certain limitations, particularly chromatographic separation, such as lack of a universal detector, low separation efficiency, time-consuming, and require large quantities of solvents [12]. Fluorescence spectroscopy is a desirable alternative technique due to its intrinsic sensitivity and ease in spectral acquisition, in which little sample preparation is required [13]. By advancing attention to using more sensitive materials, attempts have been intensive in using different components, such as metal chelation and nanomaterials [14]. The presence of dibromobenzylamino moiety in the ambroxol hydrochloride molecule has been reported to have a native fluorescence (FL) behavior in the compound. However, measuring the FL of the drug exhibited a very weak native value. The presence of the amino group in the drug and oxygen group in the reagent aluminum nitrate facilitates the ability of metal chelate with excellent stability [15]. The toughest trivalent metal ion (Al) is very electropositive and does not polarize easily. The interaction between aluminum and its ligands is noncovalent and typically involves ionic or electrostatic bonding. Al loves to coordinate with hard Lewis bases that provide electrons to its empty electron orbitals, such as OH−, F−, PO43−, SO42−, CH3COO−, ROH, RO−, and RNH2. Al complexes with multidentate ligands that are negative oxygen donors are the most stable [16].
Nanomaterials are highly sought after in numerous scientific disciplines, and metal oxides in the construction of fluorescent hybrid materials, in particular, have aroused a lot of interest [17]. Among these nanomaterials are metal oxides such as ZnO, CuO, NiO, and Al2O3 nanoparticles. The Al2O3 nanoparticles find their purposes in almost all areas, such as material engineering, drug targeting systems, catalysis, and biomedicals [18,19,20,21]. Physical and chemical processes can be used in a number of ways to create nanomaterials [22]. The findings indicated that these procedures have a number of disadvantages, including the need for expensive and toxic stabilizers or capping agents, toxic organic solvents or hazardous materials, higher temperatures required for final product preparation, and more [23]. Due to this, researchers are interested in developing green methods for the synthesis of nanomaterials [24].
Lavender is an important medicinal plant of the Lamiaceae family. It is indigenous to the Mediterranean region and grows naturally in the lower regions of mountains. Many countries in Europe, North Africa, Southwest Asia, western Iran, eastern India, China, and Japan grow lavender as a decorative plant. Lavandula spica is one of the species in the Lavandula genus in which the main active constituents of its lavender oil are linalool, linalyl acetate, terpinen-4-ol, and camphor. The phytochemicals in Lavandula spica can act as reducing, capping, and stabilizing agents for the biogenic synthesis of nanomaterials [25,26].
The objective of this work was to develop new ultrasensitive spectrofluorimetric approaches based on metal chelation with aluminum nitrate and green synthesized, mediated Lavandula spica flower extract Al2O3 nanoparticles for the estimation of ambroxol hydrochloride in its authentic and commercial syrup. The effective conditions of the two suggested approaches were investigated and optimized. The validity of both systems was proved, and a comparative study was performed between the results of the two developed methods.
2. Results and Discussion
2.1. Characterization of Green Synthesized Al2O3NPs
UV-vis spectroscopy is a great method for identifying, characterizing, and investigating nanoparticles since their optical properties are sensitive to size, shape, concentration, aggregation state, and refractive index near the nanoparticle surface. The UV-vis spectra of Al2O3NPs, Lavandula spica flowers extract, and aluminum nitrate showed the presence of three distinct peaks at 232, 276, and 304 nm for the abovementioned samples (Figure 1a). Several parameters, including band gap, oxygen deficit, surface roughness, and impurity centers, are expected to influence absorbance [27]. The absorption spectrum of Al2O3NPs exhibited at 232 nm can be resulted from the photoexcitation of electrons from the valence to the conduction band. To calculate the direct band gap of Al2O3NPs, a Tauc plot was carried out, and the band gap was estimated from the following energy quantum mechanics Equation (1):
where the band gap, blank constant (6.626 × 10⁻³⁴ J.s), velocity of light (2.99 × 10⁸ m/s), and absorption band are expressed as Eg, h, C, and λ, respectively. The estimated band gap of presynthesized Al2O3NPs was found to be 5.34 eV. The obtained optical behavior results of Al2O3NPs were in agreement with previously reported values in the literature [28].
Eg = hC/λ

Figure 1.
(a) UV-vis spectra of Al2O3NPs, Lavandula spica extract, aluminum nitrate, and blank (deionized) water and (b) the band gap of Al2O3NPs.
FT-IR measurement was performed to determine the functional groups responsible for the reduction of aluminum nitrate to Al2O3NPs and their stability. The investigation of any probable oxidation of the extract was carried out using FT-IR analysis because the reduction of the aluminum nitrate ions should be connected with the oxidation of the Lavandula spica extract. The FT-IR spectrum of Lavandula spica extract (Figure 2a) showed three absorption peaks at 3705, 3749, and 3418 cm−1, corresponding to medium, sharp, and broad O-H stretching vibration of free and intermolecular bonded alcohol, respectively. The absorption peaks at 2367, 1738, 1638, 1378, and 1055 cm−1 represent the presence of O=C=O stretching of carbon dioxide, strong C=O stretching vibration of ester, strong C=C stretching of alkene, O-H bending vibration of phenol, and strong C-O stretching of a primary alcohol, respectively [29]. However, the FT-IR analysis of Al2O3NPs (Figure 2b) displayed nine remarkable peaks at 3465 (O-H stretching vibration of intermolecular bonding of alcohol), 2435, and 2341 cm−1 (O=C=O stretching of carbon dioxide), 1636 (strong C=O stretching vibration of ester), 1356 (medium O-H bending of carboxylic acid), 1049 (strong C-O stretching of primary alcohol), 974 and 833 (strong C-H bending of the trisubstituted compound), and 612 cm−1, corresponding to Al-O, respectively [30].
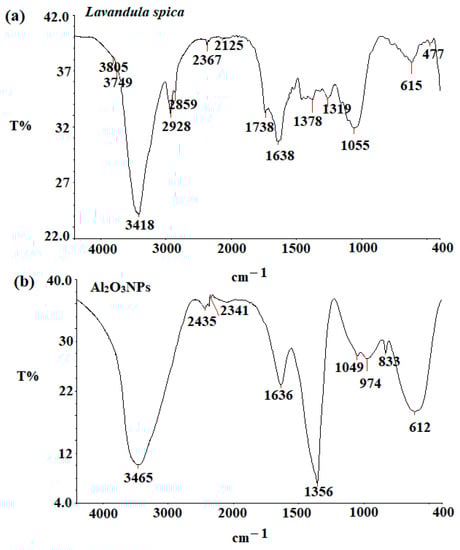
Figure 2.
FT-IR spectra of (a) Lavandula spica extract and (b) Al2O3NPs measured at 4400–400 cm−1.
Furthermore, morphology and size were determined using typical microscopic techniques such as scanning electron microscopy (SEM) and transmission electron microscopy (TEM), while elemental analysis was determined using energy-dispersive X-ray spectroscopy (EDX). The SEM images (Figure 3a,b) revealed a fine particulate matter with elongated, spherical particles that appear to be an aggregation of distinct cotton form structures. In contrast to the homogeneous arrangement, spherical-shaped crystals were detected.
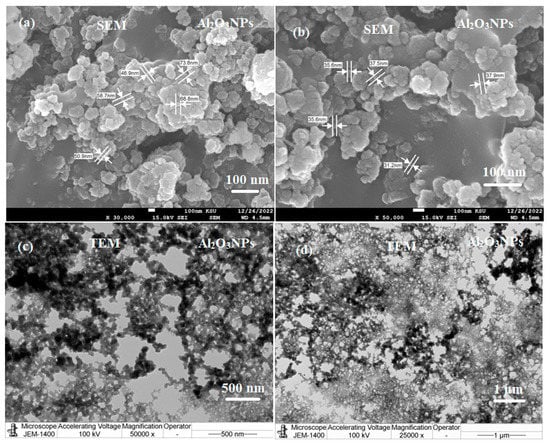
Figure 3.
(a,b) SEM and (c,d) TEM images of Al2O3NPs synthesized using Lavandula spica flower extract measured at different magnifications.
TEM micrographs (Figure 3c,d) showed spherical-shaped particles with an average particle size ranging from 30–75 nm at different magnifications. However, other larger aggregate-formed molecules were observed to have sizes of 100 nm [30].
The elemental analysis of the green synthesized Al2O3NPs prepared by Lavandula spica flowers extract was carried out using SEM in conjunction with an EDX spectrometer. According to the obtained results, it was found that in the Al2O3NPs sample, the weight% of Al, C, and O was 17.46%, 18.49%, and 64.05%, while the atomic% was recorded to be 10.46%, 24.78%, and 64.68%. EDX mapping of the as-prepared Al2O3NPs was demonstrated, and the outcomes of SEM, EDX, and elemental mapping confirmed the successful formation of Al2O3NPs (Figure 4).
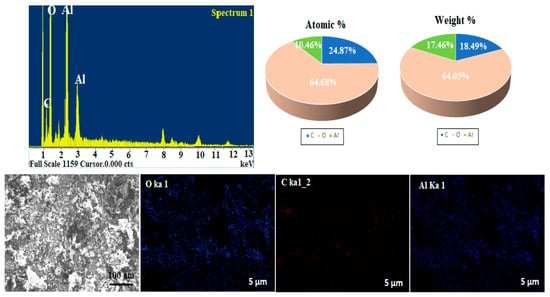
Figure 4.
EDX and mapping of Al2O3NPs synthesized using Lavandula spica flower extract.
2.2. Spectral Characteristics
Fluorescence of spectrofluorimetry is an essential analytical tool in chemistry and material science. It plays an important role in pharmaceutical determinations with low concentrations, in which high-throughput fluorescence measurements are carried out at less than µg mL−1.
Probe 1: AMH was found to exhibit an emission band of weak strength at λex = 260 and λem 460 nm. The addition of Al2O3NPs to the FL system enhanced the emission bands in the FL system (Figure 5a). Moreover, FL analysis could be successfully used to determine the investigated drug.
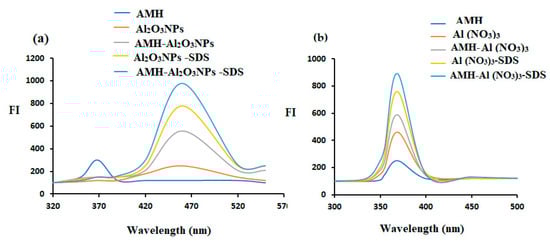
Figure 5.
Fluorescence spectra of 1.0 µg mL−1 of AMH solution with (a) Al2O3NPs (b) and Al (NO3)3 in the presence of SDS.
Probe 2: Following excitation at 244 nm, it was observed that the AMH had a weakly excitation-induced emission band at 369 nm. Each FI system’s emission bands were improved by the inclusion of Al(NO3)3 and SDS. This can be attributed to the ability of Al (III) to form fluorogenic ligands with poorly native fluorescence compounds [31]. The tested drug could also be successfully quantified using FI analysis (Figure 5b).
2.3. Optimization of Analytical Conditions
The experimental conditions of the proposed FL technique were optimized with respect to various parameters, including the effect of solvents, volume of Al2O3NPs and Al(NO3)3 solutions, buffer, volume of buffer, pH, response time, surfactant, and volume of SDS (Table 1).

Table 1.
Optimized conditions for the determination of AMH using the proposed spectrofluorometric methods in the presence of Al2O3NPs and metal-chelating agent Al (NO3)3.
2.4. Effect of Solvent
The influence of various types of solvents (water, ethanol, methanol, and acetonitrile) on the FI spectrum of the AMH solution (1.0 µg mL−1) was tested. The maximum FIs were measured according to the nature of the solvent. Figure 6a,b illustrates the effect of the solvents on the FI of the AMH solution at λex and λem wavelengths 260/460 and 244/369 and 260 for the two suggested FL methods, respectively.
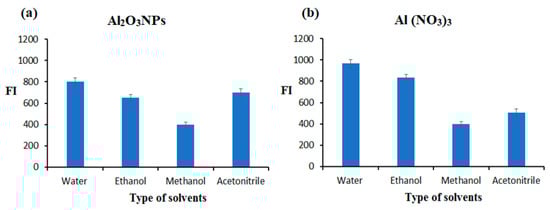
Figure 6.
Effect of solvents on the FI of 1.0 µg mL−1 AMH soluble in various solvents in the absence of (a) metal oxide nanoparticles (Al2O3NPs) and (b) metal-chelating agent (Al(NO3)3).
2.5. Effect of pH
The FI of the AMH solutions was investigated at various pH values (3–10) using 2.0 mL of acetate (0.1 mol L−1), phosphate (0.2 mol L−1), and borate buffer (0.1 mol L−1) solutions. The recorded results showed that maximum FI was observed after using phosphate buffer pH 5.8 (Figure 7a). Moreover, the effect of phosphate buffer volume on the FI spectrum was tested in the range of 1.0–6.0 mL, as shown in Figure 7b. It was observed that the use of 1.5 and 2.0 mL of phosphate buffer gave the maximum FI for the determination of AMH using Al2O3NPs and Al(NO3)3, respectively.
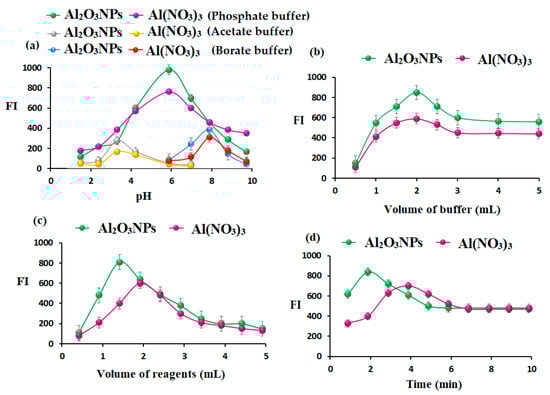
Figure 7.
(a) Effect of pH using (acetate, phosphate, and borate buffers), (b) effect of volume of phosphate buffer pH 5.8, (c) effect of volume of Al2O3NPs and Al(NO3)3, and (d) effect of response time for the determination of AMH using the two suggested AMH-Al2O3NPs and AMH-Al(NO3)3 systems.
2.6. Effect of Volume of Al2O3NPs and Al(NO3)3
The optimum volume of added Al2O3NPs and Al(NO3)3 in the ranges of 0.5–5.0 mL was examined using 1.0 µg mL−1 of AMH solution. The maximum FI peaks were recorded after adding 1.0 and 2.0 mL of Al2O3NPs and Al(NO3)3 separately to the AMH solution. Therefore, this volume was nominated as the optimum volume for further studies (Figure 7c).
2.7. Effect of Response Time
The impact of response time on the FI of the AMH solution in the presence of additional Al2O3NPs and Al(NO3)3 solution as metal oxide and metal-chelating agents was studied over a range of time periods (1–10 min). The obtained results showed that a quick reaction was attained after 2 min, with both suggesting FL systems (Figure 7d).
2.8. Effect of Surfactants
The FI of AMH in aqueous and different micellar media was investigated (Figure 8a) using an anionic surfactant (SDS), cationic surfactant (CPC), and nonionic surfactant (Triton X-100). All the studied organized media caused a decrease in the FI of AMH, while the SDS system gave a substantial enhancement effect on the FI of AMH in the presence of Al2O3NPs and Al(NO3)3. In addition, the influence of SDS volume on the FI of AMH was studied using different volumes of 0.01 mol L−1 SDS in the range of 0.5–3.0 mL. The maximum FI peaks were recorded after adding 1.0 and 2.0 mL of SDS to AMH-Al2O3NPs and AMH-Al(NO3)3 complex systems, respectively (Figure 8b).
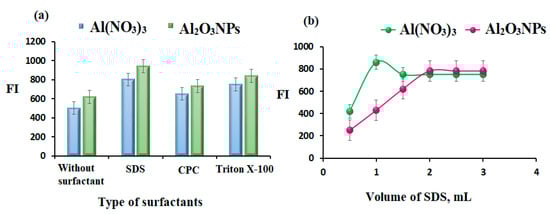
Figure 8.
(a) Effect of type of surfactants and (b) effect of volume of SDS on the AMH 1.0 µg mL−1 using AMH-Al2O3NPs and AMH-Al(NO3)3 complex systems.
2.9. Method Validation
To ensure the suitability of the suggested analytical approach with respect to accuracy and precision for the determination of the drug under investigation, method validation was performed. The established FI systems for determining AMH were validated in accordance with the suggested ICH guidelines [32].
The calibration curves of AMH determination using the developed spectrofluorometric systems were plotted using FI as a function of the drug concentrations (Figure 9). The linear concentration range was found to be at 0.1–200 and 1.0–100 ng mL−1 for the AMH-Al(NO3)3-SDS complex. The regression equation was FI = 3.2086x + 274.31 (r = 0.9995) and FI = 2.8189x + 187.41 (r = 0.9990).
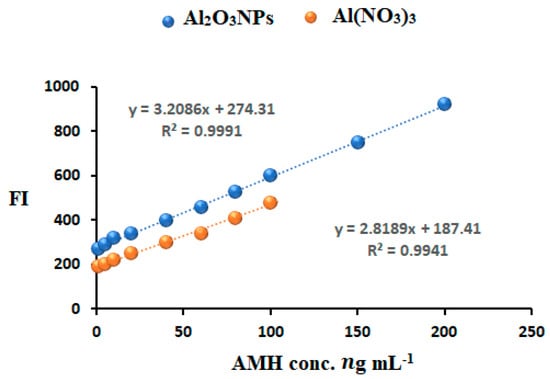
Figure 9.
Calibration curves for AMH determination in the presence of Al2O3NPs and Al(NO3)3.
Statistical analysis of the obtained results revealed a high correlation coefficient (r) value (˃0.999) and a low standard deviation value of the intercept (Sa) and slope (Sb), indicating excellent linearity of the plotted curve (Table 2).
Table 2.
Response data obtained from the determination of AMH using the proposed spectrofluorometric Al2O3NPs-SDS and Al(NO3)3-SDS systems.
The suggested spectrofluorometric methods’ lower limits of detection (LODs) and quantification (LOQs) were calculated from the relations 3.3(Sa/b) and 10 (Sa/b), respectively. The LODs of AMH-Al2O3NPs-SDS and AMH-Al(NO3)3-SDS probes were calculated to be 0.04 and 0.7 ng mL−1. However, the LOQs were 0.1 and 1.0 ng mL−1 for the abovementioned systems (Table 2).
To evaluate the accuracy of the two proposed fluorescence AMH-Al2O3NPs-SDS and AMH-Al(NO3)3-SDS probes, AMH was determined in its authentic samples. The accuracy of the suggested fluorescence systems was stated as the calculated % recoveries 99.67 ± 0.34% and 99.21 ± 0.74% in the presence of Al2O3NPs and Al(NO3)3, respectively (Table 3).
Table 3.
Results of validation calculated from the determination of AMH in authentic samples using the proposed spectrofluorometric AMH-Al2O3NPs-SDS and AMH-Al(NO3)3-SDS systems.
The proposed FL systems were validated with respect to their precision using intra-and interday assays. The precision was calculated as the % relative standard deviation (%RSD) and was accomplished from triplicate measurements of three analytical samples. The outcomes revealed that the intraday assay of AMH using AMH-Al2O3NPs-SDS and AMH-Al(NO3)3-SDS probes were 0.20% and 0.44%, respectively. However, the results for the interday assay were 0.27%, and 0.29% for the above two systems, respectively (Table 3). The resulting precision values were less than 2, revealing good precision of the AMH-Al2O3NPs-SDS and AMH-Al(NO3)3-SDS systems.
The robustness of the AMH-Al2O3NPs-SDS and AMH-Al(NO3)3-SDS systems for the analysis of AMH was determined by performing small variations in the method parameters. The pH of the analytical samples was increased or decreased by ±1, the surfactant volume was increased or decreased by (±0.1), and the volume of Al2O3NPs or Al(NO3)3 was increased or decreased by ±0.3 mL. The FI was not significantly changed by these variations. The results were estimated as the % recoveries of 99.62 ± 0.46% and 99.24 ± 0.83% for AMH in the presence of Al2O3NPs-SDS and Al(NO3)3-SDS, respectively (Table 3).
The ruggedness of the fluorescence AMH-Al2O3NPs-SDS and AMH-Al(NO3)3-SDS systems for the assay of AMH was studied by analyzing the same samples under different conditions, such as another laboratory, analyst, or instrument. The FI was not influenced by these changes. The estimated % recoveries were 99.54 ± 0.62% and 99.26 ± 0.87% for AMH determination in the presence of the AMH-Al2O3NPs-SDS and AMH-Al(NO3)3-SDS systems, respectively.
The selectivity of the designed spectrofluorometric AMH-Al2O3NPs-SDS and AMH-Al(NO3)3-SDS systems for the analysis of AMH was evaluated using various amino acids, sugars, and inactive ingredients present in the syrup formulations that were used as additive materials in the production of the AMH syrup. Using AMH samples (1.0 ng mL−1), the acceptable level was computed under optimum conditions as the number of foreign species that create an error of less than 5% (Table 4). The obtained results of the selectivity levels revealed that the developed AMH-Al2O3NPs-SDS and AMH-Al(NO3)3-SDS systems displayed acceptable selectivity for the quantification of AMH.
Table 4.
Influence of foreign substances on the analysis of AMH using the suggested spectrofluorometric Al2O3NPs-SDS and AMH-Al(NO3)3-SDS systems.
2.10. Possible Effects of Al2O3NPs and Metal Chelation
The interaction between the investigated AMH with Al(NO3)3 in the presence of a phosphate buffer solution of pH 5.8 can be conducted by the interaction of aminous hydrogens and oxygen atoms bonding to the aluminum action. Furthermore, the weakness of the metal–oxygen bonds can be broken to form a metal chelate surface complex (Figure 10a). The large surface-to-volume area of Al2O3NPs plays an impact role in the enhancement of the optical features of AMH and exhibits high tunable characteristics (Figure 10b).
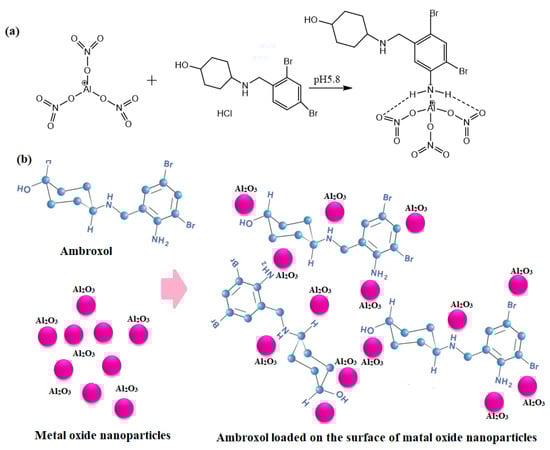
Figure 10.
(a) Possible pathway for the interaction between AMH and Al(NO3)3 and (b) the distribution of the investigated drug on the surface of Al2O3NPs.
2.11. Analytical Applications
The suggested spectrofluorometric AMH-Al2O3NPs-SDS and AMH-Al(NO3)3-SDS systems were used to determine AMH in its bulk powder (Table 5). The obtained results were 99.81 ± 0.41 and 99.39 ± 1.17 for AMH in the presence of Al2O3NPs-SDS and AMH-Al(NO3)3-SDS, respectively. The resulting data revealed that the presence of Al2O3NPs improved the sensitivity of the designed spectrofluorometric Al2O3NPs-SDS system due to the unique characteristics of Al2O3NPs, such as large surface areas, the wide band gap of semiconductor materials, and advanced optical and tunable mechanical properties.
Table 5.
Results of AMH assay using the suggested spectrofluorometric Al2O3NPs-SDS and AMH-Al(NO3)3-SDS systems.
The current spectrofluorometric probes were used to determine AMH in its commercial syrup, and the obtained results are summarized in Table 6. The obtained results were found to be 99.81 ± 0.41 and 99.45 ± 0.50 for AMH in the presence of Al2O3NPs-SDS and AMH-Al(NO3)3-SDS, respectively. The outcomes were mathematically assessed using the Student’s t-test and the variance ratio F-test [33], and the results were compared with those obtained using other published methodologies [10]. It was noticed that the proposed spectrofluorometric systems exhibited excellent sensitivity for the assay of AMH in the presence of spectrofluorometric Al2O3NPs-SDS and AMH-Al(NO3)3-SDS systems.
Table 6.
Assay of AMH in its commercial syrup applying the proposed Al2O3NPs-SDS and Al(NO3)3-SDS spectrofluorometric system.
These results are explained by the enhancing potential of metal oxide nanoparticles on the collective oscillations of conduction electrons and localized surface plasmon resonances that strongly couple to light at particular wavelengths and provide the unique high optical characteristics of the materials. The high fluorescence activity of metal oxide nanoparticles was also a result of their large surface area and tunable features that were produced through the synthesis process of their nanostructures and improved the spectrofluorimetric determination of the investigated drug.
Moreover, the results from the suggested spectrofluorometric systems were compared with previously addressed analytical techniques, such as spectrophotometric, chemiluminescence, electrochemical, and chromatographic methods. The findings are presented in Table 7. The developed spectrofluorometric Al2O3NPs-SDS and AMH-Al(NO3)3-SDS systems revealed excellent sensitivity, simplicity, and cost-effectiveness and were ecofriendly. They are also more accurate and precise and do not require high technical skills when compared with other chromatographic or electrochemical techniques.
Table 7.
A comparison between the current results from the assay of AMH applying the suggested spectrofluorometric Al2O3NPs-SDS and AMH-Al(NO3)3-SDS spectrofluorometric systems and the previously reported analytical techniques.
3. Materials and Methods
3.1. Chemicals
All chemicals and reagents are analytical, pure grade and applied for measurements without further purification. Methanol (99.8%) and ethanol (96.9%) were purchased from Sigma-Aldrich, Hamburg, Germany. Acetonitrile (99.9%), acetic acid, sodium acetate (99.0%), sodium dihydrogen phosphate (98.0%), boric acid (99.8%), aluminum nitrate nonahydrate (Al (NO3)3. 9 H2O (99.9%), sodium tetraborate (99.9%), and cetylpyridium chloride (CPC, 99.9%) were supplied by BDH Ltd., Pool, UK. However, sodium dodecyl sulfate (SDS, 99.5%), sodium hydroxide (95.0%), and Triton X-100 (99.0%) were acquired from WinLab, East Midlands, UK. Pure grade ambroxol hydrochloride (AMH) was kindly supplied by Tabuk Pharmaceutical Co., Tabuk, Saudi Arabia. The pharmaceutical preparation MUCOSOLVAN® 0.3% w/v syrup was purchased from local drug stores (Riyadh, Saudi Arabia).
3.2. Plant Material
In the current study, dried Lavandula spica flowers of Saudi Arabian origin were used. The moisture content of the flowers was detected by drying to a constant mass at 100 ± 5 °C and was less than 2%. The flowers were grounded in a grinder (GT11, Tefal, Rumilly, France) and stored at room temperature in a tight container until use.
3.3. Instruments
An RF-5301pc luminescence spectrometer (Shimadzu, Kyoto, Japan) was used for all spectrofluorometric measurements. The slit widths for both the excitation and emission monochromators were set at 5 nm, which was used to conduct all spectrofluorometric measurements. The outcomes were controlled by a PC and data gathering was performed using FI Winlab software (version 4.00.03). A pH-meter Metrohm model 744 (Metrohm Co., Herisau, Switzerland) was used to regulate the pH of the samples under investigation. Throughout the experiment, deionized water was utilized, and it was obtained via Lonenaustausscher, SG, Germany. Several techniques were applied to reveal the synthesis of Al2O3NPs, including Shimadzu-spectrophotometer-2600i (Kyoto, Japan), Perkin-Elmer-spectrometer (Waltham, MA, USA), 6000-X-ray Shimadzu diffractometer (Kyoto, Japan), JSM-7610F scanning electron microscope (SEM, Tokyo, Japan), energy-dispersive X-Ray spectrometer (EDX, Tokyo, Japan), transmission electron microscope (TEM, JEOL Ltd., Tokyo, Japan).
3.4. Preparation of Plant Extract
The preparation of Lavandula spica flowers was prepared using a previously reported method with slight modification [38]. The dried powder of Lavandula spica flowers (1.0 g) was mixed with 50 mL of deionized water and heated under constant magnetic stirring for 30 min at 60 °C. The resulting mixture was then centrifuged using 3500 rpm and filtered using Whatman filter paper no. 40. The resulting filtrate was cooled and stored in clean containers until further use in the biogenic synthesis of Al2O3NPs.
3.5. Preparation of Al2O3NPs Using Lavandula spica Flower Extract
The green preparation of Al2O3NPs was conducted using the previous literature [39] with slight changes. The preparation procedure was started by mixing 20 mL of Lavandula spica flower extract with 100 mL of aluminum nitrate nonahydrate (2.0 mol L−1) and left under continuous agitation for 30 min. Yellowish-brown Al2O3NPs were formed. The formed nanoparticles were filtered after being centrifuged at 3500 rpm for 5 min, and the resulting nanomaterials were collected, dried, and kept in a clean container for further studies. The stock solution of Al2O3NPs was obtained by sonicating 0.1 g of the pre-synthesized powder in 100 mL deionized water for 10 min and stored in the refrigerator at 4 °C (Scheme 1).
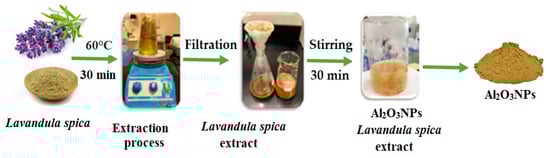
Scheme 1.
Illustration of the green synthesis of Al2O3NPs using Lavandula spica flower extract.
3.6. Characterization of the Synthesized Al2O3NPs
The synthesized Al2O3NPs were confirmed by several analytical techniques, such as spectroscopic and microscopic. Among these techniques were ultraviolet–visible spectroscopy (UV-vis), Fourier-transform infrared spectroscopy (FT-IR), X-ray powder diffraction spectroscopy (XRD), and scanning and transmission electron microscopy (SEM and TEM). Furthermore, the elemental content and mapping were performed using the energy-dispersive X-ray method (EDX).
3.7. Preparation of Analytical Reagents
Three different buffer solutions (acetate, phosphate, and borate) were prepared to cover a pH range from 3 to 9.3. Acetate buffer solution (0.1 mol L−1) in a pH range of 3.0–5.6 was prepared by mixing equivalent volumes of 0.1 mol L−1 acetic acid and 0.1 mol L−1 sodium acetate solution to obtain the desired pH. Meanwhile, phosphate buffer (0.2 mol L−1) in a pH range of 5.8–8 was prepared by adding equivalent amounts of 0.2 mol L−1 of sodium dihydrogen to 0.2 mol L−1 sodium hydroxide and adjusted to gain suitable pH values. However, borate buffer (0.1 mol L−1) of pH 8–9.3 was prepared by adding equivalent quantities each of 0.1 mol L−1 boric acid and 0.1 mol L−1 sodium tetraborate, and the pH was adjusted to reach the desired pH range.
Different surface-active agents, including 0.01 mol L−1 of sodium dodecyl sulfate (SDS), cetylpyridinium chloride (CPC), and Triton X-100, were prepared by dissolving 0.28 g, 0.33 g, and 0.15 mL in 100 mL deionized water of the abovementioned surfactants in a 100 mL volumetric flask, respectively. An aqueous solution of 0.01 mol L−1 Al(NO3)3.9H2O was prepared by dissolving 0.37 g of solid material in 100 mL deionized water.
3.8. Preparation of Standard AMH and Commercial Syrup Samples
A stock-standard solution of 100 µg mL−1 AMH was obtained by dissolving an accurate quantity of 10 mg of AMH in 100 mL deionized water. The prepared solution was stored in an amber glass bottle and kept aside in a dark place for further use. The working analytical samples in a concentration range of 0.001–0.1 µg mL−1 was serially diluted using deionized water. However, to prepare 1.0 µg mL−1 of MUCOSOLVAN 0.3% w/v syrup, 0.017 mL of syrup was mixed with 100 mL deionized water. The working analytical solutions in the range of 0.001–0.08 µg mL−1 was prepared by serial dilution using deionized water.
3.9. General Procedure for AMH Determination
Probe 1: At ambient temperature, the FI for AMH assay was investigated in the presence of Al2O3NPs and SDS (1.0% w/v). The analytical samples of the test drug using 10 mL volumetric flasks were analyzed to determine AMH in its pure sample and syrup. The FI was measured at λex 244 and λem 420 nm using 1.5 mL of Al2O3NPs, 0.5 mL of SDS, and 2.0 mL of phosphate buffer (0.2 mol L−1, pH 5.8). The linearity of the drug detection was expressed as calibration graphs, and a regression equation was derived to evaluate the unknown concentration of the examined drug.
Probe 2: To plot the calibration graph of the suggested method, a final AMH concentration in the range of 0.001–0.1 µg mL−1 was prepared. Approximately 1.5 mL of 0.01 mol L−1 Al(NO3)3.9H2O solution, 1.5 mL of 0.01 mol L−1 SDS, and 2.0 mL of 0.2 mol L−1 phosphate buffer (pH 5.8) was mixed with an equivalent volume of AMH drug in 10 mL volumetric flasks to obtain the required concentrations. Then, the solution was mixed well and completed to volume with deionized water. The fluorescence intensity (FI) of each sample was recorded at emission wavelength λem 369 nm after exaction wavelength at λex 244 nm.
4. Conclusions
This research study demonstrated accurate and exact fluorescent probes based on metal oxide nanoparticles (Al2O3) and metal-chelating agents (Al(NO3)3) for AMH measurement in bulk and commercial syrup. The work relied on the extraordinary optical properties of the developed spectrofluorometric AMH-Al2O3NPs-SDS and AMH-Al(NO3)3-SDS systems, which amplified the fluorescence intensity of the selected medication. The data from the recommended fluorescence probes revealed that Al2O3NPs and Al (NO3)3 had good catalytic activity and that the rise in fluorescence was precisely proportionate to the increase in drug concentrations. The findings showed excellent linearity over wide concentration ranges, and the two fluorescence probes, the AMH-Al2O3NPs-SDS and AMH-Al(NO3)3-SDS systems, can be potentially applied for the determination of AMH in its authentic powder and commercial syrup, with mean percentage recoveries of 99.81 ± 0.41, 99.39 ± 1.17 and 99.81 ± 0.41, 99.45 ± 0.50, respectively. The resulting data were statistically analyzed, and the results agreed well with those reported from previously published methods. The proposed fluorescence methods exhibited great catalytic activity and sensitivity due to the amplification of surface plasmon resonance and collective oscillations of conduction electrons that linked with light, resulting in their strong optical properties.
Author Contributions
Methodology, data curation, formal analysis, N.S.A.-H.; conceptualization, supervision, S.A.A.-T.; validation, funding acquisition, A.M.A.-M.; data curation, writing—original draft preparation, M.F.E.-T. All authors have read and agreed to the published version of the manuscript.
Funding
This research was funded by the Researchers Supporting Project at King Saud University, Riyadh, Saudi Arabia, which supported this project, and the code number is RSP-2023R247.
Institutional Review Board Statement
Not applicable.
Informed Consent Statement
Not applicable.
Data Availability Statement
All data have been included in the text.
Acknowledgments
The authors provided great appreciation to the Research Supporting project at, King Saud University, Riyadh, Saudi Arabia, for their supporting this project No. RSP-2023R247.
Conflicts of Interest
The authors declare no conflict of interest.
Sample Availability
Samples of the compounds are available from the authors.
References
- Migliori, G.B.; Marx, F.M.; Ambrosino, N.; Zampogna, E.; Schaaf, H.S.; van der Zalm, M.M.; Allwood, B.; Byrne, A.L.; Mortimer, K.; Wallis, R.S.; et al. Clinical standards for the assessment, management and rehabilitation of post-TB lung disease. Int. J. Tubercul. Lung Dis. 2021, 25, 797–813. [Google Scholar] [CrossRef] [PubMed]
- Dippenaar, A.; Goossens, S.N.; Grobbelaar, M.; Oostvogels, S.; Cuypers, B.; Laukens, K.; Meehan, C.J.; Warren, R.M.; Van Rie, A. Nanopore sequencing for mycobacterium tuberculosis, A critical review of the literature, new developments, and future opportunities. Eur. J. Clin. Microbiol. 2022, 60, e00646-21. [Google Scholar] [CrossRef]
- Md, S.; Abdullah, S.T.; Alhakamy, N.A.; Bani-Jaber, A.; Radhakrishnan, A.K.; Karim, S.; Shahzad, N.; Gabr, G.A.; Alamoudi, A.J.; Rizg, W.Y. Ambroxol hydrochloride loaded gastro-retentive nanosuspension gels potentiate anticancer activity in lung cancer (A549) cells. Gels 2021, 7, 243. [Google Scholar] [CrossRef] [PubMed]
- Panchale, W.A.; Badukle, N.A.; Sabhadinde, A.F.; Bakal, R.L.; Manwar, J.V. Concurrent analysis of ambroxol HCl and salbutamol sulphate from tablet formulation by RP-HPLC. GSC Biol. Pharm. Sci. 2020, 13, 197–202. [Google Scholar] [CrossRef]
- El-Sayed, H.M.; Hashem, H. Quality by design strategy for simultaneous HPLC determination of bromhexine HCl and its metabolite ambroxol HCl in dosage forms and plasma. Chromatographia 2020, 83, 1075–1085. [Google Scholar] [CrossRef]
- El-Sayed, A.; Elmansi, H.; Shalan, S.; Eid, M. Facile approaches for determination of Bromhexine Hydrochloride and its active metabolite Ambroxol Hydrochloride using Eosin Y. In Annales Pharmaceutiques Françaises; Elsevier Masson: Paris, France, 2022; Volume 5, pp. 687–696. [Google Scholar] [CrossRef]
- Prabu, S.L.; Shirwaikar, A.A.; Shirwaikar, A.; Kumar, C.D.; Kumar, G.A. Simultaneous UV spectrophotometric estimation of ambroxol hydrochloride and levocetirizine dihydrochloride. Ind. J. Pharm. Sci. 2008, 70, 236. [Google Scholar]
- Rele Rajan, V.; Gurav Pankaj, J. Simple Spectrophotometric methods for determination of Ambroxol Hydrochloride from pharmaceutical formulation. Int.J. PharmTech Res. 2012, 4, 994–998. [Google Scholar]
- Shah, P.S.; Patel, K.G.; Shah, P.A.; Gandhi, T.R. UV-spectrophotometry-assisted chemometric methods for simultaneous determination of ambroxol hydrochloride and doxofylline in pharmaceutical formulation. J. Chem. Metrol. 2020, 14, 106–113. [Google Scholar] [CrossRef]
- Levent, A.; Yardım, Y.; Şentürk, Z. Electrochemical performance of boron-doped diamond electrode in surfactant-containing media for ambroxol determination. Sens. Actuators B Chem. 2014, 203, 517–526. [Google Scholar] [CrossRef]
- Liu, J.; Sui, X. Hospital wireless sensor network coverage and ambroxol hydrochloride in the treatment of mycoplasma pneumonia in children. Microprocess Microsyst. 2021, 81, 103707. [Google Scholar] [CrossRef]
- Dong, M.W. The Essence of Modern HPLC: Advantages, Limitations, Fundamentals, and Opportunities. LCGC N. Am. 2013, 6, 472–479. [Google Scholar]
- Refat, M.S.; Saad, H.A.; Gobouri, A.A.; Alsawat, M.; Adam, A.M.; Shakya, S.; Gaber, A.; Alsuhaibani, A.M.; El-Megharbel, S.M. Synthesis and spectroscopic characterizations of nanostructured charge transfer complexes associated between moxifloxacin drug donor and metal chloride acceptors as a catalytic agent in a recycling of wastewater. J. Mol. Liq. 2022, 349, 118121. [Google Scholar] [CrossRef]
- Mishra, R.K.; Ha, S.K.; Verma, K.; Tiwari, S.K. Recent progress in selected bio-nanomaterials and their engineering applications: An overview. J. Sci. Adv. Mater. Devices 2018, 3, 263–288. [Google Scholar] [CrossRef]
- Mahmoud, W.H.; Mohamed, G.G.; Elsawy, H.A.; Radwan, M.A. Metal complexes of novel Schiff base derived from the condensation of 2-quinoline carboxaldehyde and ambroxol drug with some transition metal ions. Appl. Organomet. Chem. 2018, 32, e4392. [Google Scholar] [CrossRef]
- Pipattanaporn, P.; Pansiri, P.; Kumpeerakij, P.; Yaemphutchong, S.; Siri-apai, P.; Suetrong, N.; Chansaenpak, K.; Singkammo, S.; Kanjanaboos, P.; Hanlumyuang, Y.; et al. Effect of triethanolamine chelating agent on crystallinities, phase purities, and optical properties of zinc aluminate spinel synthesized by thermal decomposition. Ceram. Int. 2022, 48, 186–195. [Google Scholar] [CrossRef]
- Prozorovska, L.; Baker, B.A.; Laibinis, P.E.; Jennings, G.K. Surface-Initiated, Catechol-Containing Polymer Films for Effective Chelation of Aluminum Ions. Langmuir 2021, 37, 13617–13626. [Google Scholar] [CrossRef] [PubMed]
- Ziva, A.Z.; Suryana, Y.K.; Kurniadianti, Y.S.; Nandiyanto, A.B.; Kurniawan, T. Recent progress on the production of aluminum oxide (Al2O3) nanoparticles: A review. MESI 2021, 1, 54–77. [Google Scholar] [CrossRef]
- Meng, L.Y.; Jiang, W.; Piao, W.; Meng, W. Effect of bio-template on the properties of SiO2/Al2O3 composites for drug delivery. J. Ind. Eng. Chem. 2016, 37, 14–17. [Google Scholar] [CrossRef]
- Sani, O.N.; Yazdani, M.; Taghavi, M. Catalytic ozonation of ciprofloxacin using γ-Al2O3 nanoparticles in synthetic and real wastewaters. JWPE 2019, 32, 100894. [Google Scholar] [CrossRef]
- Hassanpour, P.; Panahi, Y.; Ebrahimi-Kalan, A.; Akbarzadeh, A.; Davaran, S.; Nasibova, A.N.; Khalilov, R.; Kavetskyy, T. Biomedical applications of aluminium oxide nanoparticles. Micro Nano Lett. 2018, 13, 1227–1231. [Google Scholar] [CrossRef]
- Tulinski, M.; Jurczyk, M. Nanomaterials synthesis methods. In Metrology and Standardization of Nanotechnology: Protocols and Industrial Innovations; John Wiley & Sons, Inc.: Hoboken, NJ, USA, 2017; Volume 15, pp. 75–98. [Google Scholar] [CrossRef]
- Shamaila, S.; Sajjad, A.K.; Farooqi, S.A.; Jabeen, N.; Majeed, S.; Farooq, I. Advancements in nanoparticle fabrication by hazard free eco-friendly green routes. Appl. Mater. Today 2016, 5, 150–199. [Google Scholar] [CrossRef]
- Sumesh, K.R.; Kanthavel, K. Green synthesis of aluminium oxide nanoparticles and its applications in mechanical and thermal stability of hybrid natural composites. J. Polym. Environ. 2019, 21, 2189–2200. [Google Scholar] [CrossRef]
- Kurkin, V.A.; Lamrini, M.; Klochkov, S.G. Lavandoside from Lavandula spica flowers. Chem. Natural Comnds. 2008, 44, 169–170. [Google Scholar] [CrossRef]
- Badr, M.M.; Badawy, M.E.; Taktak, N.E. Characterization, antimicrobial activity, and antioxidant activity of the nanoemulsions of Lavandula spica essential oil and its main monoterpenes. J. Drug Deliv. Sci. Technol. 2021, 65, 102732. [Google Scholar] [CrossRef]
- Ahmed, A.S.; Singla, M.L.; Tabassum, S.; Naqvi, A.H.; Azam, A. Band gap narrowing and fluorescence properties of nickel doped SnO2 nanoparticles. J. Lumin. 2011, 131, 1–6. [Google Scholar] [CrossRef]
- Prashanth, P.A.; Raveendra, R.S.; Hari Krishna, R.; Ananda, S.; Bhagya, N.P.; Nagabhushana, B.M.; Lingaraju, K.; Raja, N.H. Synthesis, characterizations, antibacterial and photoluminescence studies of solution combustion-derived α-Al2O3 nanoparticles. J. Asian Ceram. Soc. 2015, 3, 345–351. [Google Scholar] [CrossRef]
- Özsevinç, A.; Alkan, C. Polyurethane shell medicinal lavender release microcapsules for textile materials: An environmentally friendly preparation. Ind. Crops Prod. 2023, 192, 116131. [Google Scholar] [CrossRef]
- Tanna, J.A.; Gomaji, C.R.; Gandhare, N.V.; Juneja, H.D. Alumina nanoparticles: A new and reusable catalyst for synthesis of dihydropyrimidinones derivatives. Adv. Mater. Lett. 2016, 7, 933–938. [Google Scholar] [CrossRef]
- Mulon, J.B.; Destandau, É.; Alain, V.; Bardez, É. How can aluminium (III) generate fluorescence? J. Inorg. Biochem. 2005, 99, 1749–1755. [Google Scholar] [CrossRef]
- ICH. Q2 (R1): Validation of analytical procedures: Text and methodology. In Proceedings of the International Conference on Harmonization, Geneva, Switzerland, 1–13 November 2005. [Google Scholar]
- Miller, J.C.; Miller., J.N. Statistics for Analytical Chemistry, 3rd ed.; Ellis Horwood PTR Prentice Hall: New York, NY, USA, 1993. [Google Scholar]
- Panchale, W.A.; Bakal, R.L. First-order derivative spectrophotometric estimation of gemifloxacin mesylate and ambroxol HCl in tablet dosage form. GSC Biol. 2021, 14, 29–36. [Google Scholar] [CrossRef]
- Xiong, F.M.; Tang, Y.H.; Sun, S.J.; Wang, N.N. Determination of ambroxol using flow-injection chemiluminescence method. J. Chin. Pharm. Sci. 2006, 26, 1740–1742. [Google Scholar] [CrossRef]
- Li, L. Electrochemical Methods for Quantitative Estimation of Ambroxol Hydrochloride in drug for the Treatment of Asthmatic Bronchitis. Int. J. Electrochem. Sci. 2021, 9, 1–16. [Google Scholar] [CrossRef]
- Akram, N.M.; Gopal, N.M.; Balakrishna, A.; Reddy, N.B.; Sravya, G.; Zyryanov, G.V. RP-HPLC method for the simultaneous analysis of ambroxol hydrochloride and nitazoxanide in API and tablet dosage form. AIP Conf Proc. 2022, 2390, 020002. [Google Scholar] [CrossRef]
- Guo, X.; Wang, P. Aroma Characteristics of Lavender Extract and Essential Oil from Lavandula angustifolia Mill. Molecules 2020, 25, 5541. [Google Scholar] [CrossRef] [PubMed]
- Manikandan, V.; Jayanthi, P.; Priyadharsan, A.; Vijayaprathap, E.; Anbarasan, P.M.; Velmurugan, P. Green synthesis of pH-responsive Al2O3 nanoparticles: Application to rapid removal of nitrate ions with enhanced antibacterial activity. J. Photochem. Photobiol. B 2019, 371, 205–215. [Google Scholar] [CrossRef]


Disclaimer/Publisher’s Note: The statements, opinions and data contained in all publications are solely those of the individual author(s) and contributor(s) and not of MDPI and/or the editor(s). MDPI and/or the editor(s) disclaim responsibility for any injury to people or property resulting from any ideas, methods, instructions or products referred to in the content. |
© 2023 by the authors. Licensee MDPI, Basel, Switzerland. This article is an open access article distributed under the terms and conditions of the Creative Commons Attribution (CC BY) license (https://creativecommons.org/licenses/by/4.0/).