

Impact of Sample Preparation Methods on Single-Cell X-ray Microscopy and Light Elemental Analysis Evaluated by Combined Low Energy X-ray Fluorescence, STXM and AFM

 ,
,  , , , , ,
  ,
,  ,
,  , , and
Abstract
1. Introduction
2. Results
2.1. HEC-1-A Cells
2.1.1. XRFM Analysis
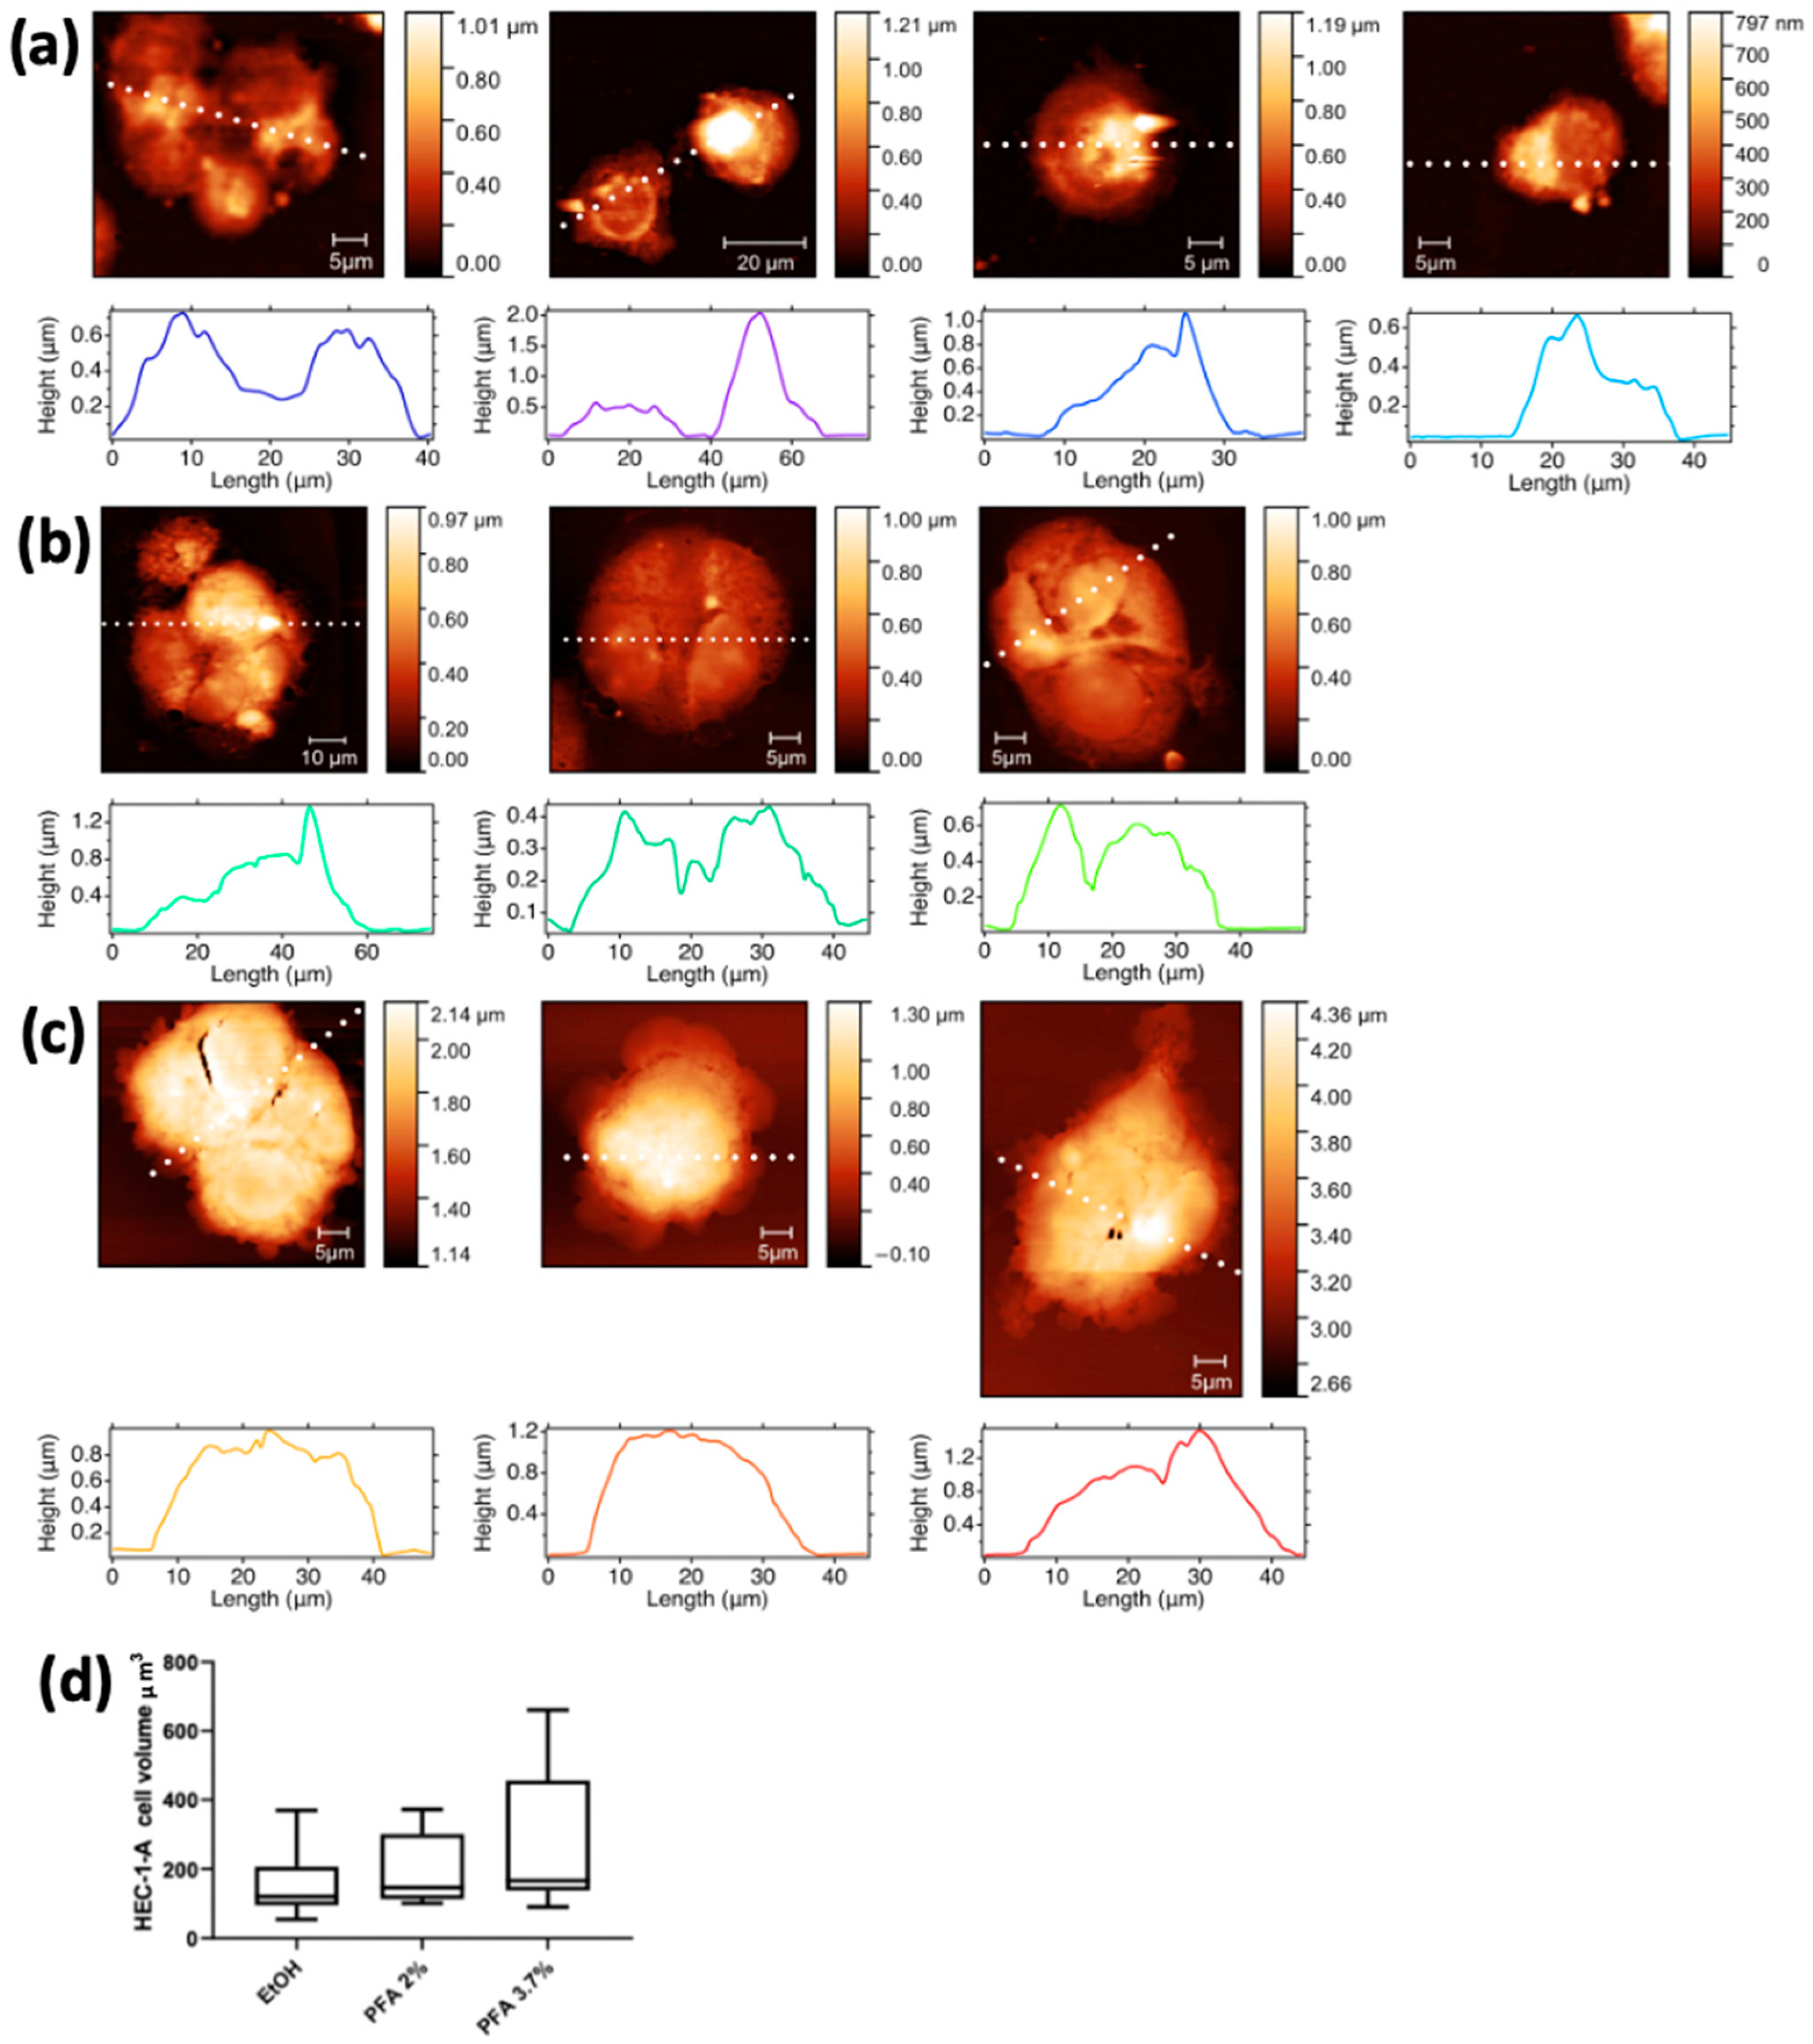
2.1.2. AFM
2.2. Spermatozoa
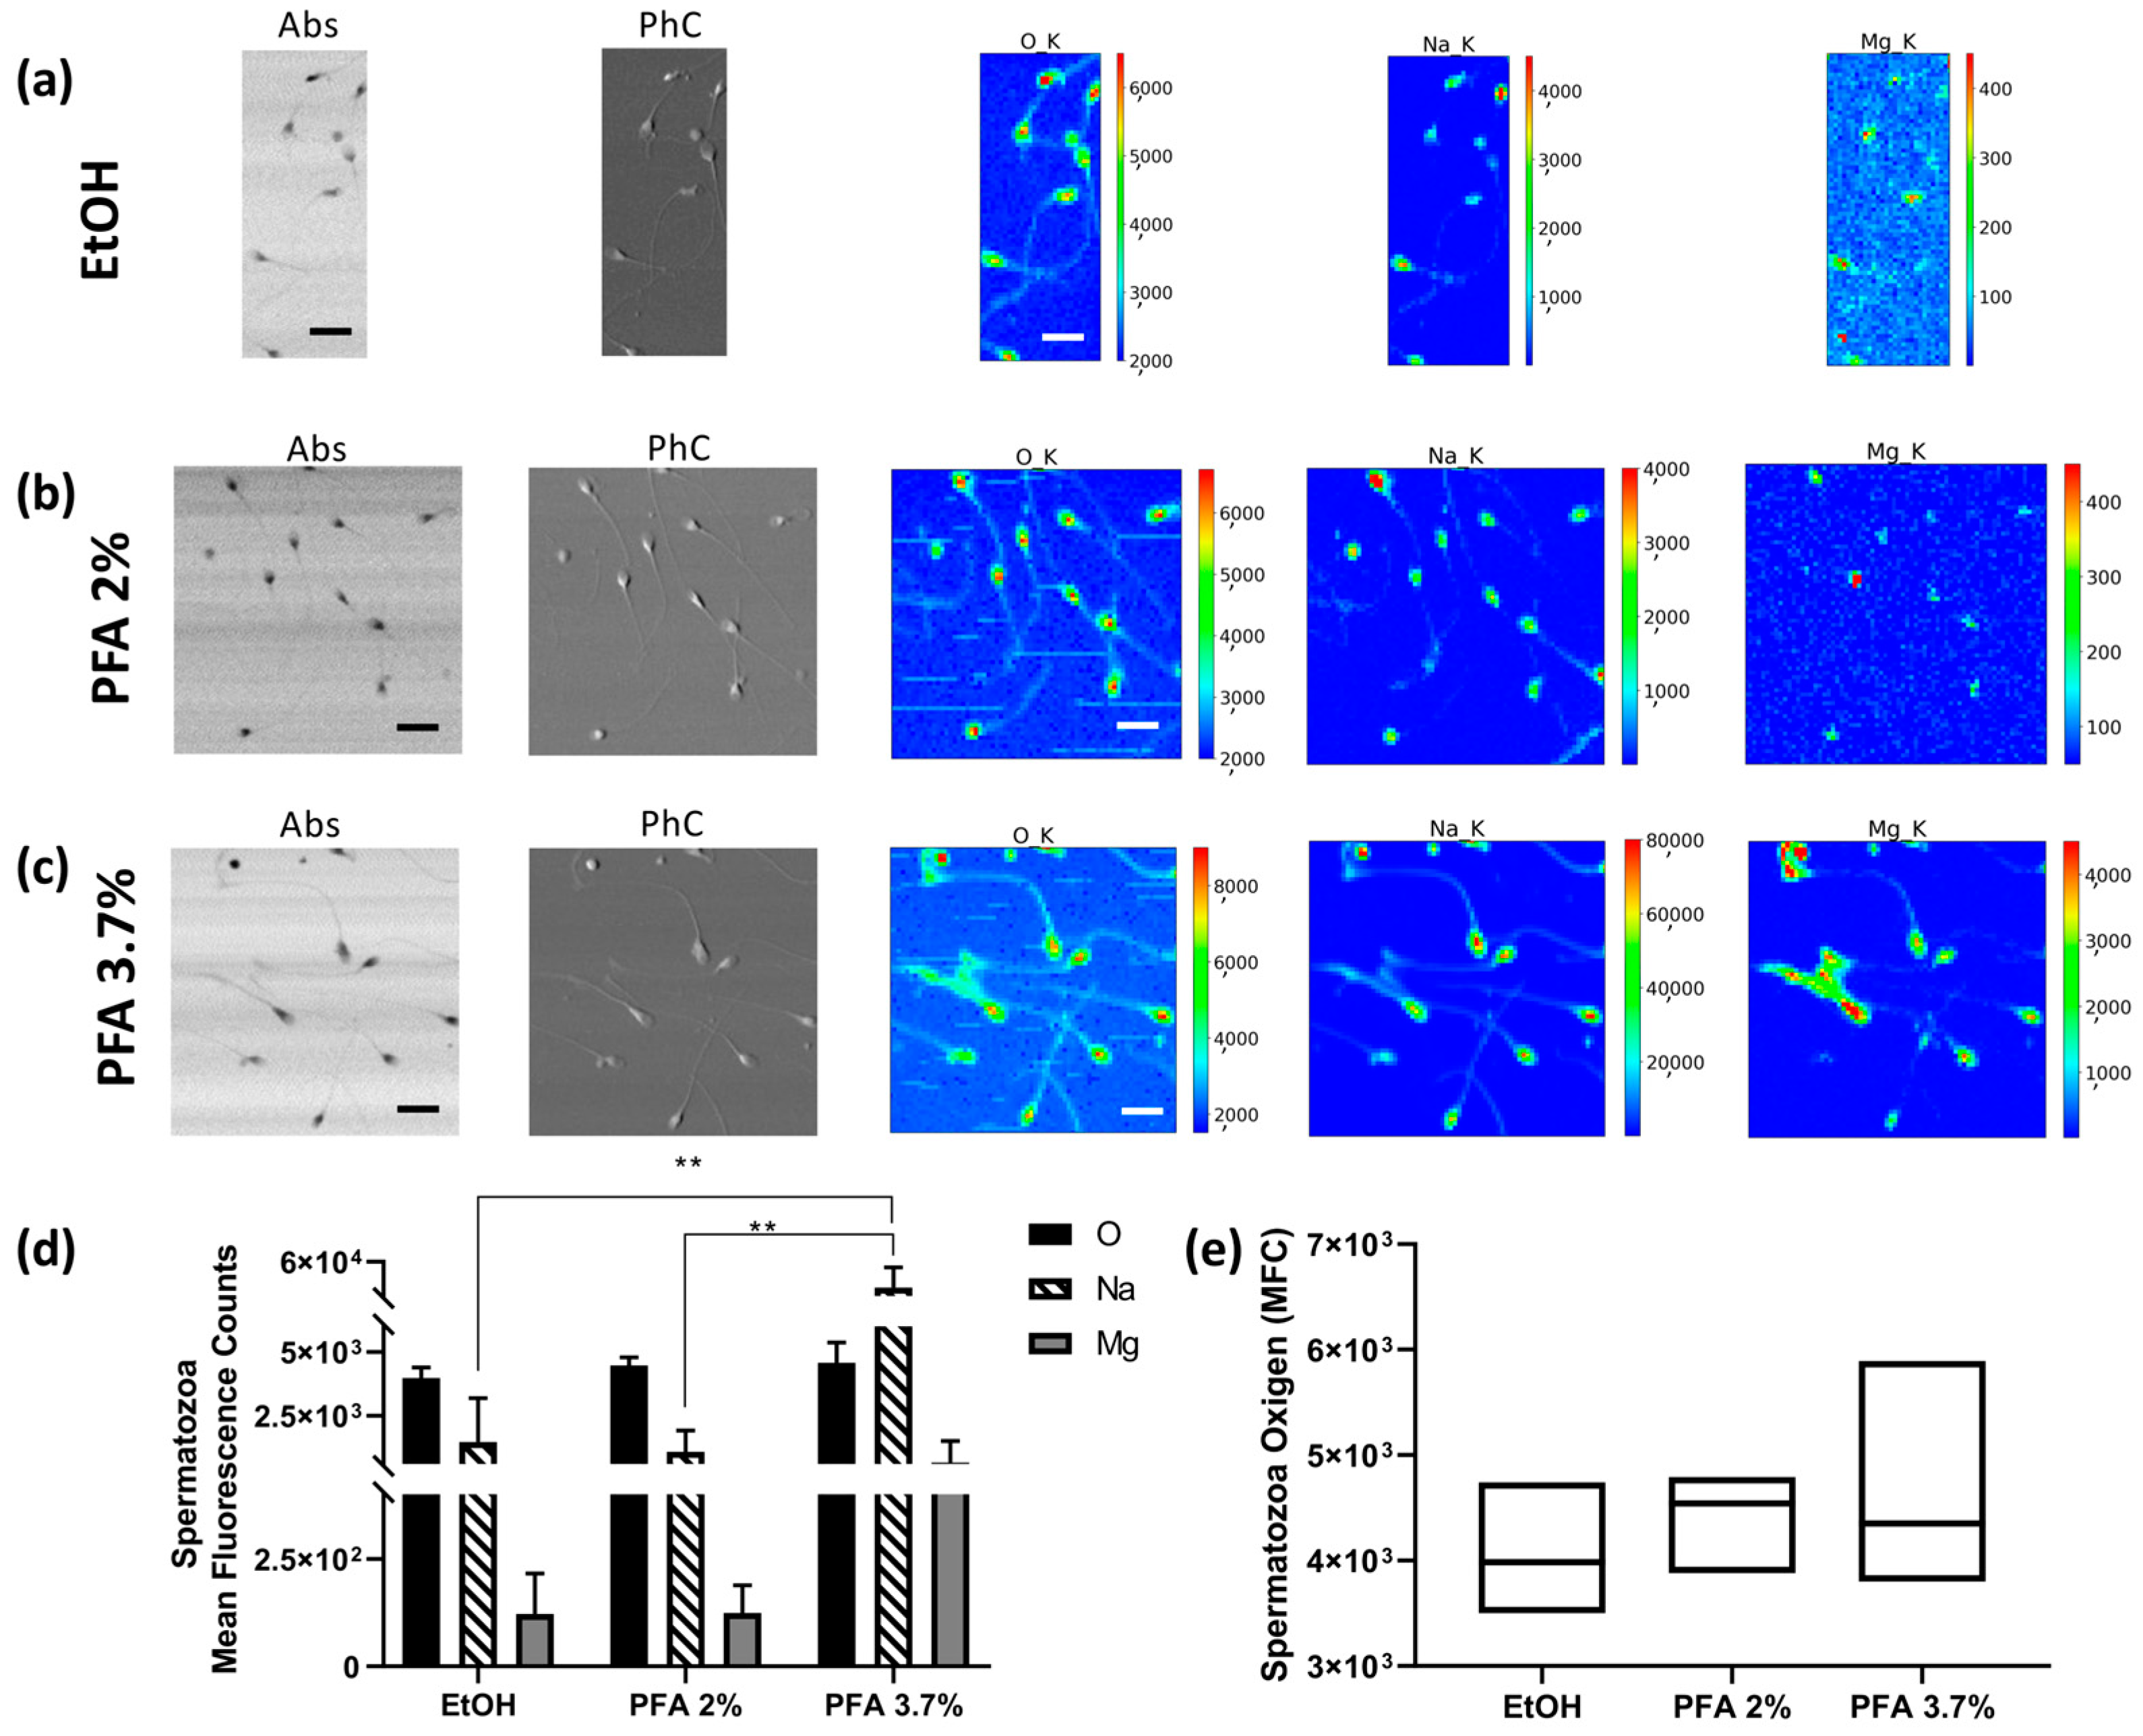
2.2.1. XRFM Analysis
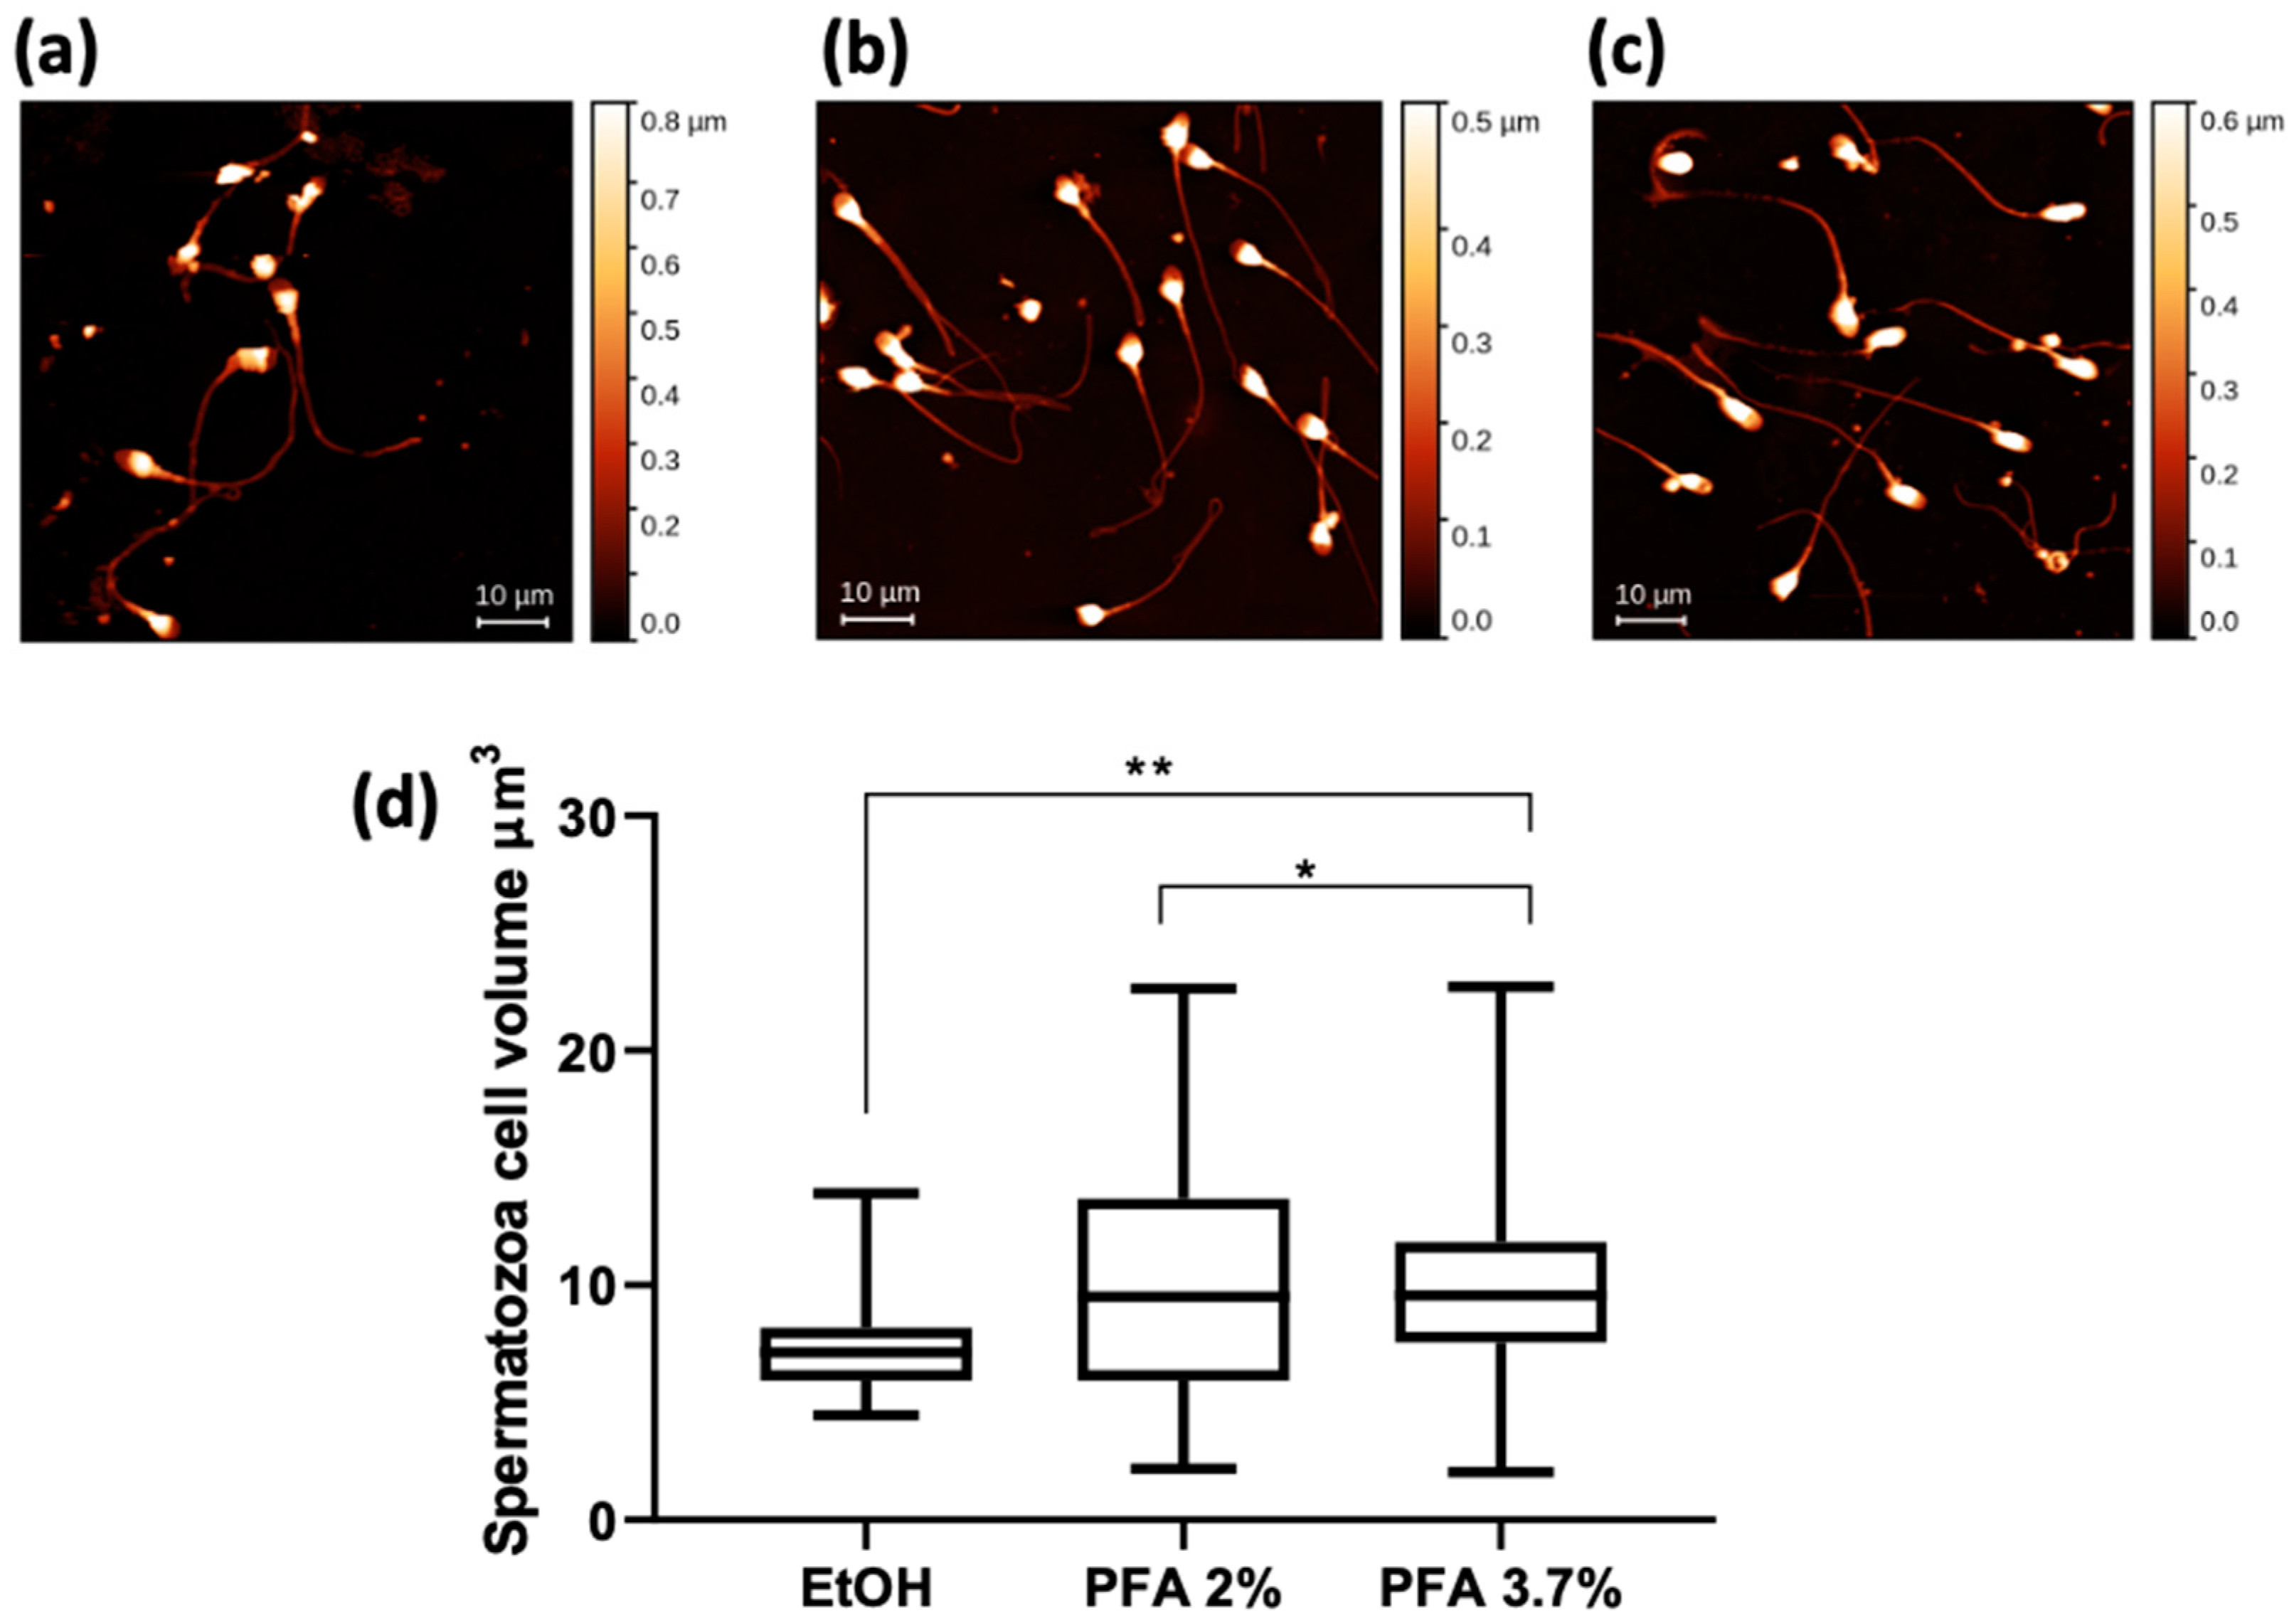
2.2.2. AFM
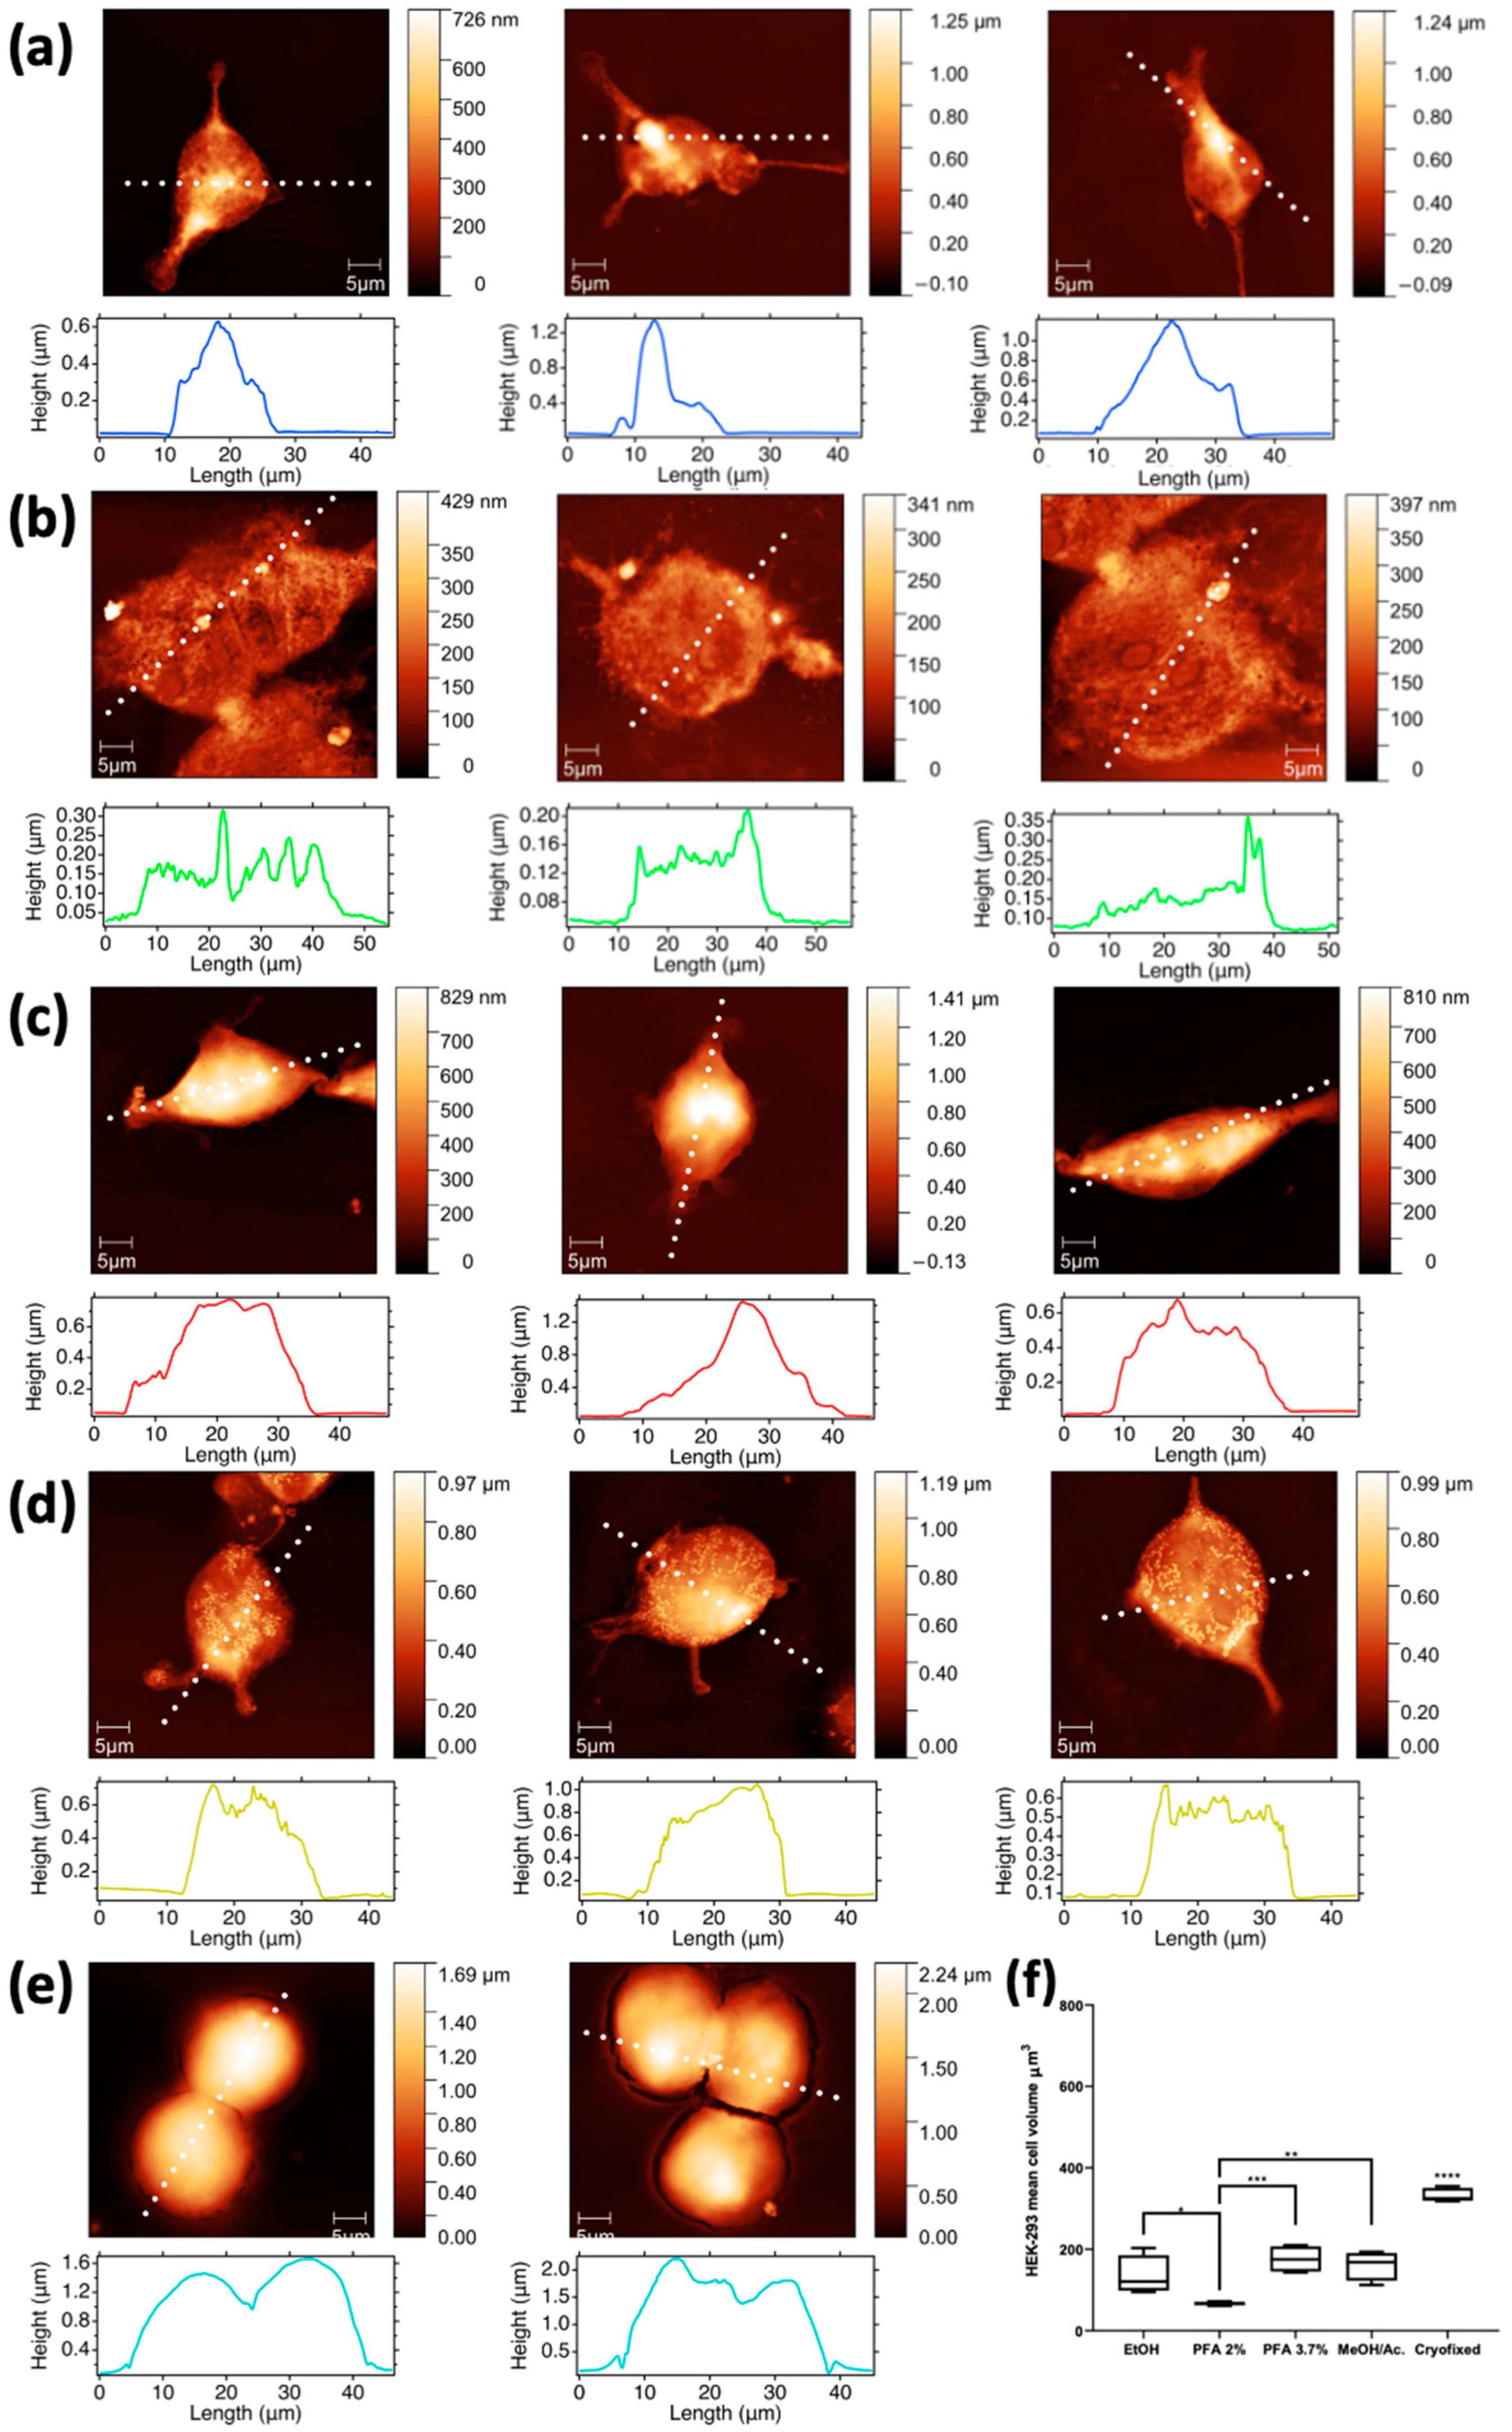
2.3. HEK-293
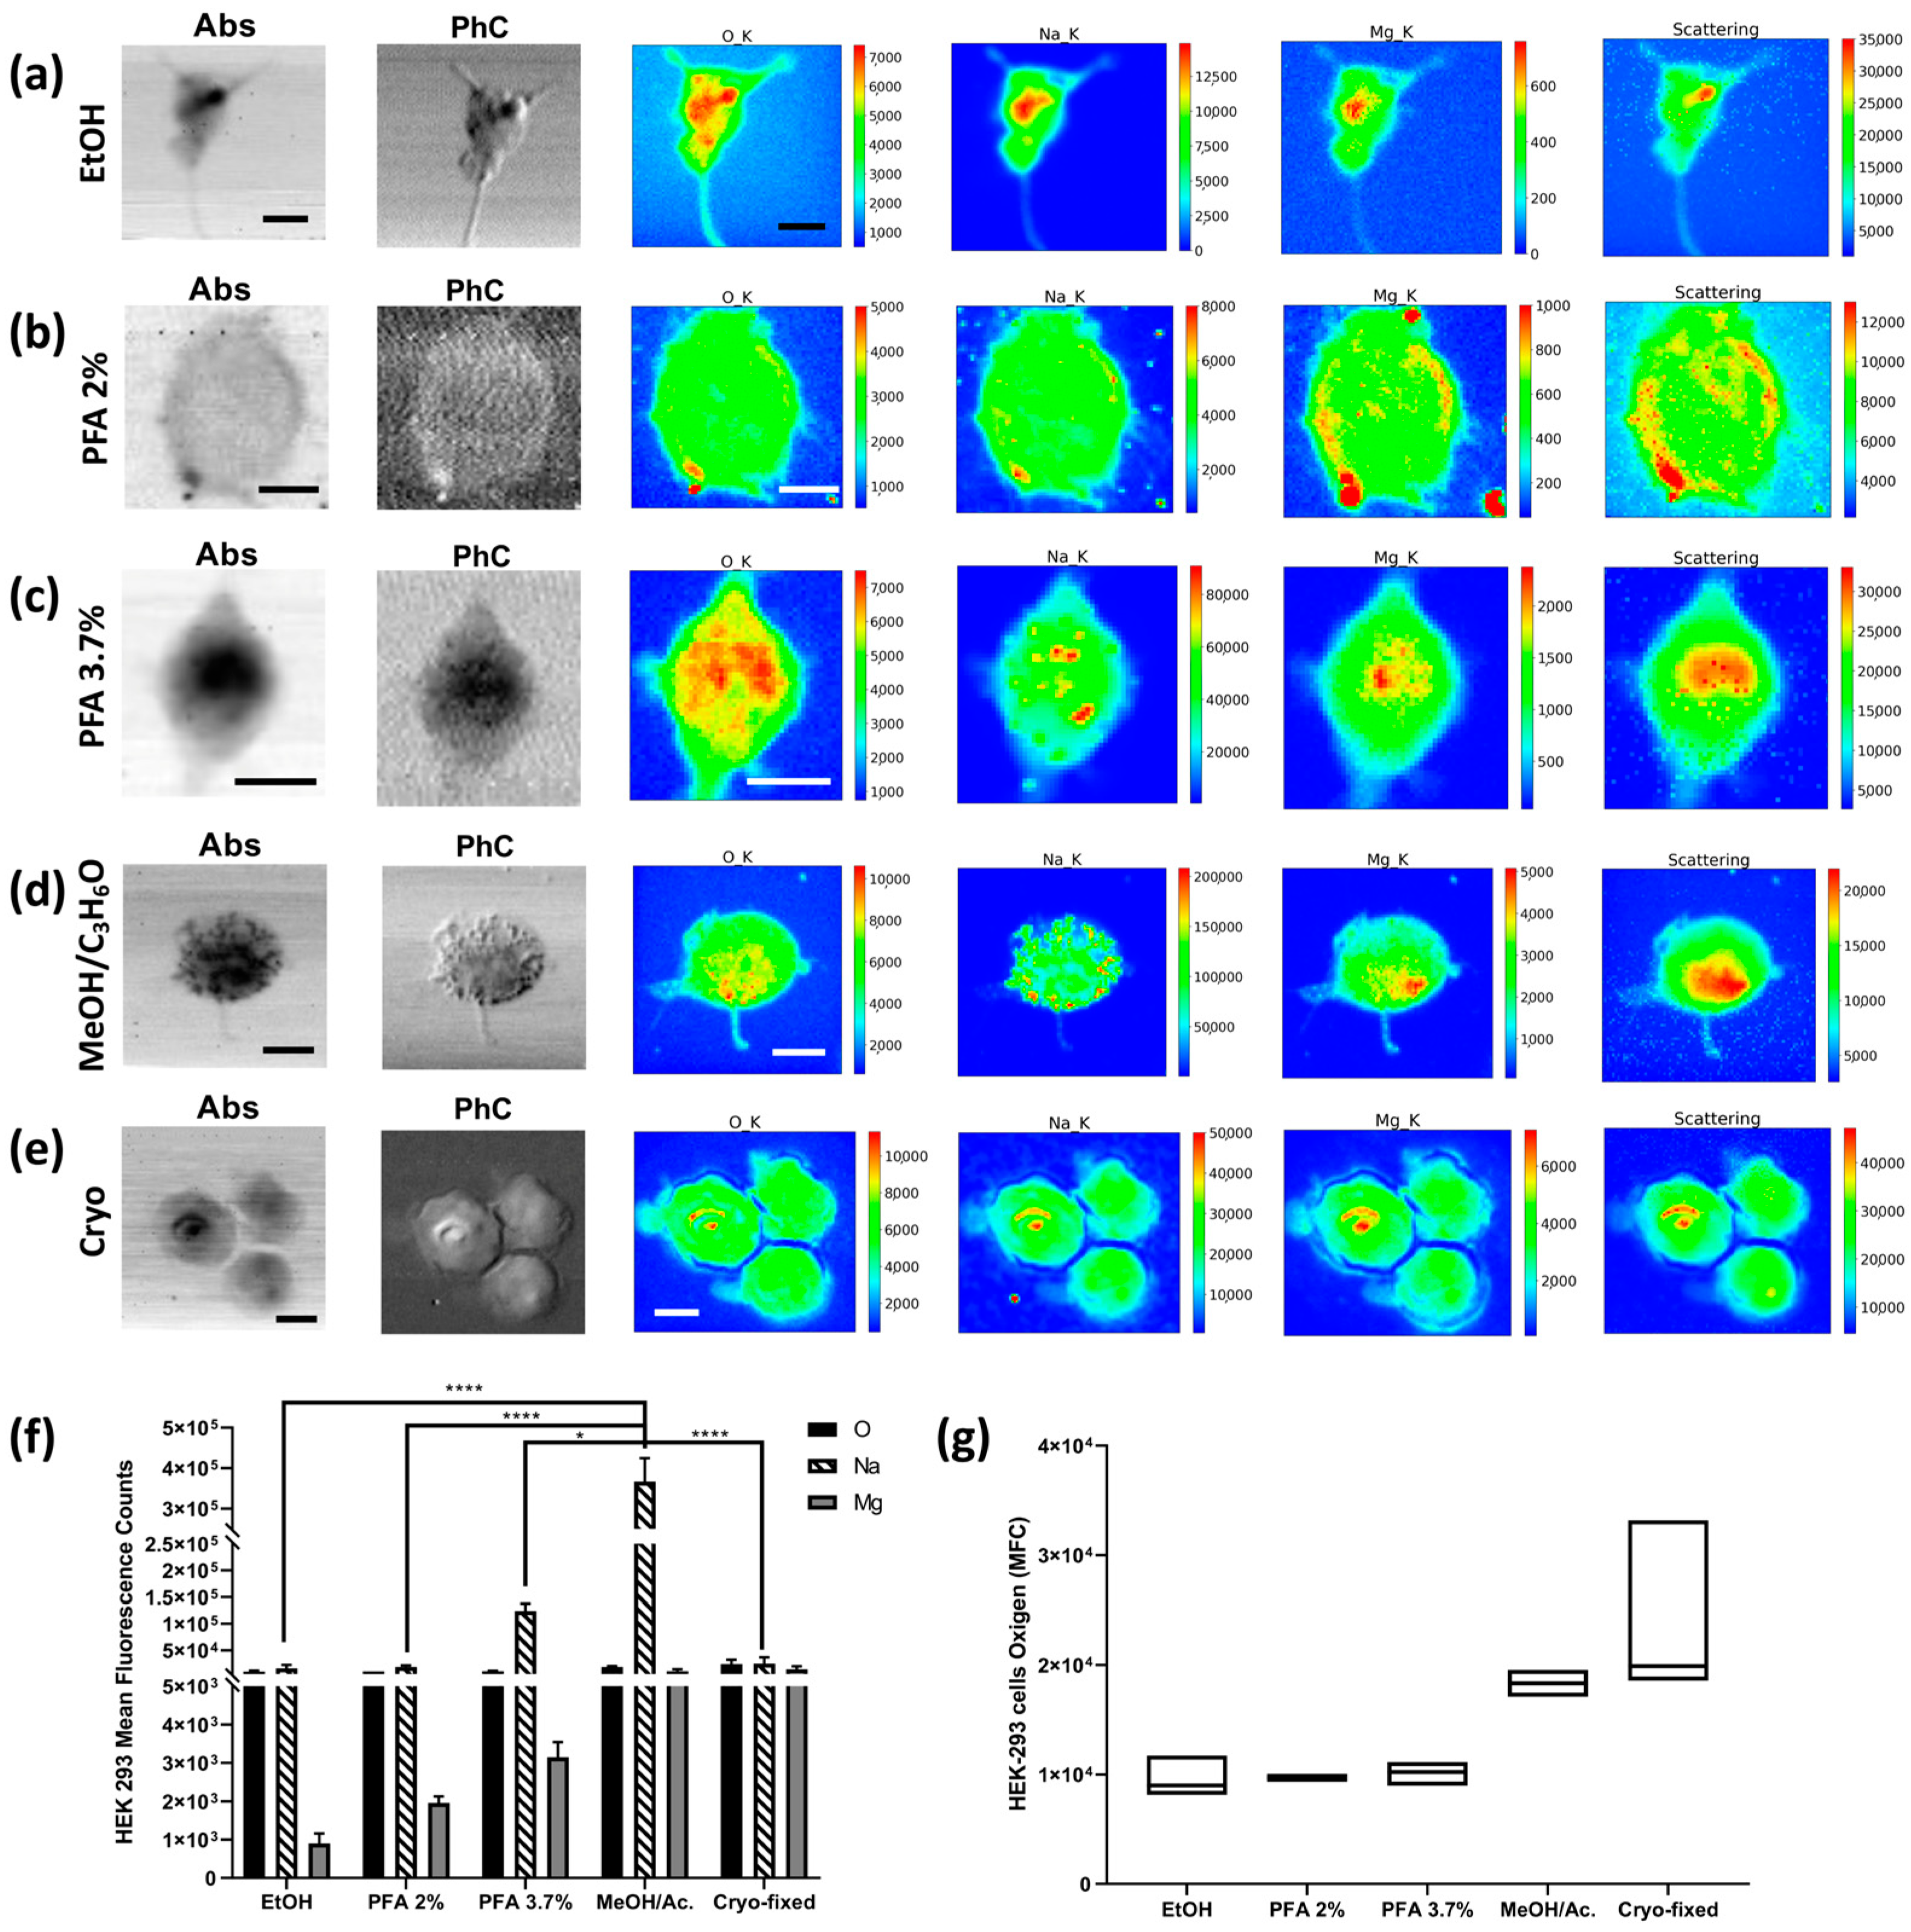
2.3.1. XRFM Analysis
2.3.2. AFM
3. Discussion
4. Materials and Methods
4.1. Cellular Models
4.1.1. HEC-1-A Endometrial Cells
- Paraformaldehyde (PFA) 3.7% in phosphate buffer saline (PBS) for 20 min at room temperature
- PFA 2% for 2 min at room temperature
- 70% ice-cold ethanol for 3 min at −20 °C
4.1.2. Spermatozoa
- PFA 3.7% for 20 min at room temperature
- PFA 2% for 2 min at room temperature
- 70% ice-cold ethanol for 3 min at −20 °C
4.1.3. HEK-293 Cell Line
- PFA 3.7% for 20 min at room temperature
- PFA 2% for 2 min at room temperature
- 70% ice-cold ethanol for 3 min at −20 °C
- 1:1 MeOH/C3H6O for 3 min at −20 °C
- 5.
- Cryofixation: cells were washed with ammonium acetate buffer solution 100 mM pH 7.4 prepared with high purity water (Fisher Scientific™ Accu100 Ultrapure Water System), the excess washing buffer was removed, and then Si3N4 membranes were rinsed in ethane (−160 °C) by using a home-made machine; cells were subsequently freeze-dried by leaving the specimens overnight in a controlled pressure system, allowing the ice to sublimate and slowly reach atmospheric pressure and temperature.
4.2. AFM Microscopy
4.3. XRF Microscopy
4.4. Statistical Analysis
Supplementary Materials
Author Contributions
Funding
Institutional Review Board Statement
Informed Consent Statement
Data Availability Statement
Acknowledgments
Conflicts of Interest
Sample Availability
References
- Vogt, S. Applications of Synchrotron Radiation: Micro Beams in Cell Micro Biology and Medicine. Phys. Today 2008, 61, 53–54. [Google Scholar] [CrossRef]
- Merolle, L.; Ragazzi, M.; Gianoncelli, A.; Altissimo, M.; Ciarrocchi, A.; Bedolla, D.E.; Marraccini, C.; Baricchi, R.; Pertinhez, T.A. Mapping Fundamental Life Elements in Papillary Thyroid Carcinoma Tissue. J. Inst. 2018, 13, C05018. [Google Scholar] [CrossRef]
- Poitry-Yamate, C.; Gianoncelli, A.; Kaulich, B.; Kourousias, G.; Magill, A.W.; Lepore, M.; Gajdosik, V.; Gruetter, R. Feasibility of Direct Mapping of Cerebral Fluorodeoxy-D-Glucose Metabolism in Situ at Subcellular Resolution Using Soft X-ray Fluorescence. J. Neurosci. Res. 2013, 91, 1050–1058. [Google Scholar] [CrossRef]
- Paunesku, T.; Vogt, S.; Maser, J.; Lai, B.; Woloschak, G. X-ray Fluorescence Microprobe Imaging in Biology and Medicine. J. Cell. Biochem. 2006, 99, 1489–1502. [Google Scholar] [CrossRef] [PubMed]
- Paunesku, T.; Wanzer, M.B.; Kirillova, E.N.; Muksinova, K.N.; Revina, V.S.; Romanov, S.A.; Lyubchansky, E.R.; Grosche, B.; Birschwilks, M.; Vogt, S.; et al. X-ray Fluorescence Microscopy for Investigation of Archival Tissues. Health Phys 2012, 103, 181–186. [Google Scholar] [CrossRef] [PubMed]
- Merolle, L.; Sponder, G.; Sargenti, A.; Mastrototaro, L.; Cappadone, C.; Farruggia, G.; Procopio, A.; Malucelli, E.; Parisse, P.; Gianoncelli, A.; et al. Overexpression of the Mitochondrial Mg Channel MRS2 Increases Total Cellular Mg Concentration and Influences Sensitivity to Apoptosis. Metallomics 2018, 10, 917–928. [Google Scholar] [CrossRef] [PubMed]
- Malucelli, E.; Procopio, A.; Fratini, M.; Gianoncelli, A.; Notargiacomo, A.; Merolle, L.; Sargenti, A.; Castiglioni, S.; Cappadone, C.; Farruggia, G.; et al. Single Cell versus Large Population Analysis: Cell Variability in Elemental Intracellular Concentration and Distribution. Anal. Bioanal. Chem. 2018, 410, 337–348. [Google Scholar] [CrossRef]
- Zeb, Q.; Wang, C.; Shafiq, S.; Liu, L. Chapter 6—An Overview of Single-Cell Isolation Techniques. In Single-Cell Omics; Barh, D., Azevedo, V., Eds.; Academic Press: Cambridge, MA, USA, 2019; pp. 101–135. ISBN 978-0-12-814919-5. [Google Scholar]
- Weinhardt, V.; Chen, J.-H.; Ekman, A.; McDermott, G.; Le Gros, M.A.; Larabell, C. Imaging Cell Morphology and Physiology Using X-rays. Biochem Soc Trans 2019, 47, 489–508. [Google Scholar] [CrossRef]
- Marguí, E.; Queralt, I.; Van Grieken, R. Sample Preparation for X-ray Fluorescence Analysis. In Encyclopedia of Analytical Chemistry; John Wiley & Sons: Hoboken, NJ, USA, 2016; pp. 1–25. ISBN 978-0-470-02731-8. [Google Scholar]
- Histotechnology: A Self-Instructional Text 5th Edition. Available online: https://store.ascp.org/productlisting/productdetail?productId=97915824 (accessed on 23 June 2022).
- Hobro, A.J.; Smith, N.I. An Evaluation of Fixation Methods: Spatial and Compositional Cellular Changes Observed by Raman Imaging. Vib. Spectrosc. 2017, 91, 31–45. [Google Scholar] [CrossRef]
- Rodig, S.J. Fixing Attached Cells for Staining. Cold Spring Harb. Protoc. 2020, 2020, 099689. [Google Scholar] [CrossRef]
- Amporndanai, K. Biological Specimens Preparation for X-ray Microscopy. 2014. Available online: https://www.desy.de/f/students/2014/reports/amporndanai_kangsa.pdf (accessed on 27 October 2022).
- Perrin, L.; Carmona, A.; Roudeau, S.; Ortega, R. Evaluation of Sample Preparation Methods for Single Cell Quantitative Elemental Imaging Using Proton or Synchrotron Radiation Focused Beams. J. Anal. At. Spectrom. 2015, 30, 2525–2532. [Google Scholar] [CrossRef]
- Jin, Q.; Paunesku, T.; Lai, B.; Gleber, S.-C.; Chen, S.I.; Finney, L.; Vine, D.; Vogt, S.; Woloschak, G.; Jacobsen, C. Preserving Elemental Content in Adherent Mammalian Cells for Analysis by Synchrotron-Based x-Ray Fluorescence Microscopy. J. Microsc. 2017, 265, 81–93. [Google Scholar] [CrossRef]
- Osanna, A.; Jacobsen, C.; Kalinovsky, A.; Kirz, J.; Maser, J.; Wang, S. X-ray Microscopy: Preparations for Studies of Frozen Hydrated Specimens. Scanning Microsc. Suppl. 1996, 10, 349–356, discussion 356–358. [Google Scholar]
- Gianoncelli, A.; Vaccari, L.; Kourousias, G.; Cassese, D.; Bedolla, D.E.; Kenig, S.; Storici, P.; Lazzarino, M.; Kiskinova, M. Soft X-ray Microscopy Radiation Damage On Fixed Cells Investigated With Synchrotron Radiation FTIR Microscopy. Sci. Rep. 2015, 5, 10250. [Google Scholar] [CrossRef]
- Bedolla, D.E.; Mantuano, A.; Pickler, A.; Mota, C.L.; Braz, D.; Salata, C.; Almeida, C.E.; Birarda, G.; Vaccari, L.; Barroso, R.C.; et al. Effects of Soft X-ray Radiation Damage on Paraffin-Embedded Rat Tissues Supported on Ultralene: A Chemical Perspective. J. Synchrotron Radiat. 2018, 25, 848–856. [Google Scholar] [CrossRef]
- Surowka, A.D.; Gianoncelli, A.; Birarda, G.; Sala, S.; Cefarin, N.; Matruglio, A.; Szczerbowska-Boruchowska, M.; Ziomber-Lisiak, A.; Vaccari, L. Soft X-ray Induced Radiation Damage in Thin Freeze-Dried Brain Samples Studied by FTIR Microscopy. J. Synchrotron Radiat. 2020, 27, 1218–1226. [Google Scholar] [CrossRef] [PubMed]
- Zupin, L.; Pascolo, L.; Gianoncelli, A.; Gariani, G.; Luppi, S.; Giolo, E.; Ottaviani, G.; Crovella, S.; Ricci, G. Synchrotron Radiation Soft X-ray Microscopy and Low Energy X-ray Fluorescence to Reveal Elemental Changes in Spermatozoa Treated with Photobiomodulation Therapy. Anal. Methods 2020, 12, 3691–3696. [Google Scholar] [CrossRef]
- Pascolo, L.; Venturin, I.; Gianoncelli, A.; Bortul, R.; Zito, G.; Giolo, E.; Salomé, M.; Bedolla, D.E.; Altissimo, M.; Zweyer, M.; et al. Light Element Distribution in Fresh and Frozen–Thawed Human Ovarian Tissues: A Preliminary Study. Reprod. BioMed. Online 2018, 37, 153–162. [Google Scholar] [CrossRef] [PubMed]
- Gianoncelli, A.; Bonanni, V.; Gariani, G.; Guzzi, F.; Pascolo, L.; Borghes, R.; Billè, F.; Kourousias, G. Soft X-ray Microscopy Techniques for Medical and Biological Imaging at TwinMic—Elettra. Appl. Sci. 2021, 11, 7216. [Google Scholar] [CrossRef]
- Castillo-Michel, H.A.; Larue, C.; del Real, A.P.; Cotte, M.; Sarret, G. Practical review on the use of synchrotron based micro- and nano- X-ray fluorescence mapping and X-ray absorption spectroscopy to investigate the interactions between plants and engineered nanomaterials. Plant Physiol. Biochem. 2017, 110, 13–32. [Google Scholar] [CrossRef]
- Pushie, M.J.; Pickering, I.J.; Korbas, M.; Hackett, M.J.; George, G.N. Elemental and Chemically Specific X-ray Fluorescence Imaging of Biological Systems. Chem. Rev. 2014, 114, 8499–8541. [Google Scholar] [CrossRef] [PubMed]
- Matsuyama, S.; Shimura, M.; Fujii, M.; Maeshima, K.; Yumoto, H.; Mimura, H.; Sano, Y.; Yabashi, M.; Nishino, Y.; Tamasaku, K.; et al. Elemental mapping of frozen-hydrated cells with cryo-scanning X-ray fluorescence microscopy. X-ray Spectrom. 2010, 39, 260–266. [Google Scholar] [CrossRef]
- WHO|WHO Manual for the Standardized Investigation, Diagnosis and Management of the Infertile Male. Available online: https://www.who.int/reproductivehealth/publications/infertility/0521774748/en/ (accessed on 11 May 2020).
- Nečas, D.; Klapetek, P. Gwyddion: An Open-Source Software for SPM Data Analysis. Open Phys. 2012, 10, 181–188. [Google Scholar] [CrossRef]
- Gianoncelli, A.; Kourousias, G.; Merolle, L.; Altissimo, M.; Bianco, A. Current Status of the TwinMic Beamline at Elettra: A Soft X-ray Transmission and Emission Microscopy Station. J. Synchrotron Radiat. 2016, 23, 1526–1537. [Google Scholar] [CrossRef] [PubMed]
- Gianoncelli, A.; Morrison, G.R.; Kaulich, B.; Bacescu, D.; Kovac, J. Scanning Transmission X-ray Microscopy with a Configurable Detector. Appl. Phys. Lett. 2006, 89, 251117. [Google Scholar] [CrossRef]
- Gianoncelli, A.; Kaulich, B.; Alberti, R.; Klatka, T.; Longoni, A.; De Marco, A.; Marcello, A.; Kiskinova, M. Simultaneous Soft X-ray Transmission and Emission Microscopy. Nucl. Instrum. Methods Phys. Res. Sect. A Accel. Spectrometers Detect. Assoc. Equip. 2009, 608, 195–198. [Google Scholar] [CrossRef]
- Gianoncelli, A.; Kourousias, G.; Stolfa, A.; Kaulich, B. Recent Developments at the TwinMic Beamline at ELETTRA: An 8 SDD Detector Setup for Low Energy X-ray Fluorescence. J. Phys. Conf. Ser. 2013, 425, 182001. [Google Scholar] [CrossRef]
- Sole, A.; Papillon, E.; Cotte, M.; Walter, P.; Susini, J. A Multiplatform Code for the Analysis of Energy-Dispersive X-ray Fluorescence Spectra. Spectrochim. Acta Part B At. Spectrosc. 2007, 62, 63–68. [Google Scholar] [CrossRef]
- Kourousias, G.; Bedolla Orozco, D.E.; Bonanni, V.; Gariani, G.; Gianoncelli, A.; Iotti, S.; Kenig, S.; Malucelli, E.; Merolle, L.; Parisse, P.; et al. Manuscript Dataset Open and FAIR 2022; Elettra-Sincrotrone Trieste: Trieste, Italy, 2022. [Google Scholar] [CrossRef]


| Fixation Methods | Morphology Preservation | Artefacts | Elemental Content Preservation | Repeatability | Equipment Requirements |
|---|---|---|---|---|---|
| PFA 2% | Low | Yes | No | Low | Si3N4/SiC membrane |
| EtOH 70% | No | Low | No | High | Si3N4/SiC membrane |
| PFA 3.7% | Yes | No | Yes | High | Si3N4/SiC membrane |
| MeOH/C3H6O | No | Yes | No | High | Si3N4/SiC membrane |
| Cryofixation | Yes | No | Yes | Low | Si3N4/SiC membrane Vacuum pump Cryogen gas Liquid nitrogen |
Disclaimer/Publisher’s Note: The statements, opinions and data contained in all publications are solely those of the individual author(s) and contributor(s) and not of MDPI and/or the editor(s). MDPI and/or the editor(s) disclaim responsibility for any injury to people or property resulting from any ideas, methods, instructions or products referred to in the content. |
© 2023 by the authors. Licensee MDPI, Basel, Switzerland. This article is an open access article distributed under the terms and conditions of the Creative Commons Attribution (CC BY) license (https://creativecommons.org/licenses/by/4.0/).
Share and Cite
Merolle, L.; Pascolo, L.; Zupin, L.; Parisse, P.; Bonanni, V.; Gariani, G.; Kenig, S.; Bedolla, D.E.; Crovella, S.; Ricci, G.; et al. Impact of Sample Preparation Methods on Single-Cell X-ray Microscopy and Light Elemental Analysis Evaluated by Combined Low Energy X-ray Fluorescence, STXM and AFM. Molecules 2023, 28, 1992. https://doi.org/10.3390/molecules28041992
Merolle L, Pascolo L, Zupin L, Parisse P, Bonanni V, Gariani G, Kenig S, Bedolla DE, Crovella S, Ricci G, et al. Impact of Sample Preparation Methods on Single-Cell X-ray Microscopy and Light Elemental Analysis Evaluated by Combined Low Energy X-ray Fluorescence, STXM and AFM. Molecules. 2023; 28(4):1992. https://doi.org/10.3390/molecules28041992
Chicago/Turabian StyleMerolle, Lucia, Lorella Pascolo, Luisa Zupin, Pietro Parisse, Valentina Bonanni, Gianluca Gariani, Sasa Kenig, Diana E. Bedolla, Sergio Crovella, Giuseppe Ricci, and et al. 2023. "Impact of Sample Preparation Methods on Single-Cell X-ray Microscopy and Light Elemental Analysis Evaluated by Combined Low Energy X-ray Fluorescence, STXM and AFM" Molecules 28, no. 4: 1992. https://doi.org/10.3390/molecules28041992
APA StyleMerolle, L., Pascolo, L., Zupin, L., Parisse, P., Bonanni, V., Gariani, G., Kenig, S., Bedolla, D. E., Crovella, S., Ricci, G., Iotti, S., Malucelli, E., Kourousias, G., & Gianoncelli, A. (2023). Impact of Sample Preparation Methods on Single-Cell X-ray Microscopy and Light Elemental Analysis Evaluated by Combined Low Energy X-ray Fluorescence, STXM and AFM. Molecules, 28(4), 1992. https://doi.org/10.3390/molecules28041992