
Feature Selection for the Interpretation of Antioxidant Mechanisms in Plant Phenolics


Abstract
1. Introduction

| Dataset | Task | Size | Target Chemicals |
|---|---|---|---|
| ORAC | Regression | 70 | Peroxyl radicals |
| SOAC | Regression | 71 | Singlet oxygen |
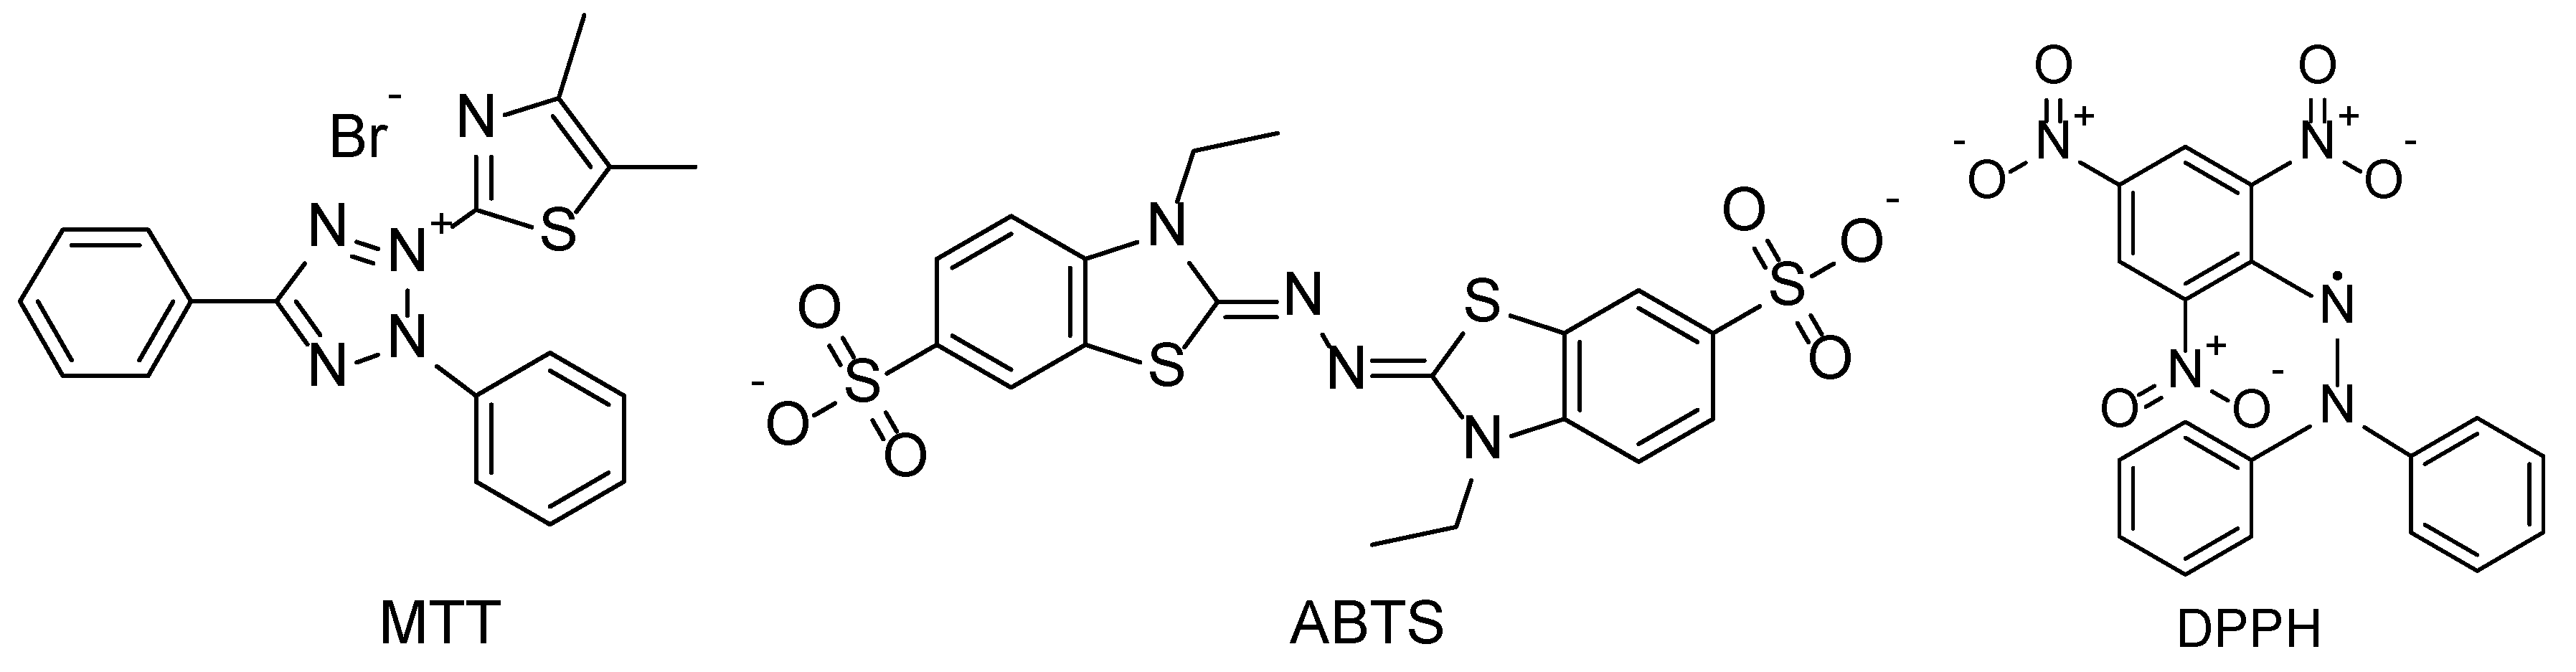
| MTT | Regression | 71 | MTT |
| ABTS | Regression | 90 | ABTS radical cation |
| DPPH | Classification | 198 | DPPH radical |
| Phytochemicals [26] | 344 | ||
| MEXT [27] | 109 |
2. Results and Discussion
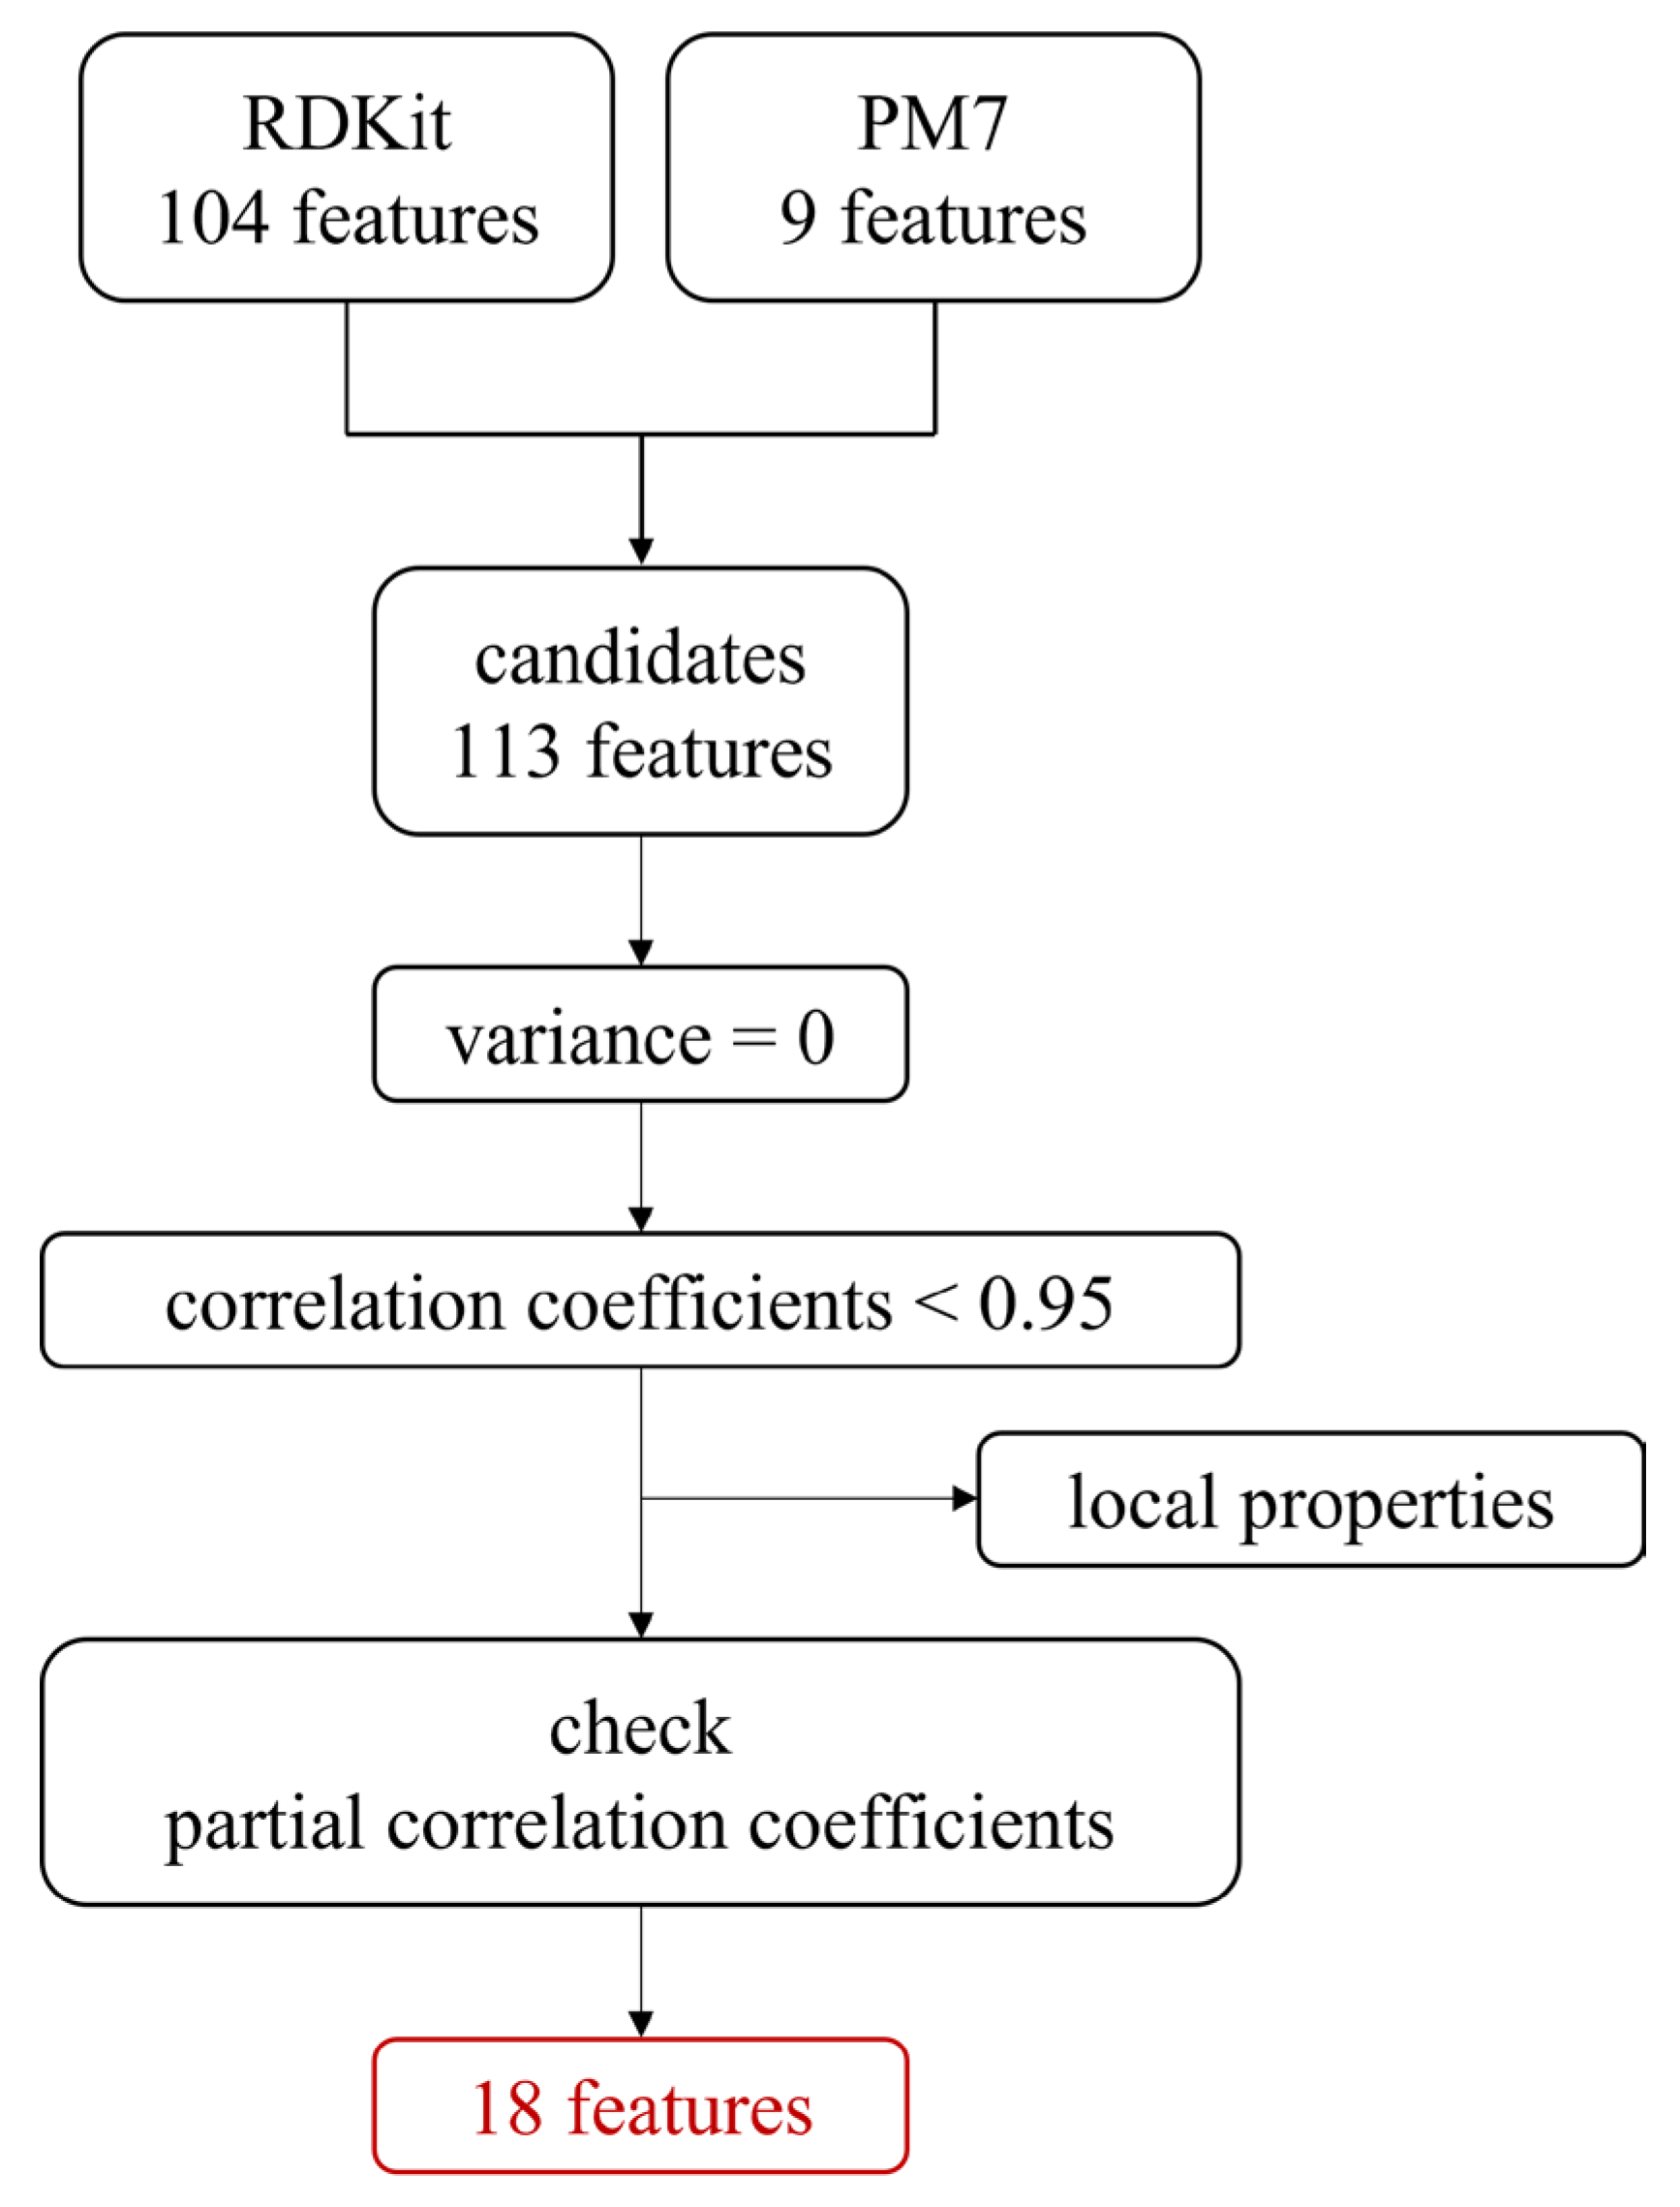
2.1. Feature Selection
2.2. Supervised Learning Using XGBoost
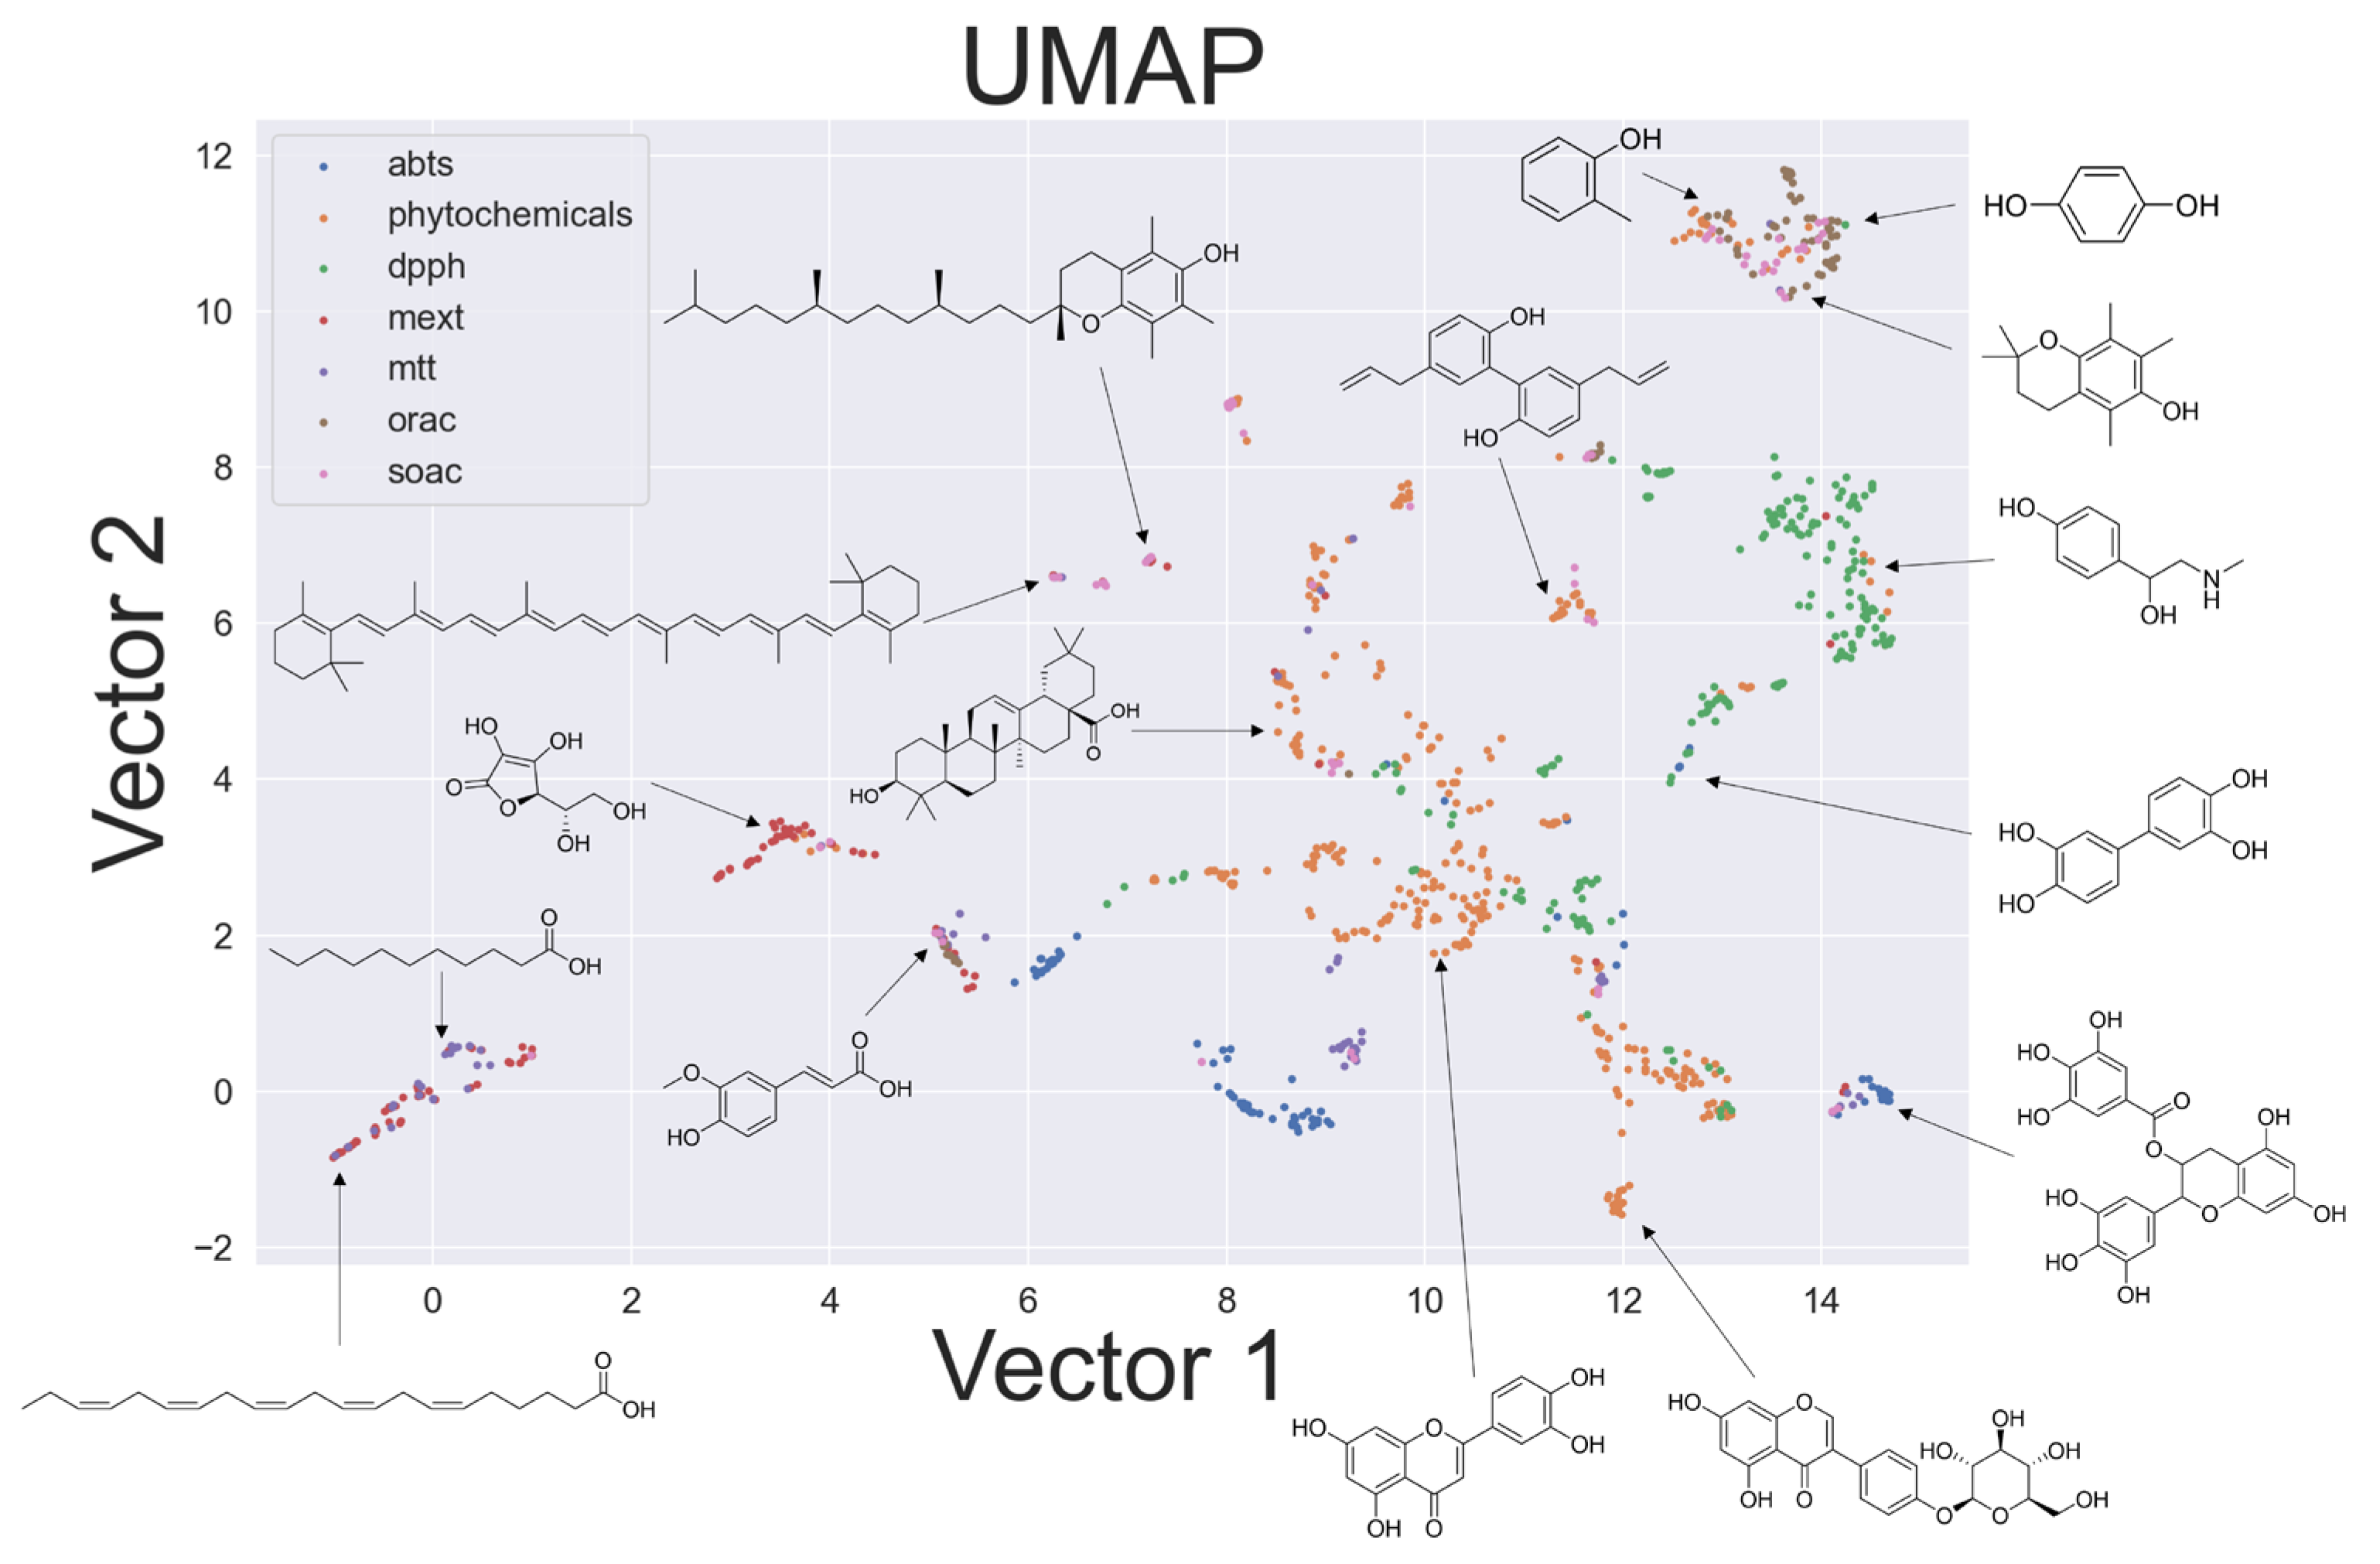
2.3. Chemical Space in Uniform Manifold Approximation and Projection (UMAP)
3. Materials and Methods
3.1. Data Collection
3.2. Feature Selection
3.3. Supervised Learning
3.4. Dimension Reduction
4. Conclusions
Supplementary Materials
Author Contributions
Funding
Institutional Review Board Statement
Informed Consent Statement
Data Availability Statement
Conflicts of Interest
References
- Dai, J.; Mumper, R.J. Molecules Plant Phenolics: Extraction, Analysis and Their Antioxidant and Anticancer Properties. Molecules 2010, 15, 7313–7352. [Google Scholar] [CrossRef] [PubMed]
- Ames, B.N.; Shigenaga, M.K.; Hagen, T.M. Oxidants, Antioxidants, and the Degenerative Diseases of Aging. Proc. Natl. Acad. Sci. USA 1993, 90, 7915–7922. [Google Scholar] [CrossRef] [PubMed]
- Sakurai, S.; Kikuchi, A.; Gotoh, H. Hydrophilic Oxygen Radical Absorbance Capacity Values of Low-Molecular-Weight Phenolic Compounds Containing Carbon, Hydrogen, and Oxygen. RSC Adv. 2022, 12, 4094–4100. [Google Scholar] [CrossRef] [PubMed]
- Fujimoto, T.; Gotoh, H. Prediction and Chemical Interpretation of Singlet-Oxygen-Scavenging Activity of Small Molecule Compounds by Using Machine Learning. Antioxidants 2021, 10, 1751. [Google Scholar] [CrossRef]
- Dudonné, S.; Vitrac, X.; Coutière, P.; Woillez, M.; Mérillon, J.-M. Comparative Study of Antioxidant Properties and Total Phenolic Content of 30 Plant Extracts of Industrial Interest Using DPPH, ABTS, FRAP, SOD, and ORAC Assays. J. Agric. Food Chem. 2009, 57, 1768–1774. [Google Scholar] [CrossRef]
- Baum, Z.J.; Yu, X.; Ayala, P.Y.; Zhao, Y.; Watkins, S.P.; Zhou, Q. Artificial Intelligence in Chemistry: Current Trends and Future Directions. J. Chem. Inf. Model 2021, 61, 3197–3212. [Google Scholar] [CrossRef]
- RDkit. Available online: https://www.rdkit.org/ (accessed on 6 December 2022).
- Asahara, R.; Miyao, T. Extended Connectivity Fingerprints as a Chemical Reaction Representation for Enantioselective Organophosphorus-Catalyzed Asymmetric Reaction Prediction. ACS Omega 2022, 7, 26952–26964. [Google Scholar] [CrossRef]
- Rogers, D.; Hahn, M. Extended-Connectivity Fingerprints. J. Chem. Inf. Model 2010, 50, 742–754. [Google Scholar] [CrossRef]
- Gütlein, M.; Kramer, S. Filtered Circular Fingerprints Improve Either Prediction or Runtime Performance While Retaining Interpretability. J. Cheminform. 2016, 8, 60. [Google Scholar] [CrossRef]
- Urbanowicz, R.J.; Meeker, M.; la Cava, W.; Olson, R.S.; Moore, J.H. Relief-Based Feature Selection: Introduction and Review. J. Biomed. Inform. 2018, 85, 189–203. [Google Scholar] [CrossRef]
- Lu, A.; Yuan, S.; Xiao, H.; Yang, D.; Ai, Z.; Li, Q.-Y.; Zhao, Y.; Chen, Z.; Wu, X. QSAR Study of Phenolic Compounds and Their Anti-DPPH Radical Activity by Discriminant Analysis. Sci. Rep. 2022, 12, 7860. [Google Scholar] [CrossRef] [PubMed]
- Bayer, S.; Mayer, A.I.; Borgonovo, G.; Morini, G.; di Pizio, A.; Bassoli, A. Chemoinformatics View on Bitter Taste Receptor Agonists in Food. J. Agric. Food Chem. 2021, 69, 13916–13924. [Google Scholar] [CrossRef] [PubMed]
- Cihan Sorkun, M.; Mullaj, D.; Koelman, J.M.V.A.; Er, S. ChemPlot, a Python Library for Chemical Space Visualization. Chem.–Methods 2022, 2, e202200005. [Google Scholar] [CrossRef]
- Stumpfe, D.; Hu, H.; Bajorath, J. Evolving Concept of Activity Cliffs. ACS Omega 2019, 4, 14360–14368. [Google Scholar] [CrossRef] [PubMed]
- Litwinienko, G.; Ingold, K.U. Solvent Effects on the Rates and Mechanisms of Reaction of Phenols with Free Radicals. Acc. Chem. Res. 2007, 40, 222–230. [Google Scholar] [CrossRef]
- Galian, R.E.; Litwinienko, G.; Pérez-Prieto, J.; Ingold, K.U. Kinetic Solvent Effects on the Reaction of an Aromatic Ketone π,Π* Triplet with Phenol. Rate-Retarding and Rate-Accelerating Effects of Hydrogen-Bond Acceptor Solvents. J. Am. Chem. Soc. 2007, 129, 9280–9281. [Google Scholar] [CrossRef]
- Litwinienko, G.; Ingold, K.U. Abnormal Solvent Effects on Hydrogen Atom Abstraction. 2. Resolution of the Curcumin Antioxidant Controversy. The Role of Sequential Proton Loss Electron Transfer. J. Org. Chem. 2004, 69, 5888–5896. [Google Scholar] [CrossRef]
- Schmidt, R. Deactivation of O 2 (1 Δ g) Singlet Oxygen by Carotenoids: Internal Conversion of Excited Encounter Complexes. J. Phys. Chem. A 2004, 108, 5509–5513. [Google Scholar] [CrossRef]
- Liu, Y.; Nair, M.G. An Efficient and Economical MTT Assay for Determining the Antioxidant Activity of Plant Natural Product Extracts and Pure Compounds. J. Nat. Prod. 2010, 73, 1193–1195. [Google Scholar] [CrossRef]
- Cai, Y.-Z.; Sun, M.; Xing, J.; Luo, Q.; Corke, H. Structure–Radical Scavenging Activity Relationships of Phenolic Compounds from Traditional Chinese Medicinal Plants. Life Sci. 2006, 78, 2872–2888. [Google Scholar] [CrossRef]
- Özyürek, M.; Güçlü, K.; Apak, R. The main and modified CUPRAC methods of antioxidant measurement. TrAC Trends Anal. Chem. 2011, 30, 652–664. [Google Scholar] [CrossRef]
- Benzie, I.; Strain, J. The ferric reducing ability of plasma (FRAP) as a measure of “Antioxidant Power”: The Frap assay. Anal. Biochem. 1996, 239, 70–76. [Google Scholar] [CrossRef] [PubMed]
- Robak, J.; Gryglewski, R.J. Flavonoids are scavengers of superoxide anions. Biochem. Pharmacol. 1988, 37, 837–841. [Google Scholar] [CrossRef]
- Ohkawa, H.; Ohishi, N.K.; Yagi, K. Assay for lipid peroxides in animal tissues by thiobarbituric acid reaction. Anal. Biochem. 1979, 95, 351–358. [Google Scholar] [CrossRef] [PubMed]
- Phytochemicals. Tokyo Chemical Industry Co., Ltd. (JP). Available online: https://www.tcichemicals.com/JP/en/c/11115 (accessed on 3 November 2022).
- Mext: Standard Tables of Food Composition in Japan. 2015. (Seventh Revised Version). Available online: https://www.mext.go.jp/en/policy/science_technology/policy/title01/detail01/1374030.htm (accessed on 3 November 2022).
- Home—EvalML 0.63.0 Documentation. Available online: https://evalml.alteryx.com/en/stable/index.html (accessed on 6 December 2022).
- Chen, T.; Guestrin, C. XGBoost: A Scalable Tree Boosting System. In Proceedings of the 22nd ACM SIGKDD International Conference on Knowledge Discovery and Data Mining, San Francisco, CA, USA, 13–17 August 2016; ACM: New York, NY, USA, 2016; pp. 785–794. [Google Scholar] [CrossRef]
- Schweitzer, C.; Schmidt, R. Physical Mechanisms of Generation and Deactivation of Singlet Oxygen. Chem. Rev. 2003, 103, 1685–1758. [Google Scholar] [CrossRef]
- Zhan, C.-G.; Nichols, J.A.; Dixon, D.A. Ionization Potential, Electron Affinity, Electronegativity, Hardness, and Electron Excitation Energy: Molecular Properties from Density Functional Theory Orbital Energies. J. Phys. Chem. A 2003, 107, 4184–4195. [Google Scholar] [CrossRef]
- McInnes, L.; Healy, J.; Melville, J. UMAP: Uniform Manifold Approximation and Projection for Dimension Reduction. J. Open Source Softw. 2018, 3, 861. [Google Scholar] [CrossRef]
- Stewart, J.J.P. Optimization of Parameters for Semiempirical Methods VI: More Modifications to the NDDO Approximations and Re-Optimization of Parameters. J. Mol. Model 2013, 19, 1–32. [Google Scholar] [CrossRef]
- De Souza, G.L.C.; Peterson, K.A. Benchmarking Antioxidant-Related Properties for Gallic Acid through the Use of DFT, MP2, CCSD, and CCSD(T) Approaches. J. Phys. Chem. A 2021, 125, 198–208. [Google Scholar] [CrossRef]
- Nakata, M.; Shimazaki, T.; Hashimoto, M.; Maeda, T. PubChemQC PM6: Data Sets of 221 Million Molecules with Optimized Molecular Geometries and Electronic Properties. J. Chem. Inf. Model 2020, 60, 5891–5899. [Google Scholar] [CrossRef]
- Cao, G.; Alessio, H.M.; Cutler, R.G. Oxygen-Radical Absorbance Capacity Assay for Antioxidants. Free Radic. Biol. Med. 1993, 14, 303–311. [Google Scholar] [CrossRef] [PubMed]
- Ou, B.; Hampsch-Woodill, M.; Prior, R.L. Development and Validation of an Improved Oxygen Radical Absorbance Capacity Assay Using Fluorescein as the Fluorescent Probe. J. Agric. Food Chem. 2001, 49, 4619–4626. [Google Scholar] [CrossRef] [PubMed]
- Ouchi, A.; Aizawa, K.; Iwasaki, Y.; Inakuma, T.; Terao, J.; Nagaoka, S.I.; Mukai, K. Kinetic Study of the Quenching Reaction of Singlet Oxygen by Carotenoids and Food Extracts in Solution. Development of a Singlet Oxygen Absorption Capacity (SOAC) Assay Method. J. Agric. Food Chem. 2010, 58, 9967–9978. [Google Scholar] [CrossRef] [PubMed]
- Re, R.; Pellegrini, N.; Proteggente, A.; Pannala, A.; Yang, M.; Rice-Evans, C. Antioxidant Activity Applying an Improved ABTS Radical Cation Decolorization Assay. Free Radic. Biol. Med. 1999, 26, 1231–1237. [Google Scholar] [CrossRef] [PubMed]
- Brand-Williams, W.; Cuvelier, M.E.; Berset, C. Use of a Free Radical Method to Evaluate Antioxidant Activity. LWT-Food Sci. Technol. 1995, 28, 25–30. [Google Scholar] [CrossRef]
- Akiba, T.; Sano, S.; Yanase, T.; Ohta, T.; Koyama, M. Optuna: A Next-Generation Hyperparameter Optimization Framework. In Proceedings of the 25th ACM SIGKDD International Conference on Knowledge Discovery & Data Mining, Anchorage, AK, USA, 13–17 August 2016; ACM: New York, NY, USA, 2019; pp. 2623–2631. [Google Scholar] [CrossRef]
- Chen, C.H.; Tanaka, K.; Kotera, M.; Funatsu, K. Comparison and Improvement of the Predictability and Interpretability with Ensemble Learning Models in QSPR Applications. J. Cheminform. 2020, 12, 19. [Google Scholar] [CrossRef]


| Class | Number | Features | Explanation |
|---|---|---|---|
| Energy | 5 | ELUMO | Energy of LUMO |
| gap | HOMO–LUMO gap | ||
| BDE | Bond dissociation energy | ||
| IP | Ionization potential | ||
| PA | Proton affinity | ||
| Polarity | 5 | TPSA | Topological polar surface area estimated from bonding patterns |
| MolLogP | Octanol–water partition coefficients estimated from fragments | ||
| dipole moment | The dipole moment calculated with PM7 | ||
| MaxPartialCharge, MinPartialCharge | Maximum and minimum values of atomic charges in a molecule | ||
| Structure and bonds | 6 | FpDensityMorgan2 | Possible substructure variations |
| BertzCT | Molecular complexity caused by the kinds of atoms and the bond order | ||
| BalabanJ | Topological index based on the distance matrix of a molecule | ||
| HallKierAlpha | Sum of the relative covalent radius in a molecule | ||
| MaxEStateIndex, MinEStateIndex | Maximum and minimum values determined for each fragment | ||
| Steric properties | 2 | LabuteASA | Molecular surface area where solvents are accessible |
| FractionCSP3 | Ratio of sp3 carbons among the carbons in the molecule |
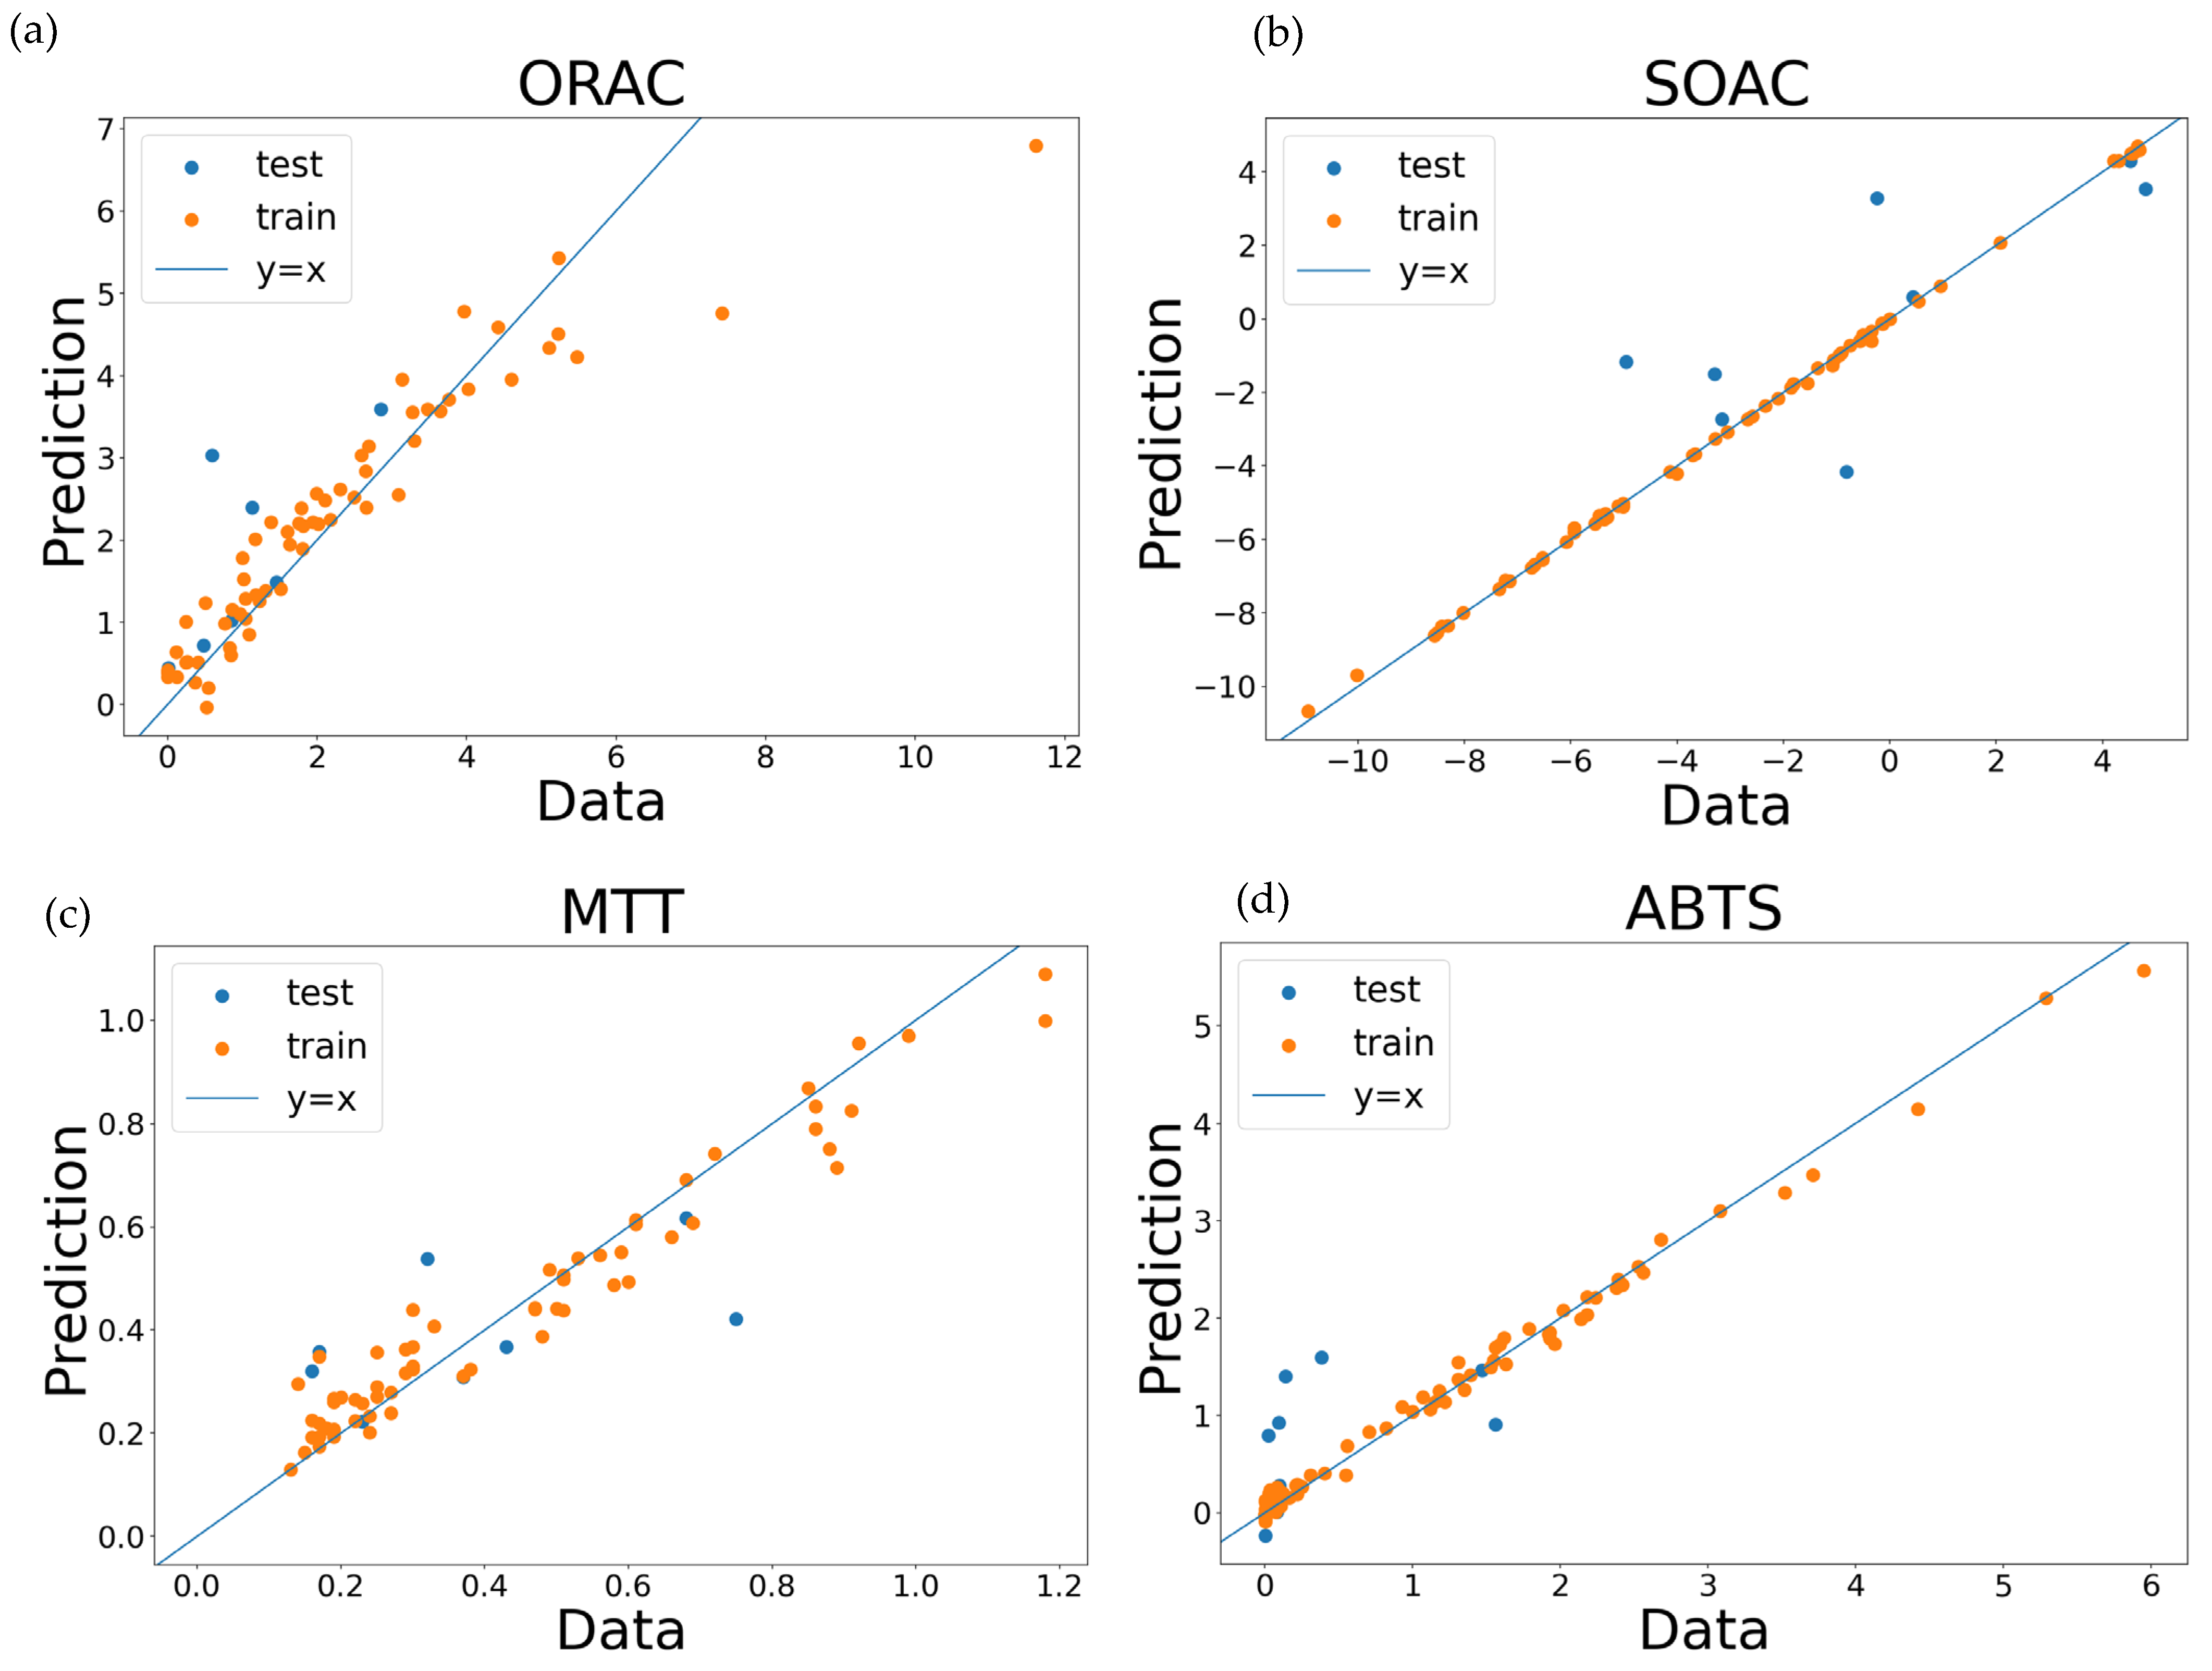
| Regression | ||||
| Dataset | MAE | RMSE | MAE/STD | Higher Importance |
| ORAC | 0.5314 | 0.7295 | 0.2724 | TPSA |
| SOAC | 1.4555 | 1.9020 | 0.3684 | IP |
| MTT | 0.8000 | 1.0420 | 0.5774 | BDE |
| ABTS | 0.1559 | 0.1939 | 0.6476 | HallKierAlpha |
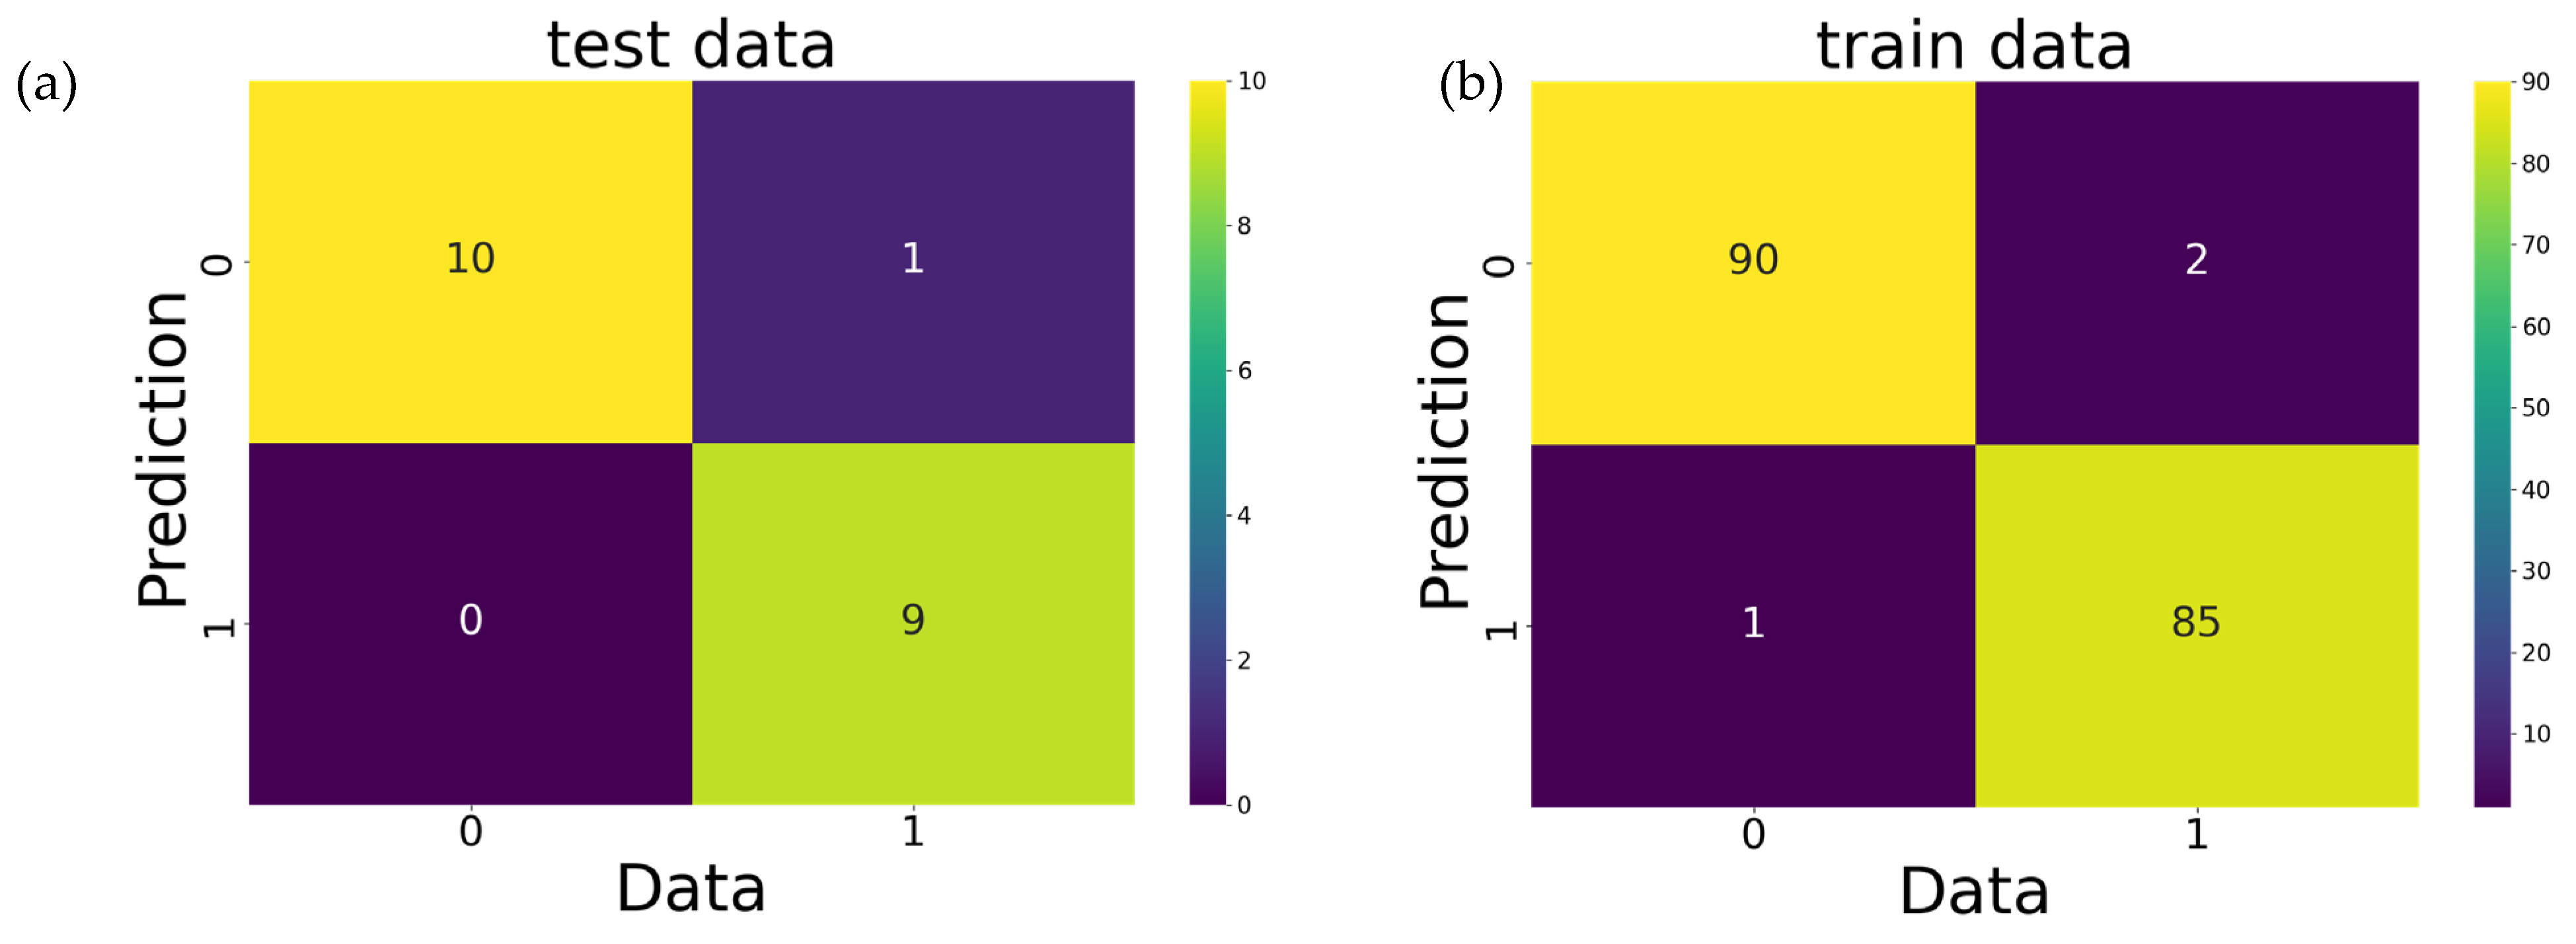
| Classification | ||||
| Dataset | Cross-entropy | Accuracy | Higher importance | |
| DPPH | 2.8783 | 0.9167 | TPSA, BalabanJ, gap | |
| Regression | ||||
| Task | Model | Input Features | MAE18 | MAElinear |
| ORAC | OLS | BDE, TPSA | 0.5314 * | 1.2720 |
| SOAC | OLS | IP | 1.4555 * | 2.0491 |
| MTT | OLS | IP | 0.1559 * | 0.2091 |
| ABTS | OLS | BDE, IP | 0.8000 | 0.6833 * |
| Classification | ||||
| Task | Model | Input features | Accuracy18 | Accuracylinear |
| DPPH | Logistic | Gap, IP, TPSA, BalabanJ | 0.9167 * | 0.9000 |
| Regression | |||
| Task | Number of Features | MAE18 | MAEcomplex |
| ORAC | 54 | 0.5314 * | 0.5900 |
| SOAC | 65 | 1.4555 * | 1.5684 |
| MTT | 61 | 0.1559 | 0.1544 * |
| ABTS | 62 | 0.8000 | 0.6157 * |
| Classification | |||
| Task | Number of features | Accuracy18 | Accuracycomplex |
| DPPH | 74 | 0.9167 | 0.9500 * |
Disclaimer/Publisher’s Note: The statements, opinions and data contained in all publications are solely those of the individual author(s) and contributor(s) and not of MDPI and/or the editor(s). MDPI and/or the editor(s) disclaim responsibility for any injury to people or property resulting from any ideas, methods, instructions or products referred to in the content. |
© 2023 by the authors. Licensee MDPI, Basel, Switzerland. This article is an open access article distributed under the terms and conditions of the Creative Commons Attribution (CC BY) license (https://creativecommons.org/licenses/by/4.0/).
Share and Cite
Fujimoto, T.; Gotoh, H. Feature Selection for the Interpretation of Antioxidant Mechanisms in Plant Phenolics. Molecules 2023, 28, 1454. https://doi.org/10.3390/molecules28031454
Fujimoto T, Gotoh H. Feature Selection for the Interpretation of Antioxidant Mechanisms in Plant Phenolics. Molecules. 2023; 28(3):1454. https://doi.org/10.3390/molecules28031454
Chicago/Turabian StyleFujimoto, Taiki, and Hiroaki Gotoh. 2023. "Feature Selection for the Interpretation of Antioxidant Mechanisms in Plant Phenolics" Molecules 28, no. 3: 1454. https://doi.org/10.3390/molecules28031454
APA StyleFujimoto, T., & Gotoh, H. (2023). Feature Selection for the Interpretation of Antioxidant Mechanisms in Plant Phenolics. Molecules, 28(3), 1454. https://doi.org/10.3390/molecules28031454