

Discovery, Validation, and Target Prediction of Antibacterial and Antidiabetic Components of Archidendron clypearia Based on a Combination of Multiple Analytical Methods
 ,
,
Abstract
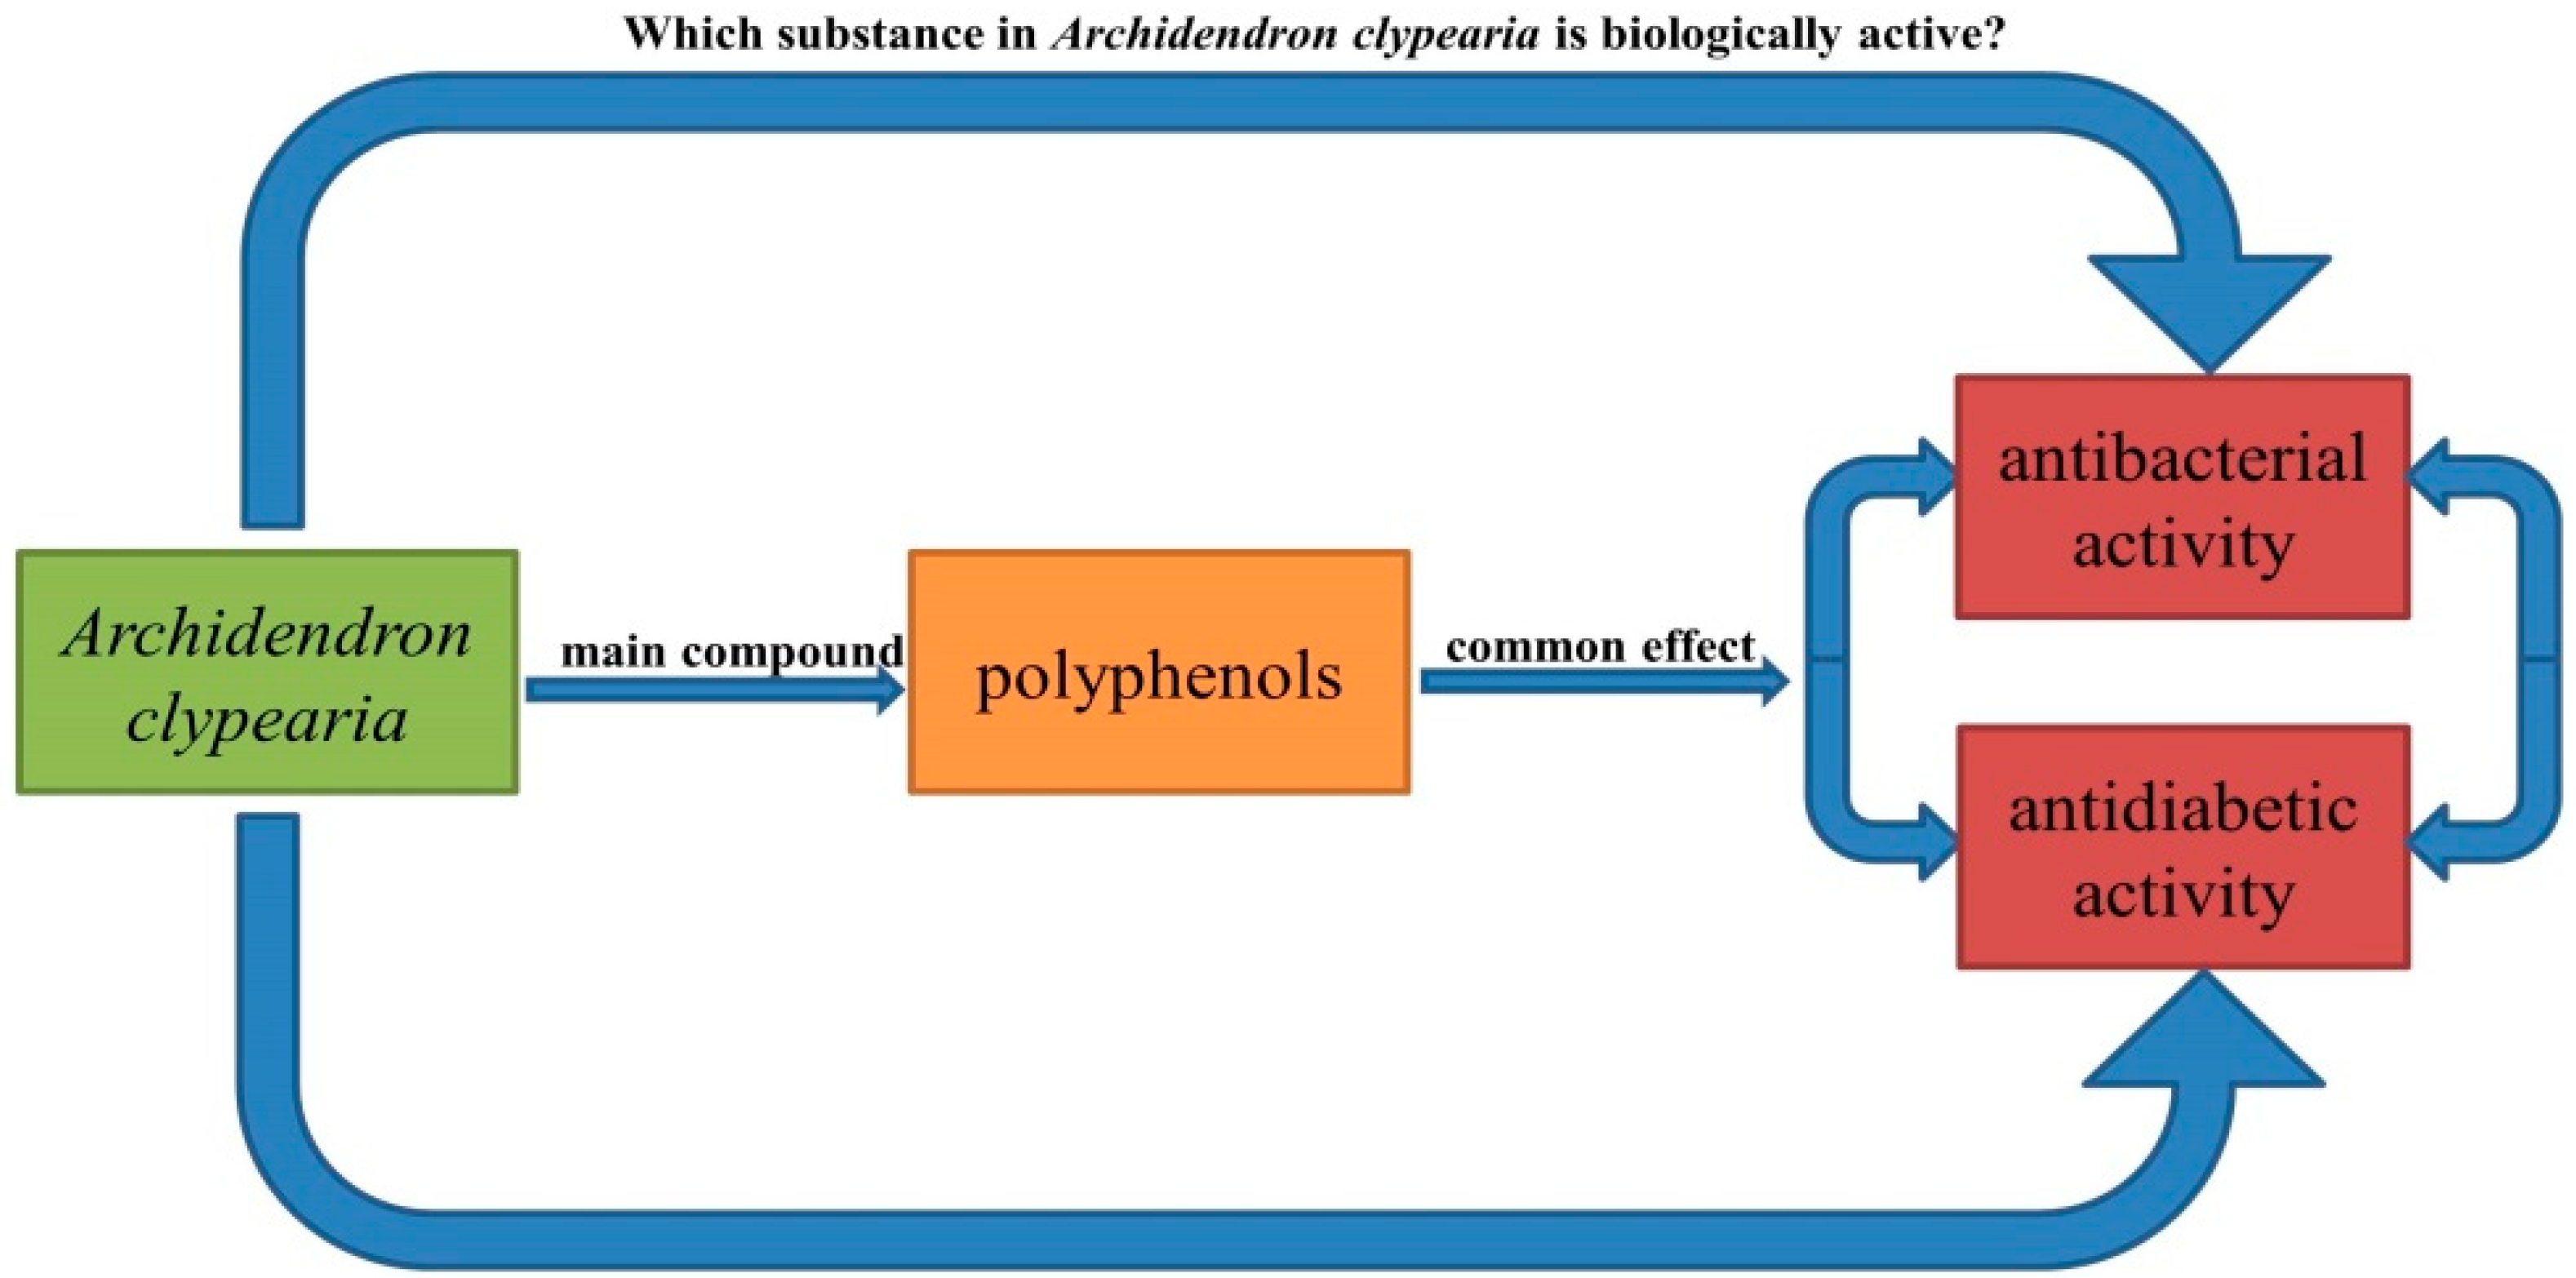
1. Introduction
2. Results and Discussion
2.1. Characterization of A. clypearia
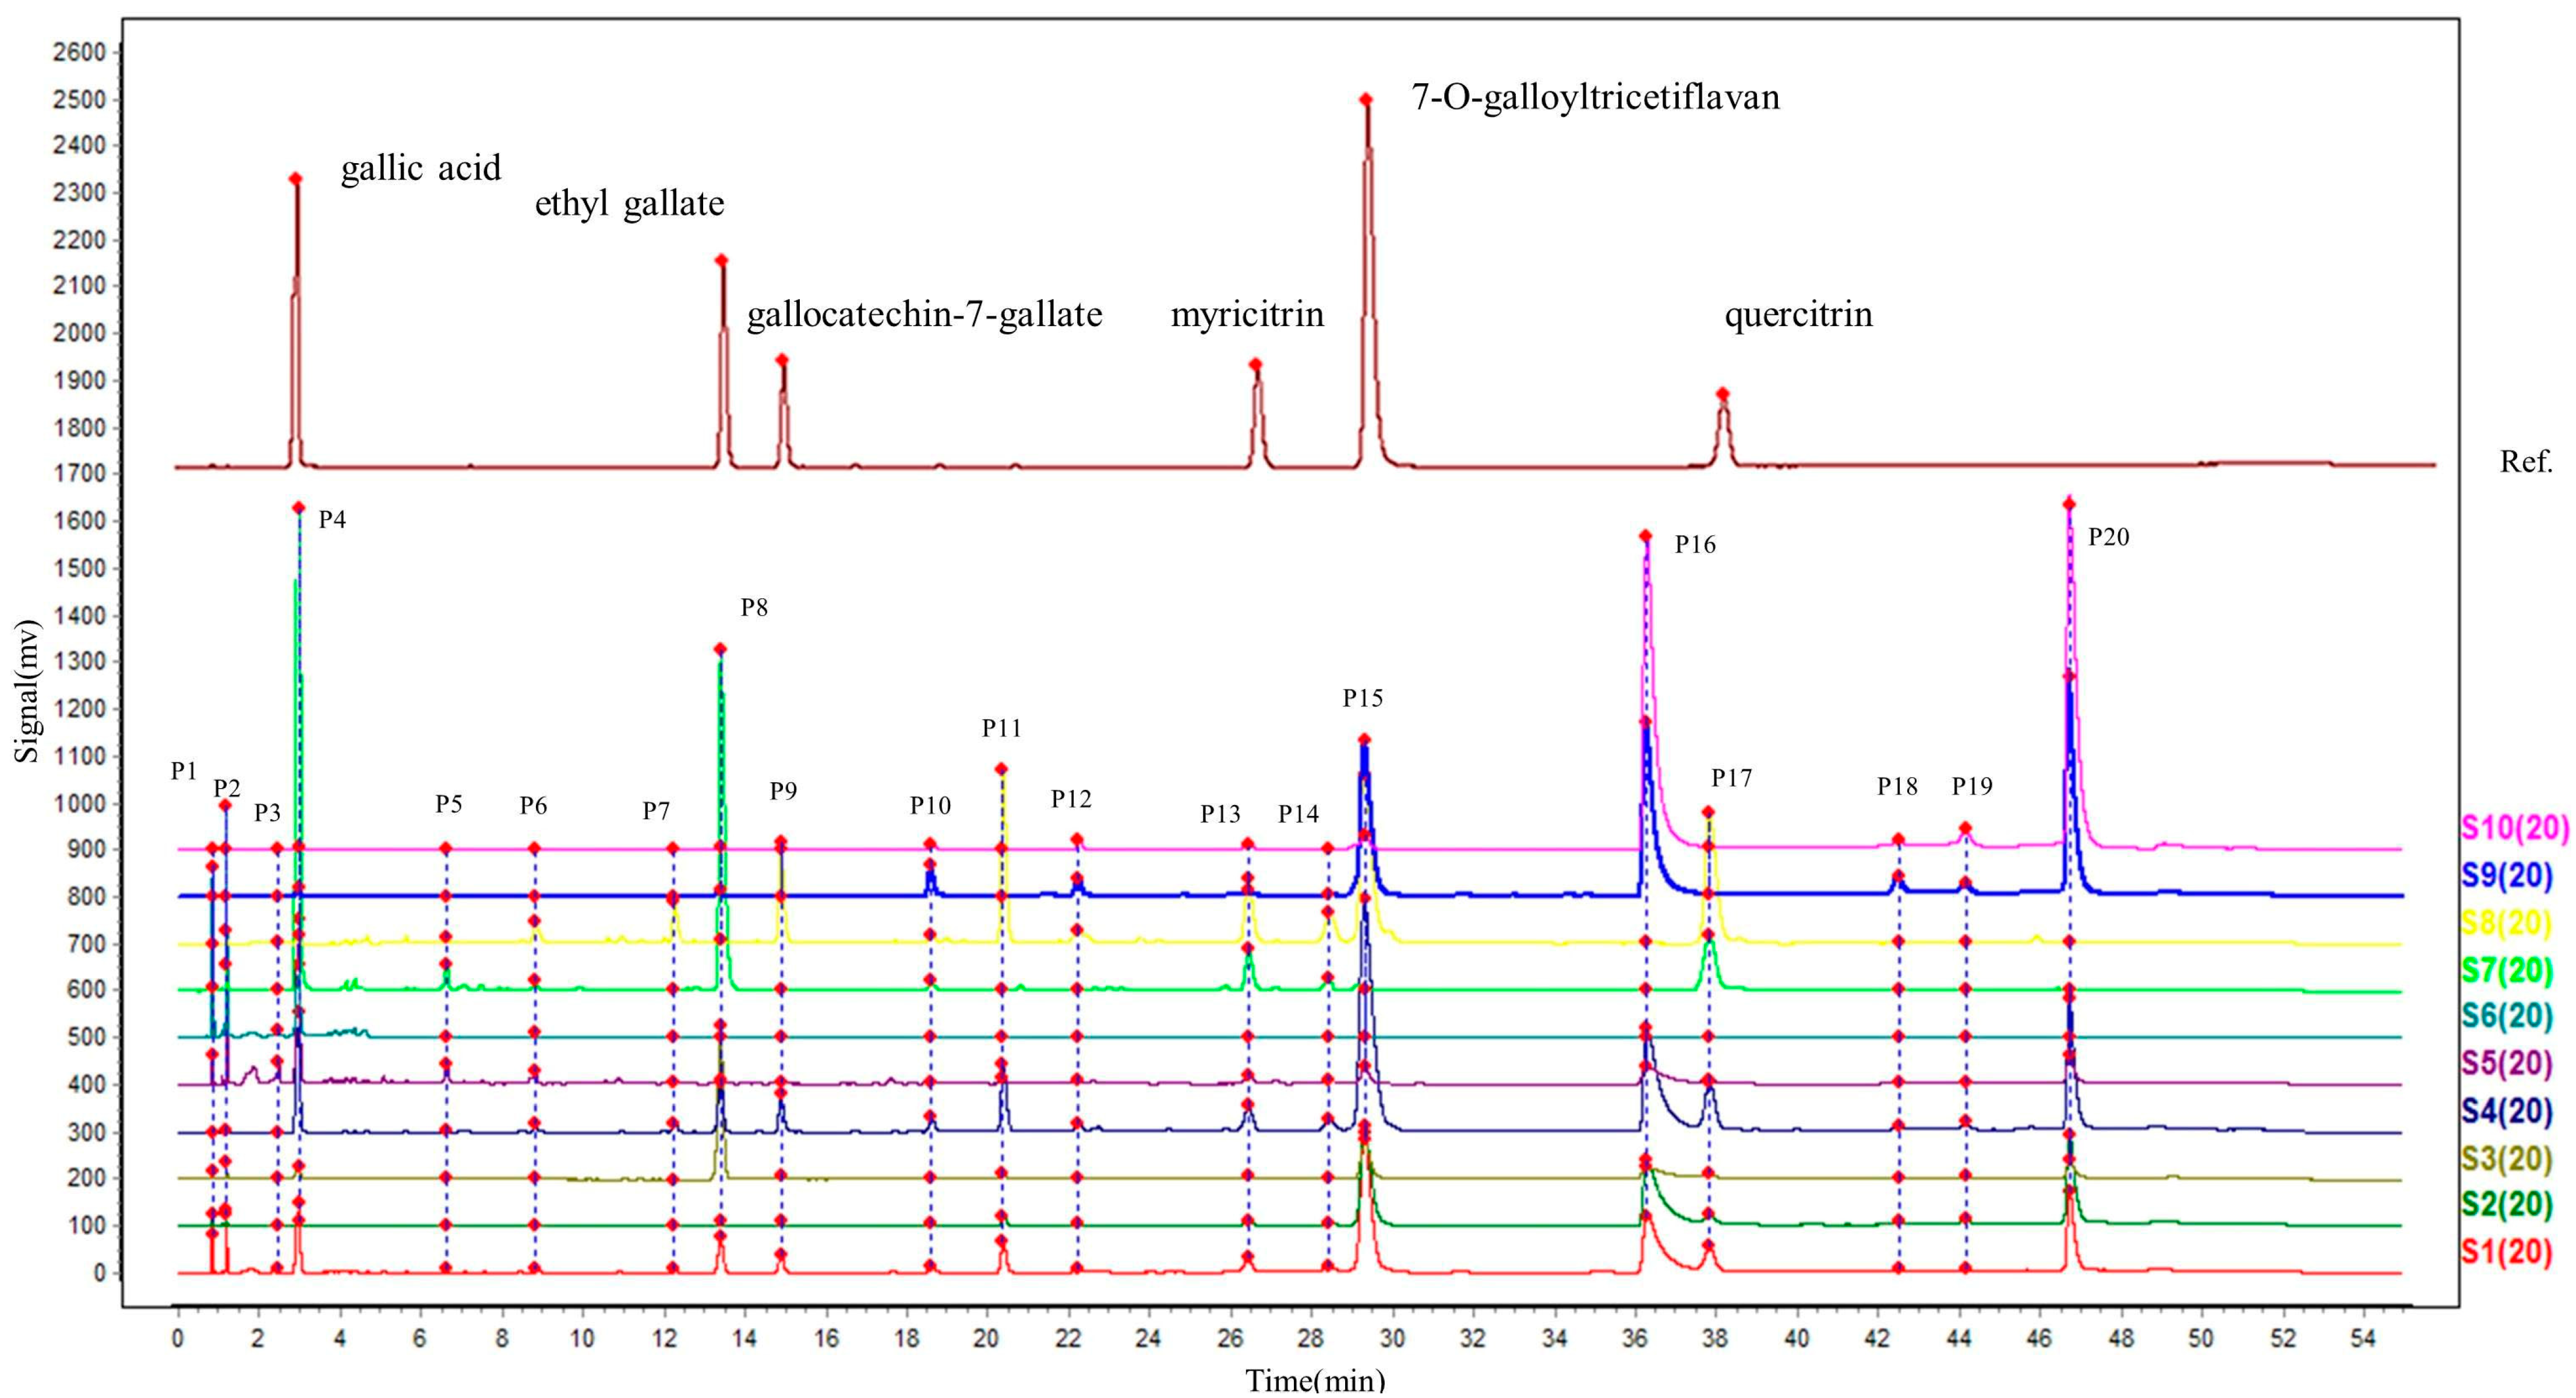
2.2. UPLC Chromatographic Analysis of Extracts
2.3. Antibacterial Activity of Extracts
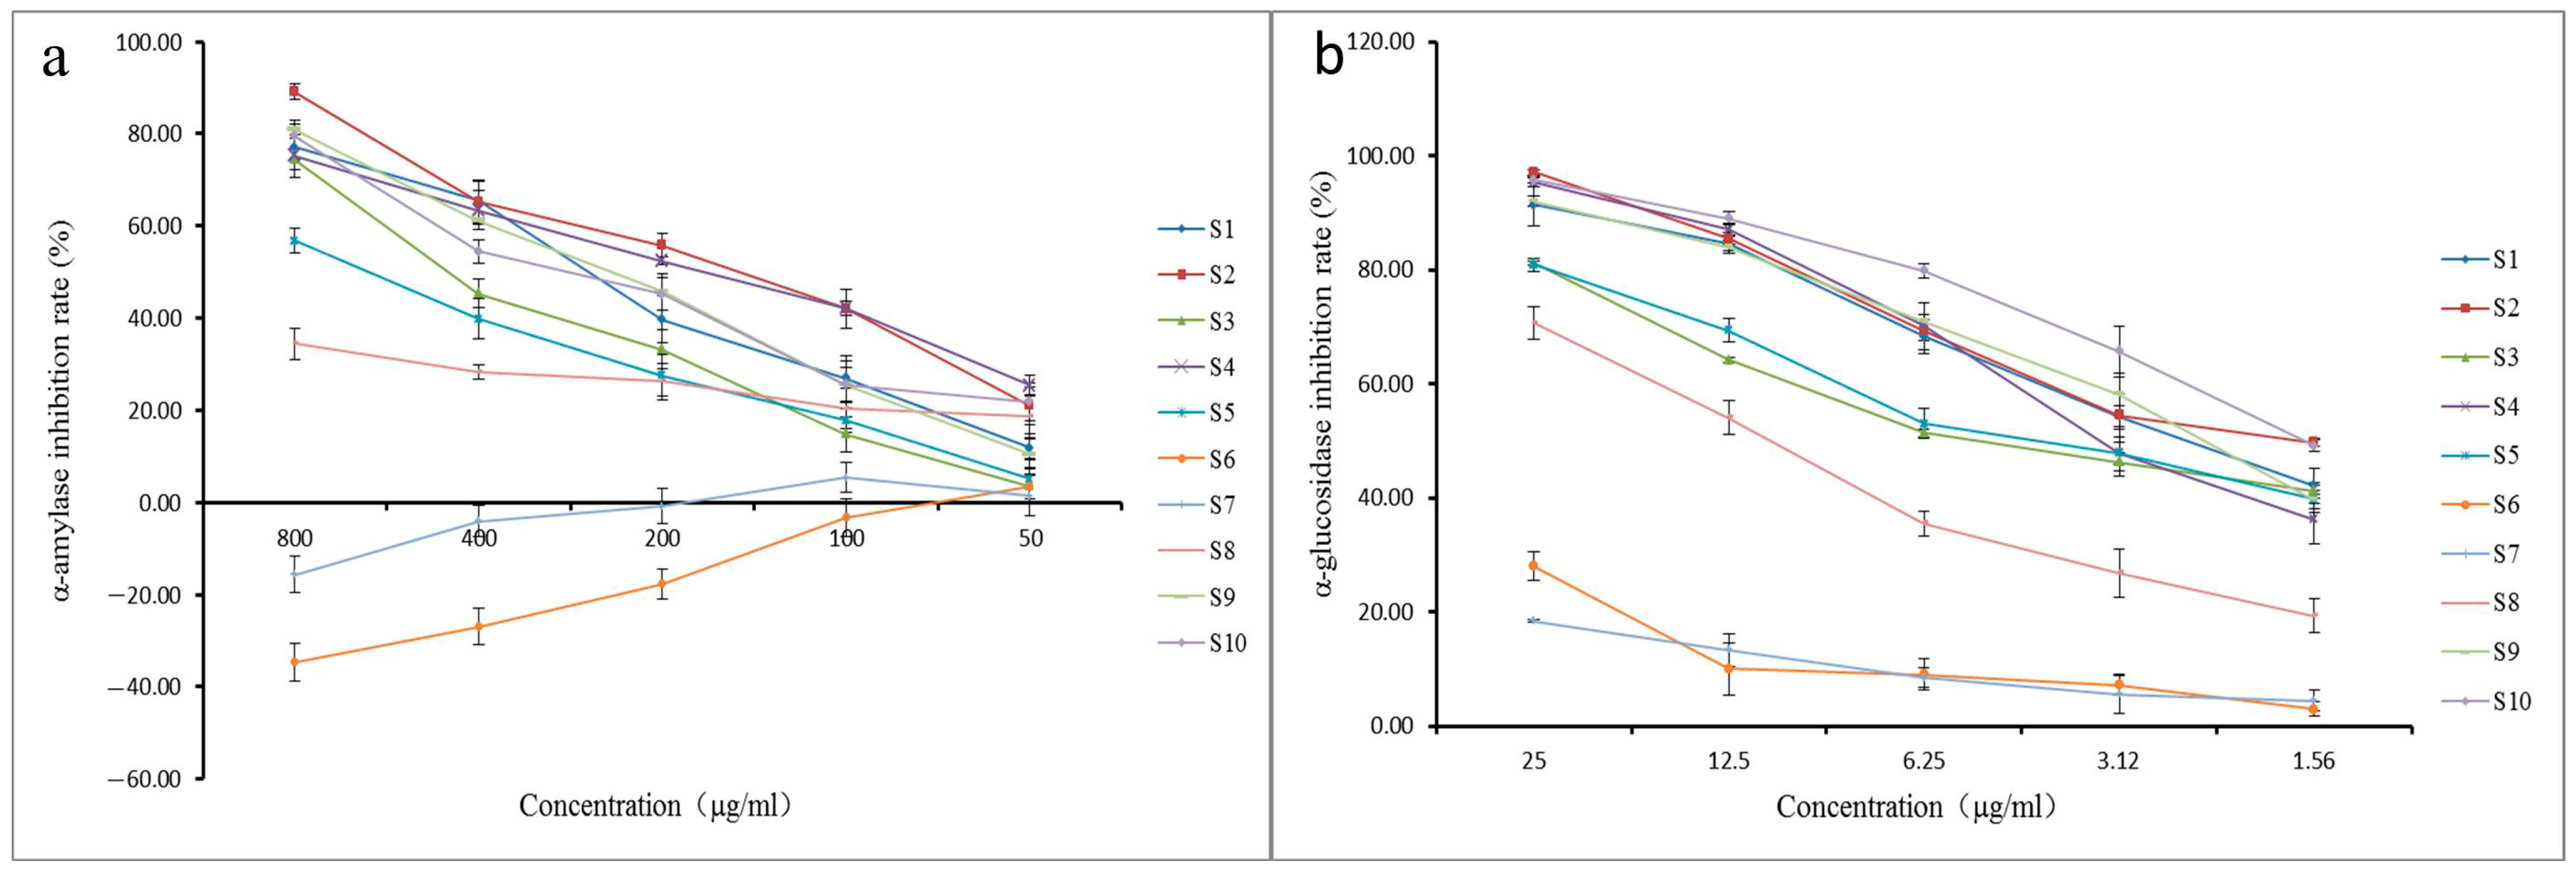
2.4. α-Glucosidase and α-Amylase Inhibition Assay
2.5. Spectrum–Effect Relationship Analysis Results
2.5.1. GRA Results
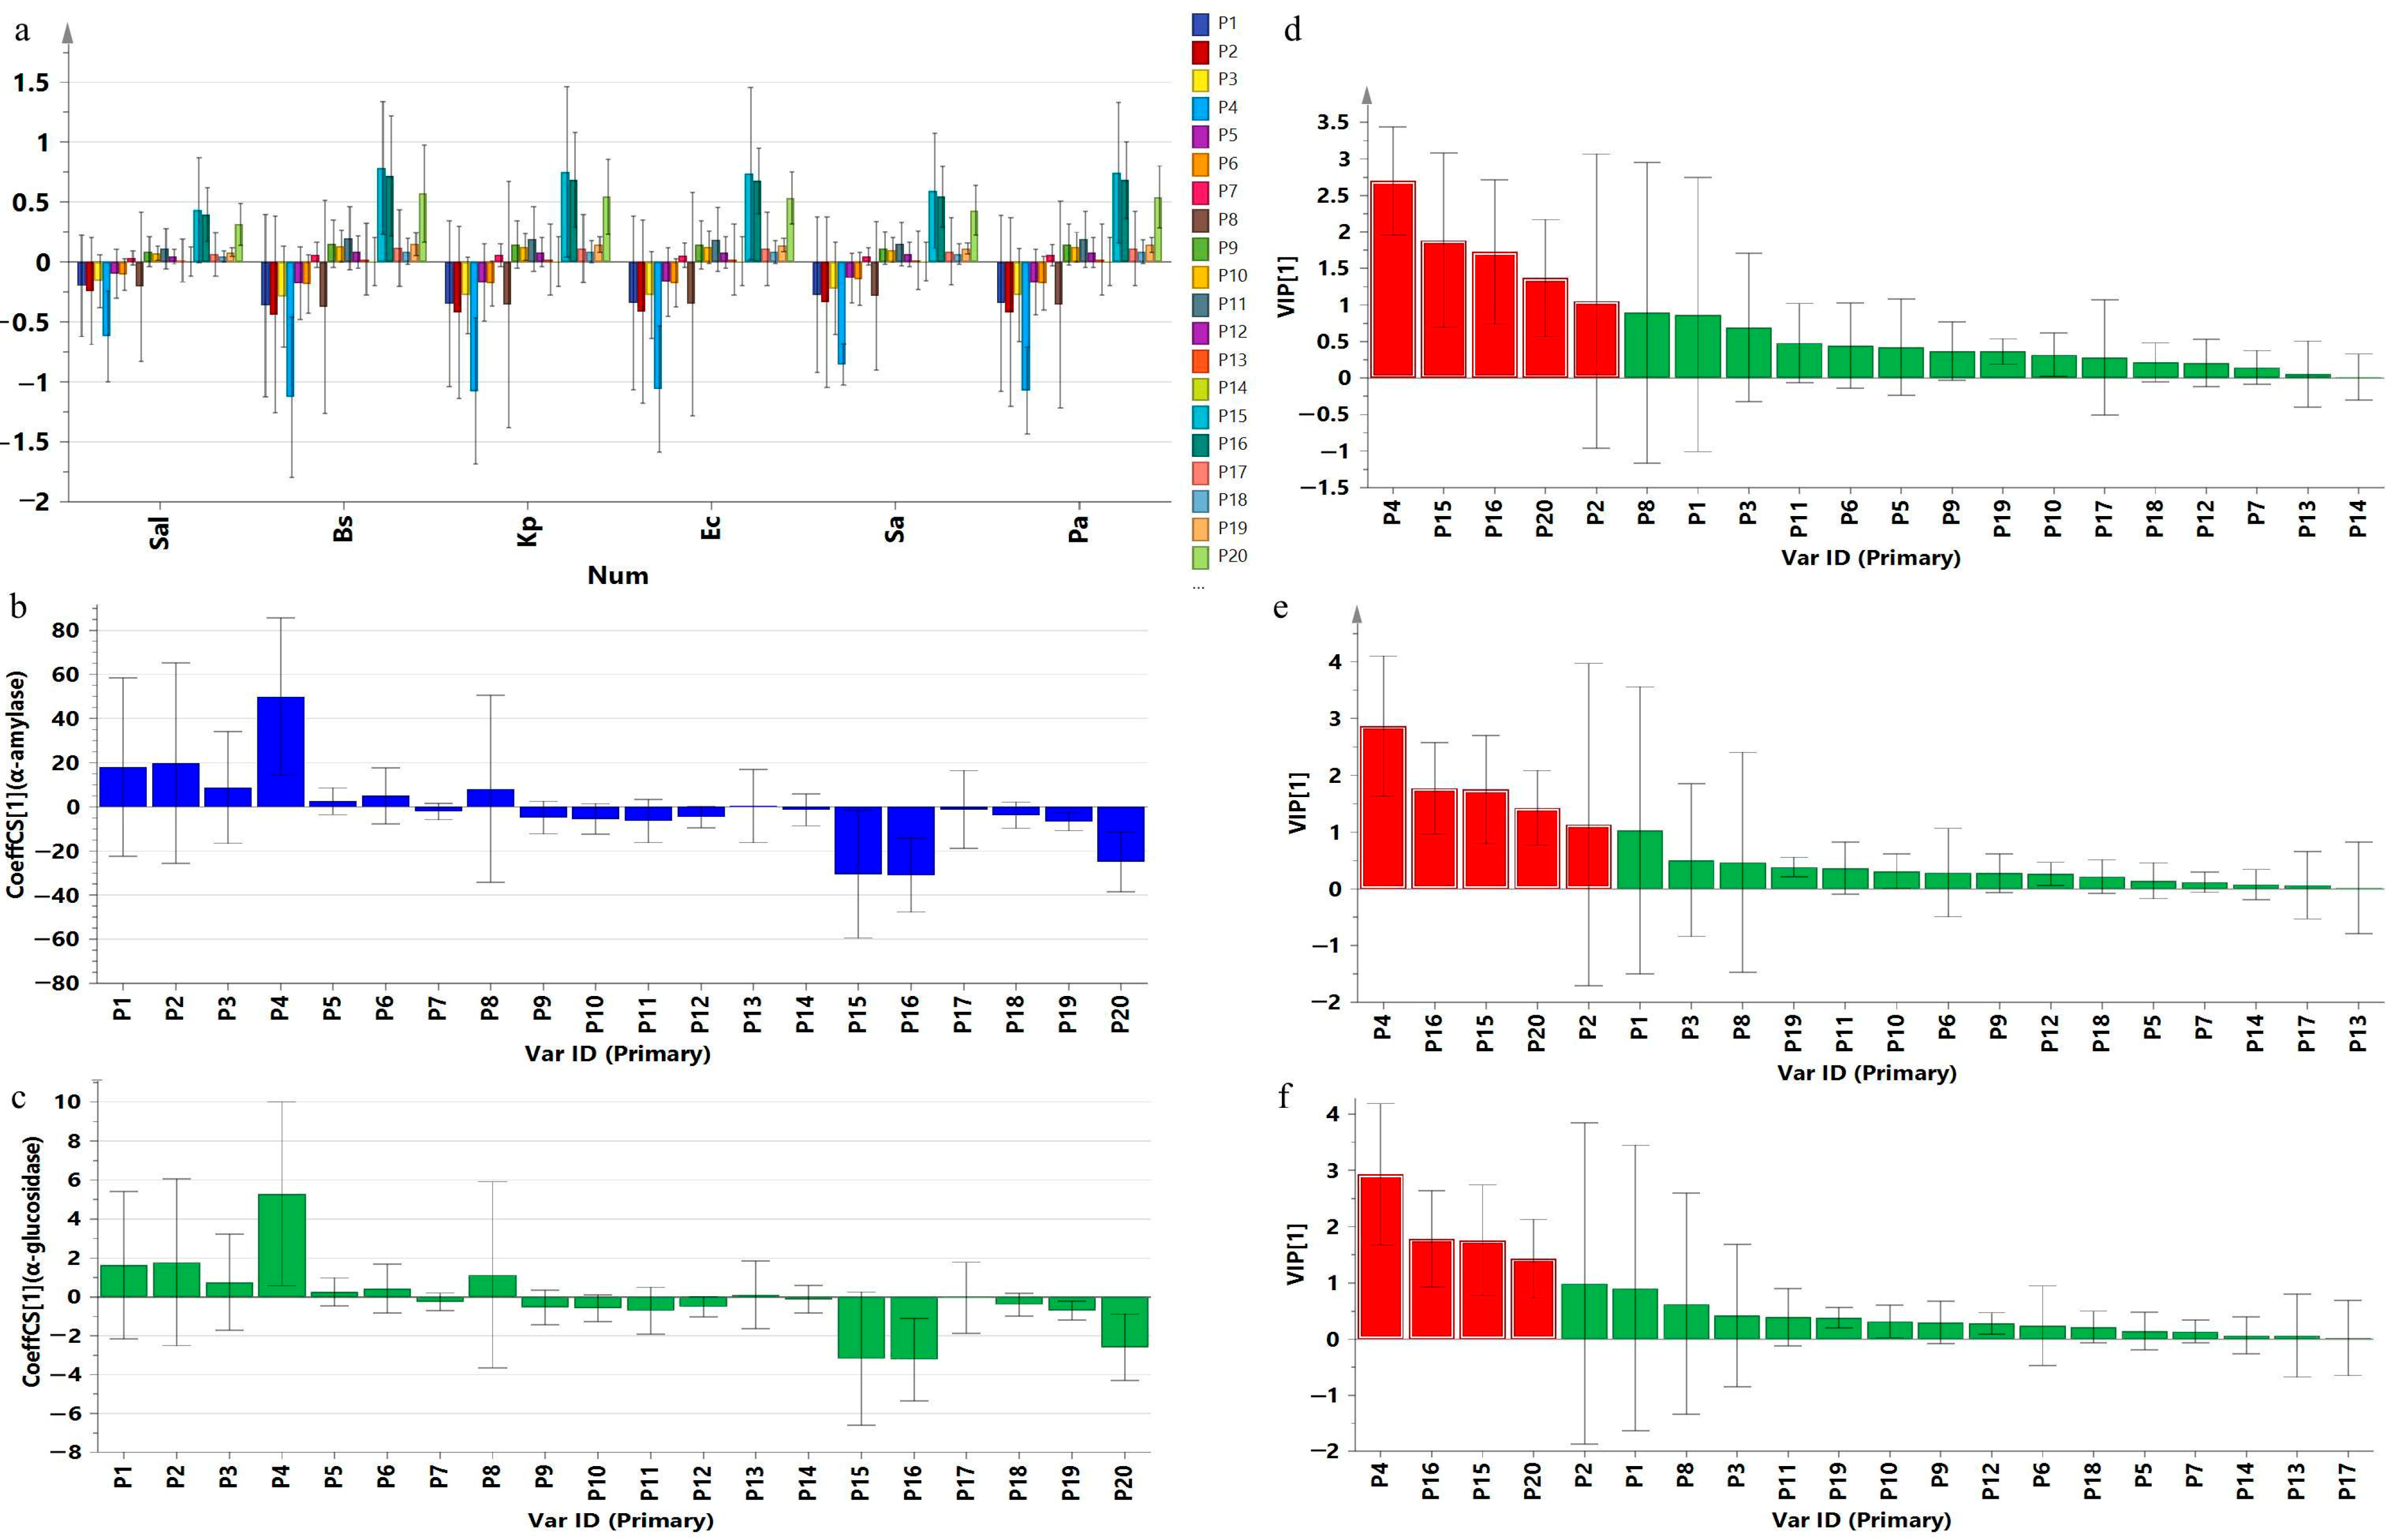
2.5.2. PLSR Results
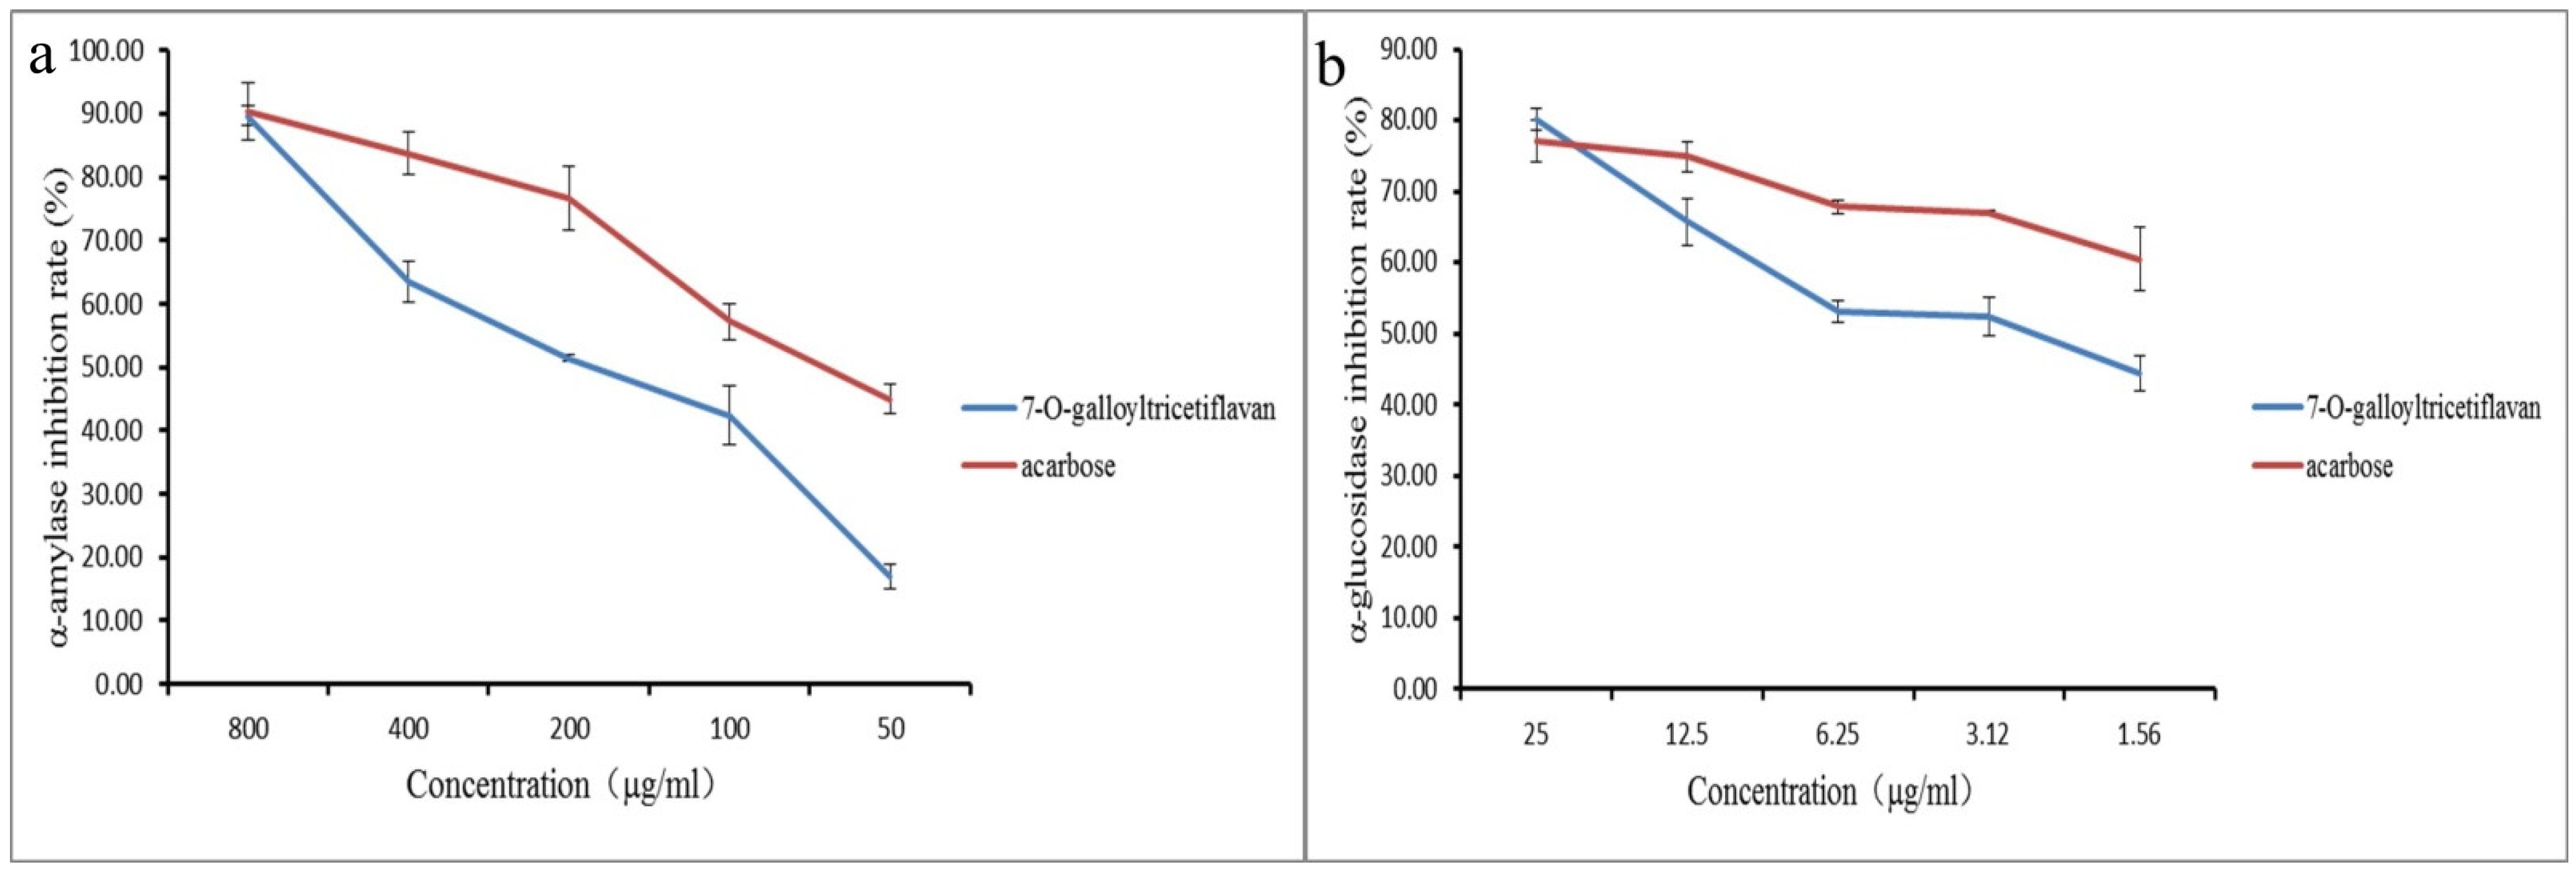
2.6. Verification of Active Compounds
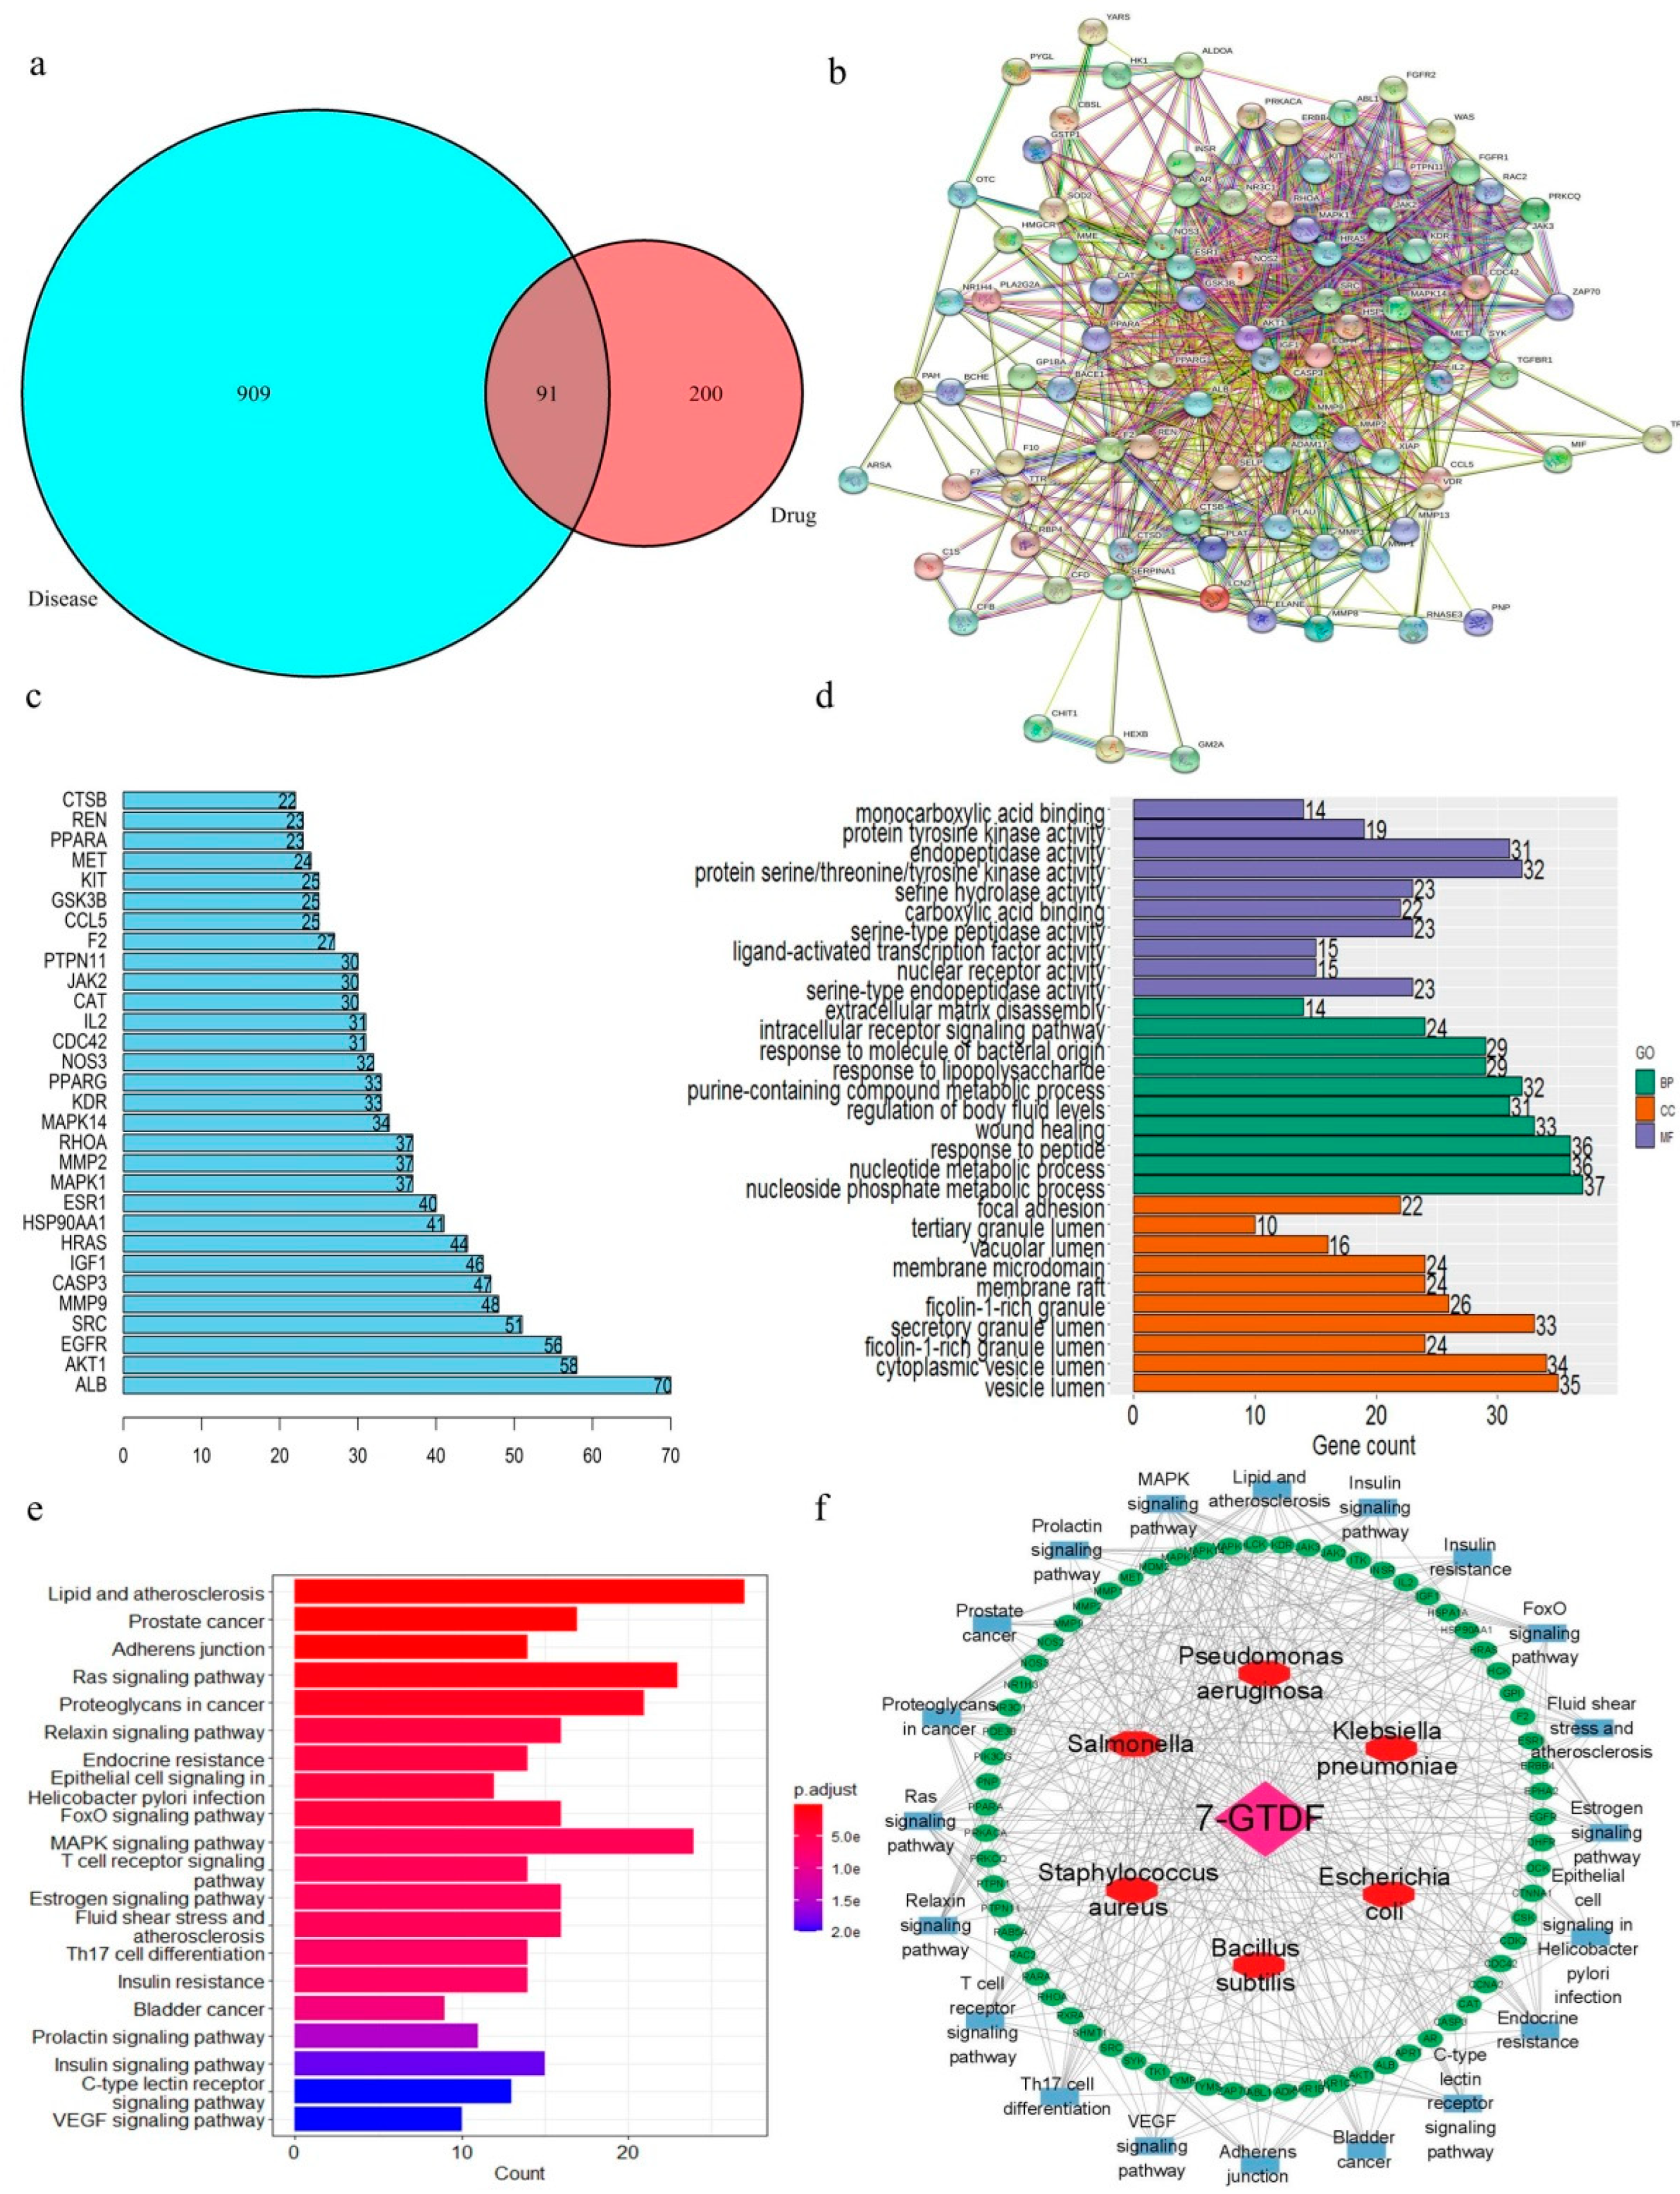
2.7. Prediction of Antibacterial Targets
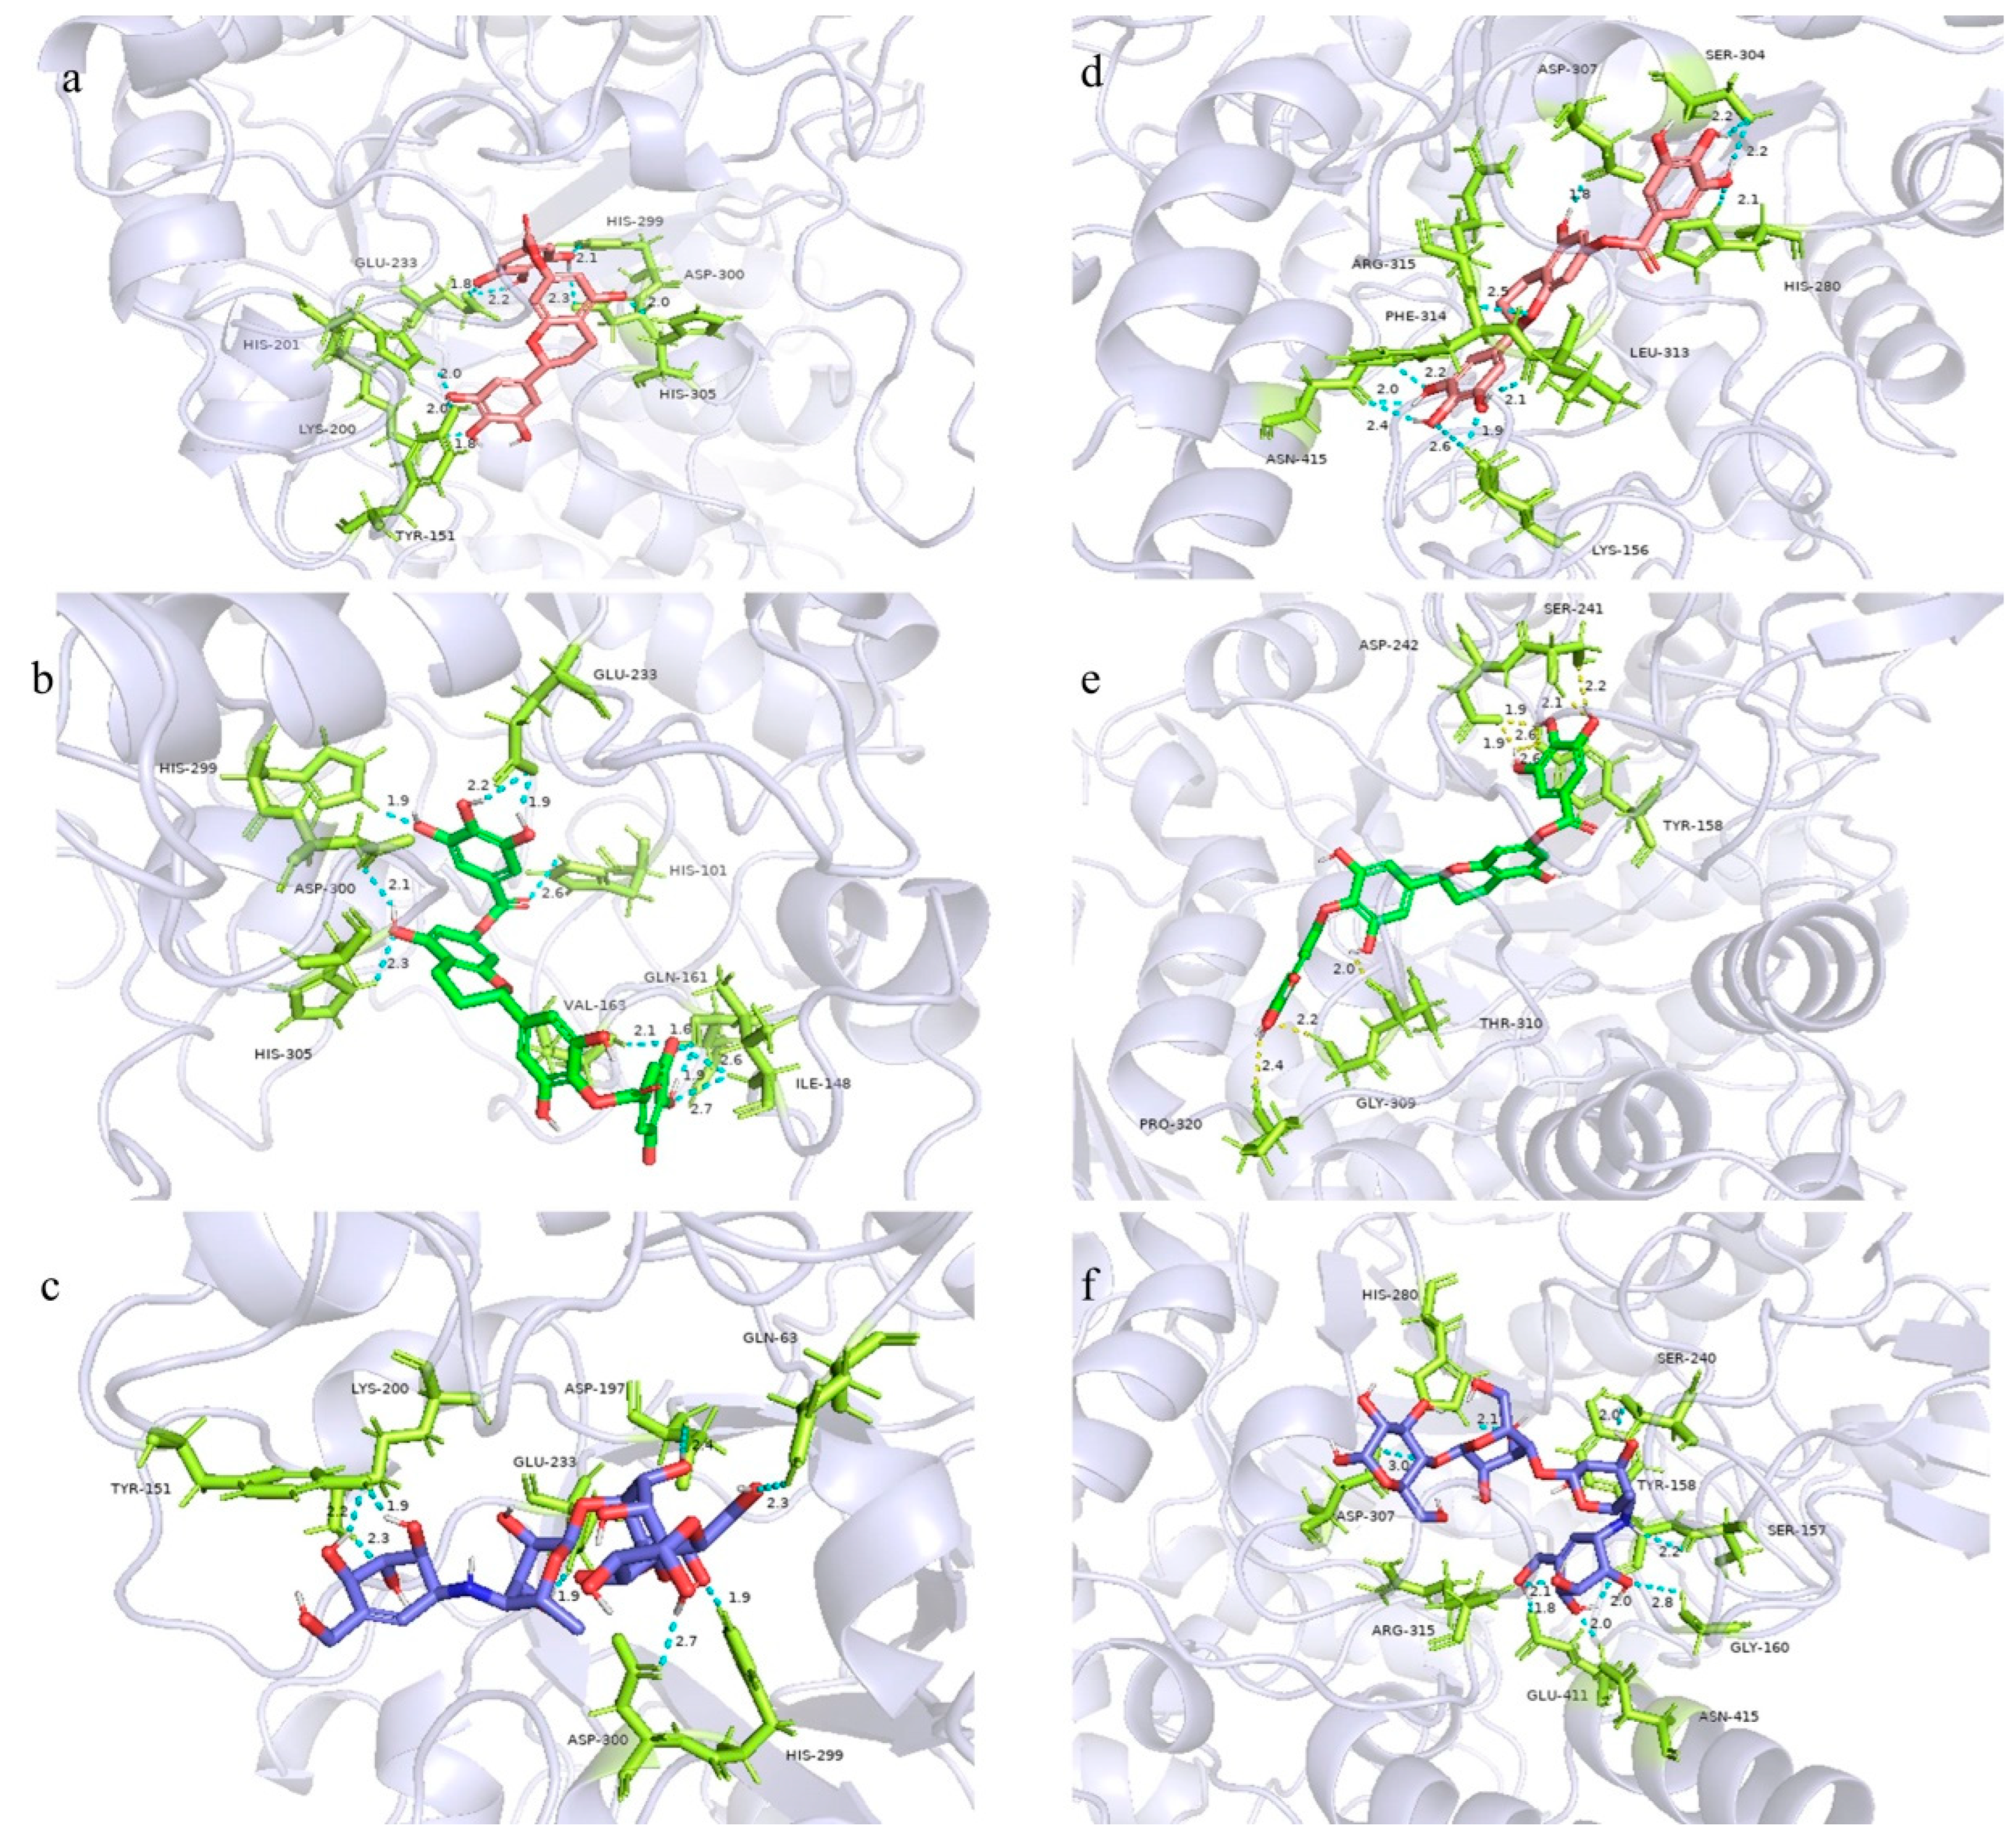
2.8. Molecular Docking Study
3. Materials and Methods
3.1. Reagents and Materials
3.1.1. Plant Material
3.1.2. Other Reagents and Materials
3.2. Sample and Standard Solution Preparation
3.3. UPLC Method
3.3.1. UPLC-ESI-Q-TOF MS Conditions
3.3.2. UPLC Conditions and Method Validation
3.4. Antibacterial Assay
3.5. α-Glucosidase and α-Amylase Inhibition Assay
3.6. Spectrum–Effect Relationship Analysis
3.6.1. Gray Relational Analysis (GRA)
3.6.2. Partial Least Squares Regression Analysis (PLSR)
3.7. Verification Experiment of the Isolated Compounds
3.8. Antibacterial Mechanism Prediction
3.9. Molecular Docking of α-Glucosidase and α-Amylase
4. Conclusions
Supplementary Materials
Author Contributions
Funding
Institutional Review Board Statement
Informed Consent Statement
Data Availability Statement
Conflicts of Interest
References
- Wang, Y.X.; Han, F.Y.; Duan, Z.K.; Chang, Y.; Lin, B.; Wang, X.B.; Huang, X.X.; Yao, G.D.; Song, S.J. Phenolics from Archidendron clypearia (Jack) I.C.Nielsen protect SH-SY5Y cells against H2O2-induced oxidative stress. Phytochemistry 2020, 176, 112414. [Google Scholar] [CrossRef] [PubMed]
- Li, P.; Zhang, D.; Li, H.; Pang, J.; Guo, H.; Qiu, J. Establishment and Application of Multiplex PCR for Simultaneously Detecting Escherichia coli, Salmonella, Klebsiella pneumoniae, and Staphylococcus aureus in Minks. Front. Vet. Sci. 2020, 7, 588173. [Google Scholar] [CrossRef] [PubMed]
- Bae, J.-Y.; Seo, Y.-H.; Oh, S.-W. Antibacterial activities of polyphenols against foodborne pathogens and their application as antibacterial agents. Food Sci. Biotechnol. 2022, 31, 985–997. [Google Scholar] [CrossRef] [PubMed]
- Teng, H.; Chen, L. alpha-Glucosidase and alpha-amylase inhibitors from seed oil: A review of liposoluble substance to treat diabetes. Crit. Rev. Food Sci. Nutr. 2017, 57, 3438–3448. [Google Scholar] [CrossRef]
- Qiao, R.; Zhou, L.; Zhong, M.; Zhang, M.; Yang, L.; Yang, Y.; Chen, H.; Yang, W.; Yuan, J. Spectrum-effect relationship between UHPLC-Q-TOF/MS fingerprint and promoting gastrointestinal motility activity of Fructus aurantii based on multivariate statistical analysis. J. Ethnopharmacol. 2021, 279, 114366. [Google Scholar] [CrossRef]
- Wang, X.; Wang, Z.-Y.; Zheng, J.-H.; Li, S. TCM network pharmacology: A new trend towards combining computational, experimental and clinical approaches. Chin. J. Nat. Med. 2021, 19, 1–11. [Google Scholar] [CrossRef]
- Pinzi, L.; Rastelli, G. Molecular Docking: Shifting Paradigms in Drug Discovery. Int. J. Mol. Sci. 2019, 20, 4331. [Google Scholar] [CrossRef]
- Liang, J.; Huang, X.; Ma, G. Antimicrobial activities and mechanisms of extract and components of herbs in East Asia. RSC Adv. 2022, 12, 29197–29213. [Google Scholar] [CrossRef]
- Adamczak, A.; Ozarowski, M.; Karpinski, T.M. Antibacterial Activity of Some Flavonoids and Organic Acids Widely Distributed in Plants. J. Clin. Med. 2020, 9, 109. [Google Scholar] [CrossRef]
- Deng, X.; Lei, H.-Y.; Ren, Y.-S.; Ai, J.; Li, Y.-Q.; Liang, S.; Chen, L.-L.; Liao, M.-C. A novel strategy for active compound efficacy status identification in multi-tropism Chinese herbal medicine (Scutellaria baicalensis Georgi) based on multi-indexes spectrum-effect gray correlation analysis. J. Ethnopharmacol. 2022, 300, 115677. [Google Scholar] [CrossRef]
- Gong, P.-Y.; Guo, Y.-J.; Tian, Y.-S.; Gu, L.-F.; Qi, J.; Yu, B.-Y. Reverse tracing anti-thrombotic active ingredients from dried Rehmannia Radix based on multidimensional spectrum-effect relationship analysis of steaming and drying for nine cycles. J. Ethnopharmacol. 2021, 276, 114177. [Google Scholar] [CrossRef]
- Oboh, G.; Ogunsuyi, O.B.; Ogunbadejo, M.D.; Adefegha, S.A. Influence of gallic acid on alpha-amylase and alpha-glucosidase inhibitory properties of acarbose. J. Food Drug Anal. 2016, 24, 627–634. [Google Scholar] [CrossRef]
- Mohamed, M.E.; Tawfeek, N.; Elbaramawi, S.S.; Elbatreek, M.H.; Fikry, E. Agathis robusta Bark Extract Protects from Renal Ischemia-Reperfusion Injury: Phytochemical, In Silico and In Vivo Studies. Pharmaceuticals 2022, 15, 1270. [Google Scholar] [CrossRef] [PubMed]
- Ma, Y.; Deng, Y.; Li, N.; Dong, A.; Li, H.; Chen, S.; Zhang, S.; Zhang, M. Network pharmacology analysis combined with experimental validation to explore the therapeutic mechanism of Schisandra Chinensis Mixture on diabetic nephropathy. J. Ethnopharmacol. 2023, 302, 115768. [Google Scholar] [CrossRef] [PubMed]
- Saeedi, M.; Raeisi-Nafchi, M.; Sobhani, S.; Mirfazli, S.S.; Zardkanlou, M.; Mojtabavi, S.; Faramarzi, M.A.; Akbarzadeh, T. Synthesis of 4-alkylaminoimidazo 1,2-a pyridines linked to carbamate moiety as potent alpha-glucosidase inhibitors. Mol. Divers. 2021, 25, 2399–2409. [Google Scholar] [CrossRef]
- Rivera-Chavez, J.; Gonzalez-Andrade, M.; del Carmen Gonzalez, M.; Glenn, A.E.; Mata, R. Thielavins A, J and K: Alpha-Glucosidase inhibitors from MEXU 27095, an endophytic fungus from Hintonia latiflora. Phytochemistry 2013, 94, 198–205. [Google Scholar] [CrossRef] [PubMed]
- Ramirez, D.; Caballero, J. Is It Reliable to Use Common Molecular Docking Methods for Comparing the Binding Affinities of Enantiomer Pairs for Their Protein Target? Int. J. Mol. Sci. 2016, 17, 525. [Google Scholar] [CrossRef] [PubMed]
- Blanco, I.; Latteri, A.; Cicala, G.; D’Angelo, A.; Viola, V.; Arconati, V.; Catauro, M. Antibacterial and Chemical Characterization of Silica-Quercetin-PEG Hybrid Materials Synthesized by Sol-Gel Route. Molecules 2022, 27, 979. [Google Scholar] [CrossRef]
- Franco, R.R.; Mota Alves, V.H.; Ribeiro Zabisky, L.F.; Justino, A.B.; Martins, M.M.; Saraiva, A.L.; Goulart, L.R.; Espindola, F.S. Antidiabetic potential of Bauhinia forficata Link leaves: A non-cytotoxic source of lipase and glycoside hydrolases inhibitors and molecules with antioxidant and antiglycation properties. Biomed. Pharmacother. 2020, 123, 109798. [Google Scholar] [CrossRef]
- Podsedek, A.; Majewska, I.; Redzynia, M.; Sosnowska, D.; Koziolkiewicz, M. In Vitro Inhibitory Effect on Digestive Enzymes and Antioxidant Potential of Commonly Consumed Fruits. J. Agric. Food Chem. 2014, 62, 4610–4617. [Google Scholar] [CrossRef] [PubMed]
- Quan, J.; Zeng, B.; Wang, L. Maximum entropy methods for weighted grey incidence analysis and applications. Grey Syst.-Theory Appl. 2018, 8, 144–155. [Google Scholar] [CrossRef]
- Shen, C.-H.; Liu, C.-T.; Song, X.-J.; Zeng, W.-Y.; Lu, X.-Y.; Zheng, Z.-L.; Jie, P.; Zhan, R.-T.; Ping, Y. Evaluation of analgesic and anti-inflammatory activities of Rubia cordifolia L. by spectrum-effect relationships. J. Chromatogr. B-Anal. Technol. Biomed. Life Sci. 2018, 1090, 73–80. [Google Scholar] [CrossRef] [PubMed]
- Zhou, S.; Bi, J.; Zhao, W.; Zhao, J.; Wan, H.; Wang, S. Study on the Mechanism of Fentanyl in Pain Treatment Based on Network Pharmacology. J. Healthc. Eng. 2022, 2022, 4139200. [Google Scholar] [CrossRef]
- Yang, Y.; Zhang, J.-L.; Shen, L.-H.; Feng, L.-J.; Zhou, Q. Inhibition mechanism of diacylated anthocyanins from purple sweet potato (Ipomoea batatas L.) against alpha-amylase and alpha-glucosidase. Food Chem. 2021, 359, 129934. [Google Scholar] [CrossRef]
- Kang, J.; Liu, C.; Wang, H.; Li, B.; Li, C.; Chen, R.; Liu, A. Studies on the bioactive flavonoids isolated from Pithecellobium clypearia Benth. Molecules 2014, 19, 4479–4490. [Google Scholar] [CrossRef]
- Maldini, M.; Montoro, P.; Hamed, A.I.; Mahalel, U.A.; Oleszek, W.; Stochmal, A.; Piacente, S. Strong antioxidant phenolics from Acacia nilotica: Profiling by ESI-MS and qualitative-quantitative determination by LC-ESI-MS. J. Pharm. Biomed. Anal. 2011, 56, 228–239. [Google Scholar] [CrossRef]


| No. | RT(min) | Formula | [M − H]− (m/z) | Error (ppm) | MS2 Ions | Identification |
|---|---|---|---|---|---|---|
| 1 (P1) | 0.65 | - | - | - | - | Unknow |
| 2 (P2) | 0.93 | - | - | - | - | Unknow |
| 3 (P3) | 2.38 | C13H16O10 | 331.0639 | −6.3 | 271.0449, 211.0245, 169.0132, 151.0031, 125.0237, 89.0248, 71.0137, 59.0133 | 6-O-Galloylglucose |
| 4 (P4) | 2.94 | C7H6O5 | 169.0133 | 0.8 | 125.0227, 79.0184 | Gallic acid |
| 5 | 5.04 | C13H16O9 | 315.0713 | 1.2 | 169.0140, 151.0031, 123.008, 59.0133 | Luteolin-5,3′-dimethylether |
| 6 (P5) | 6.78 | C19H20O12 | 439.0859 | −2.7 | 313.0564, 169.0137, 125.0238 | 3,5-Dihydroxyphenyl 1-O-(6-O-Galloyl-Beta-d-Glucopyranoside) |
| 7 | 7.25 | C15H14O7 | 305.0651 | −1.5 | 169.0136, 125.0242 | Epigallocatechin |
| 8 (P6) | 8.97 | C20H20O14 | 483.0767 | −0.5 | 271.0456, 169.0134 | 1,6-bis-O-galloyl-beta-d-glucose |
| 9 (P7) | 12.47 | C15H14O6 | 289.0703 | −1.4 | 151.0389, 137.0236, 109.0290, 83.0130 | (−)−5,7,3′,4′,5′-pentahydroxyflavan |
| 10 (P8) | 13.58 | C9H10O5 | 197.0447 | 1.2 | 169.0131, 124.0149, 78.0102 | Ethyl gallate |
| 11 (P9) | 15.35 | C22H18O11 | 457.0743 | −4.8 | 305.0634, 261.0749, 219.0651, 179.0337, 137.0236, 125.0233 | Gallocatechin-7-gallate |
| 12 | 18.61 | C20H36O10 | 435.2224 | −0.1 | 389.2185, 227.1624, 161.0747, 113.0252, 85.0274, 71.0152 | Phlorizin |
| 13 (P10) | 19.44 | C22H18O10 | 441.0798 | −4.2 | 289.0709, 151.0386, 137.0227, 125.0237 | Epicatechin gallate |
| 14 (P11) | 21.34 | C22H18O11 | 457.0754 | −2.6 | 305.0633, 261.0761, 219.0646, 179.0335, 165.0185, 137.0233, 125.0232 | Epigallocatechin-7-gallate |
| 15 (P12) | 23.40 | C29H22O15 | 609.0868 | −1.1 | 457.0763, 305.0659, 219.0657, 179.0353, 125.0235 | Gallocatechin 7,4′-di-O-gallate |
| 16 | 23.88 | C21H20O13 | 479.0826 | 1.1 | 316.0214, 271.0240 | Myricetin 3-galactoside |
| 17 | 25.72 | C22H18O10 | 441.0816 | −0.1 | 289.0713, 151.0394, 137.0238, 125.0238 | (−)-Epicatechin gallate |
| 18 (P13) | 28.33 | C21H20O12 | 463.0855 | −3.4 | 316.0200, 271.0237 | Myricitrin |
| 19 (P14) | 30.81 | C21H20O12 | 463.0853 | −3.9 | 300.0259, 271.0236, 255.0291 | Isoquercitrin |
| 20 (P15) | 31.74 | C22H18O10 | 441.0806 | −2.3 | 289.0709, 151.0386, 137.0227, 125.0237 | 7-O-galloyltricetiflavan |
| 21 (P16) | 39.30 | C29H22O14 | 593.0907 | −3.1 | 441.0780, 289.0695, 151.0389, 137.0225, 125.0236 | 7,4′-di-O-galloyltricetiflavan |
| 22 (P17) | 40.33 | C21H20O11 | 447.0910 | −2.6 | 300.0244, 271.0231, 255.0286, 178.9983, 151.0032 | Quercitrin |
| 23 (P18) | 44.51 | C29H22O14 | 593.0912 | −2.3 | 441.0820, 289.0712, 151.0396, 137.0239, 125.0239 | Catechin 7,3′-Di-O-Gallate |
| 24 (P19) | 46.05 | C29H22O14 | 593.0910 | −2.6 | 441.0806, 289.0708, 151.0395, 137.0234, 125.0240 | Catechin 7,4′-di-O-gallate |
| 25 (P20) | 48.33 | C29H22O14 | 593.0917 | −1.5 | 441.0783, 289.0690, 151.0387, 137.0223, 125.0234 | 7,4′-di-O-galloyltricetiflavan |
| 26 | 51.09 | C36H26O18 | 745.1021 | 5.9 | 593.0926, 441.0817, 289.0702, 137.0243 | Trifucodiphlorethol A |
| Batch | Antibacterial Zone Diameter (mm) | |||||
|---|---|---|---|---|---|---|
| Salmonella | Bacillus subtilis | Klebsiella pneumoniae | Escherichia coli | Staphylococcus aureus | Pseudomonas aeruginosa | |
| S1 | 9.78 ± 0.72 | 12.06 ± 0.44 | 10.33 ± 0.56 | 10.96 ± 0.06 | 10.56 ± 0.09 | 10.15 ± 0.25 |
| S2 | 9.41 ± 0.68 | 9.29 ± 0.78 | 12.21 ± 0.95 | 10.94 ± 0.72 | 11.51 ± 0.66 | 10.96 ± 0.06 |
| S3 | 8.00 ± 0.40 | 10.51 ± 0.42 | 9.42 ± 0.54 | 8.47 ± 0.21 | 8.75 ± 0.56 | 8.92 ± 0.71 |
| S4 | 10.97 ± 0.45 | 13.14 ± 0.58 | 13.29 ± 1.10 | 14.74 ± 0.49 | 10.66 ± 0.24 | 13.01 ± 0.38 |
| S5 | 8.12 ± 0.15 | 7.14 ± 0.56 | 8.22 ± 0.27 | 8.87 ± 0.51 | 8.58 ± 0.10 | 7.97 ± 0.09 |
| S6 | 7.28 ± 0.16 | 7.28 ± 0.26 | 7.05 ± 0.10 | 6.80 ± 0.29 | 7.11 ± 0.08 | 6.35 ± 0.39 |
| S7 | 7.71 ± 0.04 | 6.96 ± 0.04 | 6.59 ± 0.04 | 7.15 ± 0.13 | 8.60 ± 0.29 | 6.94 ± 0.06 |
| S8 | 8.17 ± 0.25 | 12.74 ± 0.80 | 9.86 ± 0.26 | 11.50 ± 0.60 | 10.64 ± 0.27 | 9.98 ± 0.09 |
| S9 | 8.37 ± 0.29 | 13.03 ± 0.26 | 10.76 ± 0.66 | 11.29 ± 0.36 | 9.87 ± 0.48 | 10.66 ± 0.25 |
| S10 | 9.55 ± 0.10 | 13.14 ± 0.47 | 10.96 ± 0.19 | 11.30 ± 0.26 | 10.32 ± 0.22 | 10.90 ± 0.36 |
| gentamicin | 25.36 ± 0.48 | 26.05 ± 0.33 | 22.97 ± 0.78 | 22.21 ± 0.75 | 22.02 ± 0.45 | 23.17 ± 0.48 |
| Batch | IC50 (μg/mL) | |
|---|---|---|
| α-Amylase | α-Glucosidase | |
| S1 | 258.93 ± 23.60 | 2.41 ± 0.23 |
| S2 | 160.67 ± 12.00 | 2.01 ± 0.16 |
| S3 | 394.17 ± 38.34 | 3.84 ± 0.05 |
| S4 | 180.73 ± 18.09 | 2.88 ± 0.34 |
| S5 | 596.93 ± 23.61 | 3.60 ± 0.21 |
| S6 | - | 99.21 ± 7.07 |
| S7 | - | 122.57 ± 0.72 |
| S8 | 1193.00 ± 113.32 | 10.24 ± 0.62 |
| S9 | 250.10 ± 17.53 | 2.36 ± 0.09 |
| S10 | 261.23 ± 36.10 | 1.65 ± 0.05 |
| acarbose | 65.59 ± 6.59 | 0.69 ± 0.14 |
| Peak | Salmonella | Bacillus subtilis | Klebsiella pneumoniae | Escherichia coli | Staphylococcus aureus | Pseudomonas aeruginosa | α-Amylase | α-Glucosidase | ||||||||
|---|---|---|---|---|---|---|---|---|---|---|---|---|---|---|---|---|
| cor. | rank | cor. | rank | cor. | rank | cor. | rank | cor. | rank | cor. | rank | cor. | rank | cor. | rank | |
| P1 | 0.771 | 14 | 0.755 | 16 | 0.760 | 16 | 0.762 | 16 | 0.764 | 16 | 0.759 | 16 | 0.821 | 5 | 0.811 | 4 |
| P2 | 0.766 | 17 | 0.753 | 18 | 0.757 | 18 | 0.757 | 18 | 0.759 | 19 | 0.755 | 18 | 0.806 | 10 | 0.791 | 9 |
| P3 | 0.764 | 18 | 0.754 | 17 | 0.757 | 17 | 0.758 | 17 | 0.762 | 17 | 0.757 | 17 | 0.823 | 3 | 0.804 | 6 |
| P4 | 0.787 | 12 | 0.768 | 15 | 0.778 | 13 | 0.779 | 14 | 0.786 | 11 | 0.779 | 13 | 0.788 | 13 | 0.789 | 11 |
| P5 | 0.763 | 19 | 0.743 | 20 | 0.754 | 19 | 0.753 | 19 | 0.759 | 18 | 0.754 | 19 | 0.752 | 19 | 0.753 | 19 |
| P6 | 0.805 | 9 | 0.792 | 10 | 0.794 | 10 | 0.799 | 10 | 0.806 | 6 | 0.797 | 10 | 0.763 | 18 | 0.764 | 17 |
| P7 | 0.768 | 16 | 0.771 | 14 | 0.774 | 15 | 0.777 | 15 | 0.764 | 15 | 0.774 | 15 | 0.785 | 14 | 0.778 | 12 |
| P8 | 0.756 | 20 | 0.749 | 19 | 0.751 | 20 | 0.746 | 20 | 0.755 | 20 | 0.750 | 20 | 0.752 | 20 | 0.763 | 18 |
| P9 | 0.775 | 13 | 0.778 | 12 | 0.779 | 12 | 0.785 | 12 | 0.772 | 13 | 0.780 | 12 | 0.800 | 11 | 0.772 | 14 |
| P10 | 0.817 | 2 | 0.828 | 3 | 0.827 | 2 | 0.835 | 2 | 0.820 | 2 | 0.829 | 2 | 0.815 | 8 | 0.789 | 10 |
| P11 | 0.771 | 15 | 0.774 | 13 | 0.776 | 14 | 0.781 | 13 | 0.768 | 14 | 0.776 | 14 | 0.800 | 12 | 0.771 | 15 |
| P12 | 0.812 | 4 | 0.835 | 1 | 0.817 | 4 | 0.820 | 4 | 0.815 | 3 | 0.820 | 4 | 0.784 | 15 | 0.778 | 13 |
| P13 | 0.807 | 8 | 0.803 | 9 | 0.805 | 9 | 0.813 | 9 | 0.804 | 7 | 0.807 | 9 | 0.784 | 16 | 0.765 | 16 |
| P14 | 0.810 | 5 | 0.804 | 8 | 0.808 | 8 | 0.817 | 5 | 0.808 | 4 | 0.811 | 7 | 0.823 | 4 | 0.794 | 8 |
| P15 | 0.820 | 1 | 0.830 | 2 | 0.827 | 1 | 0.836 | 1 | 0.823 | 1 | 0.831 | 1 | 0.826 | 2 | 0.806 | 5 |
| P16 | 0.810 | 6 | 0.823 | 4 | 0.815 | 5 | 0.815 | 6 | 0.803 | 8 | 0.816 | 5 | 0.821 | 6 | 0.835 | 1 |
| P17 | 0.788 | 11 | 0.784 | 11 | 0.785 | 11 | 0.793 | 11 | 0.785 | 12 | 0.788 | 11 | 0.774 | 17 | 0.751 | 20 |
| P18 | 0.815 | 3 | 0.819 | 6 | 0.821 | 3 | 0.821 | 3 | 0.807 | 5 | 0.821 | 3 | 0.812 | 9 | 0.801 | 7 |
| P19 | 0.802 | 10 | 0.813 | 7 | 0.809 | 7 | 0.815 | 7 | 0.795 | 10 | 0.811 | 8 | 0.830 | 1 | 0.835 | 3 |
| P20 | 0.809 | 7 | 0.822 | 5 | 0.814 | 6 | 0.814 | 8 | 0.802 | 9 | 0.815 | 6 | 0.820 | 7 | 0.835 | 2 |
| Compound | MIC (mg/mL) | |||||
|---|---|---|---|---|---|---|
| Salmonella | Bacillus subtilis | Klebsiella pneumoniae | Escherichia coli | Staphylococcus aureus | Pseudomonas aeruginosa | |
| Gallic acid (P4) | 1.56 | 0.39 | 1.56 | 1.56 | 1.56 | 3.12 |
| Ethyl gallate (P8) | 0.39 | 0.39 | 0.20 | 0.78 | 0.78 | 0.78 |
| gallocatechin-7-gallate (P9) | 0.39 | 0.10 | 0.10 | 0.10 | 0.20 | 0.78 |
| 7-O-galloyltricetifavan (P15) | 0.20 | 0.10 | 0.10 | 0.20 | 0.20 | 0.39 |
| Myricitrin (P13) | 1.56 | 0.78 | 1.56 | 0.78 | 1.56 | 1.56 |
| Quercitrin (P17) | 3.12 | 1.56 | 1.56 | 0.78 | 1.56 | 1.56 |
| gentamicin | 0.006 | <0.006 | 0.012 | 0.012 | 0.012 | 0.012 |
| Binding Energy(kcal/mol) | ||
|---|---|---|
| α-Amylase | α-Glucosidase | |
| Gallic acid (P4) | −4.16 | −4.70 |
| Ethyl gallate (P8) | −4.48 | −4.87 |
| Gallocatechin-7-gallate (P9) | −6.27 | −7.21 |
| 7-O-galloyltricetifavan (P15) | −6.69 | −7.45 |
| 7,4′-di-O-galloyltricetiflavan (P16/P20) | −6.32 | −7.89 |
| Myricitrin (P13) | −5.52 | −7.82 |
| Quercitrin (P17) | −5.87 | −7.44 |
| crystallized ligand | −5.07 | −5.20 |
Disclaimer/Publisher’s Note: The statements, opinions and data contained in all publications are solely those of the individual author(s) and contributor(s) and not of MDPI and/or the editor(s). MDPI and/or the editor(s) disclaim responsibility for any injury to people or property resulting from any ideas, methods, instructions or products referred to in the content. |
© 2023 by the authors. Licensee MDPI, Basel, Switzerland. This article is an open access article distributed under the terms and conditions of the Creative Commons Attribution (CC BY) license (https://creativecommons.org/licenses/by/4.0/).
Share and Cite
Ji, W.; Gu, L.; Zou, X.; Li, Z.; Xu, X.; Wu, J.; Zhang, S.; Deng, H. Discovery, Validation, and Target Prediction of Antibacterial and Antidiabetic Components of Archidendron clypearia Based on a Combination of Multiple Analytical Methods. Molecules 2023, 28, 1329. https://doi.org/10.3390/molecules28031329
Ji W, Gu L, Zou X, Li Z, Xu X, Wu J, Zhang S, Deng H. Discovery, Validation, and Target Prediction of Antibacterial and Antidiabetic Components of Archidendron clypearia Based on a Combination of Multiple Analytical Methods. Molecules. 2023; 28(3):1329. https://doi.org/10.3390/molecules28031329
Chicago/Turabian StyleJi, Wenduo, Lixia Gu, Xuezhe Zou, Zhichao Li, Xiaohong Xu, Jialin Wu, Shu Zhang, and Hong Deng. 2023. "Discovery, Validation, and Target Prediction of Antibacterial and Antidiabetic Components of Archidendron clypearia Based on a Combination of Multiple Analytical Methods" Molecules 28, no. 3: 1329. https://doi.org/10.3390/molecules28031329
APA StyleJi, W., Gu, L., Zou, X., Li, Z., Xu, X., Wu, J., Zhang, S., & Deng, H. (2023). Discovery, Validation, and Target Prediction of Antibacterial and Antidiabetic Components of Archidendron clypearia Based on a Combination of Multiple Analytical Methods. Molecules, 28(3), 1329. https://doi.org/10.3390/molecules28031329