Article

A Small Change in Structure, a Big Change in Flexibility †

by
Nikolay G. Vassilev
1,* and
Ivo C. Ivanov
2
1
Institute of Organic Chemistry with Centre of Phytochemistry, Bulgarian Academy of Sciences, Acad. G. Bontchev Str. Bl. 9, 1113 Sofia, Bulgaria
2
Faculty Chemistry, Aalen University of Applied Sciences, Beethovenstraße 1, 73430 Aalen, Germany
*
Author to whom correspondence should be addressed.
Dedicated to Willi Kantlehner (Aalen, Germany) on the occasion of his 80th birthday.
Molecules 2023, 28(24), 8004; https://doi.org/10.3390/molecules28248004
Submission received: 1 November 2023 / Revised: 28 November 2023 / Accepted: 6 December 2023 / Published: 8 December 2023
(This article belongs to the Section Organic Chemistry)

Abstract

:
Studies of the rotational barrier energy of the amide bond using quantum computing and nuclear magnetic resonance (NMR) are focused mainly on its use as a model of the peptide bond. The results of these studies are valuable not only in terms of the fundamental conformational properties of amide bonds, but also in the design of molecular machines, which have recently attracted interest. We investigate the fluxionality of the amide and enamide bonds of compound 3-[(E)-(dimethylamino)methylidene]-1,1-dimethylurea using advanced dynamic NMR experiments and a theoretical evaluation of the density functional theory (DFT) calculation. The dynamic NMR study shows restricted rotation around the amide group (16.4 kcal/mol) and a very high barrier around the enamine group (18.6 kcal/mol). In a structurally similar compound, (E)-3-(dimethylamino)-N,N-dimethylacrylamide (N atom is replaced by CH), the amide barrier is 12.4 kcal/mol and the enamine barrier is 11.7 kcal/mol. The DFT studies of both compounds reveal the electronic origin of this phenomenon. Theoretical calculations reveal the origin of the higher enamine barrier. The better delocalization of the lone pair of electrons on the end nitrogen atom into the antibonding orbital of the neighboring C–N double bond leads to the better stabilization of the ground state, and this leads to a greater increase in the enamine barrier.

1. Introduction

The amide bond is a basic unit of proteins and is characterized by unique spatial and energetic properties [1,2]. Over several decades, the dynamics of these bonds were studied to understand protein dynamics. Internal rotation about the amide C–N bond in amides and thioamides has been studied experimentally by NMR spectroscopy in both the gas [3,4,5,6,7,8,9] and liquid phases [10]. Experimental results have been used to critically evaluate theoretical methods for the calculation of barrier heights. The origin of the C–N rotational barrier and its relation to the amide resonance has been discussed in recent years [11,12,13,14,15,16].
Recently, the electronic effect of polar substituents on the barrier of internal rotation around the amide bond in p-substituted acetanilides [17,18] and thioacetanilides [19] was studied at the B3LYP/6-31G(d,p) level. Several linear relationships were established linking the barrier heights with the structural and electronic parameters that characterize the amide and thioamide groups. The results obtained are consistent with the view of classical amide resonance being the origin of the higher rotational barriers in thioamides than in amides.
Recently, ab initio studies [20] of an internal rotation barrier around a C–N bond in N,N-dimethylcinnamamides, which were previously investigated by dynamic NMR spectroscopy [21,22], have been published. Scientific interest in cinnamamides and, in particular, coumaric amides has increased in recent years due to their potential antioxidant activity [23,24]. The free energy of activation of substituted cinnamamides is very well reproduced using MP2(fc)/6-31+G*//6-31G* energies and the PCM/6-31G* energy change from gas phase to chloroform. For all compounds studied, the anti transition state (anti TS) is more stable and determines the rotational barrier. The remote effect of the phenyl substituents in the studied compounds has a purely electronic origin, which was shown by the correlation between the C–N bond order difference and the calculated energy barrier [20].
Conformational studies of amide bonds have been extensively carried out also in view of their potential applications in the field of molecular machines [25,26] (molecular gear systems, single-molecule motors, and single-molecule devices [27]). Here, we present a combined dynamic nuclear magnetic resonance (DNMR) spectroscopy and density functional theory (DFT) study of the C–N bond rotation of the amide and the enamine groups in compound 1 in order to understand the unexpectedly high energy barrier of enamine group. At the same time, to understand the origin of this phenomenon, we present a DFT study of the C–N bond rotation of amide and enamine groups in compound 2, which is an analogue of 1, in which the N atom is substituted by a CH group (Figure 1).

2. Results

2.1. Interpretation of VT-NMR and Characterization of the Studied Compound 1

Compound 1 was synthesized recently by an alternative synthetic approach [28,29,30]. Its structure has been confirmed by NMR and X-ray analyses. However, this compound shows flexibility, whose rate falls in the NMR time scale. We studied the amide and enamine rotational barriers at both the CC–N and C(O)–N bonds (Figure 1). Before investigating the rotational barriers using 1H VT NMR, the four N-Me signals were assigned in order to understand which rotations occur. If we number the methyl groups by increasing chemical shift, then the methyl signals 1 and 4 are exchanging, whereas signals 2 and 3 are exchanging as well, albeit slightly more slowly (Figures S1 and S6). The assignment of the methyl signals in the proton spectrum is supported by the following observations: the NOESY spectrum shows proximity between methyl 3 and CH (Figure S2); the 1H,15N-HMBC spectrum shows the proton–nitrogen correlations between the methine proton and those of enamine methyl groups (Figure S5). A coupling constant of 0.4 Hz between protons from N-methyl 2 and the methine proton is observed. The signals of amide methyls 1 and 4 were determined using the anisotropy effect of the carbonyl group. The assignments of the methyl signals in the carbon spectrum are based on the HSQC correlations (Figure S4).

2.2. Dynamic NMR Studies

We measured the VT spectra of compound 1 in two aprotic solvents: in CDCl3 in steps of 5 K between 283 and 328 K and in TCE-d2 in steps of 10 K between 263 and 393 K. The N-methyl signals of the amide group (denoted as 1 and 4 in Figure 1) are more sensitive to the increase in the temperature and in CDCl3 become broadened at 313 K, while the N-methyl signals of the enamine group (denoted as 2 and 3 in Figure 1) remain in a slow range of exchange until 323 K (Figure S8). In TCE-d2, the signals of both exchanging methyl pairs shift from a slow range of exchange to a fast range of exchange (Figure 2 and Figure S11). The methyl signals of the amide group merge into a lower-field signal (3.10 ppm) at 393 K, while the methyl signals of the enamine group merge into a single stronger-field signal (3.08 ppm) at 393 K.
The VT spectra of compound 1 in CDCl3 are in the slow range of exchange and therefore they are suitable for study using 2D EXSY, 1D EXSY, or magnetization–transfer experiments. We prefer to adopt 2D EXSY experiments as a well-established approach and an easy way to derive rate constants from 2D integrals.
The VT spectra of compound 1 in TCE-d2 were also studied using 2D EXSY spectra in a slow range of exchange (Figure 3 and Figure S12) and using complete line shape analysis (CLSA) in the entire temperature range (Figure S30).
The 2D EXSY results in both solvents are almost equal and show no solvent dependence of the rotational barriers (Table 1 and Table 2). The unexpected result is that the enamine rotational barrier is 18.6 kcal/mol, a much higher value than the amide rotational barrier of 16.4 kcal/mol. The analogue of compound 1 in which the X is CH (compound 2) was studied in the mid-1970s by 13C NMR spectra, and the rotational barriers of the amide and enamine groups were estimated using the coalescence method [31]. The experiment was performed in acetone-d6 and the enamine rotational barrier (11.7 kcal/mol) was lower than the amide rotational barrier (12.4 kcal/mol). The small structural change in the molecule causes a big change in the flexibility. This fact led us to study compound 1 in depth and find an answer to the question of why the two compounds (1 and 2) have such different rotational flexibility.
The experiment in TCE-d2 was designed with the idea of studying compound 1 in the most rigorous way possible. The sample was prepared by adding one drop of anisole [32,33] (a compound with a singlet signal at 3.81 ppm), which is a suitable compound for the application of the reference deconvolution procedure [34,35]. The relaxation times T1 and T2 of the reference signal at different temperatures were measured (Table S5) and their temperature dependence was determined (Figures S14 and S15). From this dependence, the values of T2 were calculated, which were used in the reference deconvolution procedure in order to remove both line distortion and the signals that we were interested in to be of natural half-width. The newly developed signal-to-noise ratio enhancement program [36] was used to process the FIDs, instead of the previously used LP [32] and MEM [37]. Slow exchange chemical shifts were extrapolated to high temperatures. Thus, all that remained was to fit the rate constants in the procedure of CLSA. The CLSA results are very close to the 2D EXSY results and are complementary (Table 1 and Table 2). In general, 2D EXSY is applicable for slow exchange and the line shape analysis is most sensitive at intermediate exchange.
Figure 4 presents the Eyring plot of the rate constants obtained by different methods. These plots demonstrate very good linear dependence for all sets of kinetic data. The correlation coefficients of all plots are very good and are presented in Tables S2, S4, S7, and S8.

2.3. DFT Calculations

A natural continuation of the experiments in the analysis of the observed phenomenon is the DFT study of the hindered rotation around the amide and enamine bond (Figure 2). In addition to the ground state (GS) geometry for both compounds, transition structures (TS) were localized as well. For each rotation, two TSs are possible (Figure 5). Popular functionals B3LYP [38] and M06-2X [39,40] with the 6-311++G (d,p) basis set [41] were used in the DFT calculations. The SMD [42] model was used to account for the solvent effect. Table 1, Table 2, Table 3 and Table 4 show that the theoretically calculated rotational barriers of both compounds and both rotations are in very good agreement with the experimental data.

2.4. Origin of Rotational Barriers

The studied compound 1 is a push–pull molecular system, for which several resonance structures can be written (Figure 6). Even from these structures, it can be concluded that there is a large delocalization over the heavy atom framework and the C–N enamine single bond has a partial double bond character.
The computed geometrical parameters of 1 are in excellent agreement with the X-ray crystal structure [30] (Table 5). The heavy atom frameworks of 1 and 2 are planar in GS. When comparing the structural parameters of 1 and 2, only the bond lengths of X4 with neighboring C2 and C5 differ significantly, which is to be expected.
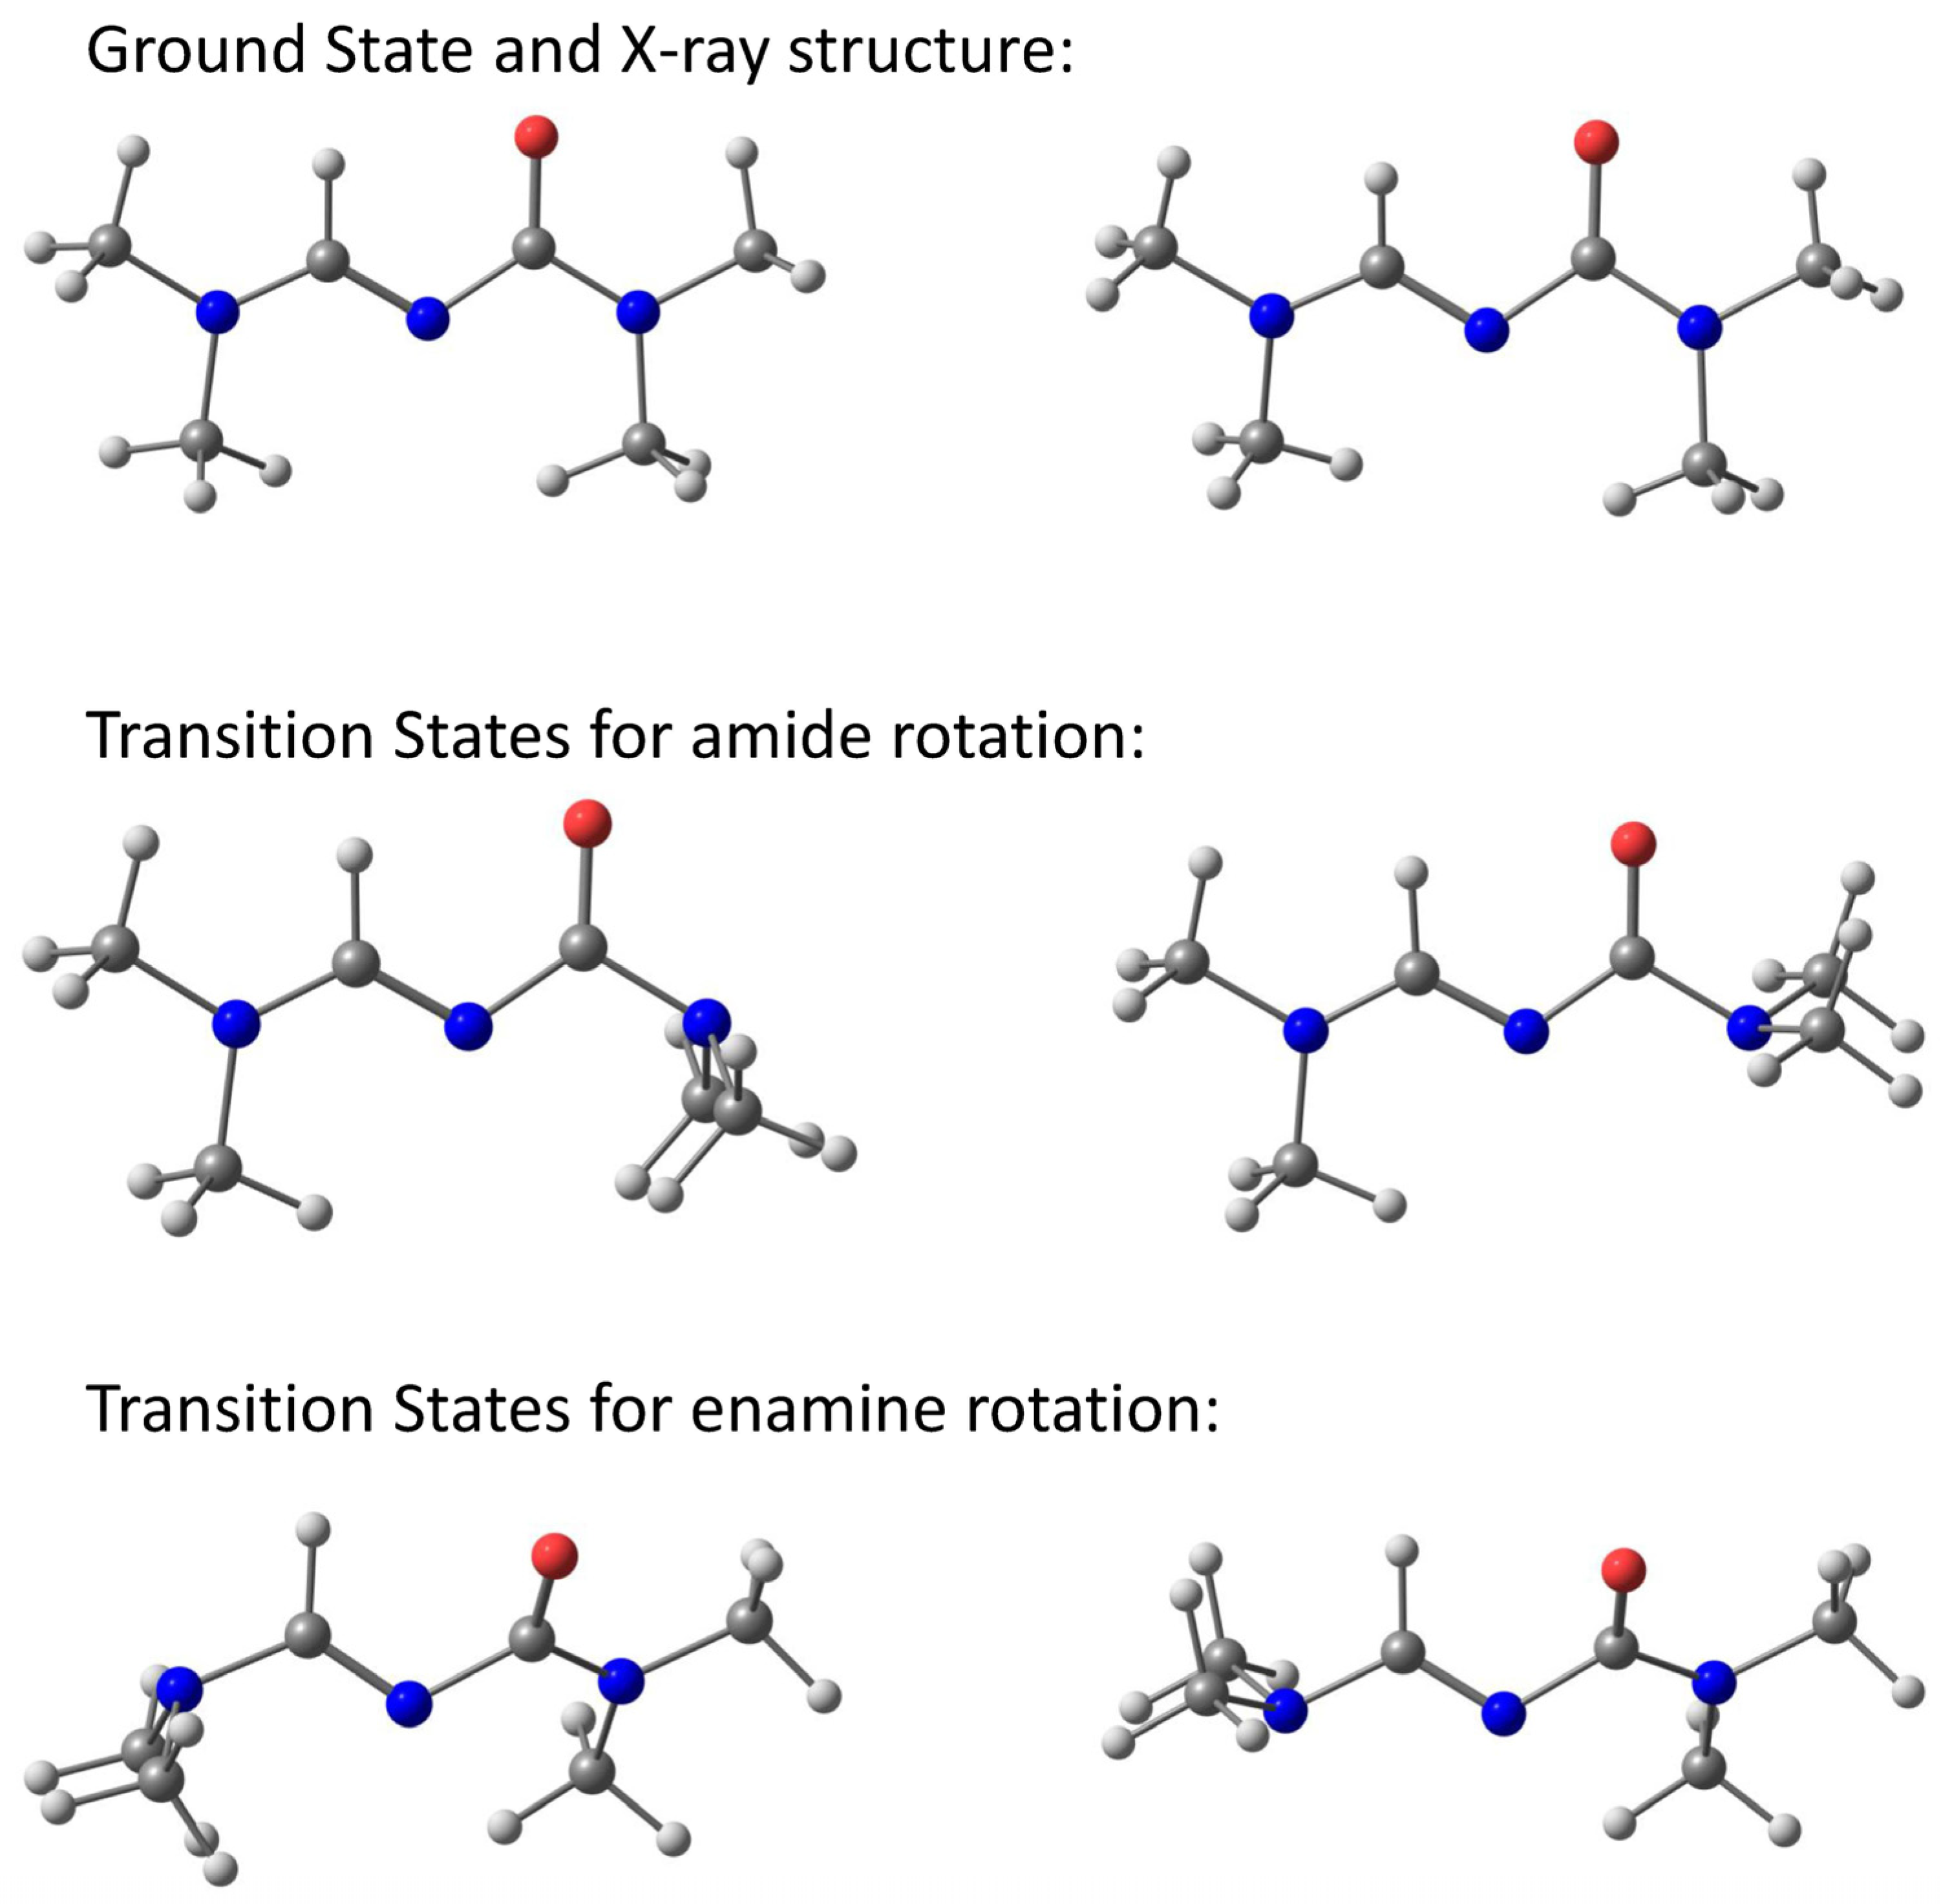
The C2–N1 amide bond was studied intensively in the past, and the heavy atom framework of the studied amides in the GS was found to be essentially planar and close to CS symmetry. The transition state geometries of the studied amides can be optimized in CS symmetry and yield two transition states: syn and anti. The most significant structural changes in the process of the rotation of amides towards the transition states are that the nitrogen is pyramidalized and the C–N bond lengthens by 0.07–0.08 Å. However, the C=O bond length shortens by 0.01–0.02 Å only. This indicates that the carbonyl group is relatively unaffected by this rotation. The origin of the C–N amide rotational barrier and its relation to amide resonance has also received much attention in the last few years [11,12,13,14,15,16] and therefore we will discuss here mainly the enamine rotational barrier, which has only been discussed once in the literature [43]. The X4–C5 bond (Figure 3) of both molecules does not change appreciably from GS to TSs. However, the change in bond length in the GS and TS geometries is significant for the C5–N6 bond. In 1, it increases in syn-TS with 0.091 Å and in anti-TS with 0.083 Å. In 2, it increases in syn-TS with 0.087 Å and in anti-TS with 0.078 Å. In the GS, the C5–N6 bond adopts a partial double bond character (as indicated by the Wiberg Bond Index values of 1.298 and 1.237 for 1 and 2, respectively), but in the rotated TS, it becomes a single bond (Table 6). Moreover, the enamine nitrogen atom adopts a planar geometry in the GS, but it is pyramidalized in the TS. This is further supported by the calculated and observed C–N–H and H–N–H bond angles around the enamine nitrogen atom, which correspond to the sp2 hybridized nitrogen atom in the GS (Table 6). However, in the TS, the hybridization changes to sp3, as indicated by the respective bond angles (Figure 5). The above data indicate that the actual ground state geometry can be envisaged as a resonance hybrid of three structures (Figure 6). The left and middle structures represent the resonance of the amide bond, while the middle and right structures represent the resonance of the enamine bond. The left structure contains a double bond between C2 and N1 and this partial double bond is responsible for the observed barrier of the amide group. The right structure contains a double bond between C5 and N6 and this partial double bond is responsible for the observed barrier of the enamine group.
The insight obtained about the nature of the C5–N6 bond (Figure 3) from the NBO analysis agrees well with those acquired from the geometrical parameters. Our discussion of the NBO analysis of 1 and 2 repeats most of the conclusions made earlier on the origin of the enamine rotational barrier [43]. In GS, this bond has a partial double bond character, while, in TSs, it is a single bond and the nitrogen atom changes from sp2 in GS to a sp3 hybridized atom in TSs. The lone pair of electrons on N6 has reduced occupancy in the GS than in the TSs (Table 6) because, in the GS, a part of the electron density of the lone pair is delocalized into the antibonding orbital of the adjacent C–N double bond. Such delocalization is not possible in the TS as the participating orbitals are orthogonal to each other. The orbital housing the lone pair in the GS is an in-plane p orbital, but it attains some s character in the TS, thereby making the nitrogen atom more electronegative in the TS.
Natural charges computed at the same level of theory predict a higher negative charge for the N6 atom in the TSs (Table 7), which correlates well with the increased occupancy of N6 in the TS (Table 6). However, the charge on the C5 atom does not change appreciably in both the GS and TSs. On the other hand, the N4 atom, which is double bonded to C5, carries a higher negative charge in the GS.
The stabilization energies resulting from the delocalization of the N6 lone pair of electrons into the antibonding orbital of the neighboring C5–N4 double bond decrease from 1 to 2 (Table 8). Along with them, the rotational barrier also decreases from 1 to 2. This stabilizing interaction is responsible for the partial double bond character of the C5–N6 single bond in the GS (right structure of Figure 6) and therefore the barrier height.
The calculated main steric exchange energies (Table 9) for the GS and TS structures of 1 and 2 did not show significant differences that could explain the significant difference in the enamine barrier of 1 and 2.
All these data are consistent with our resonance-based explanation of the origin of the rotational barrier about the C5–N6 bond. This barrier has a purely electronic origin, which recently was demonstrated by the relationship between the C–N bond order difference and calculated energy barrier [20]. The proportion of experimentally determined enamine to amide barriers in 1 (18.6/16.4 = 1.13) is in very good agreement with the proportion of Wiberg bond orders (Table 10) of enamine to amide C–N bonds in GS of 1 (1.298/1.169 = 1.11).

3. Materials and Methods

3.1. Sample Preparation

The studied compound 1 was synthesized according to the previously described synthetic procedure [30].

3.2. Experimental Methods

1H and 13C spectra were recorded on a Bruker II+ 600 spectrometer (BBO probe, Bruker BioSpin GmbH, Ettlingen, Germany) at 600.13 for 1H NMR and 150.92 MHz for 13C NMR, with TMS as an internal standard for chemical shifts (δ, ppm). Two NMR samples (0.1 M solution of 1 in CDCl3 and 0.1 M solution of 1 in 1,1,2,2-tetrachloroethane-d2 (TCE)) were degassed under a vacuum and sealed. One drop of anisole was added to the second sample, the methyl group signal at 3.78 ppm of which was used as a reference for reference deconvolution (RD). The spectra in CDCl3 were recorded in steps of 5 K between 283 and 323 K, while the spectra in TCE-d2 were recorded in steps of 10 K between 263 K and 393 K. Temperature calibration was done with a B-VT 3000 unit (it was checked and calibrated with methanol and ethylene glycol reference samples). 1H NMR spectra were acquired using a spectral width of 10 kHz, an acquisition time of 3.4 s, and 32 scans, zerofilled to 64 k datapoints (0.15 Hz per point), and processed without apodization.
The 2D EXSY spectra (noesygpphzs) in CDCl3 were recorded on a BBO probe in steps of 5 K between 283 and 323 K. The spectra were acquired using a spectral width of 4.2 kHz, 2048 × 256 complex time domain datapoints, mixing times in the range of 0.03 to 1.5 s, and 2 scans in about 45 min. The spectra were zerofilled to 4096 × 4096 datapoints and processed with a shifted square sine bell apodization in both dimensions.
The 2D EXSY spectra in TCE-d2 were recorded on a BBO probe in steps of 10 K between 263 and 333 K. The spectra were acquired using a spectral width of 0.3 kHz, 2048 × 256 complex time domain data points, mixing times in the range of 0.03 to 1.5 s, and 2 scans in about 50 min. Linear prediction (32 coefficients and 256 points) in F1 was applied. The spectra were zerofilled to 4096 × 4096 data points and processed with a shifted square sine bell apodization in both dimensions. The measurement details and processing of the studied samples can be found in the Supporting Information. Exchange rates were calculated from diagonal and crosspeak integrals using EXSYCalc (MestreLab Research S.L.).
The relaxation rates T1 and T2 of the methyl group of the reference compound were measured in the temperature range 263–333 K (Table S5) using the tlir (inversion–recovery, T1) and cpmg (Carr–Purcell–Meiboom–Gill, T2) programs of the standard Topspin 3.6pl4 Bruker software. The measured T2 values were smoothed with an exponential temperature function (Figure S15). The estimated values were used in the reference deconvolution procedure in order to obtain spectra free from inhomogeneity broadening. An automatic correction of noise spikes was applied to the deconvoluted FIDs (Figure S16).
Reference deconvolution [34,35] was performed using a line broadening factor Δv1/2 = (πT°2)−1, where T°2 is the natural spin–spin relaxation time of the reference signal.
The spectra of the methyl groups of 1 at the lowest five temperatures were fitted with the DNMR module of the Topspin program, fixing the rate constants, known from the 2D EXSY experiments, and adjusting the T°2 values only. The calculated relaxation times T°2 were then fitted to an exponential function [44] and extrapolated for higher temperatures. In the following CLSA calculations, for the whole temperature range, only the rate constants were adjusted.
Error analysis: Usually, the presented errors in the activation parameters are statistical errors based on the scattering of the data points around the Eyring straight line only. The errors in this analysis are due to inaccuracies in both the calculated rate constants, k, and the measured temperatures, T, and are computed according to the error propagation equations of Binsch [45] and Heinzer and Oth [46]. The absolute error in temperature is assumed to be not more than ±0.5 K. The relative errors in k are estimated to be not more than ±10% at all temperatures according to the precision of the volume integration of peaks. The error analysis was performed using a self-made computer program using the cited equations.

3.3. Computational Methods

All calculations were performed by means of quantum chemical calculations at the density functional theory (DFT) level using the Gaussian16 Rev. C.01 program package [47] with tight optimization criteria.
The geometries of all compounds were fully optimized and the corresponding transition states were localized using the B3LYP [38] or M06-2X [39,40] functional with the 6-311++G (d,p) basis set [41]. The solvent effect was included implicitly in the optimizations via the SMD [42] model with the built-in parameters for solvents CHCl3 and acetone. As TCE is not, by default, parametrized within the SMD model implemented in Gaussian, the following parameters were used: eps = 8.42 (https://www.stenutz.eu/chem/dielectric_ri.php, accessed on 5 December 2023); epsinf = 2.028346 (nD20 = 1.495, epsinf = n2 = 2.235025); HBondAcidity = 0.16 [48]; HBondBasicity = 0.12 [48]; SurfaceTensionAtInterface = 52.031418 (https://www.stenutz.eu/chem/dielectric_ri.php, accessed on 5 December 2023); ElectronegativeHalogenicity = 0.667; CarbonAromaticity = 0.00. The nature of all critical points was confirmed by means of vibrational analysis.
The ∆H, ∆S, and ∆G values were calculated at T = 298.15 K at the same level of theory including zero-point energy in the particular solvent environment (represented by relative permittivity) and vibrational, rotational, and translational thermal energy corrections.
The NBO calculations were performed as they were implemented in the Gaussian16 Rev. C.01 program package [47]. We applied the 7.0 version of the NBO program to study the steric effects (keyword steric) [49]. The pyramidalization angles were determined according to the scheme proposed by Haddon [50].

4. Conclusions

The C–N rotational energy barriers for the N,N-dimethyl groups in two ends of compound 1 have been determined experimentally by dynamic NMR spectroscopy. As expected, the restricted rotation energy around the amide group is 16.4 kcal/mol, but an unexpectedly very high rotational barrier around the enamine group (18.6 kcal/mol) was measured.
From the classical viewpoint, the enamine barrier increases with the increasing bond order and there are good correlations between the bond order and barrier height. Theoretical calculations show that the origin of the barrier lies in the delocalization of the lone pair of electrons on the end nitrogen atom into the antibonding orbital of the adjacent C–N double bond in the ground state. In compound 1, the stabilization energy E(2) of this delocalization is much higher than the same energy in compound 2, and this explains the much higher enamine rotational barrier in 1.

Supplementary Materials

The following supporting information can be downloaded at: https://www.mdpi.com/article/10.3390/molecules28248004/s1, NMR spectra of compound 1, details of dynamic NMR studies of 1 in CDCl3, and TCE-d2 and DFT geometries of 1 and 2.

Author Contributions

Conceptualization, N.G.V. and I.C.I.; methodology, N.G.V.; formal analysis, N.G.V.; investigation, N.G.V.; resources, N.G.V.; visualization, N.G.V. and I.C.I.; writing—original draft preparation, N.G.V.; writing—review and editing, N.G.V. and I.C.I. All authors have read and agreed to the published version of the manuscript.

Funding

This research was funded by the Bulgarian Science Fund, grant number KP-06-H29/6.

Institutional Review Board Statement

Not applicable.

Informed Consent Statement

Not applicable.

Data Availability Statement

The data are available within the article and its Supplementary Materials.

Acknowledgments

Research equipment of Distributed Research Infrastructure INFRAMAT, part of the Bulgarian National Roadmap for Research Infrastructures, supported by the Bulgarian Ministry of Education and Science, was used in this investigation. We acknowledge the provided access to the e-infrastructure of the NCHDC, part of the Bulgarian National Roadmap on RIs, with the financial support by the Grant No D01-168/28.07.2022. This work is partly supported by the European Regional Development Fund within the Operational Program Science and Education for Smart Growth 2014–2020 under the Project Center of Excellence: National center of mechatronics and clean technologies BG05M2OP001-1.001-0008.

Conflicts of Interest

The authors declare no conflict of interest.

References

  1. Chakrabarti, P.; Dunitz, J.D. Structural Characteristics of the Carboxylic Amide Group. Helvetica Chim. Acta 1982, 65, 1555–1562. [Google Scholar] [CrossRef]
  2. Hirota, E.; Sugisaki, R.; Nielsen, C.J.; Sørensen, G.O. Molecular structure and internal motion of formamide from microwave spectrum. J. Mol. Spectrosc. 1974, 49, 251–267. [Google Scholar] [CrossRef]
  3. LeMaster, C.B. Nuclear magnetic resonance spectroscopy of molecules in the gas phase. Prog. Nucl. Magn. Reson. Spectrosc. 1997, 31, 119–154. [Google Scholar] [CrossRef]
  4. Taha, A.N.; True, N.S. Experimental H-1 NMR and computational studies of internal rotation of solvated formamide. J. Phys. Chem. A 2000, 104, 2985–2993. [Google Scholar] [CrossRef]
  5. Taha, A.N.; Neugebauer-Crawford, S.M.; True, N.S. Gas-phase 1H NMR studies of internal rotation barriers and conformer stabilities of N-ethyl, N-methylthioamides. J. Phys. Chem. A 2000, 104, 7957–7963. [Google Scholar] [CrossRef]
  6. LeMaster, C.L.; LeMaster, C.B.; True, N.S. Gas-phase nuclear magnetic resonance study of (N-15)trifluoroacetamide: Comparison of experimental and computed kinetic parameters. J. Am. Chem. Soc. 1999, 121, 4478–4484. [Google Scholar] [CrossRef]
  7. Taha, A.N.; Neugebauer Crawford, S.M.; True, N.S. Determination of the internal rotation barrier of [15N]formamide from gas-phase 1H NMR spectra. J. Am. Chem. Soc. 1998, 120, 1934–1935. [Google Scholar] [CrossRef]
  8. Taha, A.N.; Neugebauer Crawford, S.M.; True, N.S. Gas-phase 1H NMR studies of internal rotation activation energies and conformer stabilities of asymmetric N,N-disubstituted formamides and trifluoroacetamides. J. Phys. Chem. A 1998, 102, 1425–1430. [Google Scholar] [CrossRef]
  9. Neugebauer Crawford, S.M.; Taha, A.N.; True, N.S.; LeMaster, C.B. Gas-phase NMR studies of N,N-dimethylthioamides. Influence of the thiocarbonyl substituent on the internal rotation activation energies. J. Phys. Chem. A 1997, 101, 4699–4706. [Google Scholar]
  10. Stewart, W.E.; III, T.H.S. Nmr studies of amides. Chem. Rev. 1970, 70, 517–551. [Google Scholar] [CrossRef]
  11. Wiberg, K.B.; Laidig, K.E. Barriers to rotation adjacent to double bonds. 3. The C-O barrier in formic acid, methyl formate, acetic acid and methyl acetate. The origin of ester and amide “resonance”. J. Am. Chem. Soc. 1987, 109, 5935–5943. [Google Scholar] [CrossRef]
  12. Wong, M.W.; Wiberg, K.B. Structure of acetamide: Planar or nonplanar? J. Phys. Chem. 1992, 96, 668–671. [Google Scholar] [CrossRef]
  13. Wiberg, K.B.; Rablen, P.R. Why Does Thioformamide Have a Larger Rotational Barrier Than Formamide. J. Am. Chem. Soc. 1995, 117, 2201–2209. [Google Scholar] [CrossRef]
  14. Wiberg, K.B.; Rablen, P.R.; Rush, D.J.; Keith, T.A. Amides. 3. Experimental and theoretical studies of the effect of the medium on the rotational barriers for N,N-dimethylformamide and N,N-dimethylacetamide. J. Am. Chem. Soc. 1995, 117, 4261–4270. [Google Scholar] [CrossRef]
  15. Wiberg, K.B.; Rush, D.J. Solvent effects on the thioamide rotational barrier: An experimental and theoretical study. J. Am. Chem. Soc. 2001, 123, 2038–2046. [Google Scholar] [CrossRef] [PubMed]
  16. Wiberg, K.B.; Rush, D.J. Methyl rotational barriers in amides and thioamides. J. Org. Chem. 2002, 67, 826–830. [Google Scholar] [CrossRef] [PubMed]
  17. Ilieva, S.; Hadjieva, B.; Galabov, B. Ab initio molecular orbital study of the conformation of amide group: O-methylformanilide. J. Mol. Struct. 1999, 476, 151–156. [Google Scholar] [CrossRef]
  18. Ilieva, S.; Hadjieva, B.; Galabov, B. Theory supplemented by experiment. Electronic effects on the rotational stability of the amide group in p-substituted acetanilides. J. Org. Chem. 2002, 67, 6210–6215. [Google Scholar] [CrossRef]
  19. Galabov, B.; Ilieva, S.; Hadjieva, B.; Dinchova, E. On the origin of higher rotational barriers in thioamides than in amides. Remote substituent effects on the conformational stability of the thioamide group in thioacetanilides. J. Phys. Chem. A 2003, 107, 5854–5861. [Google Scholar] [CrossRef]
  20. Vassilev, N.G. Ab initio SCF study of the barrier to internal rotation in N,N-dimethylcinnamamides. Bulg. Chem. Commun. 2008, 40, 526–531. [Google Scholar]
  21. Spassov, S.L.; Dimitrov, V.S.; Agova, M.; Kantschowska, I.; Todorova, R. Nuclear Magnetic Resonance Studies of Internal Rotation-III. Rotational Barriers in Meta- and Para-Substituted N,N-Dimethyl Cinnamamides. Org. Magn. Reson. 1971, 3, 551. [Google Scholar] [CrossRef]
  22. Spaargaren, K.; Korver, P.K.; van der Haak, P.J.; de Boer, T.J. Spectroscopic studies on N,N-dimethyl-amides-III. Amide-rotational barriers of N,N-dimethylbenzamides and cinnamamides. A comparison of the NMR intensity ratio and iterative total line shape method. Org. Magn. Reson. 1971, 3, 605–614. [Google Scholar] [CrossRef]
  23. Velkov, Z.; Velkov, Y.; Balabanova, E.; Tadjer, A. First principle study of the structure of conjugated amides and thioamides. Int. J. Quantum Chem. 2007, 107, 1765–1771. [Google Scholar] [CrossRef]
  24. Velkov, Z.; Balabanova, E.; Tadjer, A. Radical scavenging activity prediction of o-coumaric acid thioamide. J. Mol. Struct. Theochem. 2007, 821, 133–138. [Google Scholar] [CrossRef]
  25. Mondal, A.; Toyoda, R.; Costil, R.; Feringa, B.L. Chemically Driven Rotatory Molecular Machines. Angew. Chem. Int. Ed. 2022, 61, e202206631. [Google Scholar] [CrossRef] [PubMed]
  26. Aprahamian, I. The Future of Molecular Machines. ACS Central Sci. 2020, 6, 347–358. [Google Scholar] [CrossRef] [PubMed]
  27. Kottas, G.S.; Clarke, L.I.; Horinek, D.; Michl, J. Artificial Molecular Rotors. Chem. Rev. 2005, 105, 1281–1376. [Google Scholar] [CrossRef] [PubMed]
  28. Scott, M.D.; Spedding, H. Vilsmeier adducts of dimethylformamide. J. Chem. Soc. C Org. 1968, 1603–1609. [Google Scholar] [CrossRef]
  29. Dozorova, E.N.; Grizik, S.I.; Granik, V.G. Lactam and amide acetals. 56. Synthesis of pyrimidines from N-carbamoylamidines. Chem. Heterocycl. Compd. 1990, 26, 70–73. [Google Scholar] [CrossRef]
  30. Kantlehner, W.; Ivanov, I.C.; Tiritiris, I. Orthoamides and iminium salts, LXXV [1]. Contribution to the formation of 2-formyl-1,1,3,3-tetramethylguanidine and the isomeric 1,1-Dimethyl-3-dimethylaminomethylene-urea. Zeitschrift für Naturforschung B. 2012, 67, 331–336. [Google Scholar]
  31. Martin, G.J.; Gouesnard, J.-P. Resonance magnetique dynamique du carbone III contribution a l’etude du pouvoir attracteur et transmetteur d’electrons de groupements insatures dans une serie d’enamines et d’amides. Tetrahedron Lett. 1975, 16, 4251–4254. [Google Scholar] [CrossRef]
  32. Denkova, P.S.; Dimitrov, V.S. Combined use of complete lineshape analysis of 1D spectra subjected to reference deconvolution and linear prediction, 2D-EXSY spectra and a double fitting method for the study of chemical exchange. Application to an eight-site exchange system. Magn. Reson. Chem. 1999, 37, 637–646. [Google Scholar] [CrossRef]
  33. Mladenov, G.; Dimitrov, V.S. Extraction of T2 from NMR linewidths in simple spin systems by use of reference deconvolution. Magn. Reson. Chem. 2001, 39, 672–680. [Google Scholar] [CrossRef]
  34. Morris, G.A. Compensation of instrumental imperfections by deconvolution using an internal reference signal. J. Magn. Reson. 1988, 80, 547–552. [Google Scholar] [CrossRef]
  35. Morris, G.A.; Barjat, H.; Home, T.J. Reference deconvolution methods. Prog. Nucl. Magn. Reson. Spectrosc. 1997, 31, 197–257. [Google Scholar] [CrossRef]
  36. Vassilev, N. Reference Deconvolution: Signal-to-Noise Enhancement by Automatic Correction of Noise Spikes in NMR Spectrum in the Time Domain. J. Bulg. Acad. Sci. 2010, 4, 49–53. [Google Scholar]
  37. Vassilev, N.G.; Dimitrov, V.S. Dynamic NMR: Combined use of 1D selective EXSY and complete lineshape analysis of spectra subjected to reference deconvolution and linear prediction or the maximum entropy method. Magn. Reson. Chem. 2001, 39, 607–614. [Google Scholar] [CrossRef]
  38. Becke, A.D. Density-functional thermochemistry. III. The role of exact exchange. J. Chem. Phys. 1993, 98, 5648–5652. [Google Scholar] [CrossRef]
  39. Zhao, Y.; Truhlar, D.G. Density Functionals with Broad Applicability in Chemistry. Acc. Chem. Res. 2008, 41, 157–167. [Google Scholar] [CrossRef]
  40. Zhao, Y.; Truhlar, D.G. The M06 suite of density functionals for main group thermochemistry, thermochemical kinetics, noncovalent interactions, excited states, and transition elements: Two new functionals and systematic testing of four M06-class functionals and 12 other functionals. Theor. Chem. Acc. 2008, 120, 215–241. [Google Scholar] [CrossRef]
  41. Hariharan, P.C.; Pople, J.A. The influence of polarization functions on molecular orbital hydrogenation energies. Theor. Chem. Acta 1973, 28, 213–222. [Google Scholar] [CrossRef]
  42. Marenich, A.V.; Cramer, C.J.; Truhlar, D.G. Universal solvation model based on solute electron density and on a continuum model of the solvent defined by the bulk dielectric constant and atomic surface tensions. J. Phys. Chem. B 2009, 113, 6378–6396. [Google Scholar] [CrossRef] [PubMed]
  43. Thakur, A.J.; Das, S.; Phukan, A.K. Replay of amide type resonance in 6-[(dimethylamino)methylene]1,3-dimethylaminouracil: A dynamic NMR and density functional theory study. J. Mol. Struct. 2009, 929, 134–140. [Google Scholar] [CrossRef]
  44. Dimitrov, V.S.; Ladd, J.A. A double-fitting procedure for two-site exchange analysis. J. Magn. Reson. 1979, 36, 401–409. [Google Scholar] [CrossRef]
  45. Binsch, G. Dynamic NMR Spectroscopy; Jackman, L.M., Cotton, F.A., Eds.; Academic Press: New York, NY, USA, 1975; pp. 45–82. [Google Scholar]
  46. Heinzer, J.; Oth, J.F.M. Iterative Least-Squares Lineshape Fitting of H-1-Decoupled C-13-Dnmr Spectra. Helvetica Chim. Acta 1981, 64, 258–278. [Google Scholar] [CrossRef]
  47. Frisch, M.J.; Trucks, G.W.; Schlegel, H.B.; Scuseria, G.E.; Robb, M.A.; Cheeseman, J.R.; Scalmani, G.; Barone, V.; Petersson, G.A.; Nakatsuji, H.; et al. Gaussian 16, Revision C.01; Gaussian, Inc.: Wallingford, CT, USA, 2019. [Google Scholar]
  48. Abraham, M.H.; Andonian-Haftvan, J.; Whiting, G.S.; Leo, A.; Taft, R.S. Hydrogen bonding. Part 34. The factors that influence the solubility of gases and vapours in water at 298 K, and a new method for its determination. J. Chem. Soc. Perkin Trans. 2 1994, 1777–1791. [Google Scholar] [CrossRef]
  49. Glendening, E.D.; Landis, C.R.; Weinhold, F. NBO 7.0: New vistas in localized and delocalized chemical bonding theory. J. Comput. Chem. 2019, 40, 2234–2241. [Google Scholar] [CrossRef]
  50. Haddon, R.C. Comment on the Relationship of the Pyramidalization Angle at a Conjugated Carbon Atom to the σ Bond Angles. J. Phys. Chem. A 2001, 105, 4164–4165. [Google Scholar] [CrossRef]
Figure 1. Structures of studied N,N-dimethylamide derivatives. 1—3-[(E)-(dimethylamino)methylidene]-1,1-dimethylurea, 2—(E)-3-(dimethylamino)-N,N-dimethylacrylamide.
Molecules 28 08004 g001
Figure 2. Stacked plot of 1H NMR spectra of compound 1 in TCE-d2 at different temperatures.
Molecules 28 08004 g002
Figure 3. EXSY spectrum of complex 1 in TCE-d2 at 313 K using mixing time of 1.0 s.
Molecules 28 08004 g003
Figure 4. Eyring plot of rate constants of restricted rotation around amide and enamine bonds using 2D EXSY and CLSA rate constants. The origin of the data is given in the inset.
Molecules 28 08004 g004
Figure 5. SMD (CDCl3)/B3LYP/6-311++G (d,p) optimized GS and TS structures of compound 1. Top row: the ground state and X-ray structures; middle: the syn and anti transition state structures for the rotation of the N,N-dimethylamido group; bottom: the syn and anti transition state structures for the rotation of the N,N-dimethylenamino group. Red balls—oxygen, blue balls—nitrogen, big grey balls—carbon and small grey balls—hydrogen.
Molecules 28 08004 g005
Figure 6. The resonance structures of compound 1.
Molecules 28 08004 g006
Table 1. Activation parameters of compound 1 for the amide-restricted rotation calculated using different theoretical methods and compared with experiment.
MethodΔH(298 K)ΔS(298 K)ΔG(298 K)ΔG(298 K)eff
1 1 17.2
2 2 16.5
3 3 16.6
4 4 16.8
2D EXSY in CDCl315.3 ± 1.1−3.9 ± 3.716.4 ± 0.1
2D EXSY in TCE-d214.9 ± 0.5−5.0 ± 1.916.4 ± 0.1
CLSA in TCE-d214.4 ± 0.4−6.7 ± 1.416.4 ± 0.1
All data in TCE-d214.4 ± 0.3−6.7 ± 1.016.4 ± 0.1
1 SMD (CDCl3)/B3LYP/6-311++G (d,p). 2 SMD (CDCl3)/M062X/6-311++G (d,p). 3 SMD (TCE)/B3LYP/6-311++G (d,p). 4 SMD (TCE)/M062X/6-311++G (d,p). ΔG(298 K)eff is calculated by summing up the rates through the two possible TS.
Table 2. Activation parameters of compound 1 for the enamine-restricted rotation calculated using different theoretical methods and compared with experiment.
MethodΔH(298 K)ΔS(298 K)ΔG(298 K)ΔG(298 K)eff
1 1 20.7
2 2 20.3
3 3 21.0
4 4 21.3
2D EXSY in CDCl319.3 ± 1.02.2 ± 2.418.6 ± 0.1
2D EXSY in TCE-d221.6 ± 0.89.1 ± 2.518.9 ± 0.1
CLSA in TCE-d220.9 ± 0.86.2 ± 2.019.1 ± 0.1
All data in TCE-d219.8 ± 0.53.2 ± 1.218.8 ± 0.1
1 SMD (CDCl3)/B3LYP/6-311++G (d,p). 2 SMD (CDCl3)/M062X/6-311++G (d,p). 3 SMD (TCE)/B3LYP/6-311++G (d,p). 4 SMD (TCE)/M062X/6-311++G (d,p). ΔG(298 K)eff is calculated by summing up the rates through the two possible TS.
Table 3. Activation parameters of compound 2 for the amide-restricted rotation calculated using different theoretical methods and compared with experiment.
MethodΔH(298 K)ΔS(298 K)ΔG(298 K)ΔG(298 K)eff
A 1 12.5
B 2 12.8
C 3 12.5
D 4 14.1
Experiment in Acetone-d6 [31] 12.4 (Tc = 253 K)
1 SMD (CDCl3)/B3LYP/6-311++G (d,p). 2 SMD (CDCl3)/M062X/6-311++G (d,p). 3 SMD (TCE)/B3LYP/6-311++G (d,p). 4 SMD (TCE)/M062X/6-311++G (d,p). ΔG(298 K)eff is calculated by summing up the rates through the two possible TS.
Table 4. Activation parameters of compound 2 for the enamine-restricted rotation calculated using different theoretical methods and compared with experiment.
MethodΔH(298 K)ΔS(298 K)ΔG(298 K)ΔG(298 K)eff
A 1 12.4
B 2 12.1
C 3 11.8
D 4 13.8
Experiment in Acetone-d6 [31] 11.7 (Tc = 253 K)
1 SMD (CDCl3)/B3LYP/6-311++G (d,p). 2 SMD (CDCl3)/M062X/6-311++G (d,p). 3 SMD (TCE)/B3LYP/6-311++G (d,p). 4 SMD (TCE)/M062X/6-311++G (d,p). ΔG(298 K)eff is calculated by summing up the rates through the two possible TS.
Table 5. Comparison of experimental and calculated 1 structural parameters of compound 1 as well as calculated 1 structural parameters of compound 2.
Bonds1 (exptl.)1 (calcd.)2 (calcd.)
N1–C21.3631.3701.369
C2–O31.2401.2411.237
C2–X41.3971.4011.468
X4–C51.3091.3011.360
C5–N61.3271.3381.346
N1–C2–O3120.2121.3120.8
O3–C2–N4125.9124.8122.2
C2–N4–C5113.6115.0118.0
N4–C5–N6122.2123.5126.8
1 SMD (CDCl3)/B3LYP/6-311++G (d,p) geometry.
Table 6. Hybridization of the lone pair of electrons at enamine N, pyramidalization angle, and rotational barrier calculated at SMD (CDCl3)/B3LYP/6-311++G (d,p) level of theory.
MoleculeOccupancys (%)p (%)Pyramidalization Angle, θ (in Degrees)Rotational Barrier (kcal/mol)
1-GS1.6160.3099.682.020.7
1-syn-TS1.89513.6386.3316.9
1-anti-TS1.89216.0383.9218.5
2-GS1.6581.3898.614.512.4
2-syn-TS1.88912.3787.6015.8
2-anti-TS1.89415.4384.5318.4
Table 7. Natural charges of the heavy atom framework calculated at the SMD (CDCl3)/B3LYP/6-311++G (d,p) level of theory (for numbering, see Figure 3).
MoleculeN1C2O3X4C5N6
1-GS−0.4950.799−0.743−0.6880.365−0.436
1-syn-TS−0.4820.796−0.694−0.5460.401−0.606
1-anti-TS−0.4820.797−0.695−0.5310.391−0.592
2-GS−0.5030.652−0.742−0.4730.122−0.452
2-syn-TS−0.4790.653−0.697−0.3270.107−0.590
2-anti-TS−0.4790.653−0.702−0.3170.098−0.588
Table 8. NBO second-order stabilization energies E(2) (kcal mol−1) corresponding to the main interactions in compounds 1 and 2 calculated at SMD (CDCl3)/B3LYP/6-311++G (d,p) level of theory.
Interactions1-GS1-syn-TS1-anti-TS2-GS2-syn-TS2-anti-TS
lpN6 -> π* (X4–C5)70.30 53.31
lpN6 -> σ* (X4–C5) 8.634.60 7.332.30
lpO3 -> π* (C2–N1)21.5321.5921.6625.4922.4822.51
lpO3 -> π* (C2–X4)21.6524.6024.4017.3017.4317.19
lpN1 -> π* (C2–O3)28.7037.1136.1645.5358.8665.84
Π (X4–C5) -> π* (C2–O3)14.1812.8412.6521.1215.9716.79
Table 9. Selected pairwise steric exchange energies dE (i,j) (kcal/mol) from NBO analysis for disjoint (no common atoms) interactions between NLMOs i,j.
Steric Interactions1-GS1-syn-TS1-anti-TS2-GS2-syn-TS2-anti-TS
lpN6 ↔ π*(X4–C5)15.91 16.95
lpN6 ↔ σ*(X4–C5) 7.023.91 7.695.17
lpN6 ↔ σ*(C5–H) 7.867.38 9.067.94
lpN6 ↔ σ*(C8–H)3.591.872.291.141.932.40
lpN6 ↔ σ*(C8–H)1.7510.382.294.6310.682.37
lpN6 ↔ σ*(C8–H)10.482.949.4810.343.129.35
lpN6 ↔ σ*(C7–H)7.591.842.376.351.912.43
lpN6 ↔ σ*(C7–H)8.743.019.569.973.189.37
lpN6 ↔ σ*(C7–H) 10.422.24 10.722.38
lpN6 ↔ σ*(X4–H) 0.621.25
Table 10. Calculated Wiberg bond orders of compound 1 (2) in the NAO basis and SMD (CDCl3)/B3LYP/6-311++G (d,p) geometry.
MoleculeAmide C–NEnamine C–NC=OC=X
1-GS1.169 1.2981.5241.519
1-syn-TS1.2070.9821.5781.842
1-anti-TS1.2090.9861.5761.850
2-GS1.1581.2371.5141.598
2-syn-TS1.2040.9861.5631.873
2-anti-TS1.2050.9911.5581.872
Disclaimer/Publisher’s Note: The statements, opinions and data contained in all publications are solely those of the individual author(s) and contributor(s) and not of MDPI and/or the editor(s). MDPI and/or the editor(s) disclaim responsibility for any injury to people or property resulting from any ideas, methods, instructions or products referred to in the content.

