
Density Functional Theory Investigation of Temperature-Dependent Properties of Cu-Nitrogen-Doped Graphene as a Cathode Material in Fuel Cell Applications

 ,
,  ,
,  and
and 
Abstract
:
1. Introduction
2. Results and Discussion
2.1. Stability and Reactivity
2.2. ORR Steps and Binding Energy
2.3. Reaction Spontaneity
3. Methodology
4. Conclusions
Author Contributions
Funding
Data Availability Statement
Acknowledgments
Conflicts of Interest
References
- Antolini, E. Carbon supports for low-temperature fuel cell catalysts. Appl. Catal. B Environ. 2009, 88, 1–24. [Google Scholar] [CrossRef]
- Stephen Walch, A.D. Masoud Aryanpour, and Heinz Pitsch. Mechanism of Molecular Oxygen Reduction at the Cathode of a PEM Fuel Cell Non-Electrochemical Reactions on Catalytic Pt Particles. J. Phys. Chem. 2008, 112, 8464–8475. [Google Scholar]
- Roland, U.; Braunschweig, T.; Roessner, F. On the nature of spilt-over hydrogen. J. Mol. Catal. A Chem. 1997, 127, 61–84. [Google Scholar] [CrossRef]
- Curtis Conner, W.; Pajonk, G.M.; Teichner, S.J. Spillover of Sorbed Species. In Advances in Catalysis; Academic Press: Cambridge, MA, USA, 1986; pp. 1–79. [Google Scholar]
- Lin, R.; Cai, X.; Hao, Z.; Pu, H.; Yan, H. Rapid microwave-assisted solvothermal synthesis of shape-controlled Pt-Ni alloy nanoparticles for PEMFC. Electrochim. Acta 2018, 283, 764–771. [Google Scholar] [CrossRef]
- Guan, D.; Xu, H.; Zhang, Q.; Huang, Y.C.; Shi, C.; Chang, Y.C.; Xu, X.; Tang, J.; Gu, Y.; Pao, C.W.; et al. Identifying a Universal Activity Descriptor and a Unifying Mechanism Concept on Perovskite Oxides for Green Hydrogen Production. Adv. Mater. 2023, 35, 2305074. [Google Scholar] [CrossRef] [PubMed]
- Sidik, R.A.; Anderson, A.B.; Subramanian, N.P.; Kumaraguru, S.P.; Popov, B.N. O2 Reduction on Graphite and Nitrogen-Doped Graphite Experiment and Theory. J. Phys. Chem 2006, 110, 1787–1793. [Google Scholar] [CrossRef] [PubMed]
- Lee, K.R.; Lee, K.U.; Lee, J.W.; Ahn, B.T.; Woo, S.I. Electrochemical oxygen reduction on nitrogen doped graphene sheets in acid media. Electrochem. Commun. 2010, 12, 1052–1055. [Google Scholar] [CrossRef]
- Zhang, L.; Xia, Z. Mechanisms of Oxygen Reduction Reaction on Nitrogen-Doped Graphene for Fuel Cells. J. Phys. Chem. C 2011, 115, 11170–11176. [Google Scholar] [CrossRef]
- Rao, C.V.; Cabrera, C.R.; Ishikawa, Y. In Search of the Active Site in Nitrogen-Doped Carbon Nanotube Electrodes for the Oxygen Reduction Reaction. J. Phys. Chem. Lett. 2010, 1, 2622–2627. [Google Scholar] [CrossRef]
- Lin, R.; Che, L.; Shen, D.; Cai, X. High durability of Pt-Ni-Ir/C ternary catalyst of PEMFC by stepwise reduction synthesis. Electrochim. Acta 2020, 330, 135251. [Google Scholar] [CrossRef]
- Beermann, V.; Holtz, M.E.; Padgett, E.; de Araujo, J.F.; Muller, D.A.; Strasser, P. Real-time imaging of activation and degradation of carbon supported octahedral Pt–Ni alloy fuel cell catalysts at the nanoscale using in situ electrochemical liquid cell STEM. Energy Environ. Sci. 2019, 12, 2476–2485. [Google Scholar] [CrossRef]
- Pinheiro, A.L.N.; Oliveira-Neto, A.; de Souza, E.C.; Perez, J.; Paganin, V.A.; Ticianelli, E.A.; Gonzalez, E.R. Electrocatalysis-on-Noble-Metal-and-Noble-Metal-Alloys-Dispersed-on-High-Surface-Area-Carbon. J. New Mater. Electrochem. Syst. 2003, 6, 1–8. [Google Scholar]
- Salam, M.A.; Habib, M.S.; Ahmed, K.; Uddin, M.S.; Hossain, T.; Papri, N.; Arefin, P. Effect of temperature on the performance factors and durability of proton exchange membrane of hydrogen fuel cell: A narrative review. Mater. Sci. Res. India (Online) 2020, 17, 179–191. [Google Scholar] [CrossRef]
- Chandan, A.; Hattenberger, M.; El-Kharouf, A.; Du, S.; Dhir, A.; Self, V.; Pollet, B.G.; Ingram, A.; Bujalski, W. High temperature (HT) polymer electrolyte membrane fuel cells (PEMFC)–A review. J. Power Sources 2013, 231, 264–278. [Google Scholar] [CrossRef]
- Esfeh, H.K.; Hamid, M.K.A. Temperature effect on proton exchange membrane fuel cell performance Part II: Parametric study. Energy Procedia 2014, 61, 2617–2620. [Google Scholar] [CrossRef]
- Jourdani, M.; Mounir, H.; Marjani, A.E. Latest trends and challenges in proton exchange membrane fuel cell (PEMFC). Open Fuels Energy Sci. J. 2017, 10, 96–105. [Google Scholar] [CrossRef]
- Li, C.; Liu, Y.; Xu, B.; Ma, Z. Finite time thermodynamic optimization of an irreversible proton exchange membrane fuel cell for vehicle use. Processes 2019, 7, 419. [Google Scholar] [CrossRef]
- Ferraris, A.; Messana, A.; Airale, A.G.; Sisca, L.; de Carvalho Pinheiro, H.; Zevola, F.; Carello, M. Nafion® tubing humidification system for polymer electrolyte membrane fuel cells. Energies 2019, 12, 1773. [Google Scholar] [CrossRef]
- Guan, D.; Shi, C.; Xu, H.; Gu, Y.; Zhong, J.; Sha, Y.; Hu, Z.; Ni, M.; Shao, Z. Simultaneously mastering operando strain and reconstruction effects via phase-segregation strategy for enhanced oxygen-evolving electrocatalysis. J. Energy Chem. 2023, 82, 572–580. [Google Scholar] [CrossRef]
- Khotseng, L. Fuel cell thermodynamics. In Pem Fuel Cell Testing and Diagnosis; Elsevier: Amsterdam, The Netherlands, 2019; pp. 25–75. [Google Scholar]
- Maass, S.; Finsterwalder, F.; Frank, G.; Hartmann, R.; Merten, C. Carbon support oxidation in PEM fuel cell cathodes. J. Power Sources 2008, 176, 444–451. [Google Scholar] [CrossRef]
- Zhang, J.; Zhang, H.; Wu, J.; Zhang, J. The effects of temperature on PEM fuel cell kinetics and performance. Pem. Fuel Cell Test. Diagn. 2013, 121–141. [Google Scholar]
- Zeis, R. Materials and characterization techniques for high-temperature polymer electrolyte membrane fuel cells. Beilstein J. Nanotechnol. 2015, 6, 68–83. [Google Scholar] [CrossRef]
- Orellana, W. Catalytic Properties of Transition Metal–N4 Moieties in Graphene for the Oxygen Reduction Reaction: Evidence of Spin-Dependent Mechanisms. J. Phys. Chem. C 2013, 117, 9812–9818. [Google Scholar] [CrossRef]
- Khotseng, L. Oxygen Reduction Reaction. In Electrocatalysts for Fuel Cells and Hydrogen Evolution—Theory to Design; BoD–Books on Demand: Norderstedt, Germany, 2018. [Google Scholar]
- Liu, K.; Qiao, Z.; Hwang, S.; Liu, Z.; Zhang, H.; Su, D.; Xu, H.; Wu, G.; Wang, G. Mn- and N- doped carbon as promising catalysts for oxygen reduction reaction: Theoretical prediction and experimental validation. Appl. Catal. B Environ. 2019, 243, 195–203. [Google Scholar] [CrossRef]
- Kattel, S.; Atanassov, P.; Kiefer, B. Catalytic activity of Co-N(x)/C electrocatalysts for oxygen reduction reaction: A density functional theory study. Phys. Chem. Chem. Phys. 2013, 15, 148–153. [Google Scholar] [CrossRef]
- Chen, C.; Sun, M.; Wang, K.; Li, Y. Dual-metal single-atomic catalyst: The challenge in synthesis, characterization, and mechanistic investigation for electrocatalysis. SmartMat 2022, 3, 533–564. [Google Scholar] [CrossRef]
- Zhang, N.; Zhou, T.; Ge, J.; Lin, Y.; Du, Z.; Zhong, C.A.; Wang, W.; Jiao, Q.; Yuan, R.; Tian, Y.; et al. High-Density Planar-like Fe2N6 Structure Catalyzes Efficient Oxygen Reduction. Matter 2020, 3, 509–521. [Google Scholar] [CrossRef]
- Masa, J.; Zhao, A.; Xia, W.; Muhler, M.; Schuhmann, W. Metal-free catalysts for oxygen reduction in alkaline electrolytes: Influence of the presence of Co, Fe, Mn and Ni inclusions. Electrochim. Acta 2014, 128, 271–278. [Google Scholar] [CrossRef]
- Na Yang, L.P.; Li, L.; Jing, L.; Qiang, L.; Minhua, S.; Zidong, W. Theoretically probing the possible degradation mechanisms of an FeNC catalyst during the oxygen reduction reaction. Chem. Sci. 2021, 12, 12476–12484. [Google Scholar] [CrossRef]
- Xie, X.; He, C.; Li, B.; He, Y.; Cullen, D.A.; Wegener, E.C.; Kropf, A.J.; Martinez, U.; Cheng, Y.; Engelhard, M.H.; et al. Performance enhancement and degradation mechanism identification of a single-atom Co–N–C catalyst for proton exchange membrane fuel cells. Nat. Catal. 2020, 3, 1044–1054. [Google Scholar] [CrossRef]
- Xiao, Y.; Zhang, W. DFT analysis elementary reaction steps of catalytic activity for ORR on metal-, nitrogen- co-doped graphite embedded structure. SN Appl. Sci. 2020, 2, 194. [Google Scholar] [CrossRef]
- Bhatt, M.D.; Lee, G.; Lee, J.S. Density Functional Theory (DFT) Calculations for Oxygen Reduction Reaction Mechanisms on Metal-, Nitrogen- co-doped Graphene (M-N2-G (M = Ti, Cu, Mo, Nb and Ru)) Electrocatalysts. Electrochim. Acta 2017, 228, 619–627. [Google Scholar] [CrossRef]
- Balasooriya, Y.; Samarasekara, P.; Lim, C.M.; Chau, Y.-F.C.; Kooh, M.R.R.; Thotagamuge, R. Cu-Nitrogen doped graphene (Cu–N/Gr) nanocomposite as cathode catalyst in fuel cells–DFT study. Heliyon 2023, 9, e15989. [Google Scholar] [CrossRef] [PubMed]
- Glossman-Mitnik, D. Computational Study of the Chemical Reactivity Properties of the Rhodamine B Molecule. Procedia Comput. Sci. 2013, 18, 816–825. [Google Scholar] [CrossRef]
- Chattaraj, P.K.; Giri, S. Electrophilicity index within a conceptual DFT framework. Annu. Rep. Sect. "C" (Phys. Chem.) 2009, 105, 13–39. [Google Scholar] [CrossRef]
- Parr, R.G.; Szentpaly, L.v.; Liu, S. Electrophilicity Index. J. Am. Chem. Soc. 1999, 121, 1922–1924. [Google Scholar] [CrossRef]
- Syaahiran, A.; Lim, C.M.; Kooh, M.R.R.; Mahadi, A.H.; Chau, Y.-F.C.; Thotagamuge, R. A theoretical insight of Cr dopant in tungsten oxide for gas sensor application. Mater. Today Commun. 2021, 28, 102508. [Google Scholar] [CrossRef]
- Yang, X.; Priest, C.; Hou, Y.; Wu, G. Atomically dispersed dual-metal-site PGM-free electrocatalysts for oxygen reduction reaction: Opportunities and challenges. SusMat 2022, 2, 569–590. [Google Scholar] [CrossRef]
- Syaahiran, M.A.; Mahadi, A.H.; Lim, C.M.; Kooh, M.R.R.; Chau, Y.C.; Chiang, H.P.; Thotagamuge, R. Theoretical Study of CO Adsorption Interactions with Cr-Doped Tungsten Oxide/Graphene Composites for Gas Sensor Application. ACS Omega 2022, 7, 528–539. [Google Scholar] [CrossRef]
- Watanabe, N.; Yamazaki, M.; Takahashi, M. Vibrational effects on valence electron momentum distributions of ethylene. J. Chem. Phys. 2012, 137, 114301. [Google Scholar] [CrossRef] [PubMed]
- Panick, G.; Malessa, R.; Winter, R. Differences between the pressure-and temperature-induced denaturation and aggregation of β-lactoglobulin A, B, and AB monitored by FT-IR spectroscopy and small-angle X-ray scattering. Biochemistry 1999, 38, 6512–6519. [Google Scholar] [CrossRef] [PubMed]
- Noh, S.H.; Kwak, D.H.; Seo, M.H.; Ohsaka, T.; Han, B. First principles study of oxygen reduction reaction mechanisms on N-doped graphene with a transition metal support. Electrochim. Acta 2014, 140, 225–231. [Google Scholar] [CrossRef]
- Szakacs, C.E.; Lefevre, M.; Kramm, U.I.; Dodelet, J.P.; Vidal, F. A density functional theory study of catalytic sites for oxygen reduction in Fe/N/C catalysts used in H(2)/O(2) fuel cells. Phys. Chem. Chem. Phys. 2014, 16, 13654–13661. [Google Scholar] [CrossRef] [PubMed]
- Santisouk, S.; Sengdala, P.; Jiang, X.; Xue, X.X.; Chen, K.Q.; Feng, Y. Tuning the Electrocatalytic Properties of Black and Gray Arsenene by Introducing Heteroatoms. ACS Omega 2021, 6, 13124–13133. [Google Scholar] [CrossRef] [PubMed]
- Hwang, Y.; Yun, K.-H.; Chung, Y.-C. Carbon-free and two-dimensional cathode structure based on silicene for lithium–oxygen batteries: A first-principles calculation. J. Power Sources 2015, 275, 32–37. [Google Scholar] [CrossRef]
- Hernandez Rosas, J.J.; Ramirez Gutierrez, R.E.; Escobedo-Morales, A.; Chigo Anota, E. First principles calculations of the electronic and chemical properties of graphene, graphane, and graphene oxide. J Mol Model 2011, 17, 1133–1139. [Google Scholar] [CrossRef] [PubMed]
- Nørskov, J.K.; Rossmeisl, J.; Logadottir, A.; Lindqvist LR, K.J.; Kitchin, J.R.; Bligaard, T.; Jonsson, H. Logadottir, and L. Lindqvist. Origin of the Overpotential for Oxygen Reduction at a Fuel-Cell Cathode. J. Phys. Chem. B 2004, 108, 17886–17892. [Google Scholar] [CrossRef]
- Brahim, N.S.; Thotagamuge, R.; Kooh, M.R.R.; Lim, C.M.; Syaahiran, M.A.; Usman, A.; Shahri, N.N.M.; Chou Chau, Y.-F.; Chou Chao, C.-T.; Chiang, H.-P. Enhanced CO Gas Sensing with DFT Optimized PbS Loading on ZnO and CrZnO Nanocomposites. Sustainability 2022, 14, 13978. [Google Scholar] [CrossRef]
- Kumara, N.; Kooh, M.R.R.; Lim, A.; Petra, M.I.; Voo, N.Y.; Lim, C.M.; Ekanayake, P. DFT/TDDFT and experimental studies of natural pigments extracted from black tea waste for DSSC application. Int. J. Photoenergy 2013, 2013. [Google Scholar] [CrossRef]


| T/K | U/V | Formation Energy/eV |
|---|---|---|
| 298.15 | 0 | −28.856 |
| 1 | −24.856 | |
| 4 | −12.856 | |
| 6 | −4.856 | |
| 7.21 | −0.016 | |
| 7.22 | 0.024 | |
| 353.15 | 0 | −28.865 |
| 1 | −24.865 | |
| 4 | −12.865 | |
| 6 | −4.865 | |
| 7.21 | −0.025 | |
| 7.22 | 0.015 | |
| 393.15 | 0 | −28.864 |
| 1 | −24.864 | |
| 4 | −12.864 | |
| 6 | −4.864 | |
| 7.21 | −0.024 | |
| 7.22 | 0.016 |
| T/K | Intermediate/Structure | Eg/eV | η/eV | μ/eV | ω/eV |
|---|---|---|---|---|---|
| 298.15 | Cu2-N8/Gr | 0.992 | 0.496 | −3.469 | 6.063 |
| O2 | 0.738 | 0.369 | −3.615 | 8.854 | |
| OH + H2O | 0.947 | 0.473 | −3.358 | 5.953 | |
| 2H2O | 0.686 | 0.343 | −3.322 | 8.048 | |
| 353.15 | Cu2-N8/Gr | 0.992 | 0.496 | −3.469 | 6.063 |
| O2 | 0.738 | 0.369 | −3.615 | 8.854 | |
| OH + H2O | 0.777 | 0.388 | −3.418 | 7.520 | |
| 2H2O | 0.686 | 0.343 | −3.322 | 8.048 | |
| 393.15 | Cu2-N8/Gr | 0.992 | 0.496 | −3.469 | 6.063 |
| O2 | 0.738 | 0.369 | −3.615 | 8.854 | |
| OH + H2O | 1.039 | 0.519 | −3.412 | 5.605 | |
| 2H2O | 0.686 | 0.343 | −3.322 | 8.048 |
| Temperature/K | Molecule | BE/eV | dO-O/Å | dCu-O/Å |
|---|---|---|---|---|
| 298.15 | O2 | −3.00 | 1.471 | 1.893 |
| OOH | −9.60 | 1.565 | 1.887 | |
| OH + OH | −10.97 | 2.680 | 1.864, 1.809 | |
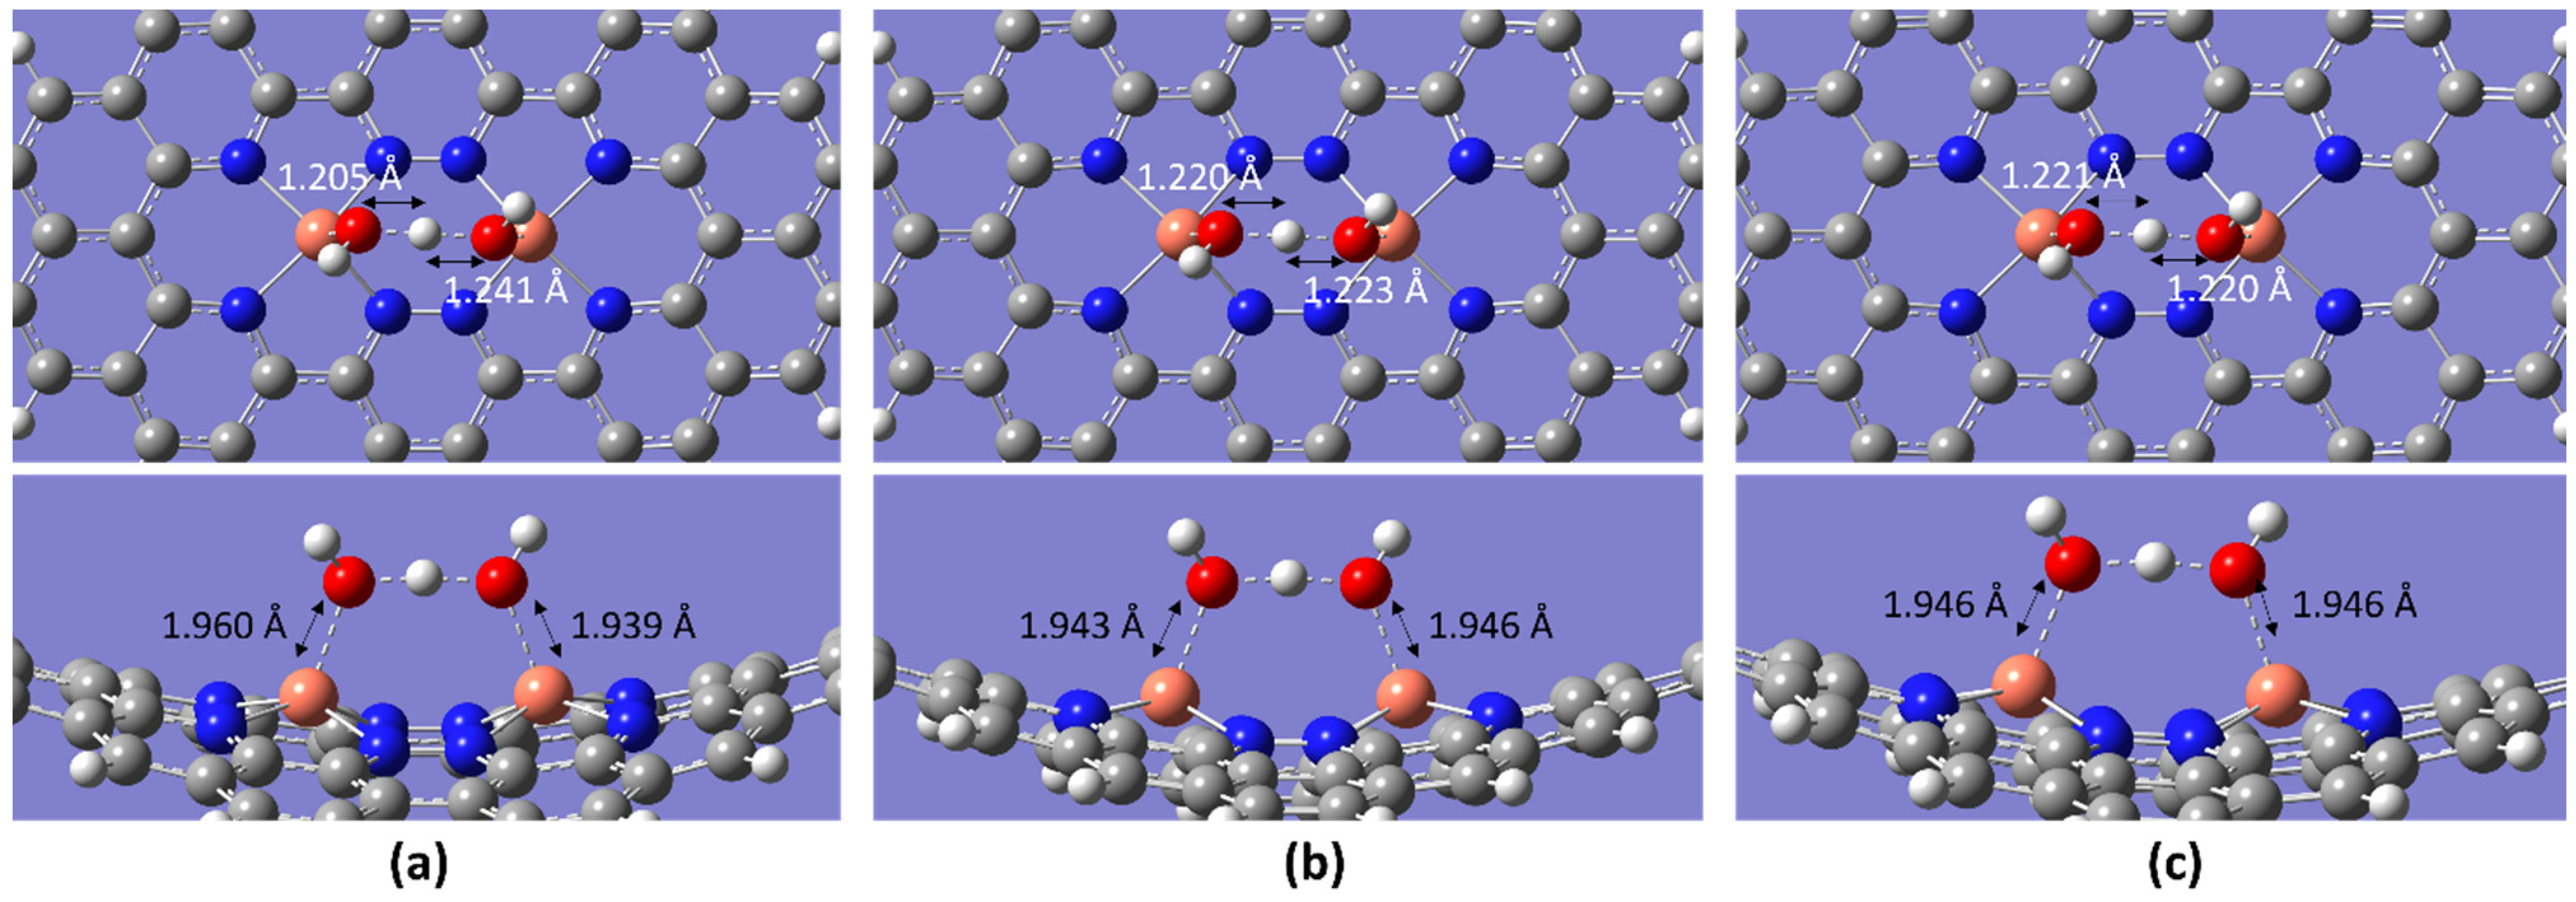
| OH + H2O | −5.35 | 2.441 | 1.960, 1.939 | |
| OH | −6.45 | - | 1.832 | |
| H2O | −1.11 | - | 2.144 | |
| 2H2O | −2.12 | 2.519 | 1.997, 2.909 | |
| 353.15 | O2 | −2.99 | 1.471 | 1.893 |
| OOH | −9.59 | 1.565 | 1.887 | |
| OH + OH | −8.51 | 2.680 | 1.864, 1.809 | |
| OH + H2O | −5.25 | - | 1.943, 1.946 | |
| OH | −0.25 | - | 1.837 | |
| H2O | −1.09 | - | 2.144 | |
| 2H2O | −2.11 | 2.519 | 1.997, 2.909 | |
| 393.15 | O2 | −2.98 | 1.471 | 1.893 |
| OOH | −9.58 | 1.565 | 1.887 | |
| OH + OH | −8.50 | 2.680 | 1.864, 1.809 | |
| OH + H2O | −5.33 | 2.437 | 1.946 | |
| OH | −0.24 | - | 1.837 | |
| H2O | −1.08 | - | 2.144 | |
| 2H2O | −2.10 | 2.519 | 1.996, 2.908 |
| Catalyst | Molecule | BE/eV | dM-O/Å | EF(U = 0)/eV | References |
|---|---|---|---|---|---|
| Cu-N2/Gr | O2 | −2.90 | 2.047 | −5.68 | |
| OOH | −1.81 | 1.957 | |||
| O | −5.14 | 1.890 | Bhatt et al. [35] | ||
| OH | −2.68 | 1.908 | |||
| H2O | −1.08 | 2.203 | |||
| H2O2 | −1.49 | 2.236 | |||
| Cu-N4/Gr | O2 | −2.76 | 1.98 | −13.22 | |
| OOH | −1.70 | 1.87 | |||
| O | −5.15 | 1.88 | Balasooriya et al. [36] | ||
| OH | −1.99 | 1.84 | |||
| H2O | −1.23 | 2.08 | |||
| H2O2 | −0.92 | 2.18 | |||
| Co-N4/Gr | O2 | −0.67 | 1.93 | −3.56 | |
| OOH | −1.02 | 1.87 | |||
| O | −3.18 | 1.71 | Kattel et al. [28] | ||
| OH | −2.44 | 1.88 | |||
| H2O2 | −0.06 | 3.36 | |||
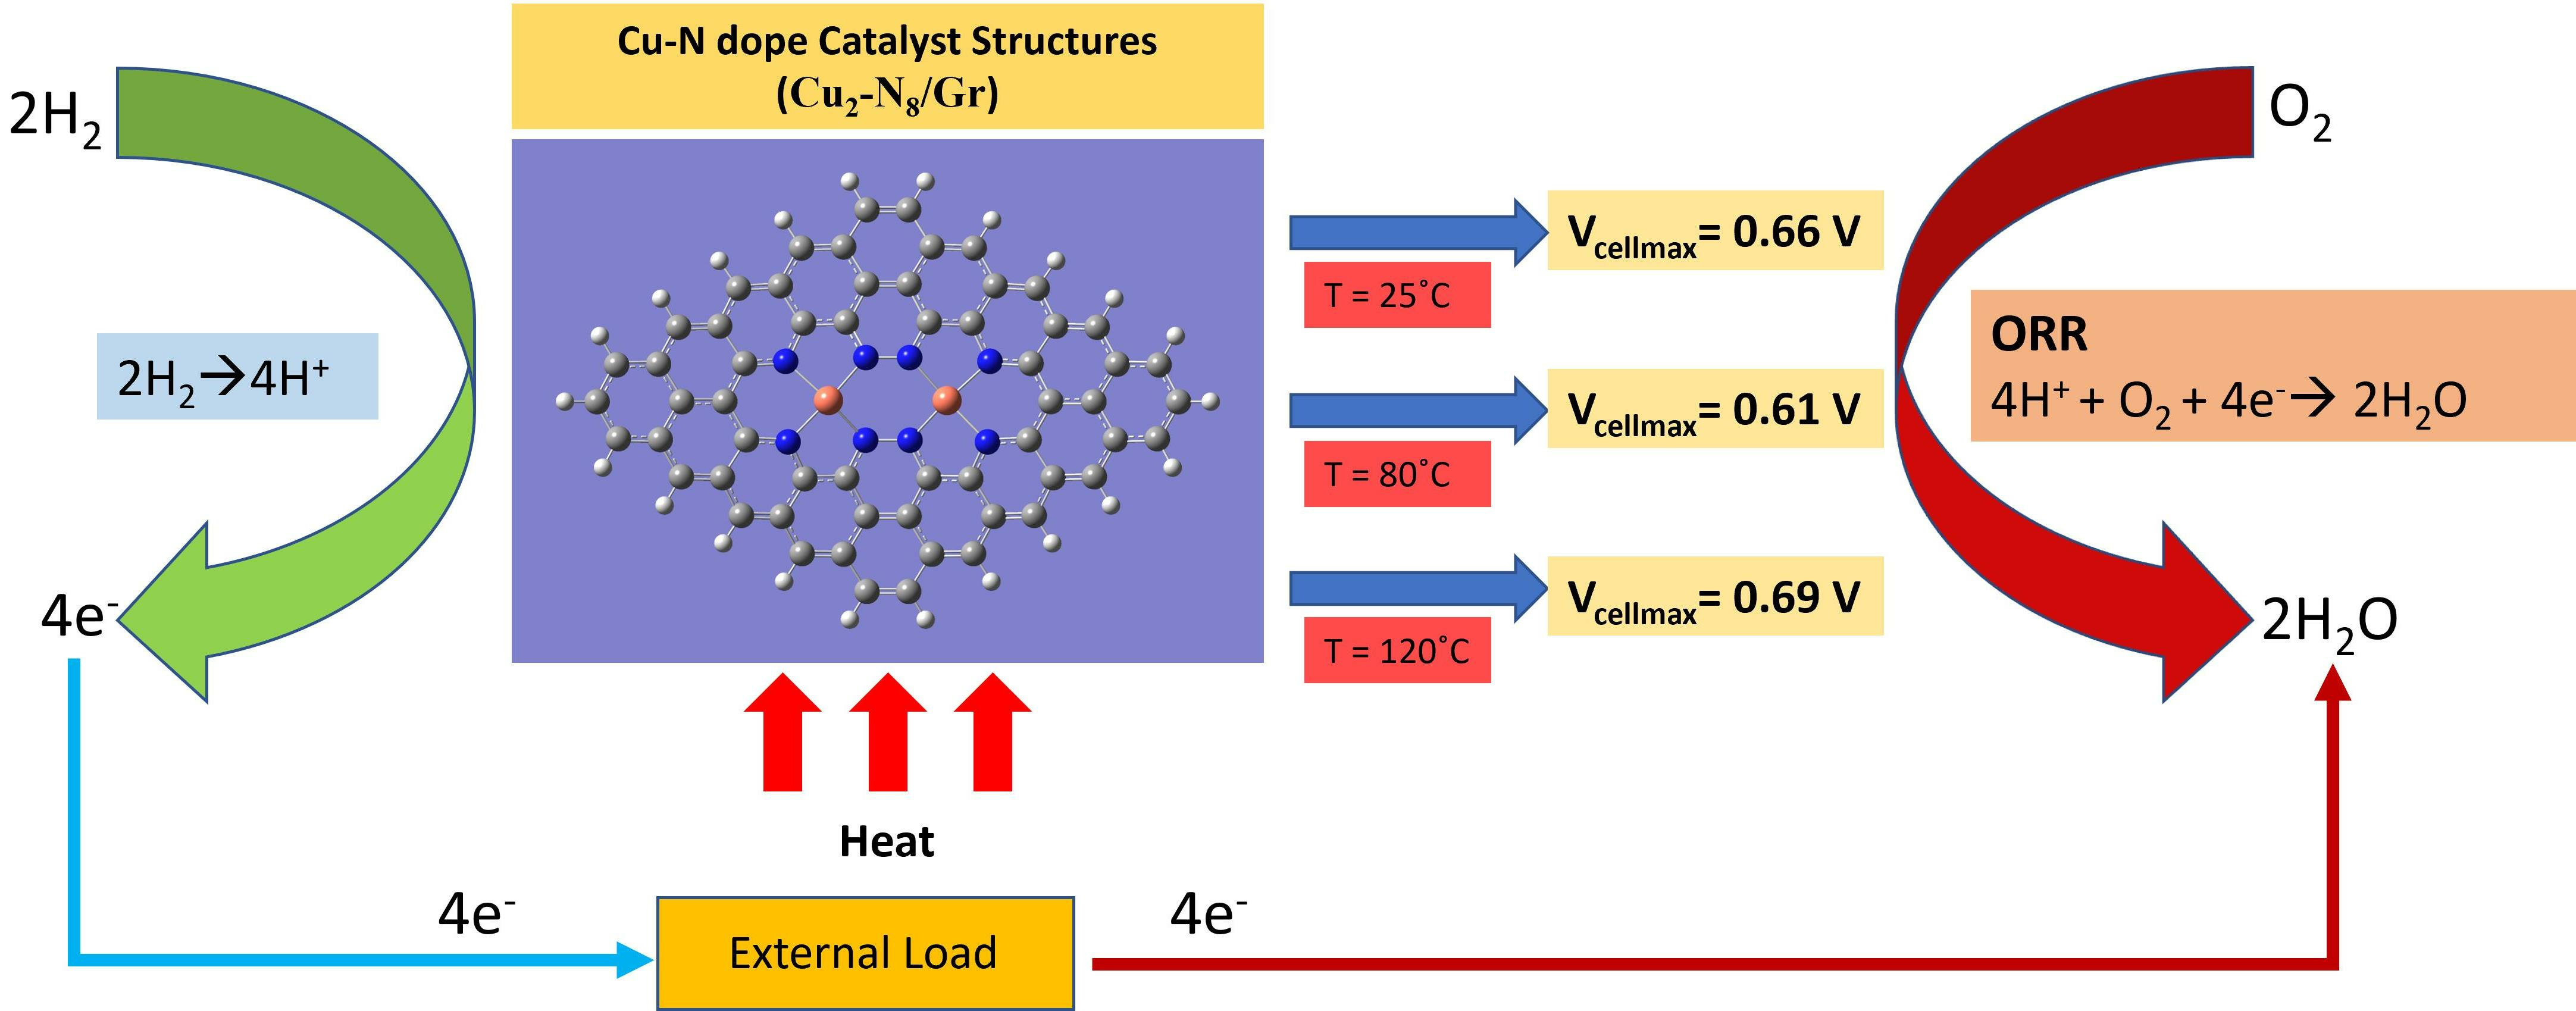
| Cu2-N8/Gr | O2 | −3.00 | 1.893 | −28.856 | Current study |
| OOH | −9.60 | 1.887 | |||
| OH + OH | −10.97 | 1.864, 1.809 | |||
| OH + H2O | −5.35 | 1.960, 1.939 | |||
| OH | −6.45 | 1.832 | |||
| H2O | −1.11 | 2.144 | |||
| 2H2O | −2.12 | 1.997, 2.909 | |||
| H2O2 | None forming | None forming | |||
| Ti-N4/Gr | O2 | −8.95 | 1.838 | −3.72 | |
| OOH | −7.99 | 1.829 | |||
| O | −12.06 | 1.644 | Bhatt et al. [35] | ||
| OH | −7.99 | 1.771 | |||
| H2O | −4.14 | 2.067 | |||
| H2O2 | −9.13 | 1.829 |
Disclaimer/Publisher’s Note: The statements, opinions and data contained in all publications are solely those of the individual author(s) and contributor(s) and not of MDPI and/or the editor(s). MDPI and/or the editor(s) disclaim responsibility for any injury to people or property resulting from any ideas, methods, instructions or products referred to in the content. |
© 2023 by the authors. Licensee MDPI, Basel, Switzerland. This article is an open access article distributed under the terms and conditions of the Creative Commons Attribution (CC BY) license (https://creativecommons.org/licenses/by/4.0/).
Share and Cite
Balasooriya, Y.; Samarasekara, P.; Lim, C.M.; Chau, Y.-F.C.; Kooh, M.R.R.; Thotagamuge, R. Density Functional Theory Investigation of Temperature-Dependent Properties of Cu-Nitrogen-Doped Graphene as a Cathode Material in Fuel Cell Applications. Molecules 2023, 28, 7873. https://doi.org/10.3390/molecules28237873
Balasooriya Y, Samarasekara P, Lim CM, Chau Y-FC, Kooh MRR, Thotagamuge R. Density Functional Theory Investigation of Temperature-Dependent Properties of Cu-Nitrogen-Doped Graphene as a Cathode Material in Fuel Cell Applications. Molecules. 2023; 28(23):7873. https://doi.org/10.3390/molecules28237873
Chicago/Turabian StyleBalasooriya, Yashas, Pubudu Samarasekara, Chee Ming Lim, Yuan-Fong Chou Chau, Muhammad Raziq Rahimi Kooh, and Roshan Thotagamuge. 2023. "Density Functional Theory Investigation of Temperature-Dependent Properties of Cu-Nitrogen-Doped Graphene as a Cathode Material in Fuel Cell Applications" Molecules 28, no. 23: 7873. https://doi.org/10.3390/molecules28237873
APA StyleBalasooriya, Y., Samarasekara, P., Lim, C. M., Chau, Y.-F. C., Kooh, M. R. R., & Thotagamuge, R. (2023). Density Functional Theory Investigation of Temperature-Dependent Properties of Cu-Nitrogen-Doped Graphene as a Cathode Material in Fuel Cell Applications. Molecules, 28(23), 7873. https://doi.org/10.3390/molecules28237873