
Phytochemical and Nutraceutical Screening of Ethanol and Ethyl Acetate Phases of Romanian Galium verum Herba (Rubiaceae)

 ,
,  ,
,  ,
,  ,
, 
 and
and
Abstract
:1. Introduction
2. Results
2.1. Phytochemical Analysis
2.1.1. The Extraction Yield
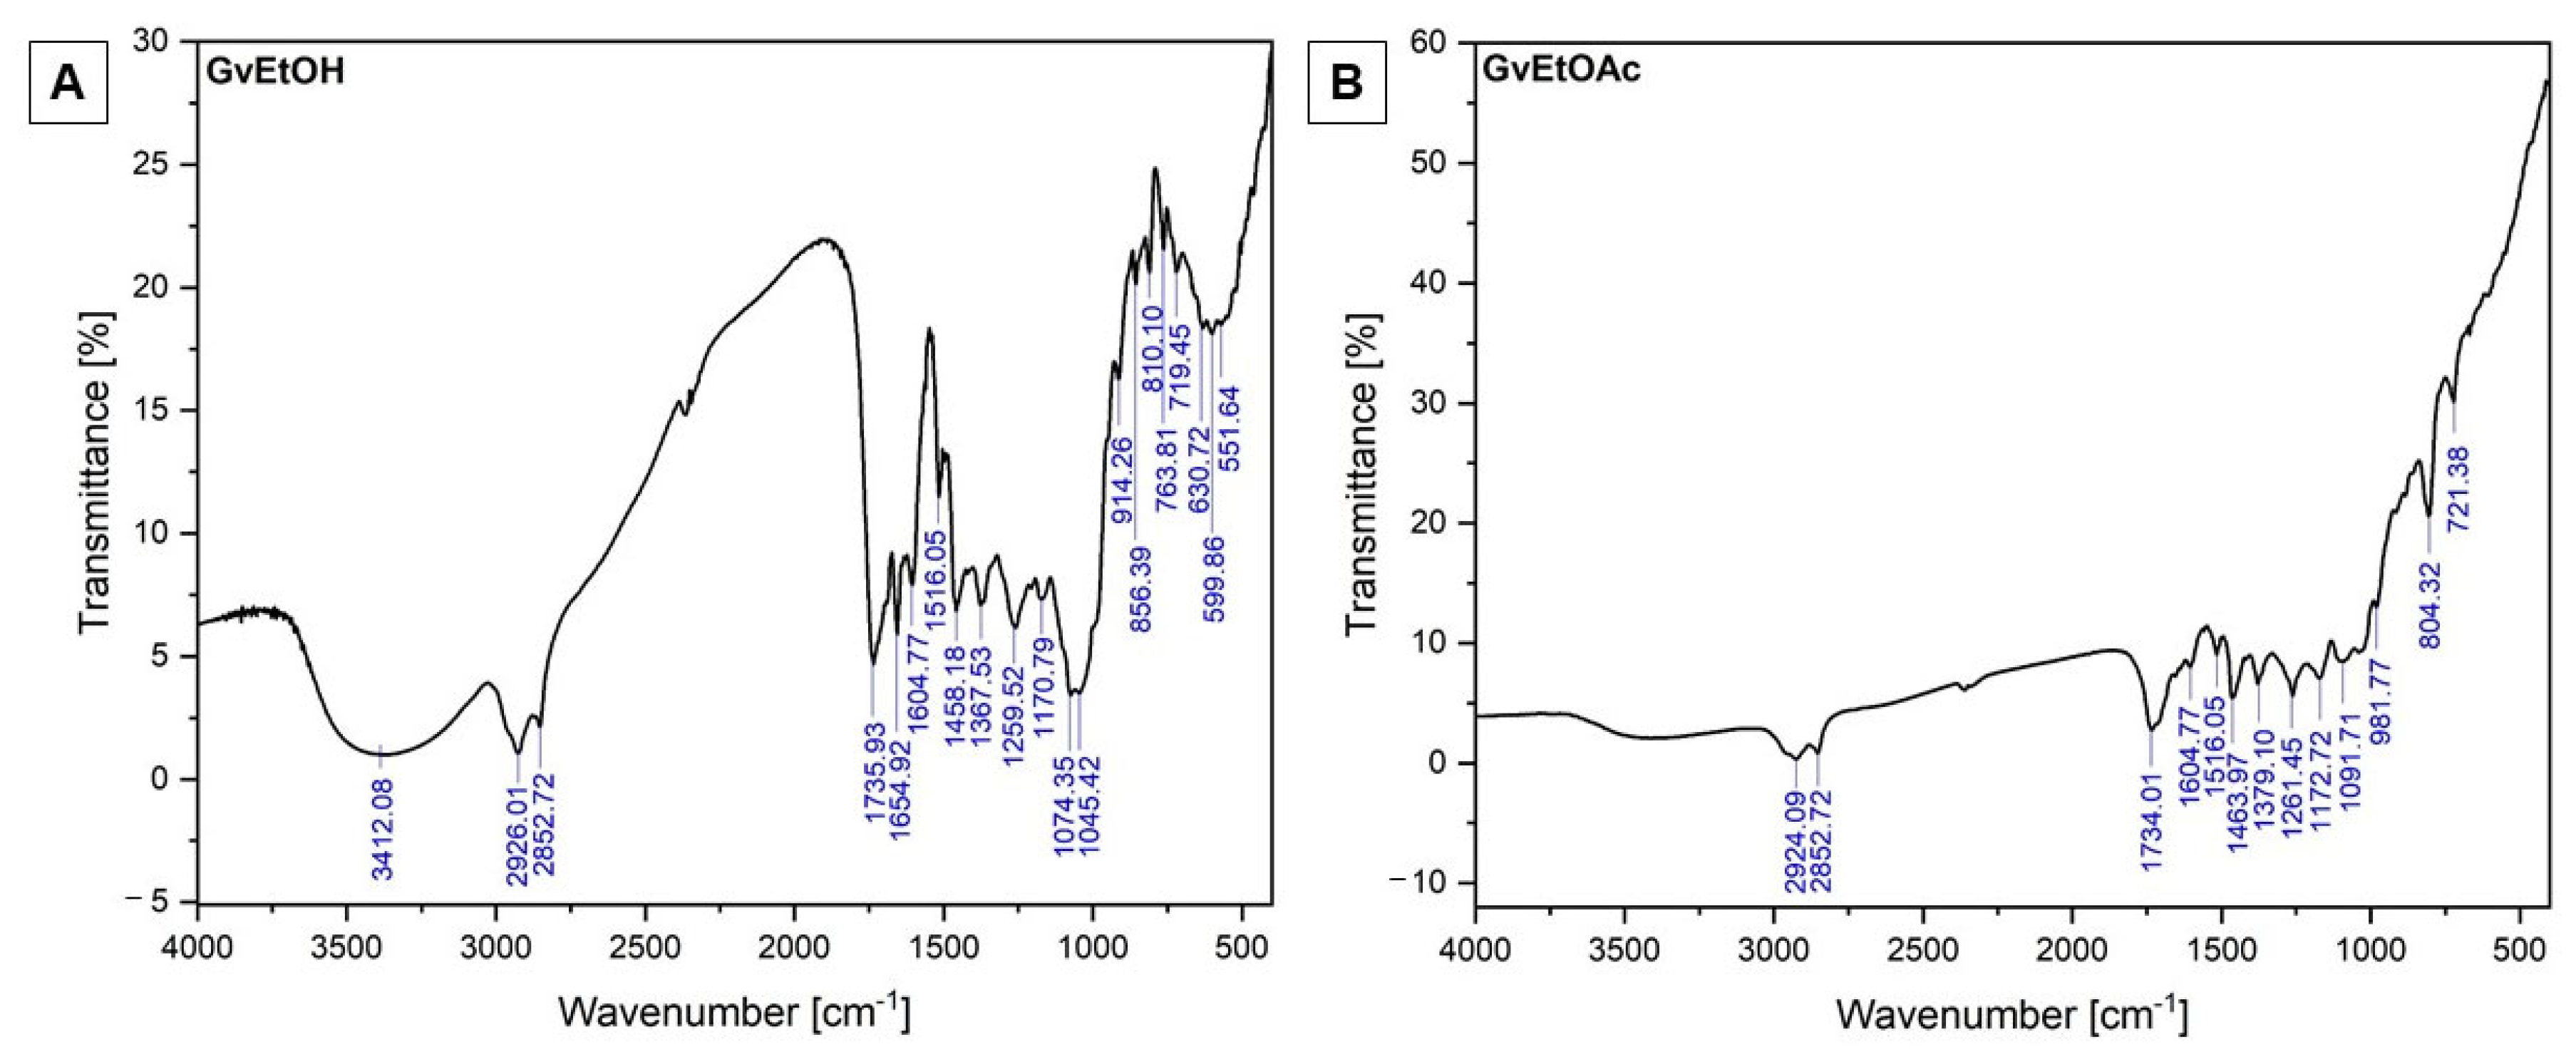
2.1.2. FT-IR Investigations
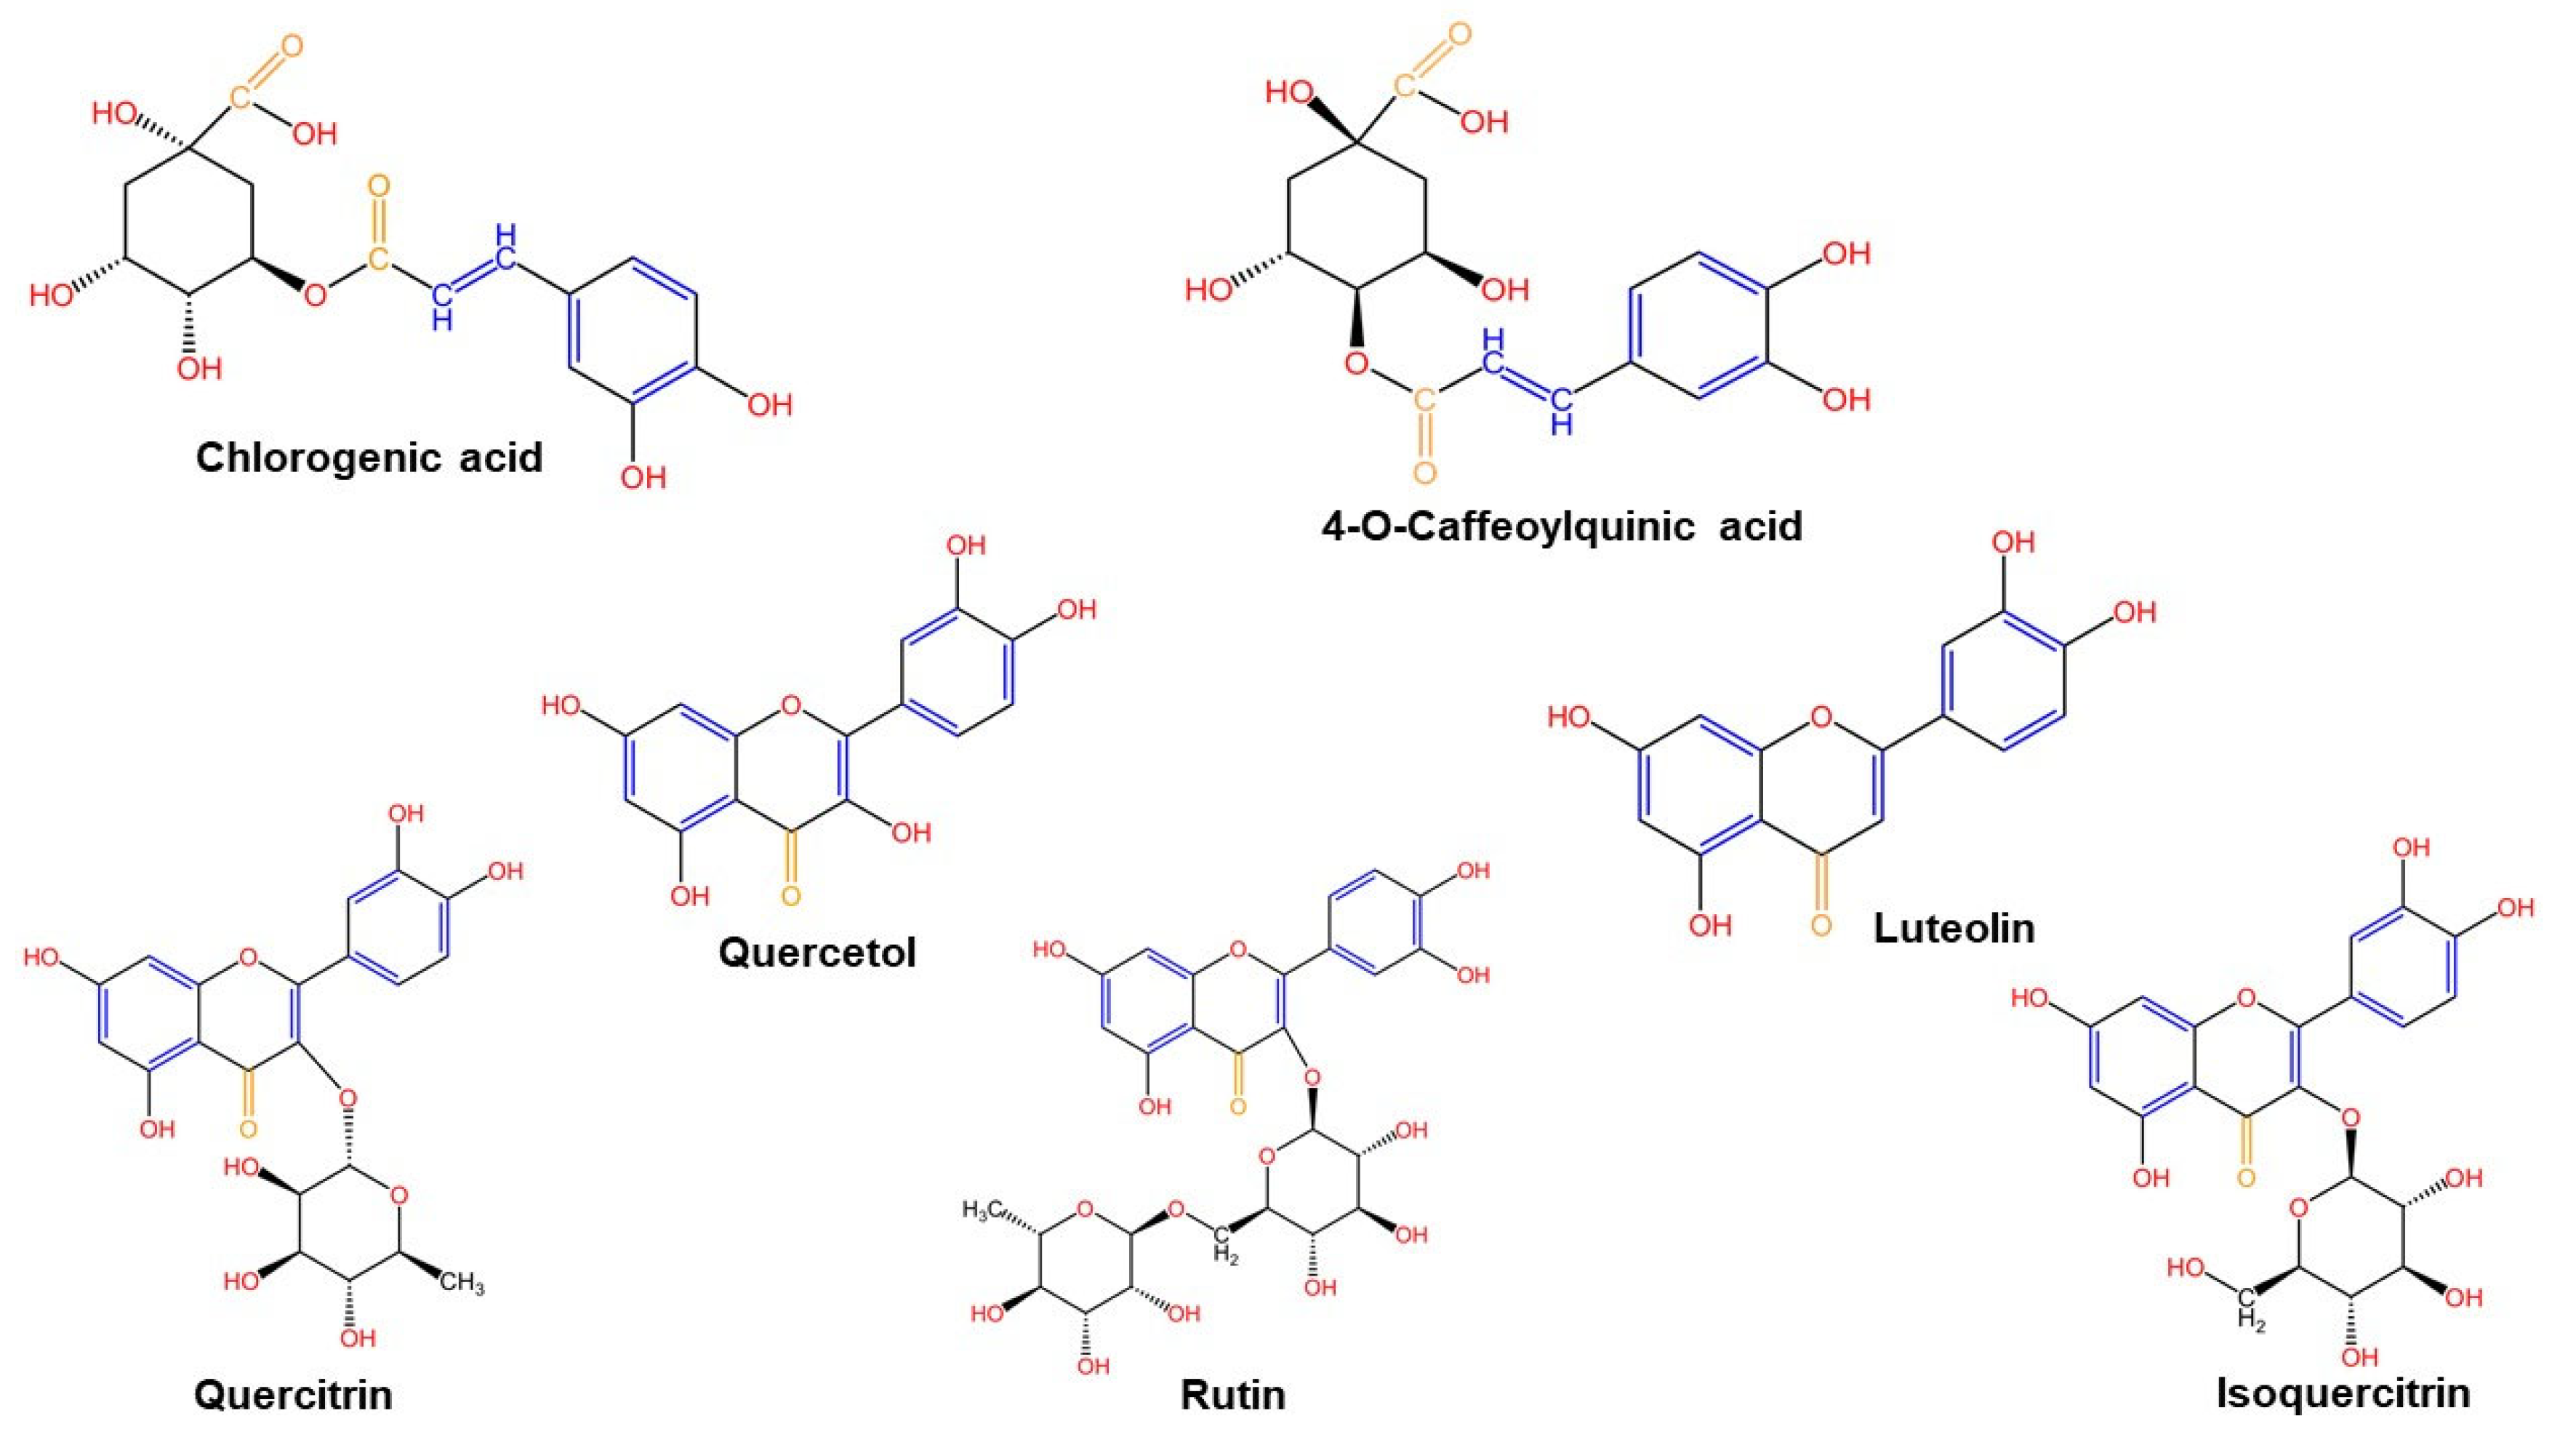
2.1.3. Liquid Chromatography Mass Spectrometry (LC-MS)
2.1.4. Total Phenolic (TPC) and Flavonoid Contents (TFC)
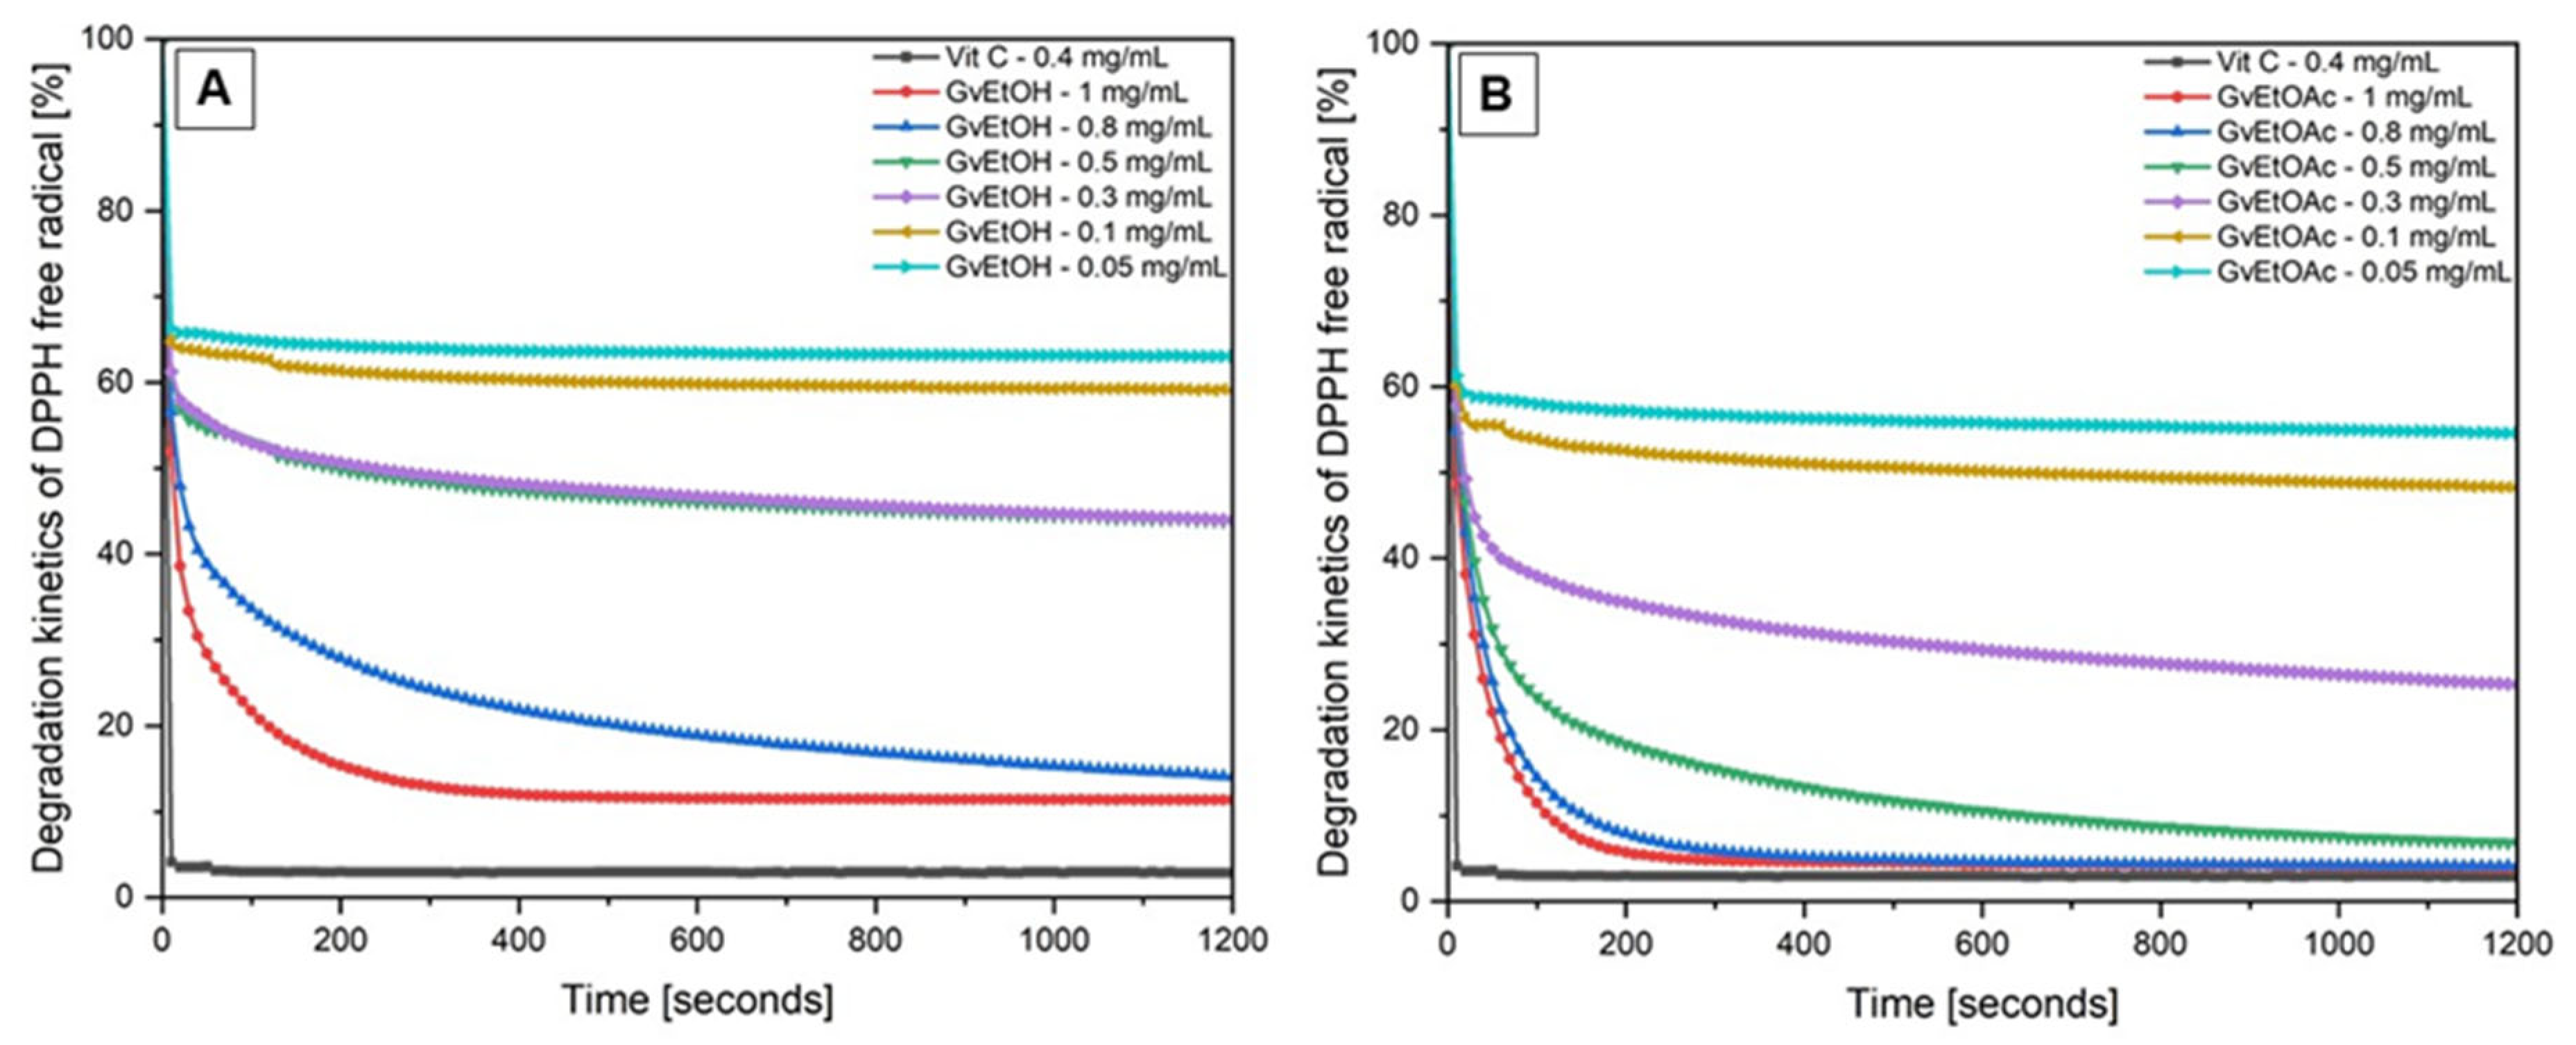
2.1.5. Antioxidant Activity
2.2. Bioactivity
2.2.1. Antimicrobial Analysis
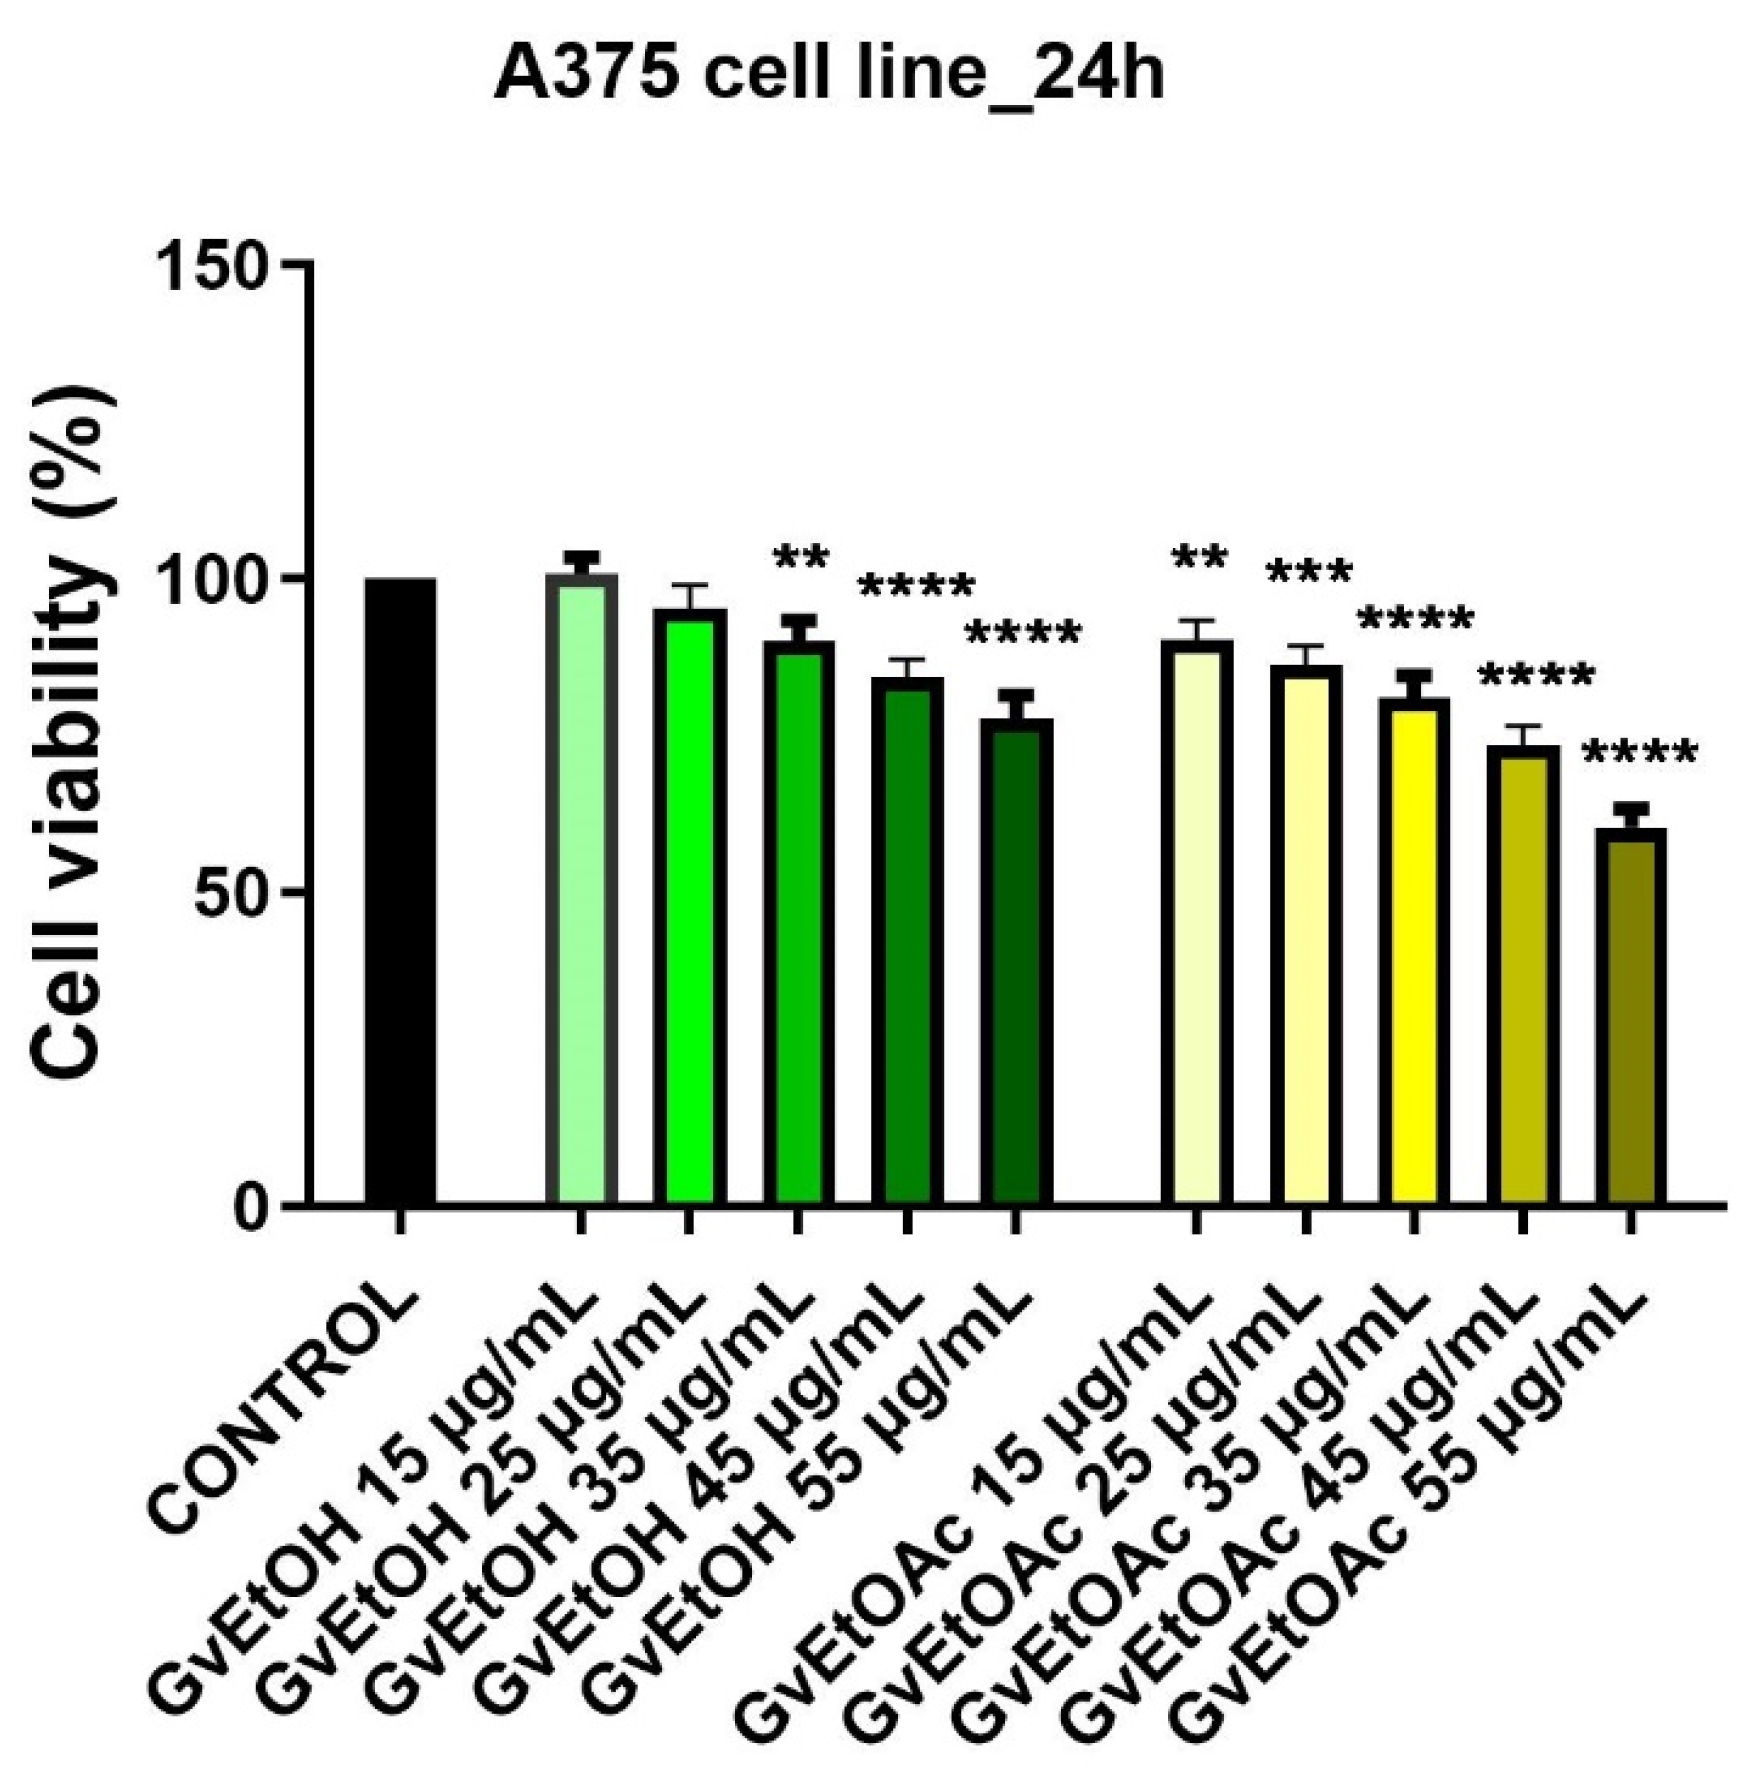
2.2.2. Anticancer Potential
Viability Assay
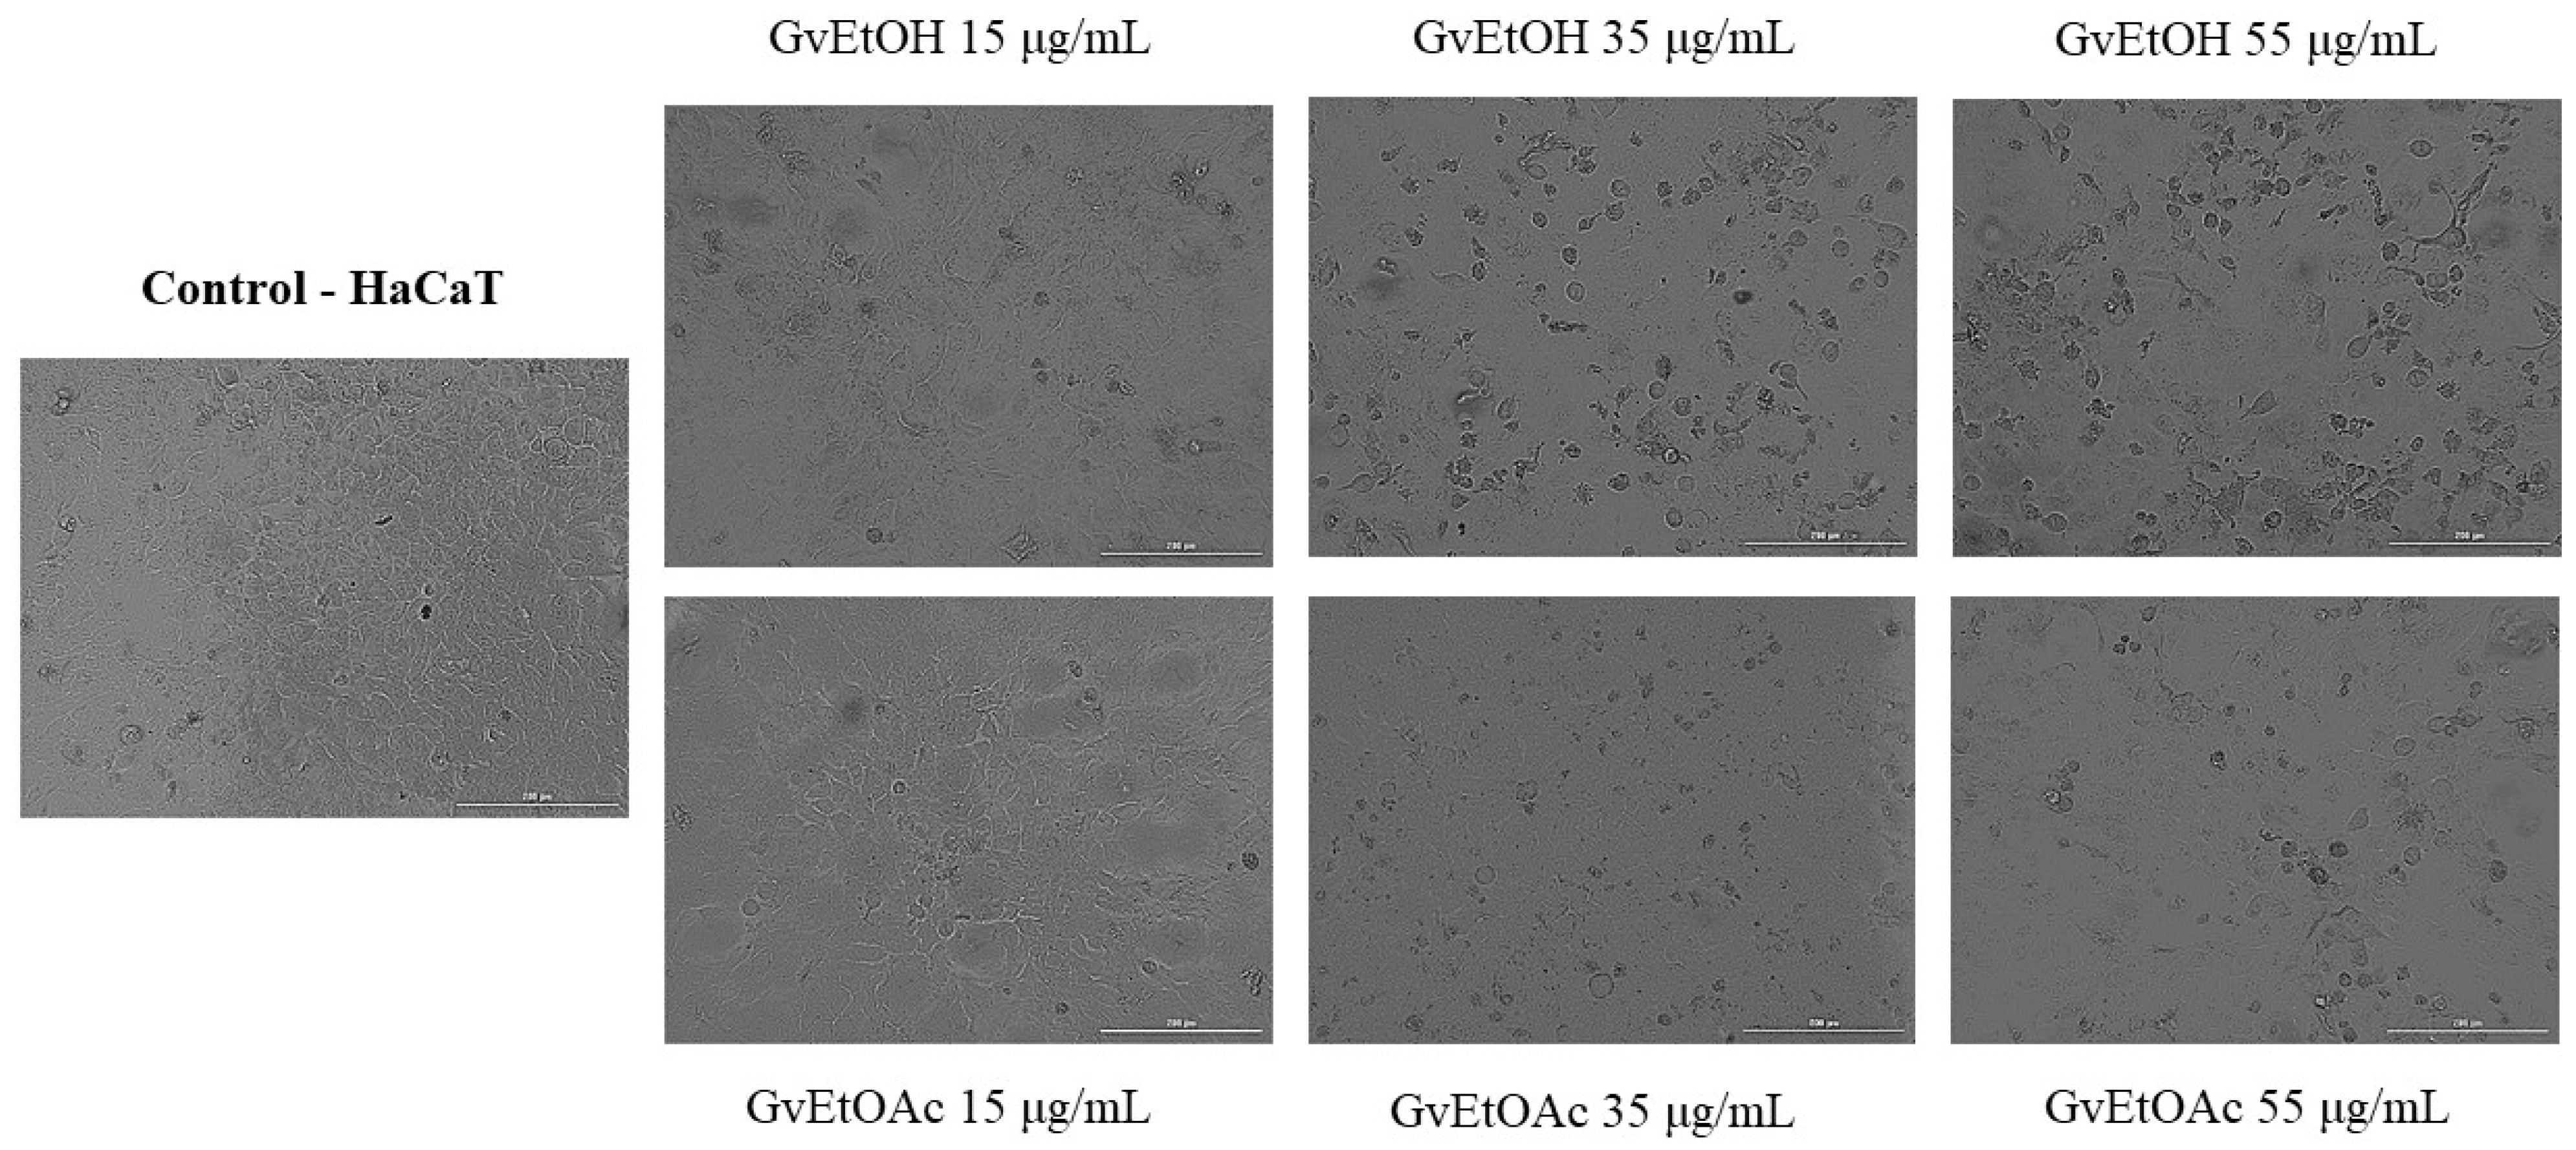
Cell Morphology and Confluence
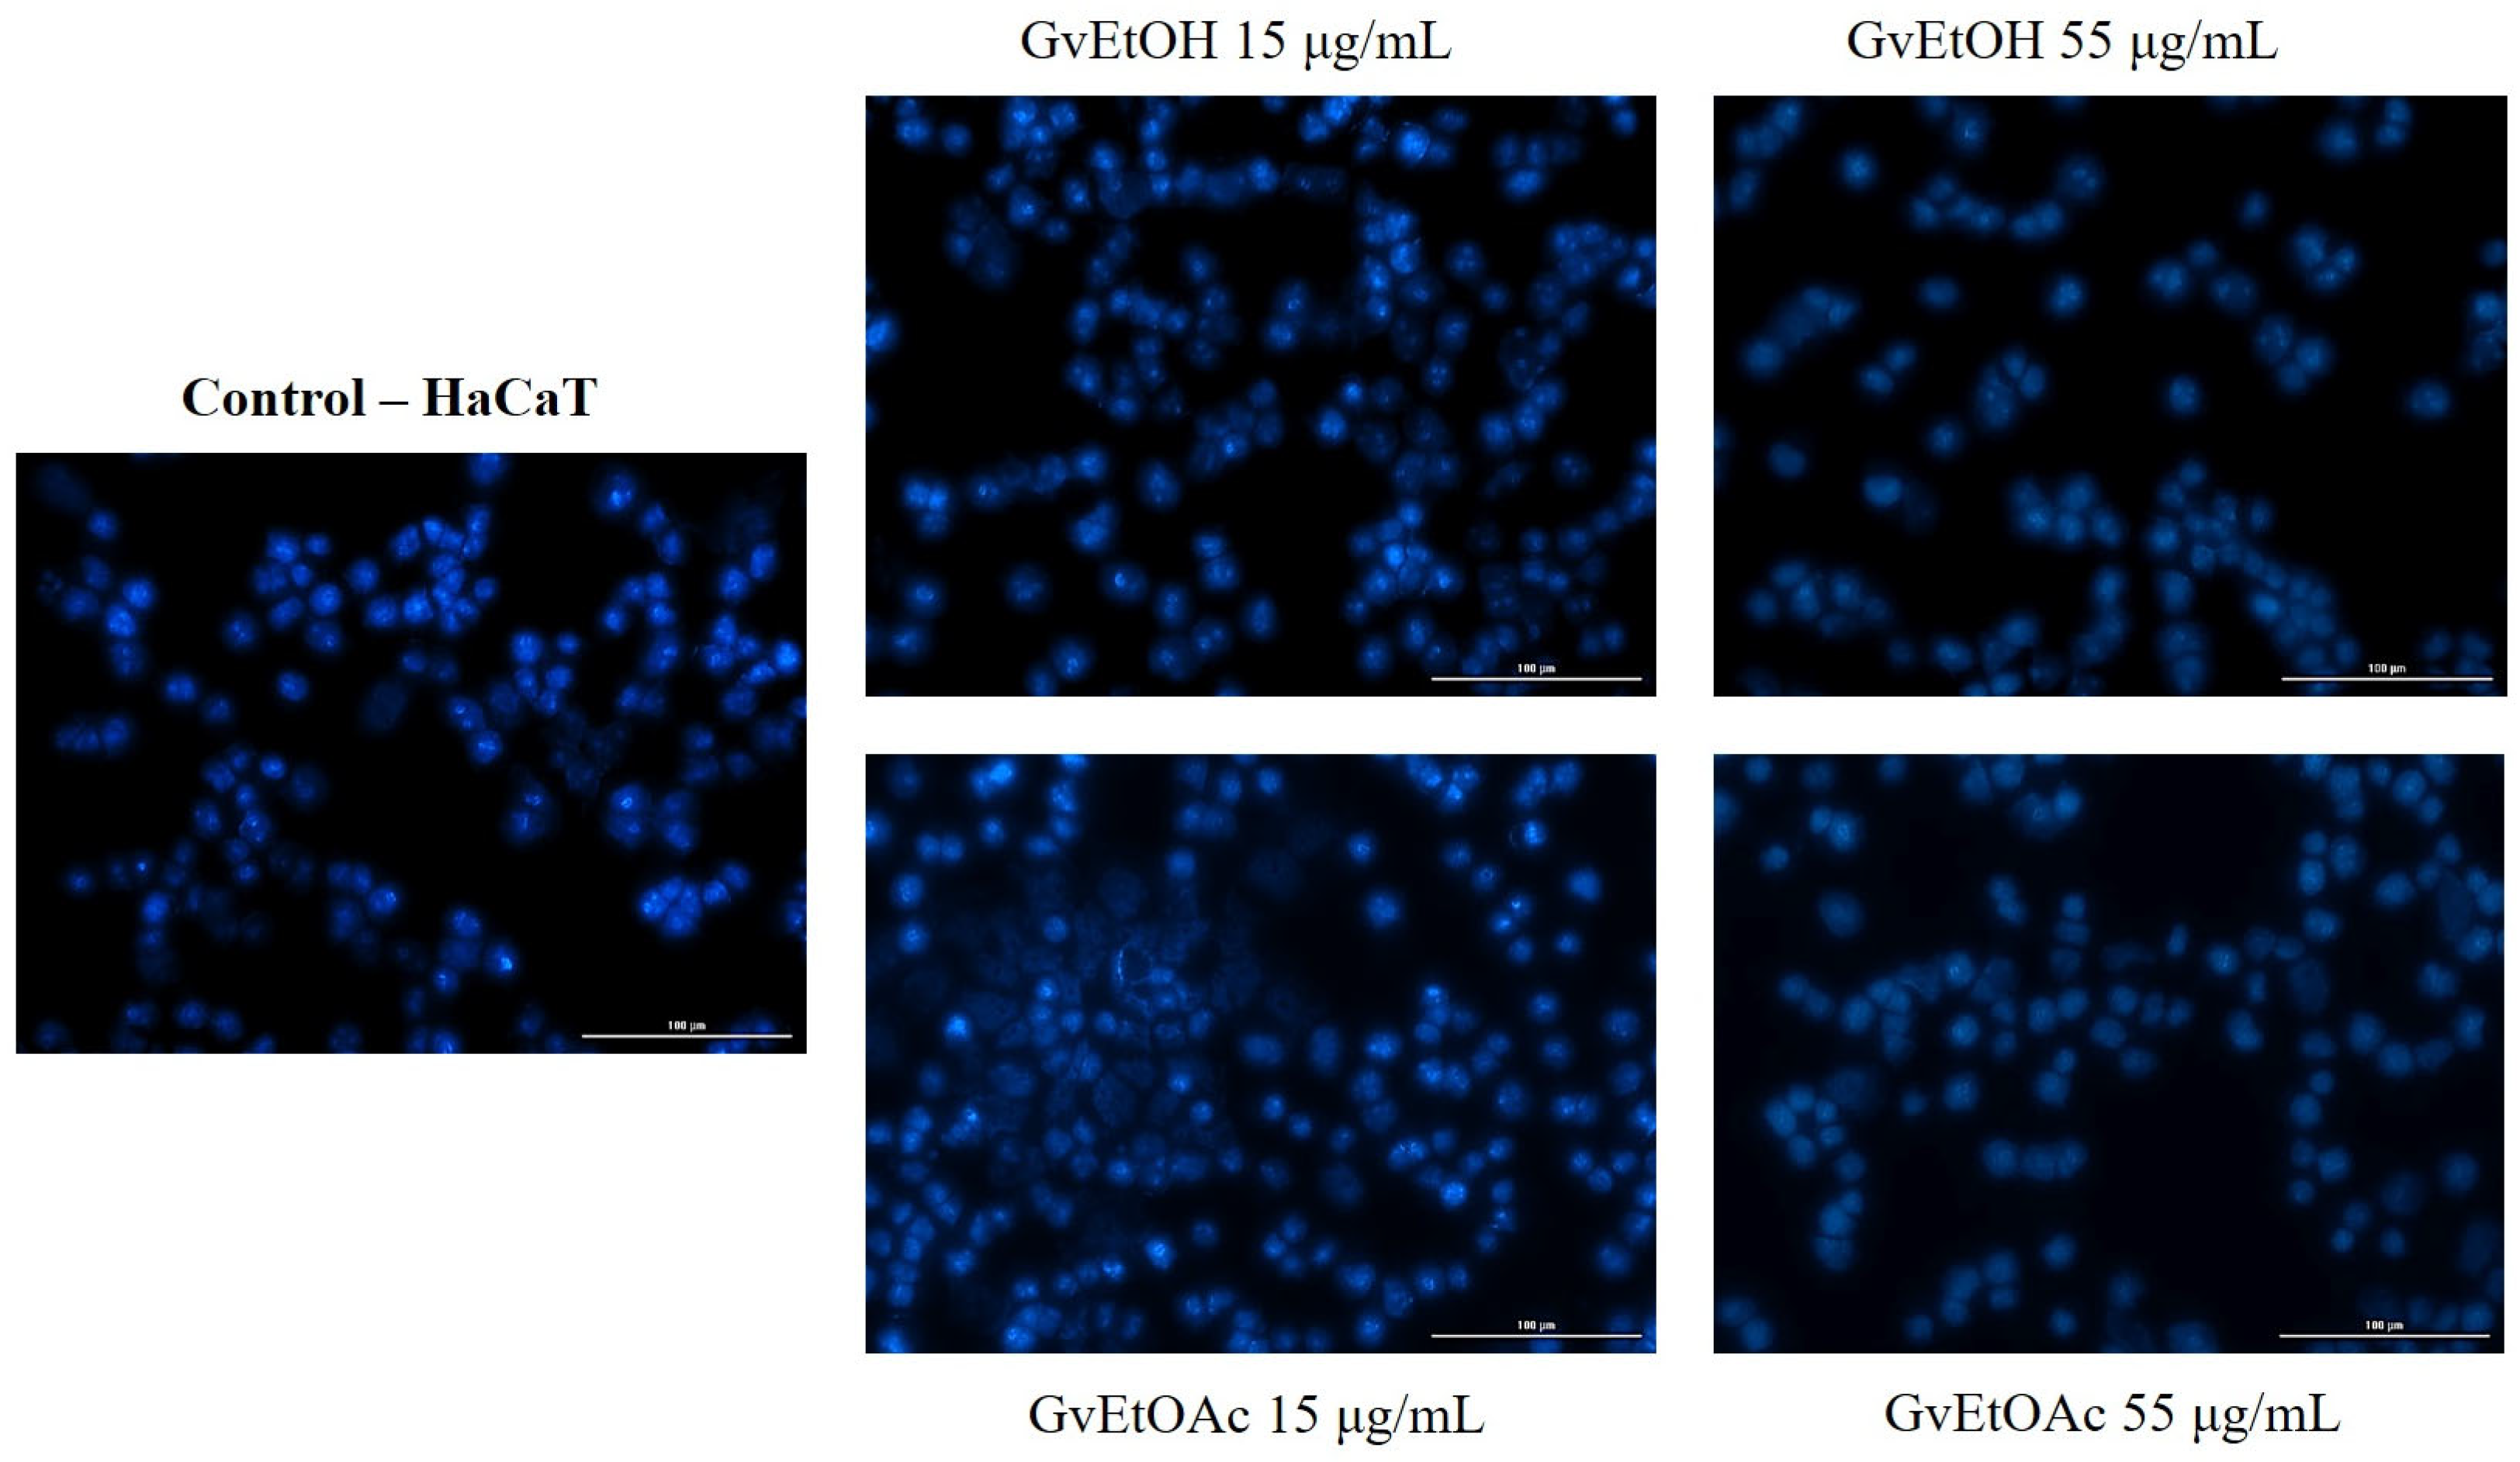
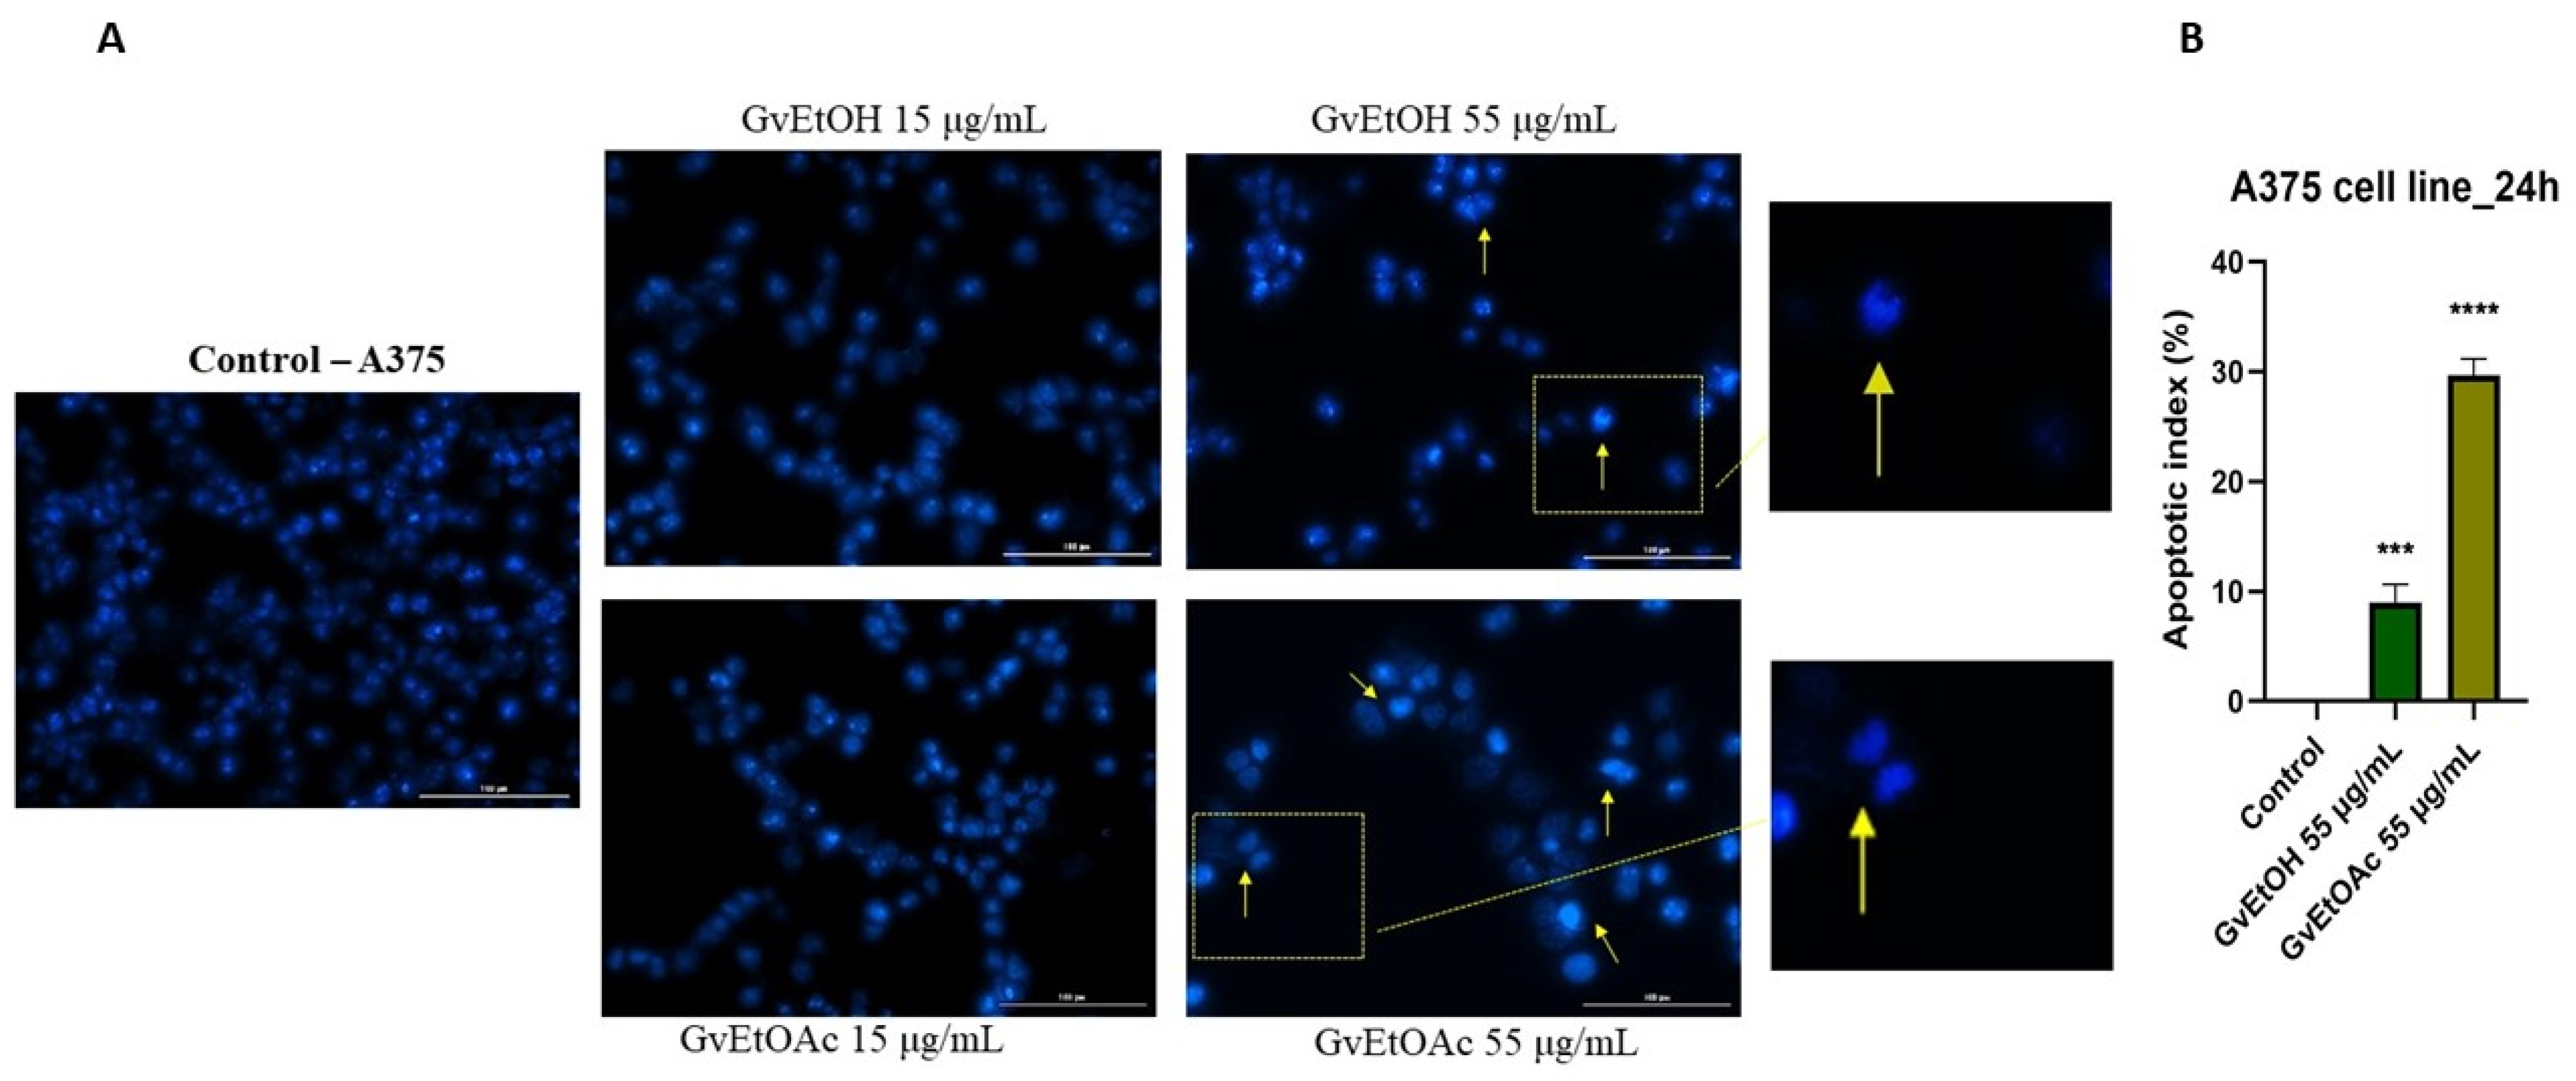
Nuclear Morphology Evaluation
3. Discussion
4. Materials and Methods
4.1. Chemicals, Reagents, and Bacterial Strains
4.2. Cell Culture
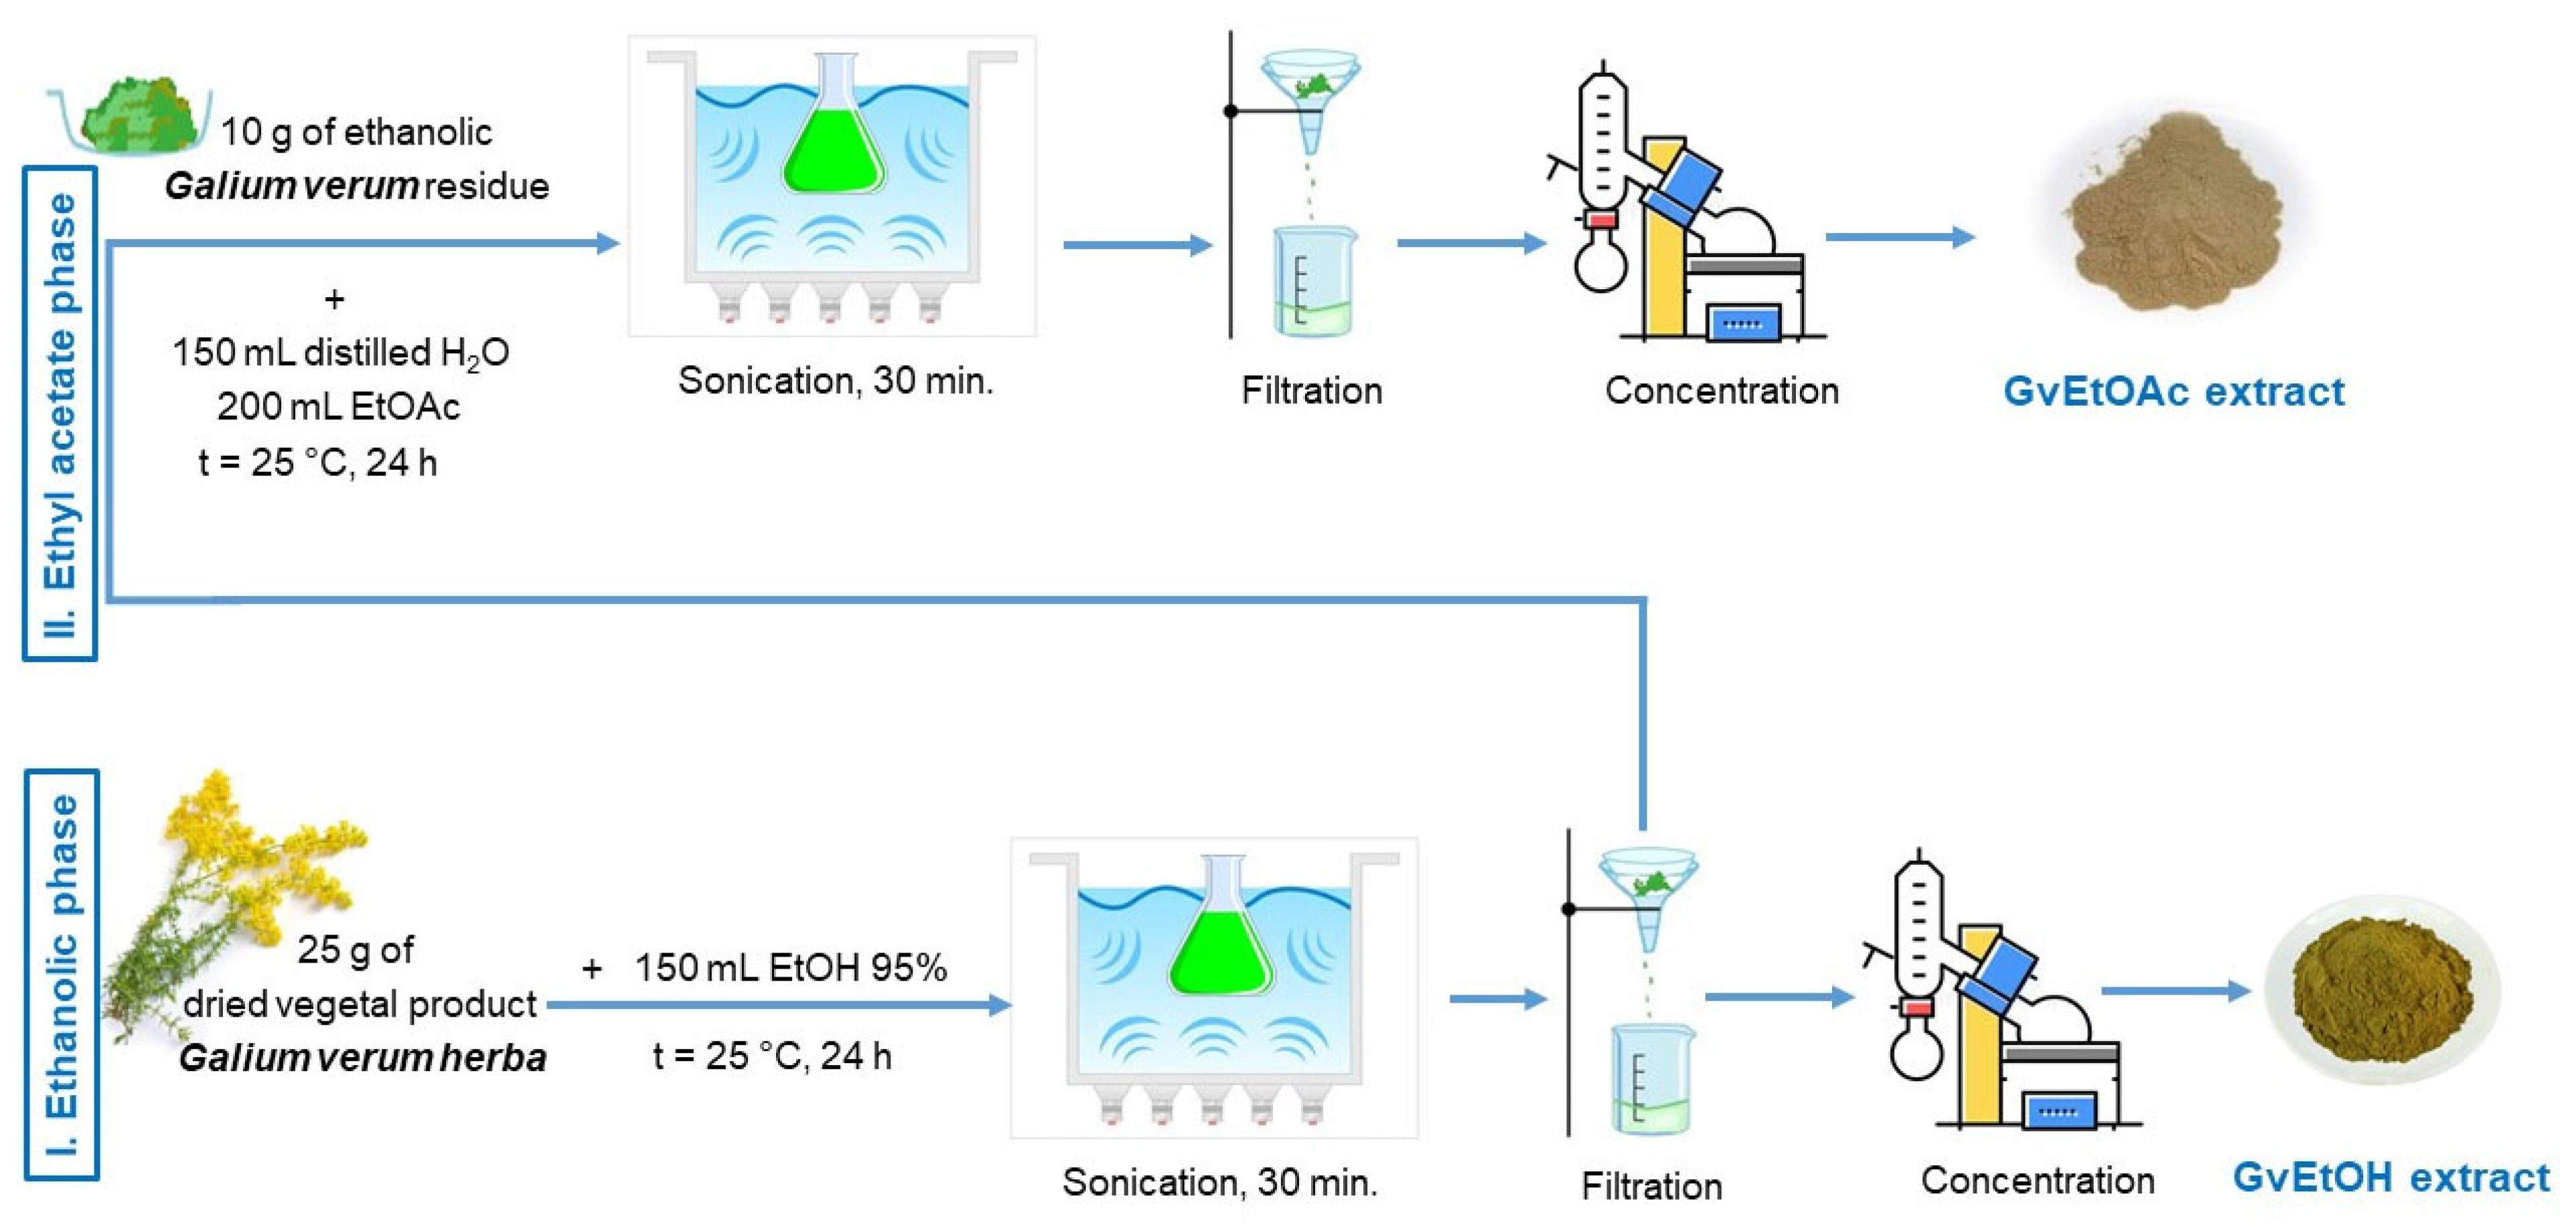
4.3. Plant Material and Extraction Technique
4.4. Phytochemical Screening
4.4.1. FT-IR
4.4.2. Liquid Chromatography Mass Spectrometry (LC-MS) Analysis
4.4.3. Total Phenolic (TPC) and Flavonoid Contents (TFC)
4.4.4. Antioxidant Activity
4.5. Bioactivity Screening
4.5.1. In Vitro Antimicrobial Effects
4.5.2. Anticancer Potential
Cell Viability Assessment
Cell Morphology and Confluence Evaluation
Nuclear Staining Evaluation
4.6. Statistical Analysis
5. Conclusions
Author Contributions
Funding
Institutional Review Board Statement
Informed Consent Statement
Data Availability Statement
Acknowledgments
Conflicts of Interest
References
- Mukherjee, P.K.; Ponnusankar, S.; Venkatesh, M. Ethno medicine in complementary therapeutics. Ethnomedicine: A source of complementary therapeutics. Res. Signpost 2010, 29–52. [Google Scholar]
- Sen, S.; Chakraborty, R.; De, B. Challenges and opportunities in the advancement of herbal medicine: India’s position and role in a global context. J. Herb. Med. 2011, 1, 67–75. [Google Scholar] [CrossRef]
- Singh, M.; Kumar, R.; Sharma, S.; Kumar, L.; Kumar, S.; Gupta, G.; Dua, K.; Kumar, D. Hedychium spicatum: A comprehensive insight into its ethnobotany, phytochemistry, pharmacological and therapeutic attributes. S. Afr. J. Bot. 2023, 161, 638–647. [Google Scholar] [CrossRef]
- Choudhury, A.; Amol Singh, P.; Bajwa, N.; Dash, S.; Bisht, P. Pharmacovigilance of herbal medicines: Concerns and future prospects. J. Ethnopharmacol. 2023, 309, 116383. [Google Scholar] [CrossRef] [PubMed]
- Dal Cero, M.; Saller, R.; Leonti, M.; Weckerle, C.S. Trends of Medicinal Plant Use over the Last 2000 Years in Central Europe. Plants 2022, 12, 135. [Google Scholar] [CrossRef] [PubMed]
- Fransworth, N.R.; Akerele, O.; Bingel, A.S.; Soejarto, D.D.; Guo, Z. Medicinal plants in therapy. Bull. WHO 1985, 63, 965–981. [Google Scholar] [CrossRef]
- Newman, D.J.; Cragg, G.M. Natural Products as Sources of New Drugs from 1981 to 2014. J. Nat. Prod. 2016, 79, 629–661. [Google Scholar] [CrossRef]
- Wu, X.; Liu, Z.; Yu, X.Y.; Xu, S.; Luo, J. Autophagy and cardiac diseases: Therapeutic potential of natural products. Med. Res. Rev. 2021, 41, 314–341. [Google Scholar] [CrossRef]
- Yeung, A.W.K.; Tzvetkov, N.T.; Durazzo, A.; Lucarini, M.; Souto, E.B.; Santini, A.; Gan, R.Y.; Jozwik, A.; Grzybek, W.; Horbańczuk, J.O.; et al. Natural products in diabetes research: Quantitative literature analysis. Nat. Prod. Res. 2021, 35, 5813–5827. [Google Scholar] [CrossRef]
- Oriola, A.O.; Oyedeji, A.O. Plant-Derived Natural Products as Lead Agents against Common Respiratory Diseases. Molecules 2022, 27, 3054. [Google Scholar] [CrossRef]
- Rahman, M.H.; Bajgai, J.; Fadriquela, A.; Sharma, S.; Trinh, T.T.; Akter, R.; Jeong, Y.J.; Goh, S.H.; Kim, C.S.; Lee, K.J. Therapeutic Potential of Natural Products in Treating Neurodegenerative Disorders and Their Future Prospects and Challenges. Molecules 2021, 26, 5327. [Google Scholar] [CrossRef] [PubMed]
- Agbarya, A.; Ruimi, N.; Epelbaum, R.; Ben-Arye, E.; Mahajna, J. Natural products as potential cancer therapy enhancers: A preclinical update. Sage Open Med. 2014, 2, 205031211454692. [Google Scholar] [CrossRef] [PubMed]
- Dutta, S.; Mahalanobish, S.; Saha, S.; Ghosh, S.; Sil, P.C. Natural products: An upcoming therapeutic approach to cancer. Food Chem. Toxicol. 2019, 128, 240–255. [Google Scholar] [CrossRef] [PubMed]
- Kumar, S.; Pandey, A.K. Free radicals: Health implications and their mitigation by herbals. Br. J. Med. Med. Res. 2015, 7, 438–457. [Google Scholar] [CrossRef] [PubMed]
- Pizzino, G.; Irrera, N.; Cucinotta, M.; Pallio, G.; Mannino, F.; Arcoraci, V.; Squadrito, F.; Altavilla, D.; Bitto, A. Oxidative Stress: Harms and Benefits for Human Health. Oxid. Med. Cell. Longev. 2017, 2017, 8416763. [Google Scholar] [CrossRef] [PubMed]
- Yang, G.; Seok, J.K.; Kang, H.C.; Cho, Y.Y.; Lee, H.S.; Lee, J.Y. Skin Barrier Abnormalities and Immune Dysfunction in Atopic Dermatitis. Int. J. Mol. Sci. 2020, 21, 2867. [Google Scholar] [CrossRef] [PubMed]
- Weir, H.K.; Marrett, L.D.; Cokkinides, V.; Barnholtz-Sloan, J.; Patel, P.; Tai, E.; Jemal, A.; Li, J.; Kim, J.; Ekwueme, D.U. Melanoma in adolescents and young adults (ages 15–39 years): United States, 1999–2006. J. Am. Acad. Dermatol. 2011, 65 (Suppl. S1), S38–S49. [Google Scholar] [CrossRef] [PubMed]
- American Cancer Society. Key Statistics for Melanoma Skin Cancer. Available online: www.cancer.org/cancer/melanoma-skincancer/about/key-statitics.html (accessed on 14 October 2023).
- Brighton, H.E.; Angus, S.P.; Bo, T.; Roques, J.; Tagliatela, A.C.; Darr, D.B.; Karagoz, K.; Sciaky, N.; Gatza, M.L.; Sharpless, N.E.; et al. New mechanisms of resistance to MEK inhibitors in melanoma revealed by intravital imaging. Cancer Res. 2018, 78, 542–557. [Google Scholar] [CrossRef]
- Cirico, T.L.; Omaye, S.T. Additive or synergetic effects of phenolic compounds onhuman low-density lipoprotein oxidation. Food Chem. Toxicol. 2006, 44, 510–516. [Google Scholar] [CrossRef]
- Heo, H.J.; Kim, Y.J.; Chung, D.; Kim, D.-O. Antioxidant capacities of individual andcombined phenolics in a model system. Food Chem. 2007, 104, 87–92. [Google Scholar] [CrossRef]
- Peyrat-Maillard, M.N.; Cuvelier, M.E.; Berset, C. Antioxidant activity of phenolic compounds in 2,2′-azobis (2-amidinopropane) dihydrochloride (AAPH)-induced oxidation: Synergistic and antagonistic effects. J. Am. Oil Chem. Soc. 2003, 80, 1007–1011. [Google Scholar] [CrossRef]
- Reyes, L.F.; Cisneros-Zevallos, L. Wounding stress increases the phenolic contentand antioxidant capacity of purple-flesh potatoes (Solanum tuberosum L.). J. Agric. Food Chem. 2003, 51, 5296–5300. [Google Scholar] [CrossRef]
- Reyes, L.F.; Villarreal, J.E.; Cisneros-Zevallos, L. The increase in antioxidant capacity after wounding depends on the type of fruit and vegetable tissue. Food Chem. 2007, 101, 1254–1262. [Google Scholar] [CrossRef]
- Heredia, J.B.; Cisneros-Zevallos, L. The effect of exogenous ethylene and methyljasmonate on pal activity, phenolic profiles and antioxidant capacity of carrots (Daucus carota) under different wounding intensities. Postharvest Biol. Technol. 2009, 51, 242–249. [Google Scholar]
- Demirezer, L.O.; Gürbüz, F.; Güvenalp, Z.; Ströch, K.; Zeeck, A. Iridoids, flavonoids and monoterpene glycosides from Galium verum subsp. Verum. Turk. J. Chem. 2006, 30, 525–534. [Google Scholar]
- Al-Snafi, A.E. Galium verum—A review. Indo Am. J. Pharm. Sci. 2018, 5, 2142–2149. [Google Scholar]
- Farcas, D.A.; Mot, C.A.; Zagrean-Tuza, C.; Toma, V.; Cimpoiu, C.; Hosu, A.; Parvu, M.; Roman, I.; Silaghi-Dumitrescu, R. Chemo-mapping and biochemical-modulatory and antioxidant/prooxidant effect of Galium verum extract during acute restraint and dark stress in female rats. PLoS ONE 2018, 13, e0200022. [Google Scholar] [CrossRef] [PubMed]
- Zhao, C.C.; Shao, J.H.; Li, X.; Kang, X.D.; Zhang, Y.W.; Meng, D.L.; Li, N. Flavonoids from Galium verum L. J. Asian Nat. Prod. Res. 2008, 10, 611–615. [Google Scholar] [CrossRef]
- Demirezer, O.; Kuruuzum, A.; Bergere, I.; Schiewe, H.J.; Zeeck, A. Five naphthalene glycosides from the roots of Rumex patientia. Phytochemistry 2001, 56, 399–402. [Google Scholar] [CrossRef]
- Zhao, C.C.; Shao, J.H.; Li, X.; Xu, J.; Wang, J.H. A new anthraquinone from Galium verum L. Nat. Prod. Res. 2006, 20, 981–984. [Google Scholar] [CrossRef]
- Shynkovenko, I.L.; Ilyna, V.T.; Kovalyova, M.A.; Goryacha, V.O.; Golembiovska, I.O.; Koshovyi, M.O. Saponins of the extracts of Galium aparine and Galium verum. Vìsnik Farm. 2018, 4, 16–23. [Google Scholar] [CrossRef]
- Tava, A.; Biazzi, E.; Ronga, D.; Avato, P. Idetification of the Volatile Components of Galium verum L. and Cruciata leavipes Opiz from the Western Italian Alps. Molecules 2020, 25, 2333. [Google Scholar] [CrossRef] [PubMed]
- Lakić, N.S.; Mimica-Dukić, N.M.; Isak, J.M.; Božin, B.N. Antioxidant properties of Galium verum L. (Rubiaceae) extracts. Cent. Eur. J. Biol. 2010, 5, 331–337. [Google Scholar] [CrossRef]
- Hanganu, D.; Burtescu, R.F.; Petrescu, S.; Pripon Furtuna, F.R.; Chise, E.; Turcus, V.; Benedec, D.; Oniga, I.; Olah, N.K. Galium species–Polyphenolic content and their antioxidant potential. Hop. Med. Plants 2018, 1–2, 84–93. [Google Scholar]
- Ghita, G.; Necula, R.; Trifan, A.; Gille, E.; Zamfirache, M.M.; Stanescu, U. Investigations regarding the phytochemical study of some samples of Galium verum L. and Galium album mill. Sci. Ann. Al. I. Cuza Univ. Iasi 2012, 58, 45–50. [Google Scholar]
- Mocan, A.; Crisan, G.; Vlase, L.; Ivanescu, B.; Badarau, S.A.; Arsene, L.A. Phytochemical Investigations on Four Galium Species (Rubiaceae) from Romania. Farmacia 2016, 64, 95–99. [Google Scholar]
- Mocan, A.; Diuzheva, A.; Badarau, S.; Moldovan, C.; Andruch, V.; Carradori, S.; Campestre, C.; Tartaglia, A.; De Simone, M.; Vodnar, D.; et al. Liquid Phase and Microwave-Assisted Extractions for Multicomponent Phenolic Pattern Determination of Five Romanian Galium Species Coupled with Bioassays. Molecules 2019, 24, 1226. [Google Scholar] [CrossRef]
- Tamas, M.; Stana, D.; Timis, S. Comparative phytochemical research of Galium verum L. and G. mollugo L. Not. Bot. Hort. Agrobot. Cluj-Napoca 2006, 34, 18–20. [Google Scholar]
- Turcov, D.; Barna, A.S.; Trifan, A.; Blaga, A.C.; Tanasă, A.M.; Suteu, D. Antioxidants from Galium verum as Ingredients for the Design of New Dermatocosmetic Products. Plants 2022, 11, 2454. [Google Scholar] [CrossRef]
- Pieroni, A.; Quave, C.L. Traditional pharmacopoeias and medicines among Albanians and Italians in southern Italy: A comparison. J. Ethnopharmacol. 2005, 101, 258–270. [Google Scholar] [CrossRef]
- Menković, N.; Šavikin, K.; Tasić, S.; Zdunić, G.; Stešević, D.; Milosavljević, S.; Vincek, D. Ethnobotanical study on traditional uses of wild medicinal plants in Prokletije Mountains (Montenegro). J. Ethnopharmacol. 2011, 133, 97–107. [Google Scholar] [CrossRef] [PubMed]
- Khaliq Jan, A.; Raza Shah, M.; Anis, I.; Khan Marwat, I. In vitro antifungal and antibacterial activities of extracts of Galium tricornutum subsp. Longipedunculatum. J. Enzym. Inhib. Med. Chem. 2009, 24, 192–196. [Google Scholar]
- Schmidt, M.; Polednik, C.; Roller, J.; Hagen, R. Galium verum aqueous extract strongly inhibits the motility of head and neck cancer cell lines and protects mucosal keratinocytes against toxic DNA damage. Oncol. Rep. 2014, 32, 1296–1302. [Google Scholar] [CrossRef] [PubMed]
- Bradic, J.; Petkovic, A.; Tomovic, M. Phytochemical and Pharmacological Properties of Some Species of the Genus galium L. (Galium verum and Mollugo). Serb. J. Exp. Clin. Res. 2017, 1, 187–193. [Google Scholar] [CrossRef]
- Kuhtinskaja, M.; Vaher, M. Extraction and Analysis of Bioactive Compounds from Dipsacus fullonum and Galium verum for Lyme Borreliosis Treatment. Biomed. J. Sci. Tech. Res. 2018, 11, 8614–8616. [Google Scholar]
- Shinkovenko, I.L.; Kashpur, N.V.; Ilina, T.V.; Kovalyova, A.M.; Goryacha, O.V.; Koshovyi, O.M.; Kryvoruchko, O.V.; Komissarenko, A.M. The immunomodulatory activity of ethanolic extracts from Galium verum L. herb. Ceska Slov. Farm. 2018, 67, 101–106. [Google Scholar]
- Ilina, T.; Kashpur, N.; Granica, S.; Bazylko, A.; Shinkovenko, I.; Kovalyova, A.; Goryacha, O.; Koshovyi, O. Phytochemical Profiles and In Vitro Immunomodulatory Activity of Ethanolic Extracts from Galium aparine L. Plants 2019, 8, 541. [Google Scholar] [CrossRef]
- Bradic, J.; Zivkovic, V.; Srejovic, I.; Jakovljevic, V.; Petkovic, A.; Turnic, T.N.; Jeremic, J.; Jeremic, N.; Mitrovic, S.; Sobot, T.; et al. Protective Effects of Galium verum L. Extract against Cardiac Ischemia/Reperfusion Injury in Spontaneously Hypertensive Rats. Oxid. Med. Cell. Longev. 2019, 2019, 4235405. [Google Scholar] [CrossRef]
- Bradic, J.; Jeremic, N.; Petkovic, A.; Jeremic, J.; Zivkovic, V.; Srejovic, I.; Sretenovic, J.; Matic, S.; Jakovljevic, V.; Tomovic, M. Cardioprotective effects of Galium verum L. extract against myocardial ischemia-reperfusion injury. Arch. Physiol. Biochem. 2020, 126, 408–415. [Google Scholar] [CrossRef]
- Abdul, R.; Wang, M.R.; Zhong, C.J.; Liu, Y.Y.; Hou, W.; Xiong, H.R. An Updated Review on the Antimicrobial and Pharmacological Properties of Uncaria (Rubiaceae). J. Herb. Med. 2022, 34, 100573. [Google Scholar] [CrossRef]
- Khan, S.A.; Khan, H.; Ahmad, S.; Rehman, F.U.; Khan, A.A.; Khan, M.A. GCMS characterization and biological potential of the seeds and aerial part of Galium tricorne Stokes. Braz. J. Biol. 2022, 84, e256920. [Google Scholar] [CrossRef] [PubMed]
- Schmidt, M.; Scholz, C.J.; Gavril, G.L.; Otto, C.; Polednik, C.; Roller, J.; Hagen, R. Effect of Galium verum aqueous extract on growth, motility and gene expression in drug-sensitive and –resistant laryngeal carcinoma cell lines. Int. J. Oncol. 2014, 44, 745–760. [Google Scholar] [CrossRef] [PubMed]
- World Health Organization. The World Medicines Situation 2011—Traditional Medicines: Global Situation, Issues and Challenges; World Health Organization: Geneva, Switzerland, 2011. [Google Scholar]
- Karimi, A.; Majlesi, M.; Rafieian-Kopaei, M. Herbal versus synthetic drugs; beliefs and facts. J. Nephropharmacol. 2015, 4, 27–30. [Google Scholar] [PubMed]
- Cisneros-Zevallos, L.; Jacobo-Velázquez, D.A. Controlled Abiotic Stresses Revisited: From Homeostasis through Hormesis to Extreme Stresses and the Impact on Nutraceuticals and Quality during Pre- and Postharvest Applications in Horticultural Crop. J. Agric. Food Chem. 2020, 68, 11877–11879. [Google Scholar] [CrossRef]
- Mojzer, E.B.; Hrncic, M.K.; Škerge, M.; Knez, Z.; Bren, U. Polyphenols: Extraction Methods, Antioxidative Action, Bioavailability and Anticarcinogenic Effects. Molecules 2016, 21, 901. [Google Scholar] [CrossRef]
- Rusu, M.; Gheldiu, A.-M.; Mocan, A.; Moldovan, C.; Popa, D.-S.; Tomuta, I.; Vlase, L. Process Optimization for Improved Phenolic Compounds Recovery from Walnut (Juglans regia L.) Septum: Phytochemical Profile and Biological Activities. Molecules 2018, 23, 2814. [Google Scholar] [CrossRef]
- Benedec, D.; Oniga, I.; Muresan, B.; Mot, A.C.; Damian, G.; Nistor, A.; Silaghi-Dumitrescu, R.; Hanganu, D.; Duma, M.; Vlase, L. Contrast between water- and ethanol-based antioxidant assays: Aspen (Populus tremula) and black poplar (Populus nigra) extracts as a case study. J. Food Qual. 2014, 37, 259–267. [Google Scholar] [CrossRef]
- El Hassani, S.E.A.; Driouich, A.; Mellouk, H.; Bejjany, B.; Dani, A.; Digua, K. Extraction of phenolic from Moroccan grape pomace: Optimization of decoction extraction of phenolic compounds using response surface methodology. Mediterr. J. Chem. 2019, 7, 423–432. [Google Scholar] [CrossRef]
- Yang, J.; Ou, X.; Zhang, X.; Zhou, Z.; Ma, L. Effect of Different Solvents on the Measurement of Phenolics and the Antioxidant Activity of Mulberry (Morus atropurpurea Roxb.) with Accelerated Solvent Extraction. J. Food Sci. 2017, 82, 605–612. [Google Scholar] [CrossRef]
- Friščić, M.; Štibrić Baglama, M.; Milović, M.; Hazler Pilepić, K.; Maleš, Ž. Content of Bioactive Constituents and Antioxidant Potential of Galium L. Species. Croat. Chem. Acta 2018, 91, 411–417. [Google Scholar] [CrossRef]
- Benedec, D.; Hanganu, D.; Oniga, I.; Filip, L.; Bischin, C.; Silaghi-Dumitrescu, R.; Tiperciuc, B.; Vlase, L. Achillea schurii flowers: Chemical, antioxidant, and antimicrobial investigations. Molecules 2016, 21, 1050. [Google Scholar] [CrossRef] [PubMed]
- Kim, H.; Kong, H.; Choi, B.; Yang, Y.; Kim, Y.; Lim, M.J.; Neckers, L.; Jung, Y. Metabolic and pharmacological properties of rutin, a dietary quercetin glycoside, for treatment of inflammatory bowel disease. Pharm. Res. 2005, 22, 1499–1509. [Google Scholar] [CrossRef]
- Xu, P.X.; Wang, S.W.; Yu, X.L.; Su, Y.J.; Wang, T.; Zhou, W.W.; Zhang, H.; Wang, Y.J.; Liu, R.T. Rutin improves spatial memory in Alzheimer’s disease transgenic mice by reducing Ab oligomer level and attenuating oxidative stress and neuroinflammation. Behav. Brain Res. 2014, 264, 173–180. [Google Scholar] [CrossRef]
- Karak, P. Biological activities of flavonoids: An overview. Int. J. Pharm. Sci. Res. 2019, 10, 1567–1574. [Google Scholar]
- Rogerio, A.P.; Kanashiro, A.; Fontanari, C.; Da Silva, E.V.G.; Lucisano-Valim, Y.M.; Soares, E.G.; Faccioli, L.H. Anti-inflammatory activity of quercetin and isoquercitrin in experimental murine allergic asthma. Inflamm. Res. 2007, 56, 402–408. [Google Scholar] [CrossRef] [PubMed]
- Laanet, P.-R.; Saar-Reismaa, P.; Jõul, P.; Bragina, O.; Vaher, M. Phytochemical Screening and Antioxidant Activity of Selected Estonian Galium Species. Molecules 2023, 28, 2867. [Google Scholar] [CrossRef] [PubMed]
- Zaichikova, S.G.; Bokov, D.O.; Kiselevskii, M.V.; Antsyshkina, A.M.; Bondar, A.A.; Prostodusheva, T.V.; Shchepochkina, O.Y.; Gegechkori, V.I. Determination of the Chemical Composition of Lady’s Bedstraw (Galium verum L.) Herb Extract by GC-MS. Pharmacogn. J. 2020, 12, 857–863. [Google Scholar] [CrossRef]
- Jacobo-Velázquez, D.A.; Cisneros-Zevallos, L. Correlations of antioxidant activity against phenolic content revisited: A new approach in data analysis for food and medicinal plants. J. Food Sci. 2009, 74, 107–113. [Google Scholar] [CrossRef]
- Szymczycha-Madeja, A.; Welna, M.; Zyrnicki, W. Multi-element analysis, bioavailability and fractionation of herbal tea products. J. Braz. Chem. Soc. 2013, 24, 777–787. [Google Scholar] [CrossRef]
- Chang, H.; Kao, M.J.; Chen, T.L.; Chen, C.H.; Cho, K.C.; Lai, X.R. Characterization of Natural Dye Extracted from Wormwood and Purple Cabbage for Dye-Sensitized Solar Cells. Int. J. Photoenergy 2013, 2013, 159502. [Google Scholar] [CrossRef]
- Mohani, N.; Ahmad, M.; Jahan, N. Evaluation of phytoconstituents of three plants Acorus calamus linn. Artemisia absinthium Linn and Bergenia himalaica boriss by FTIR spectroscopic analysis. Pak. J. Pharm. Sci. 2014, 27, 2251–2255. [Google Scholar] [PubMed]
- Li, Y.Q.; Kong, D.X.; Wu, H. Analysis and evaluation of essential oil components of cinnamon barks using GC–MS and FTIR spectroscopy. Ind. Crops Prod. 2013, 41, 269–278. [Google Scholar] [CrossRef]
- Heredia-Guerrero, J.A.; Benítez, J.J.; Domínguez, E.; Bayer, I.S.; Cingolani, R.; Athanassiou, A.; Heredia, A. Infrared and Raman spectroscopic features of plant cuticles: A review. Front. Plant Sci. 2014, 5, 305. [Google Scholar] [CrossRef] [PubMed]
- Blainski, A.; Lopes, G.C.; De Mello, J.C.P. Application and analysis of the folin ciocalteu method for the determination of the total phenolic content from Limonium Brasiliense L. Molecules 2013, 18, 6852–6865. [Google Scholar] [CrossRef] [PubMed]
- Sánchez-Rangel, J.C.; Benavides, J.; Heredia, J.B.; Cisneros-Zevallos, L.; Jacobo-Velázquez, D.A. The Folin-Ciocalteu assay revisited: Improvement of its specificity for total phenolic content determination. Anal. Methods 2013, 5, 5990–5999. [Google Scholar] [CrossRef]
- Danila, A.O.; Gatea, F.; Radu, G.L. Polyphenol composition and antioxidant activity of selected medicinal herbs. Chem. Nat. Compd. 2011, 47, 22–26. [Google Scholar] [CrossRef]
- Gayibova, S.; Ivanišová, E.; Árvay, J.; Hŕstková, M.; Slávik, M.; Petrová, J.; Hleba, L.; Tóth, T.; Kačániová, M.; Aripov, T. In vitro screening of antioxidant and antimicrobial activities of medicinal plants growing in Slovakia. J. Microbiol. Biotechnol. Food Sci. 2021, 2021, 1281–1289. [Google Scholar] [CrossRef]
- Antoniak, K.; Studzińska-Sroka, E.; Szymański, M.; Dudek-Makuch, M.; Cielecka-Piontek, J.; Korybalska, K. Antiangiogenic, Anti-Inflammatory and Antioxidant Properties of Bidens tripartite Herb, Galium verum Herb and Rumex hydrolapathum Root. Molecules 2023, 28, 4966. [Google Scholar] [CrossRef]
- Vlase, L.; Mocan, A.; Hanganu, D.; Benedec, D.; Gheldiu, A.; Crișan, G. Comparative study of polyphenolic content, antioxidant and antimicrobial activity of four Galium species (Rubiaceae). Dig. J. Nanomater. Biostruct 2014, 9, 1085–1094. [Google Scholar]
- Armatu, A.; Mihul, A.; Bubueanu, C.; Draghici, E.; Pirvu, L. Evaluation of antioxidant and free scavenging potential of some Lamiaceae species growing in Romania. Rom. Biotechnol. Lett. 2009, 15, 5274–5280. [Google Scholar]
- Ali, M.H.; Salem, M.Z.M.; Al Sahli, A. Performance of antioxidant activity of methanolic extracts from different parts of some tree species using DPPH radical-scavenging assay. J. Pure Appl. Microbiol. 2013, 7, 131–137. [Google Scholar]
- Mitic, V.D.; Stankov-Jovanovic, V.P.; Ilic, M.D.; Vasiljevic, P.J.; Zabar, A.L.; Stojanovic, G.S. The antioxidant, hemolytic and cholinesterase inhibition properties of Galium verum L. and Tragopogon pratensis subsp. pratensis Bulg. Chem. Commun. 2014, 46, 269. [Google Scholar]
- Bokhari, J.; Khan, M.R.; Shabbir, M.; Rashid, U.; Jan, S.; Zai, J.A. Evaluation of diverse antioxidant activities of Galium aparine. Spectrochim. Acta A Mol. Biomol. Spectrosc. 2013, 102, 24–29. [Google Scholar] [CrossRef] [PubMed]
- Ilyina, T.V.; Goryacha, O.V.; Kovaleva, A.M.; Koshovyi, O.M.; Shinkovenko, I.L. A comparative study of morphological features and flavonoid composition of galium L. genus species. Der Pharm. Lett. 2016, 8, 316–320. [Google Scholar]
- Li, X.; Jiang, Q.; Wang, T.; Liu, J.; Chen, D. Comparison of the Antioxidant Effects of Quercitrin and Isoquercitrin: Understanding the Role of the 6″-OH Group. Molecules 2016, 21, 1246. [Google Scholar] [CrossRef] [PubMed]
- Chung, P.Y.; Chung, L.Y.; Ngeow, Y.F.; Goh, S.H.; Imiyabir, Z. Antimicrobial activities of Malaysian plant species. Pharm. Biol. 2004, 42, 292–300. [Google Scholar] [CrossRef]
- Ulukanli, Z.; Ulukanli, S.; Ozbay, H.; Ilcim, A.; Tuzcu, M. Antimicrobial activities of some plants from the Eastern Anatolia region of Turkey. Pharm. Biol. 2005, 43, 334–339. [Google Scholar] [CrossRef] [PubMed]
- Hernández-Colina, M.; Cermeño, A.M.; Díaz García, A. Selective cytotoxic effect of 1-O-undecylglycerol in human melanoma cells. J. Pharm. Pharmacogn. Res. 2016, 4, 84–94. [Google Scholar]
- Crowley, L.C.; Marfell, B.J.; Waterhouse, N.J. Analyzing Cell Death by Nuclear Staining with Hoechst 33342. Cold Spring Harb. Protoc. 2016. [Google Scholar] [CrossRef]
- Pashapour, S.; Heshmati, M.; Mousavi, Z.; Esmaeili, S. The Cytotoxicity of the Chloroform and Petroleum Ether Fractional Extracts of Galium verum L. in HepG2 and HT29 Cell Lines. J. Kermanshah Univ. Med. Sci. 2020, 24, e101079. [Google Scholar] [CrossRef]
- Shi, G.; Liu, J.; Zhao, W.; Liu, Y.; Tian, X. Separation and purification and in vitro anti-proliferative activity of leukemia cell K562 of Galium aparine L. petroleum ether phase. Saudi Pharm. J. 2016, 24, 241–244. [Google Scholar] [CrossRef] [PubMed]
- Kazemi, S.; Soltanzadeh, H.; Shahsavari, G. The study of anticancer activity of Satureja Khuzestanica alcoholic extracts on expression of Bcl2 and Bax genes in the Pc3 cell line. Res. Sq. 2021. [Google Scholar] [CrossRef]
- Abubakar, A.R.; Haque, M. Preparation of Medicinal Plants: Basic Extraction and Fractionation Procedures for Experimental Purposes. J. Pharm. Bioallied Sci. 2020, 12, 1–10. [Google Scholar] [CrossRef] [PubMed]
- Gori, A.; Boucherle, B.; Rey, A.; Rome, M.; Fuzzati, N.; Peuchmaur, M. Development of an innovative maceration technique to optimize extraction and phase partition of natural products. Fitoterapia 2021, 148, 104798. [Google Scholar] [CrossRef] [PubMed]
- Characteristic of IR Absorption Frequencies of Organic Functional Groups. Available online: http://www2.ups.edu/faculty/hanson/Spectroscopy/IR/IRfrequencies.html (accessed on 19 August 2023).
- Benedec, D.; Vlase, L.; Oniga, I.; Mot, A.C.; Damian, G.; Hanganu, D.; Duma, M.; Silaghi-Dumitrescu, R. Polyphenolic composition, antioxidant and antibacterial activities for two Romanian subspecies of Achillea distans Waldst. Et Kit. Ex Willd. Molecules 2013, 18, 8725–8739. [Google Scholar] [CrossRef]
- Andriamadio, J.H.; Rasoanaivo, L.H.; Benedec, D.; Vlase, L.; Gheldiu, A.M.; Duma, M.; Toiu, A.; Raharisololalao, A.; Oniga, I. HPLC/MS analysis of polyphenols, antioxidant and antimicrobial activities of Artabotrys hildebrandtii O. Hm. Extracts. Nat. Prod. Res. 2015, 29, 2188–2196. [Google Scholar] [CrossRef]
- Vlase, L.; Parvu, M.; Parvu, E.A.; Toiu, A. Chemical constituents of three Allium species from Romania. Molecules 2012, 18, 114–127. [Google Scholar] [CrossRef]
- Msaada, K.; Salem, N.; Bachrouch, O.; Bousselmi, S.; Tammar, S.; Alfaify, A.; Al Sane, K.; Ben Amar, W.; Azeiz, S.; Haj Brahim, A.; et al. Chemical composition and antioxidant and antimicrobial activities of wormwood (Artemisia absinthium L.) essential oils and phenolics. J. Chem. 2015, 2015, 804658. [Google Scholar] [CrossRef]
- Moacă, E.A.; Pavel, I.Z.; Danciu, C.; Crăiniceanu, Z.; Minda, D.; Ardelean, F.; Antal, D.S.; Ghiulai, R.; Cioca, A.; Derban, M.; et al. Romanian Wormwood (Artemisia absinthium L.): Physicochemical and Nutraceutical Screening. Molecules 2019, 24, 3087. [Google Scholar] [CrossRef]
- Arendrup, M.C.; Cuenca-Estrella, M.; Lass-Flörl, C.; Hope, W.; EUCAST-AFST. EUCAST technical note on the EUCAST definitive document EDef 7.2: Method for the determination of broth dilution minimum inhibitory concentrations of antifungal agents for yeasts EDef 7.2 (EUCAST-AFST). Clin. Microbiol. Infect. 2012, 18, E246–E247. [Google Scholar] [CrossRef]
- Clinical and Laboratory Standards Institute. Methods for Dilution Antimicrobial Susceptibility Tests for Bacteria That Grow Aerobically, 11th ed.; M07Ed11; Clinical and Laboratory Standards Institute: Wayne, PA, USA, 2018. [Google Scholar]
- Jianu, C.; Stoin, D.; Cocan, I.; David, I.; Pop, G.; Lukinich-Gruia, A.T.; Mioc, M.; Mioc, A.; Șoica, C.; Muntean, D.; et al. In Silico and In Vitro Evaluation of the Antimicrobial and Antioxidant Potential of Mentha × smithiana R. GRAHAM Essential Oil from Western Romania. Foods 2021, 10, 815. [Google Scholar] [CrossRef] [PubMed]
- Minda, D.; Ghiulai, R.; Banciu, C.D.; Pavel, I.Z.; Danciu, C.; Racoviceanu, R.; Soica, C.; Budu, O.D.; Muntean, D.; Diaconeasa, Z.; et al. Phytochemical Profile, Antioxidant and Wound Healing Potential of Three Artemisia Species: In Vitro and In Ovo Evaluation. Appl. Sci. 2022, 12, 1359. [Google Scholar] [CrossRef]
- Buda, V.; Brezoiu, A.-M.; Berger, D.; Pavel, I.Z.; Muntean, D.; Minda, D.; Dehelean, C.A.; Soica, C.; Diaconeasa, Z.; Folescu, R.; et al. Biological Evaluation of Black Chokeberry Extract Free and Embedded in Two Mesoporous Silica-Type Matrices. Pharmaceutics 2020, 12, 838. [Google Scholar] [CrossRef] [PubMed]
- Fiat, F.; Niculescu, B.; Roi, A.; Rivis, M.; Anton, A.; Marcovici, I.; Semenescu, A.D.; Vlad, D.; Delcea, C.; Bernad, E.; et al. In vitro characterization of the cytotoxic profile of lidocaine on A-375 cutaneous melanoma cells and HaCaT keratinocytes. Farmacia 2023, 71, 4. [Google Scholar] [CrossRef]
- Xu, C.; Sun, G.; Yuan, G.; Wang, R.; Sun, X. Effects of platycodin D on proliferation, apoptosis and PI3K/Akt signal pathway of human glioma U251 cells. Molecules 2014, 19, 21411–21423. [Google Scholar] [CrossRef]


| Wavenumber (cm−1) | Functional Groups | Bond | |||
|---|---|---|---|---|---|
| GvEtOH | GvEtOAc | GvEtOH | GvEtOAc | GvEtOH | GvEtOAc |
| 3412.08 | - | Alcohol | - | OH stretch (H-bonded) | - |
| 2926.01 | 2924.09 | Alkane/ Alcohol (acid) | Alkane/ Alcohol (acid) | C-H stretching/ OH stretch | C-H stretching/ OH stretch |
| 2852.72 | 2852.72 | Alkane | Alkane | C-H stretching | C-H stretching |
| 1735.93 | 1734.01 | Carbonyl | Carbonyl | C=O stretch | C=O stretch |
| 1654.92 | - | Amide/Alkene | - | C=O stretch C=C stretching | - |
| 1604.77 | 1604.77 | Cyclic alkene/ | Cyclic alkene/ | C=C stretching | C=C stretching |
| 1516.05 | 1516.05 | Aromatic compounds | Aromatic compounds | C=C stretch | C=C stretch |
| 1458.18 | 1463.97 | Alkane (methylene group)/Aromatics | Alkane (methylene group)/Aromatics | C-H bending/ C=C stretch (in ring) | C-H bending/C=C stretch (in ring) |
| 1367.53 | 1379.10 | Alkane | Alkane | -C-H bending | -C-H bending |
| 1259.52 | 1261.45 | Acids | Acids | C-O stretch | C-O stretch |
| 1170.79 | 1172.72 | Alcohol (tertiary) | Alcohol (tertiary) | C-O stretching | C-O stretching |
| 1074.35 | 1091.71 | Alcohol (primary) | Alcohol (secondary) | C-O stretch | C-O stretch |
| 1045.42 | - | Anhydride | - | CO-O-CO stretching | - |
| 914.26 | 981.77 | Alkane (disubstituted (trans))/Alkenes | Alkane (disubstituted (trans))/Alkenes | C=C bending/ =C-H bending | C=C bending/ =C-H bending |
| 856.39 | - | Alkane | - | C=C bending | - |
| 810.10 | 804.32 | Alkane (trisubstituted)/ Halo compounds | Alkane (trisubstituted)/ Halo compounds | C=C bending/ C-Cl stretching | C=C bending/ C-Cl stretching |
| 763.81 | - | Alkane (trisubstituted)/ Halo compounds | - | C=C bending/ C-Cl stretching | - |
| 719.45 | 721.38 | Alkane (disubstituted (cis))/ Halo compounds | Alkane (disubstituted (cis))/ Halo compounds | C=C bending/ C-Cl stretching | C=C bending/ C-Cl stretching |
| 630.72 | - | Halo compounds | - | C-Cl; C-Br stretching | - |
| 599.86 | - | Halo compounds | - | C-Cl; C-Br stretching | - |
| 551.64 | - | Halo compounds | - | C-Cl; C-Br stretching | - |
| GvEtOH | |||
|---|---|---|---|
| Compound Name | UV Identified | MS Qualitatively Identified | Concentration (μg/mL) |
| Chlorogenic acid | Yes | Yes | 8.027 |
| 4-O caffeoylquinic acid | Yes | Yes | 0.172 |
| Isoquercitrin | Yes | Yes | 17.765 |
| Rutin | Yes | Yes | 14.811 |
| Quercitrin | No | Yes | - |
| Quercetol | Yes | Yes | 1.275 |
| Luteolin | Yes | Yes | 0.260 |
| GvEtOAc | |||
| Chlorogenic acid | Yes | Yes | 10.216 |
| 4-O caffeoylquinic acid | Yes | Yes | 0.096 |
| Isoquercitrin | Yes | Yes | 20.384 |
| Rutin | Yes | Yes | 1.896 |
| Quercitrin | Yes | Yes | 6.722 |
| Quercetol | Yes | Yes | 0.779 |
| Luteolin | Yes | Yes | 0.191 |
| Extract | Concentrations (μg/mL) | |||||
|---|---|---|---|---|---|---|
| Epicatechin | Catechin | Syringic Acid | Gallic Acid | Protocatechuic Acid | Vanillic Acid | |
| GvEtOH | 1.10 | ND 1 | ND 1 | ND 1 | ND 1 | ND 1 |
| GvEtOAc | ND 1 | ND 1 | ND 1 | 0.34 | ND 1 | ND 1 |
| Examined Extract Concentration (mg/mL) | Antioxidant Potential AP (%) | EC50 (mg/mL) | |||
|---|---|---|---|---|---|
| Vitamin C (Standard) | GvEtOH | GvEtOAc | GvEtOH | GvEtOAc | |
| 1 | 97.08 ± 0.04 | 88.66 ± 0.003 | 96.10 ± 0.04 | 0.136 ± 0.03 | 0.074 ± 0.01 |
| 0.8 | 85.95 ± 0.06 | 95.91 ± 0.04 | |||
| 0.5 | 56.21 ± 0.04 | 93.24 ± 0.04 | |||
| 0.3 | 56.05 ± 0.04 | 74.74 ± 0.06 | |||
| 0.1 | 40.87 ± 0.07 | 51.74 ± 0.04 | |||
| 0.05 | 36.96 ± 0.02 | 45.41 ± 0.03 | |||
| Test Compounds | Microbial Strains | MIC (mg/mL) | MBC (mg/mL) |
|---|---|---|---|
| GvEtOH | Streptococcus pyogenes (Gram +) | 15 | 30 |
| Staphylococcus aureus (Gram +) | 30 | 30 | |
| Escherichia coli (Gram −) | 30 | NA 1 | |
| Pseudomonas aeruginosa (Gram −) | NA 1 | NA 1 | |
| GvEtOAc | Streptococcus pyogenes(Gram +) | 15 | 15 |
| Staphylococcus aureus (Gram +) | 15 | 15 | |
| Escherichia coli (Gram −) | 30 | NA 1 | |
| Pseudomonas aeruginosa (Gram −) | NA 1 | NA 1 |
Disclaimer/Publisher’s Note: The statements, opinions and data contained in all publications are solely those of the individual author(s) and contributor(s) and not of MDPI and/or the editor(s). MDPI and/or the editor(s) disclaim responsibility for any injury to people or property resulting from any ideas, methods, instructions or products referred to in the content. |
© 2023 by the authors. Licensee MDPI, Basel, Switzerland. This article is an open access article distributed under the terms and conditions of the Creative Commons Attribution (CC BY) license (https://creativecommons.org/licenses/by/4.0/).
Share and Cite
Semenescu, A.-D.; Moacă, E.-A.; Iftode, A.; Dehelean, C.-A.; Tchiakpe-Antal, D.-S.; Vlase, L.; Vlase, A.-M.; Muntean, D.; Chioibaş, R. Phytochemical and Nutraceutical Screening of Ethanol and Ethyl Acetate Phases of Romanian Galium verum Herba (Rubiaceae). Molecules 2023, 28, 7804. https://doi.org/10.3390/molecules28237804
Semenescu A-D, Moacă E-A, Iftode A, Dehelean C-A, Tchiakpe-Antal D-S, Vlase L, Vlase A-M, Muntean D, Chioibaş R. Phytochemical and Nutraceutical Screening of Ethanol and Ethyl Acetate Phases of Romanian Galium verum Herba (Rubiaceae). Molecules. 2023; 28(23):7804. https://doi.org/10.3390/molecules28237804
Chicago/Turabian StyleSemenescu, Alexandra-Denisa, Elena-Alina Moacă, Andrada Iftode, Cristina-Adriana Dehelean, Diana-Simona Tchiakpe-Antal, Laurian Vlase, Ana-Maria Vlase, Delia Muntean, and Raul Chioibaş. 2023. "Phytochemical and Nutraceutical Screening of Ethanol and Ethyl Acetate Phases of Romanian Galium verum Herba (Rubiaceae)" Molecules 28, no. 23: 7804. https://doi.org/10.3390/molecules28237804
APA StyleSemenescu, A.-D., Moacă, E.-A., Iftode, A., Dehelean, C.-A., Tchiakpe-Antal, D.-S., Vlase, L., Vlase, A.-M., Muntean, D., & Chioibaş, R. (2023). Phytochemical and Nutraceutical Screening of Ethanol and Ethyl Acetate Phases of Romanian Galium verum Herba (Rubiaceae). Molecules, 28(23), 7804. https://doi.org/10.3390/molecules28237804