Article

New Meroterpenoid Derivatives from the Pomegranate-Derived Endophytic Fungus Talaromyces purpureogenus

1
Department of Pharmacognosy, Faculty of Pharmacy, Ain-Shams University, Abbassia, Cairo 11566, Egypt
2
Institute of Pharmaceutical Biology and Biotechnology, Heinrich Heine University, Universitätsstrasse 1, 40225 Düsseldorf, Germany
3
Center for Drug Discovery Research and Development, Faculty of Pharmacy, Ain-Shams University, Abbassia, Cairo 11566, Egypt
4
Department of Organic Chemistry, University of Debrecen, P.O. Box 400, 4002 Debrecen, Hungary
5
Key Laboratory of Study and Discovery of Small Targeted Molecules of Hunan Province, School of Medicine, Hunan Normal University, Changsha 410013, China
*
Authors to whom correspondence should be addressed.
Molecules 2023, 28(22), 7650; https://doi.org/10.3390/molecules28227650
Submission received: 18 October 2023 / Revised: 5 November 2023 / Accepted: 14 November 2023 / Published: 18 November 2023
(This article belongs to the Special Issue Discovery of Bioactive Ingredients from Natural Products IV)

Abstract

:
In this study, we report the isolation of two new meroterpenoids, miniolutelide D (1) and miniolutelide E (13-epi-miniolutelide C) (2), along with two meroterpenoidal analogues (3 and 4) and two phenolic compounds (5 and 6) from the endophytic fungus Talaromyces purpureogenus derived from Punica granatum fruits. Their structures were elucidated using extensive MS, 1D, and 2D NMR spectroscopic analyses as well as by comparing with data in the literature. The absolute configurations of 1 and 2 were determined using TDDFT-ECD calculations. Antimicrobial activity was evaluated. Compound 5 displayed significant activity against methicillin-resistant Staphylococcus aureus strain ATCC 700699 and moderate activity against S. aureus strain ATCC 29213.

Graphical Abstract

1. Introduction

Nature has granted mankind plenty of drug leads since the beginning of history. Many of these are widely used now in clinical settings and in everyday use to ameliorate various diseases [1]. Originally, plants were the major source for isolating bioactive compounds. However, endophytes have recently received much more attention from researchers due to the structural and biological diversity of their natural products. Endophytes are the micro-organisms that live within the healthy tissues of plants in a symbiotic relationship, causing no harm to their hosts [2].
Fungal endophytes represent outstanding sources of new secondary metabolites spanning different classes of secondary metabolites, including polyketides, steroids, alkaloids, peptides, terpenoids, and quinones, among others, displaying potential biological activities. Although it has been estimated that approximately one million species of endophytic fungi exist, only 5% have been investigated. There are still many fungi yet to be explored that hold many undiscovered treasures [3,4,5].
The fungus Talaromyces purpureogenus, formerly known as Penicillium purpurogenum [6], has served as a source of many secondary metabolites of biological significance, including isocoumarins, sesquiterpenoids [7], meroterpenoids [8,9], diterpenoids, alkaloids [10], steroids, phenolic derivatives [11], esters [12], anhydrides [13] and pigments [14]. These bioactive compounds showed antibacterial [7], antioxidant [12], cytotoxic [10], anti-inflammatory [13], trypanocidal [9], and anti-pseudorabies virus activities [8].
As a subclass of terpenoids, meroterpenoids are composed of isoprene units with diverse chemical structures. This high diversity is accounted for by their mixed biosynthesis, which comprises both terpenoid and polyketide pathways [15]. Various meroterpenoids have been reported to exhibit antimicrobial activity against different bacterial and fungal strains. For example, 11-hydroxychevalone E showed antibacterial activity against Escherichia coli and Salmonella enterica serovar Typhimurium. Chevalone C exhibited antibacterial activity against Bacillus cereus and Staphylococcus aureus [16]. Antifungal activity was tested on formyl phloroglucinol meroterpenoids isolated from Eucalyptus robusta leaves. Among them, eucalrobusone J, eucalrobusone O, and macrocarpal C showed potent antifungal activity against Candida glabrata, whereas eucalrobusone O and macrocarpal C showed moderate antifungal activity against Candida albicans [17]. Other examples worth mentioning are chrodrimanins A and B isolated from Talaromyces funiculosus, which exhibited both broad spectrum and some selectivity against bacterial strains, respectively. Chrodrimanin A showed broad spectrum antibacterial activity against S. aureus, Mycobacterium phlei, and E. coli, and was majorly selective against Micrococcus tetragenus. Chrodrimanin B was moderately selective against E. coli [18]. Significant antibacterial activity against Helicobacter pylori and S. aureus was detected in aspergillactone obtained from the marine-derived fungus Aspergillus sp. CSYZ-1 [19].
In the ongoing search for new bioactive compounds from natural habitats, the fungal endophyte T. purpureogenus isolated from the tissues of Punica granatum fruit was investigated. Two new meroterpenoids, miniolutelide D (1) and miniolutelide E (13-epi-miniolutelide C) (2), together with two known meroterpenoids, berkeleyone C (3) and berkeleydione (4) [20], and two known phenolic compounds, alternariol (5) [21] and 3-methylorsellinic acid (6) [22], were obtained. Based on the biological potentials of meroterpenoids against wide varieties of bacteria and fungi, the new meroterpenoids (1 and 2) identified in this study, along with known analogues (3 and 4), and known phenolic compounds (5 and 6), were screened against pathogenic bacterial strains, including S. aureus ATCC 29213 and methicillin-resistant S. aureus ATCC 700699.

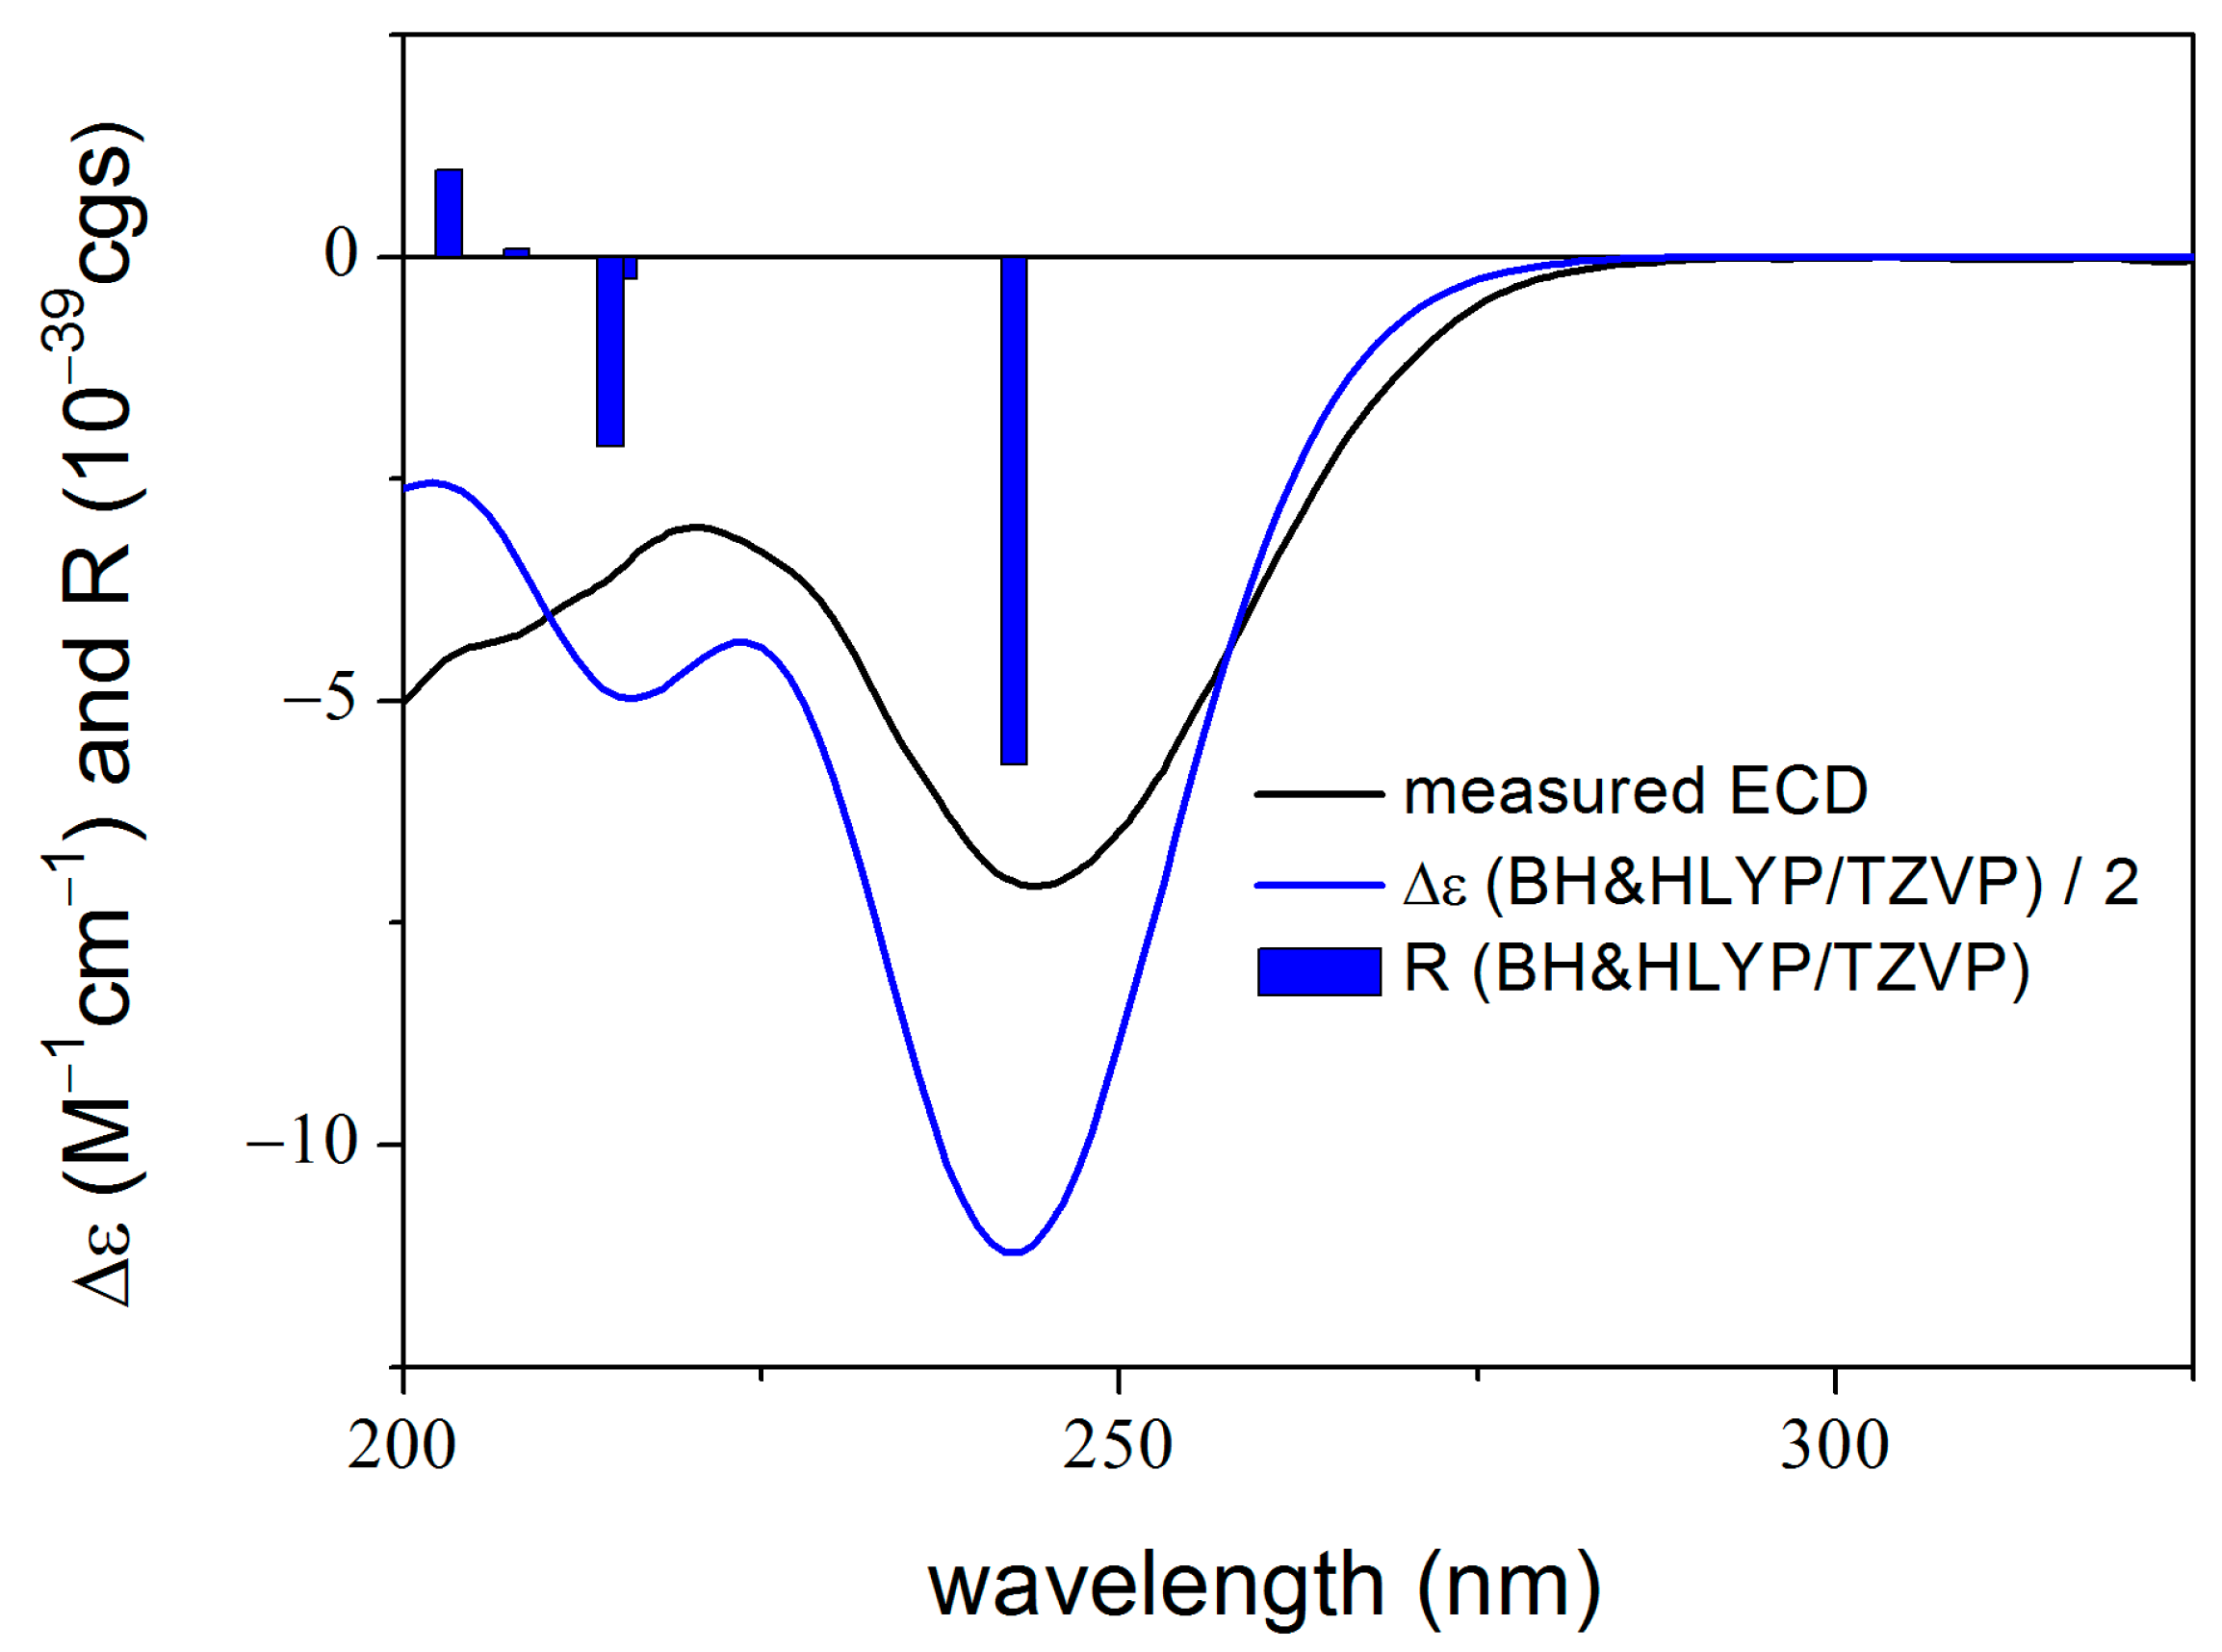
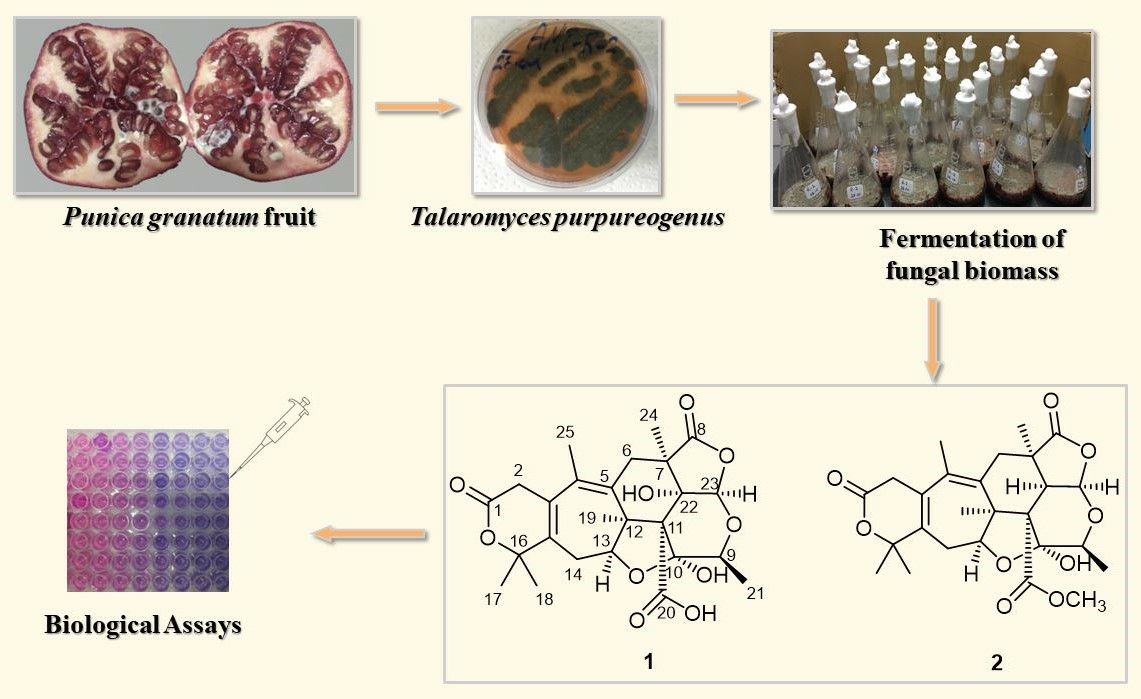
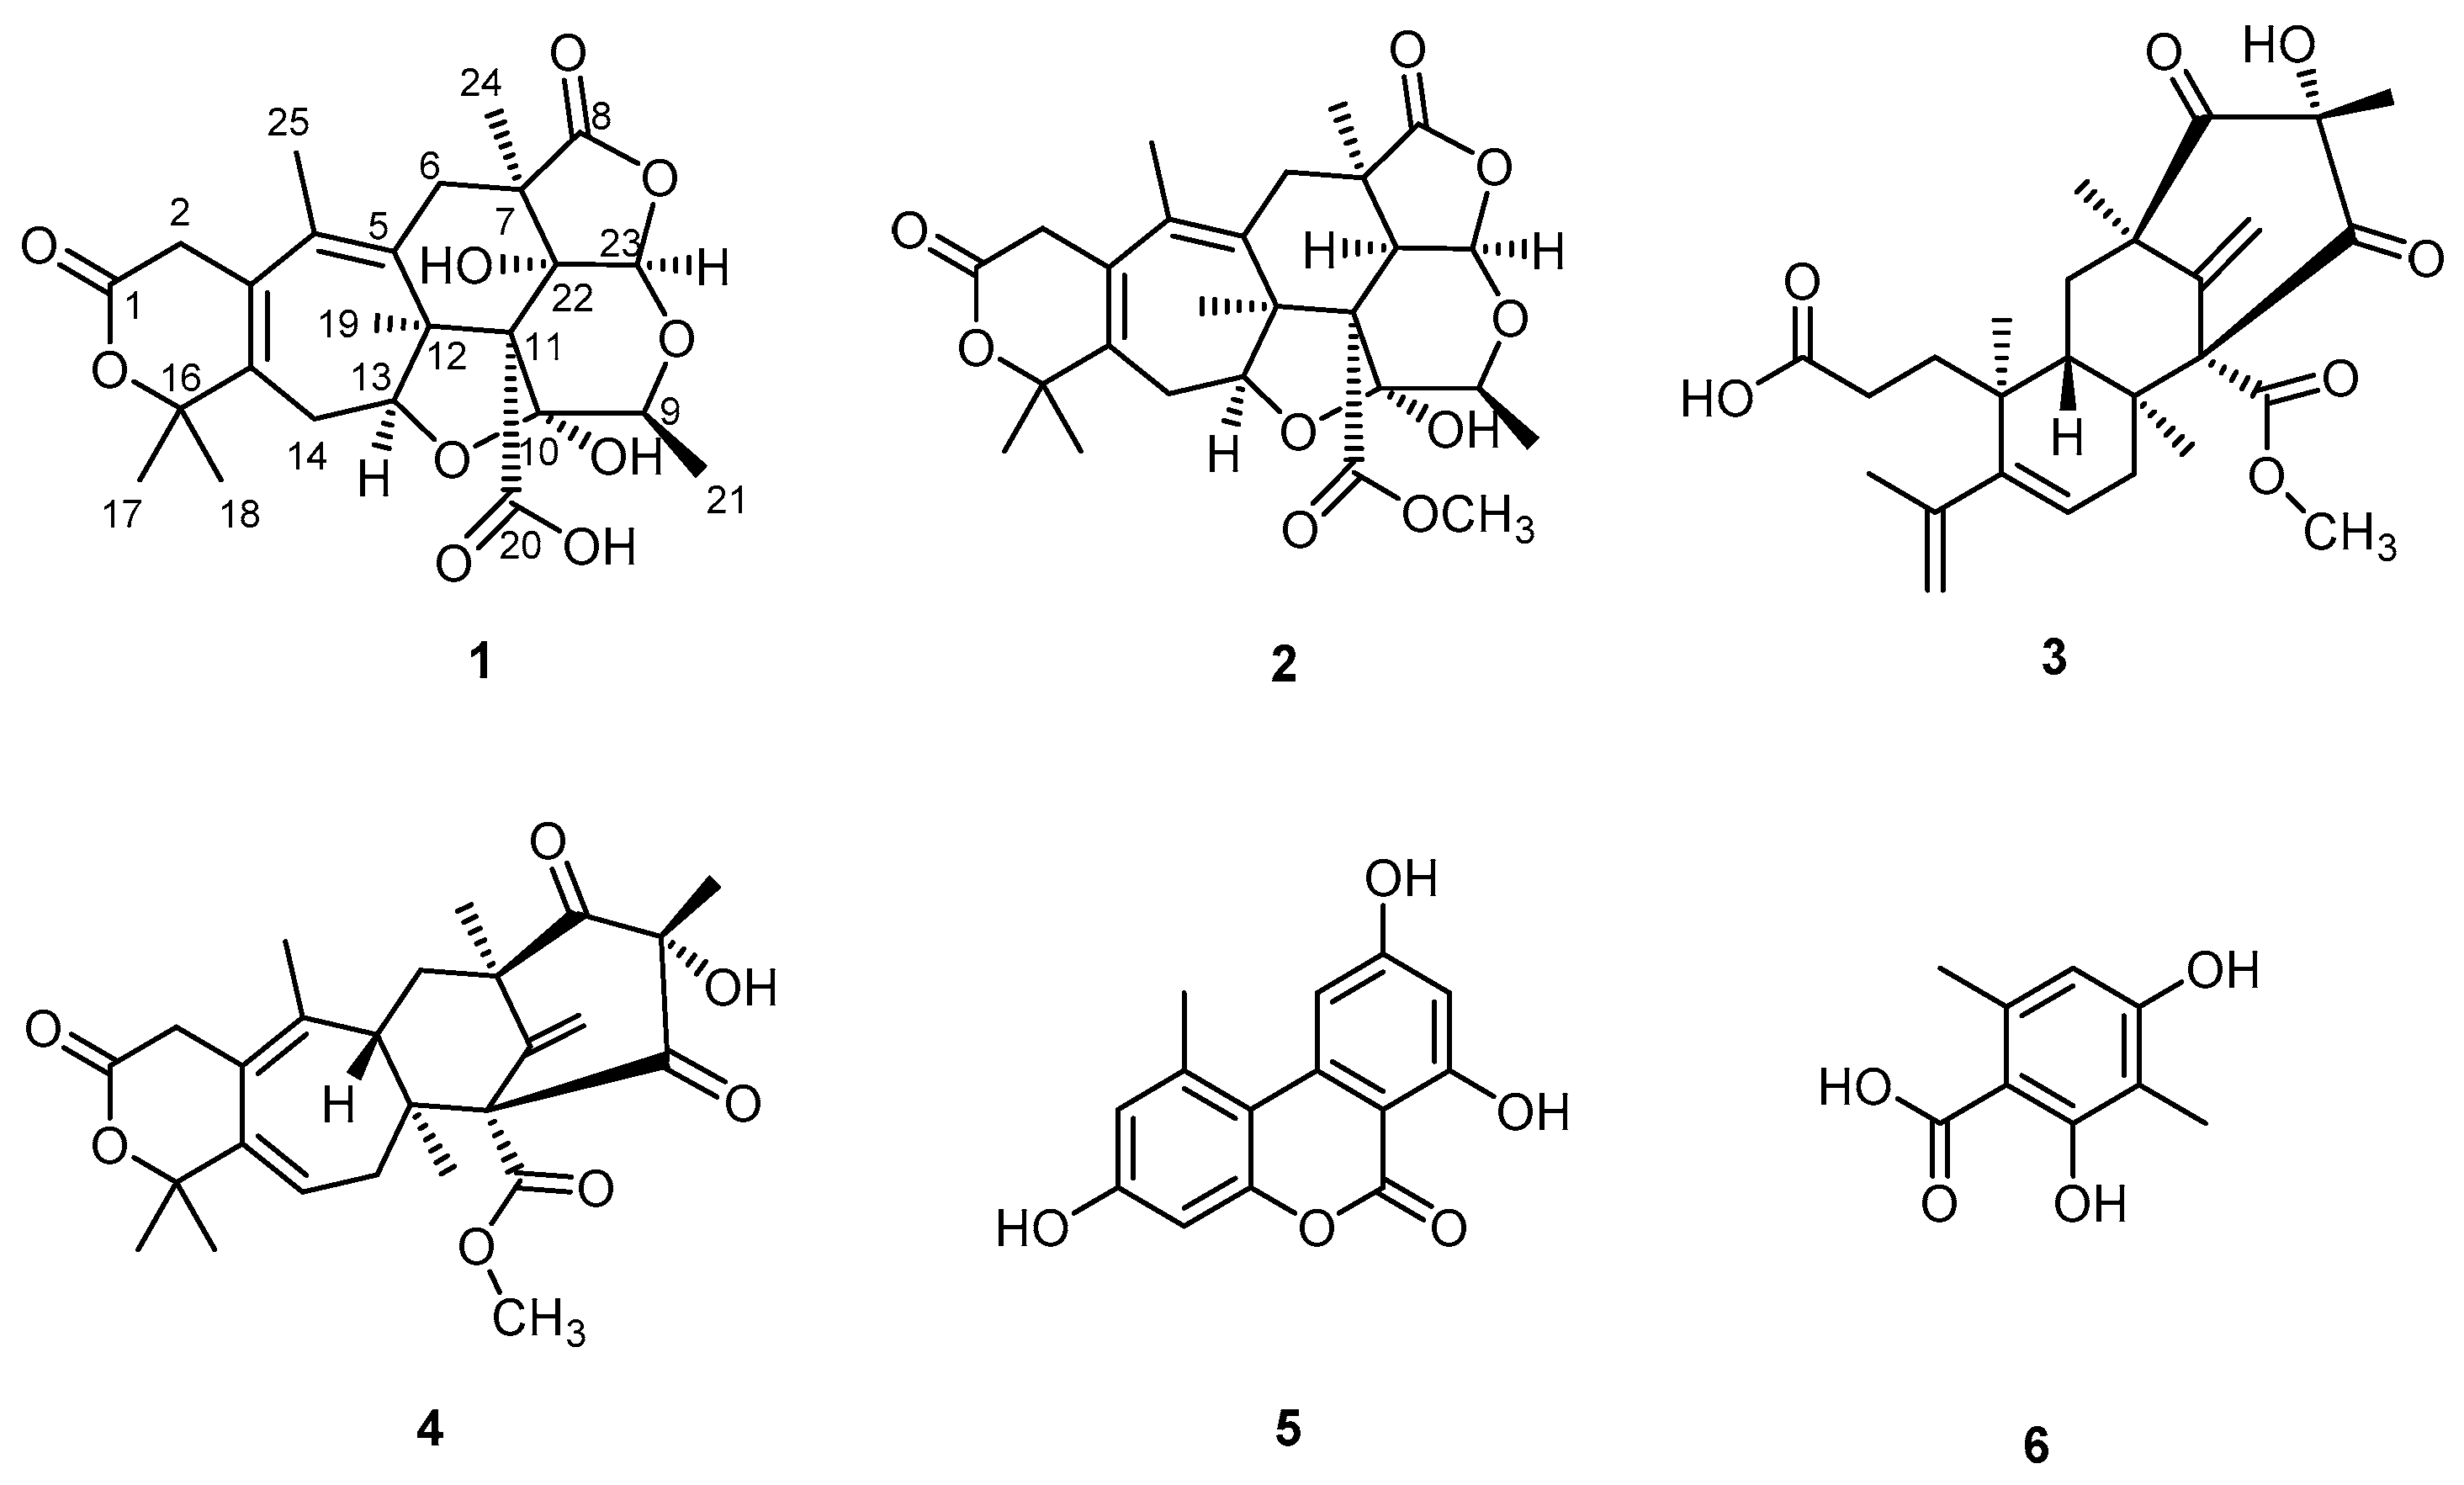
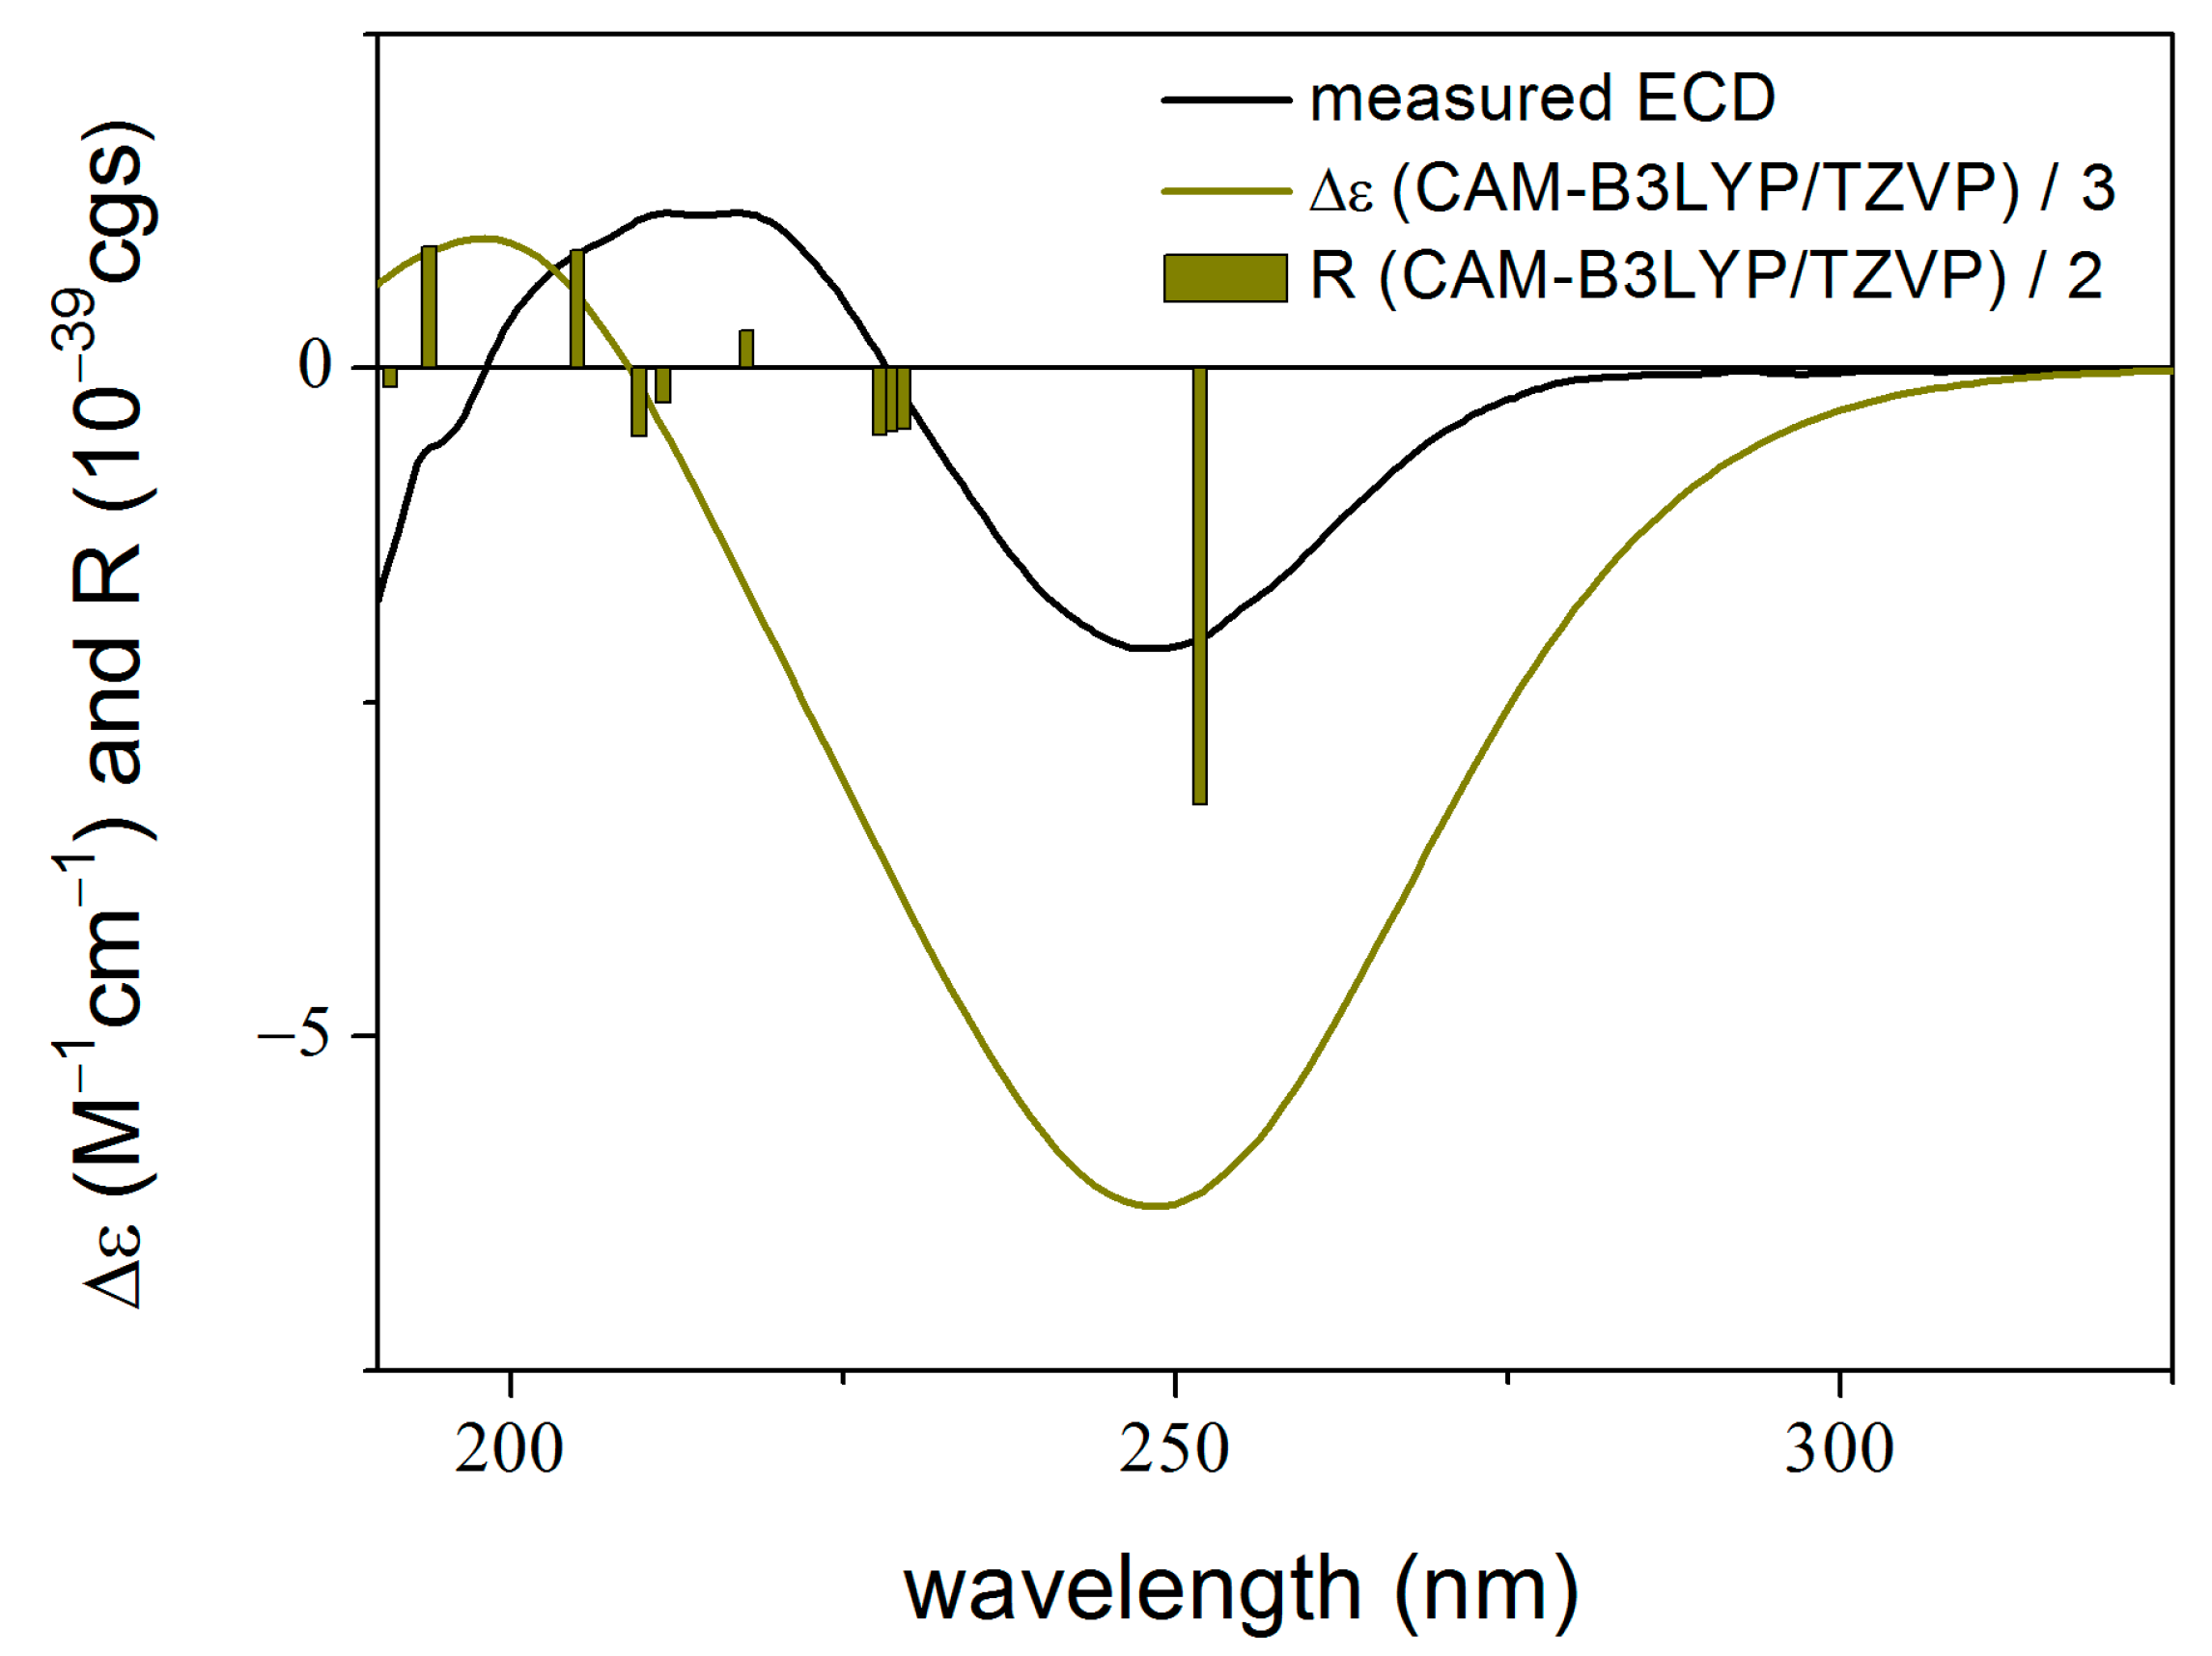
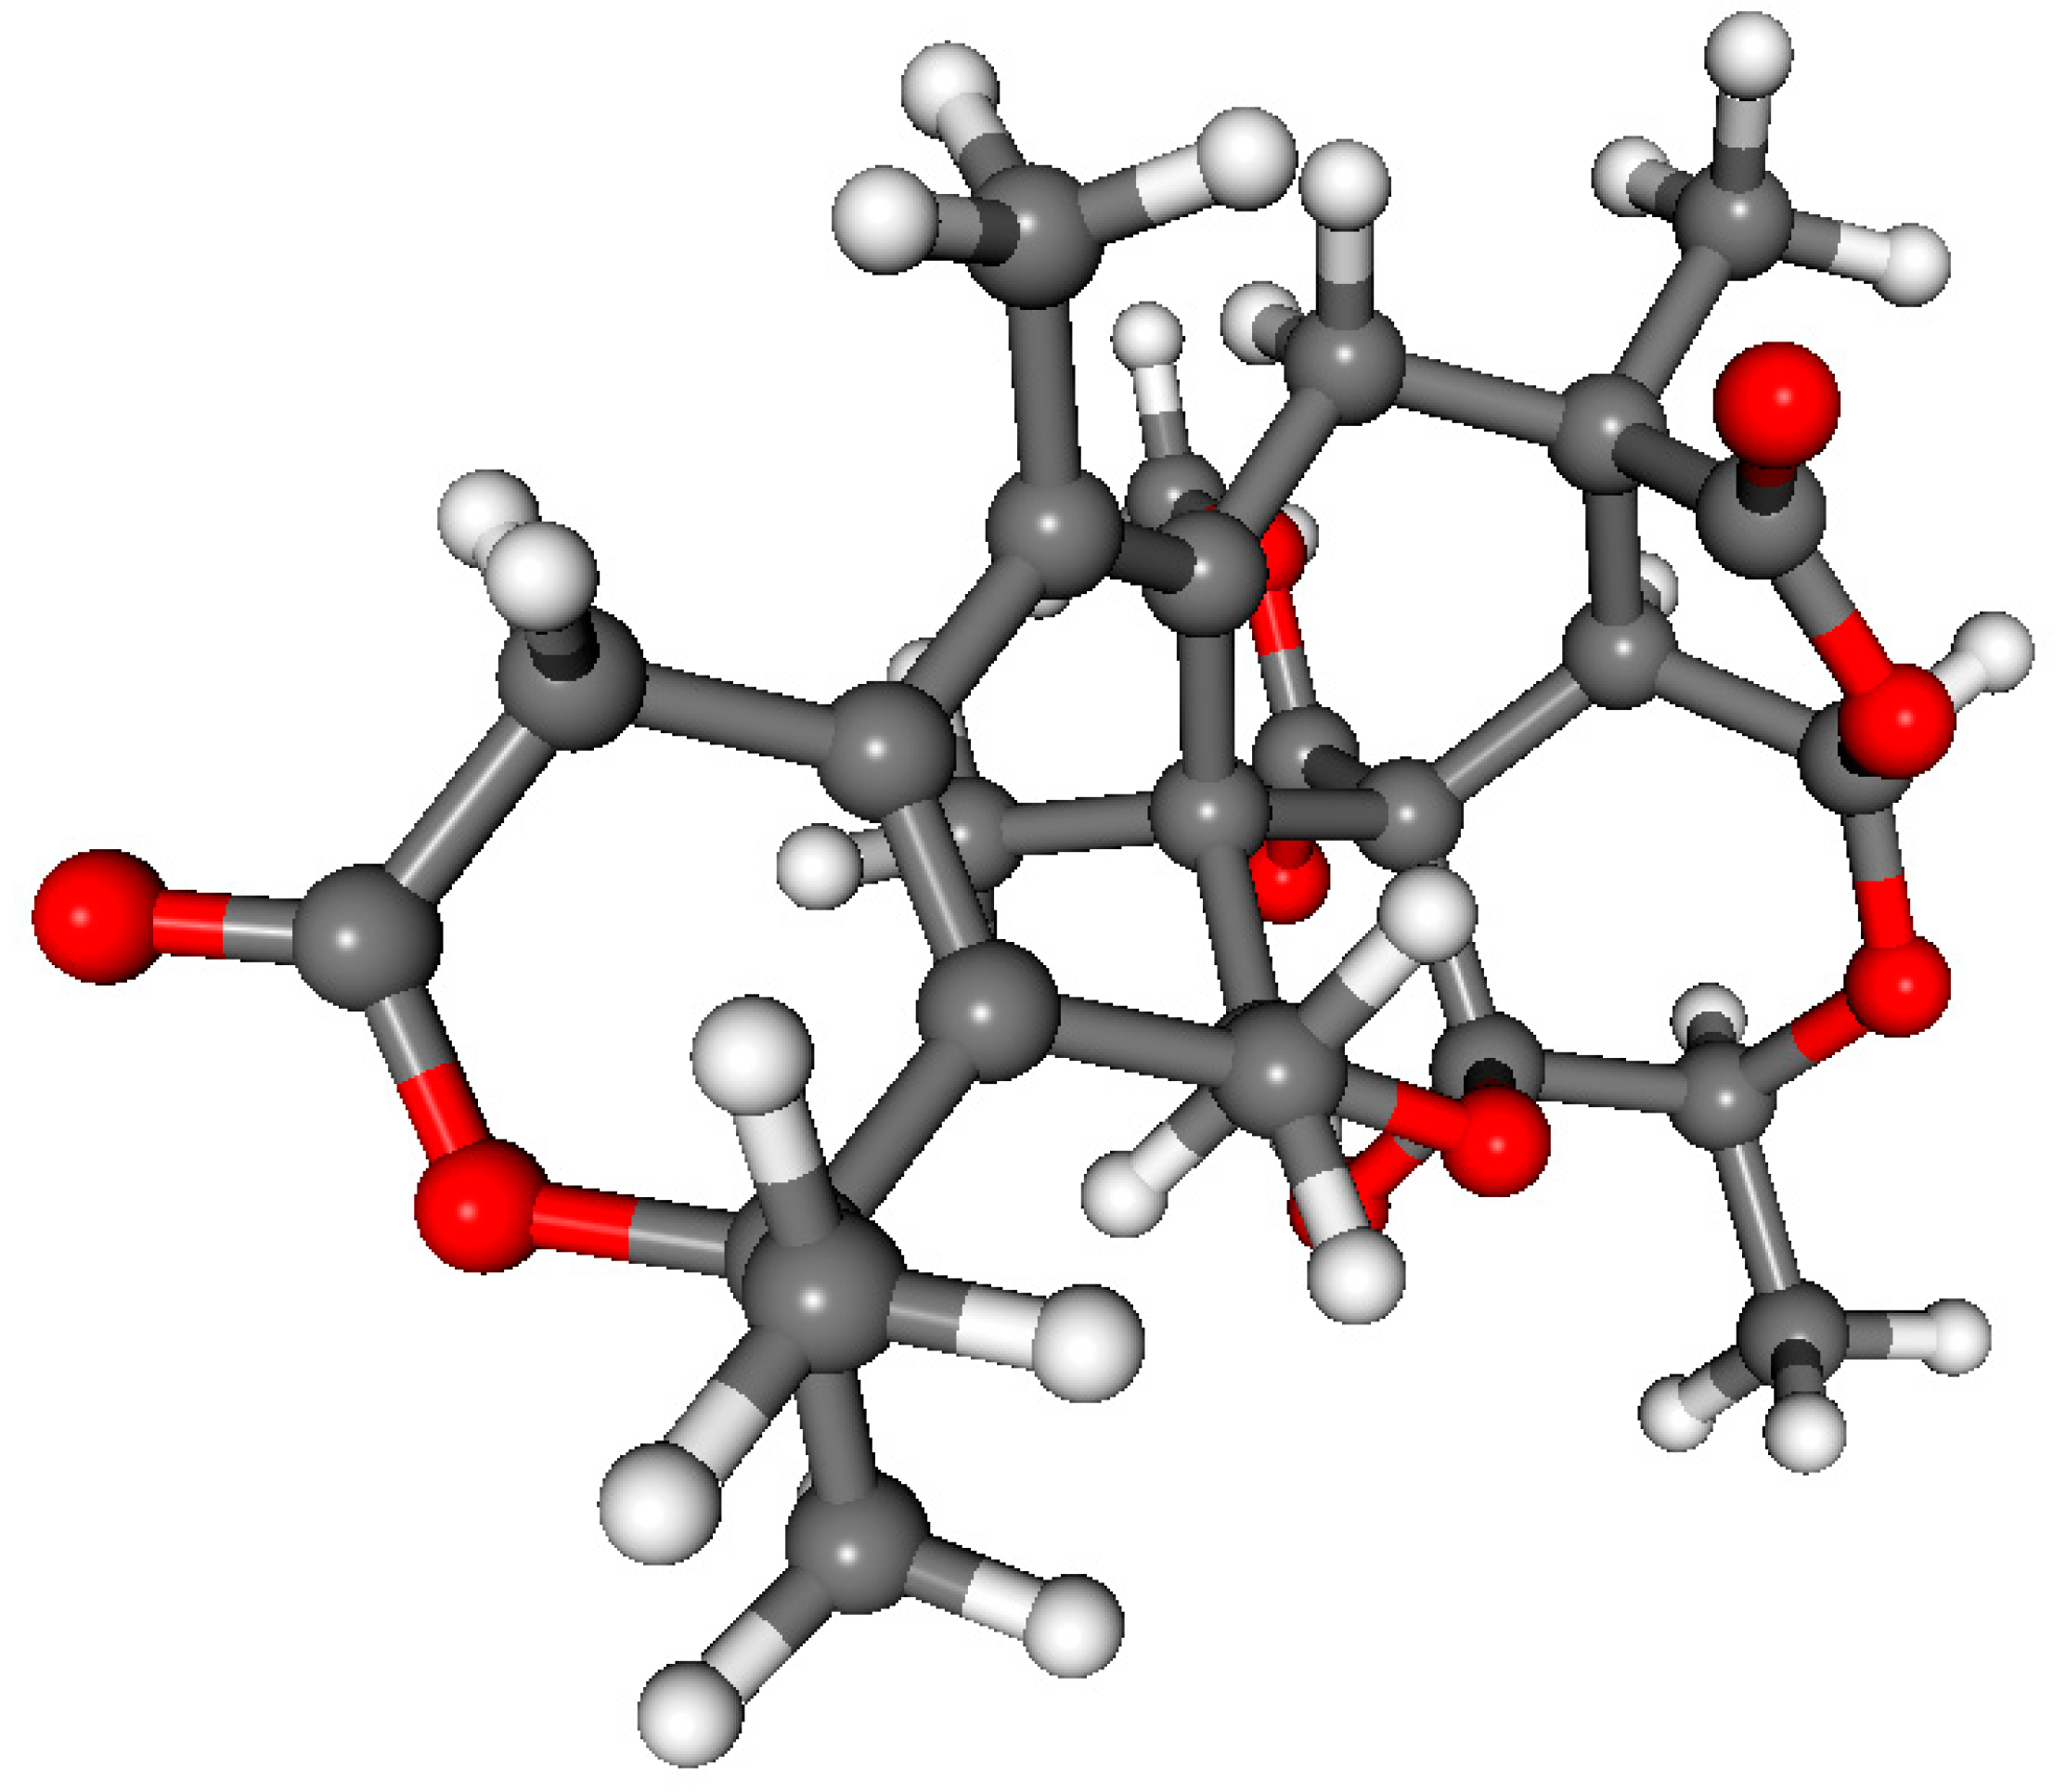
2. Results and Discussion

Compounds (1 and 2) were isolated together with two known meroterpenoids, berkeleyone C (3) and berkeleydione (4) [20], and two known phenolic compounds, alternariol (5) [21] and 3-methylorsellinic acid (6) [22]. Compounds 36 were identified by comparing their obtained spectral data with those reported in the literature. The molecular structures of isolated compounds are shown in Figure 1.
Compound 1 was isolated as a white amorphous powder. HRESIMS revealed a molecular ion peak at m/z 489.1762 equivalent to C25H29O10 [M − H] (Figure S1). 1H and APT NMR data are summarized in Table 1. 1H NMR, APT NMR and HSQC spectra are shown in Figures S2–S4. 1H NMR spectrum of compound 1 (Figure S2) showed three methine protons at δH (ppm) 4.07 (1H, q, J = 6.3 Hz, H-9), 4.23 (1H, dd, J = 13, 3.75 Hz, H-13), and 5.97 (1H, s, H-23), where the former two methines are oxygenated, while the latter is di-oxygenated. Also, three methylene protons were found at δH (ppm) 3.34, 2.93 (2H, d, J = 21.2 Hz, H2-2), 2.89, 2.26 (2H, d, J = 16.2 Hz, H2-6), and 2.39, 2.20 (2H, dd, J = 13, 3.75 Hz; d, J = 13 Hz, H2-14), in addition to six methyl protons at δH (ppm) 1.42 (3H, d, J = 6.4 Hz, Me-21), 1.90 (3H, s, Me-25), 1.62 (3H, s, Me-18), 1.49 (3H, s, Me-17), 1.45 (3H, s, Me-19), and 1.38 (3H, s, Me-24). The APT spectrum (Figure S3) revealed the presence of 25 carbons, including 13 quaternary carbons at δC 173.36, 168.71, 164.80, 133.8, 131.65, 130.88, 128.97, 99.10, 85.05, 80.68, 72.38, 52.02, and 46.53, six methyls at δC 27.91, 27.79, 27.69, 18.64, 17.89, and 13.31, three methylenes at δC 32.51, 31.51, and 31.43, and three methine carbons at δC 98.53, 92.91, and 70.33.
By inspection of the COSY spectrum (Figure S5), it was noted that there were correlations between H-13 and H2-14, as well as between H-9 and H3-21. Additionally, the HMBC correlations (Figure S6) confirmed the planar structure of 1 where correlations of δH 3.34, 2.93 (H2-2) to δC 168.71 (C-1), and δC 128.97 (C-3), δH 2.89, 2.26 (H2-6) to δC 131.65 (C-4), δC 133.8 (C-5), δC 46.53 (C-7), δC 173.36 (C-8), δC 52.02 (C-12), δC 80.68 (C-22), and δC 18.64 (C-24), δH 4.07 (H-9) to δC 13.31 (C-21), and δC 98.53 (C-23), δH 4.23 (H-13) to δC 133.8 (C-5), and δC 27.91 (C-19), δH 2.39, 2.20 (H2-14) to δC 128.97 (C-3), δC 52.02 (C-12), δC 92.91 (C-13), δC 130.88 (C-15), and δC 85.05 (C-16), δH 1.49 (H3-17) to δC 130.88 (C-15), δC 85.05 (C-16), and δC 27.79 (C-18), δH 1.62 (H3-18) to δC 130.88 (C-15), δC 85.05 (C-16), and δC 27.69 (C-17), δH 1.45 (H3-19) to δC 133.8 (C-5), δC 72.38 (C-11), δC 52.02 (C-12), and δC 92.91 (C-13), δH 1.42 (H3-21) to δC 70.33 (C-9), and δC 99.10 (C-10), δH 5.97 (H-23) to δC 173.36 (C-8), and δC 72.38 (C-11), δH 1.38 (H3-24) to δC 32.51 (C-6), δC 46.53 (C-7), δC 173.36 (C-8), and δC 80.68 (C-22), δH 1.90 (H3-25) to δC 128.97 (C-3), δC 131.65 (C-4), and δC 133.8 (C-5) were observed.
From the above-mentioned data of spectroscopic analyses, it was revealed that compound 1 showed a close similarity with the previously reported data of miniolutelide C [23], showing they have a similar planar structure with only two differences. Those differences were an additional hydroxy group on the quaternary carbon C-22, accounting for the downfield shift (δc 80.68) compared to the methine group in miniolutelide C at (δC 44.80) and the absence of the proton peak at (δH 3.05), and also accounting for the downfield shift in C-11 from δc 62.1 in miniolutelide C to δc 72.38 in 1. Moreover, the disappearance of the methoxy group at C-20 suggests that compound 1 is a 20-demethoxy, 22-hydroxy derivative of miniolutelide C. Compound 1 was given the trivial name miniolutelide D. Some discrepancies in 13C NMR data values were observed between them. C-13 found at δc 92.91 in 1 was located at δc 79.3 in miniolutelide C, in addition to C-19 found at δc 27.91 in 1 was at δc 14.9 in miniolutelide C, suggesting a possible difference in absolute configurations could be found between the two compounds.
The relative configuration of compound (1) was determined by analyzing the NOESY spectrum (Figure S7). Correlations were observed from H-23 to H3-24, H-9, and from H-13 to H3-19. Due to the characteristic NOE correlations of 1 and similarity of spectral data with those of 2, it was assigned the same relative configuration as that of 2; (7R*,9S*,10S*,11R*,12S*,13S*,22S*,23R*), although the descriptors of C-11 and C-22 are different due to the different priority orders. Key COSY, HMBC, and NOESY correlations are shown in Figure 2.
To elucidate the absolute configuration of 1, the TDDFT-ECD method was applied to (7R,9S,10S,11R,12S,13S,22S,23R)-1 [24,25]. The initial Merck molecular force field (MMFF) conformational search resulted in 22 conformer clusters, from which the lowest-energy ones were re-optimized at the ωB97X/TZVP PCM/MeCN level, yielding five low-energy conformers over 1% Boltzmann population. ECD spectra computed for these low-energy conformers at various levels of theory gave acceptable to good agreement with the experimental ECD spectrum. Furthermore, all low-energy conformers exhibited similar computed ECD spectra (Figure 3 and Figure 4), allowing a solid elucidation of the absolute configuration of 1 as (7R,9S,10S,11R,12S,13S,22S,23R).
Compound 2 was isolated as a yellow amorphous powder. It showed a molecular ion peak by HRESIMS at m/z 489.2114 equivalent to C26H33O9 [M + H]+ (Figure S8A,B). In Table 1 1H and APT NMR data of 2 are listed. 1H NMR, APT NMR and HSQC spectra are shown in Figures S9–S11. 1H NMR spectrum of compound 2 (Figure S9) showed four methine protons at δH (ppm) 4.62 (1H, q, J = 6.5 Hz, H-9), 4.16 (1H, dd, J = 13, 4.5 Hz, H-13), 2.85 (1H, s, H-22), and 5.43 (1H, s, H-23), where the H-9 and H-13 are oxygenated, while H-23 is di-oxygenated. Three methylene protons were found at δH (ppm) 3.27, 2.83 (2H, d, J = 21.1 Hz, H2-2), 2.94, 2.26 (2H, d, J = 16.3 Hz, H2-6), and 2.66, 2.47 (2H, t, J = 13 Hz; dd, J = 13, 4.5 Hz, H2-14), in addition to seven methyl protons at δH (ppm) 1.24 (3H, d, J = 5.9 Hz, Me-21), 1.71 (3H, s, Me-25), 1.56 (3H, s, Me-18), 1.48 (3H, s, Me-17), 1.07 (3H, s, Me-19), 1.39 (3H, s, Me-24), and 3.68 (3H, s, Me-26). APT spectrum (Figure S10) revealed the presence of 25 carbons, including 12 quaternary carbons at δC 173.36, 169.82, 169.11, 137.35, 131.25, 129.57, 128.57, 109.34, 85.2, 57.14, 51.12, and 41.2, seven methyls at δC 51.3, 27.65, 27.47, 27.12, 21.53, 17.2, and 13.26, three methylenes at δC 42.54, 33.75, and 31.74, and four methine carbons at δC 94.47, 90.90, 67.23, and 48.78.
The COSY spectrum (Figure S12) revealed correlations between H-13 and H2-14, H-22 and H-23, H-9, and H3-21. HMBC correlations (Figure S13) confirmed the planar structure of 2, where correlations were observed from δH 3.27, 2.83 (H2-2) to δC 169.11 (C-1), and δC 128.57 (C-3), δH 2.94, 2.26 (H2-6) to δC 129.57 (C-4), δC 137.35 (C-5), δC 41.2 (C-7), δC 173.36 (C-8), δC 51.12 (C-12), δC 48.78 (C-22), and δC 21.53 (C-24), δH 4.62 (H-9) to δC 109.34 (C-10), δC 13.26 (C-21), and δC 90.90 (C-23), δH 4.16 (H-13) to δC 137.35 (C-5), δC 109.34 (C-10), and δC 27.12 (C-19), δH 2.66, 2.47 (H2-14) to δC 128.57 (C-3), δC 51.12 (C-12), δC 94.47 (C-13), δC 131.25 (C-15), and δC 85.2 (C-16), δH 1.48 (H3-17) to δC 131.25 (C-15), δC 85.2 (C-16), and δC 27.47 (C-18), δH 1.56 (H3-18) to δC 131.25 (C-15), δC 85.2 (C-16), and δC 27.65 (C-17), δH 1.07 (H3-19) to δC 137.35 (C-5), δC 57.14 (C-11), δC 51.12 (C-12), and δC 94.47 (C-13), δH 1.24 (H3-21) to δC 67.23 (C-9), and δC 109.34 (C-10), δH 2.85 (H-22) to δC 41.2 (C-7), δC 173.36 (C-8), δC 109.34 (C-10), δC 57.14 (C-11), δC 90.90 (C-23), and δC 21.53 (C-24), δH 5.43 (H-23) to δC 41.2 (C-7), δC 67.23 (C-9), δC 57.14 (C-11), and δC 48.78 (C-22), δH 1.39 (H3-24) to δC 42.54 (C-6), δC 41.2 (C-7), δC 173.36 (C-8), and δC 48.78 (C-22), δH 1.71 (H3-25) to δC 128.57 (C-3), δC 129.57 (C-4), and δC 137.35 (C-5), δH 3.68 (H3-26) to δC 169.82 (C-20).
Hence, the planar structure of 2 was found to be the same as that of miniolutelide C [23]. However, C-13 was found at δc 94.47 in 2, while it was located at δc 79.3 in miniolutelide C. The large difference between the chemical shift values suggests that the relative configuration might be different.
After being measured in CDCl3 (Figures S9 and S14), the 1H NMR and NOESY spectra were measured in dimethylsulfoxide (DMSO) (Figures S15 and S16) to confirm the relative configuration of 2. NOE correlations were observed from H-22 to H3-24, H3-19, and H-23, from H-23 to H3-24, from H3-19 to H-13, and H3-26, from OH-10 to H-23, and H-9, indicating that they are on the same side. Since H-9 is on the prior plane and H-21 showed no correlations with any of that plane’s protons, this suggests that H-21 is on the opposite face. By comparing the relative configuration of 2 with that of miniolutelide C [23], a difference in C-13 was observed, where its configuration is (S*) instead of (R*). Therefore, the relative configuration was determined as (7R*,9S*,10S*,11S*,12S*,13S*,22R*,23R*). Thus, 2 is a new metabolite for which the trivial name miniolutelide E (13-epi-miniolutelide C) was given. Key COSY, HMBC, and NOESY correlations are shown in Figure 5.
The absolute configuration of 2 was also confirmed by TDDFT-ECD calculations computing for (7R,9S,10S,11S,12S,13S,22R,23R)-2. DFT re-optimization of the initial 9 MMFF conformers resulted in a single major conformer with 99.3% Boltzmann population. ECD spectra computed at various levels for this conformer gave acceptable to good agreement with the experimental ECD spectrum (Figure 6 and Figure 7), allowing determination of the absolute configuration as (7R,9S,10S,11S,12S,13S,22R,23R)-2.
The emergence and prevalence of antimicrobial resistance are currently depicted as a worldwide public health threat. Most pathogens develop resistance to common antimicrobials, which risk treatment regimens’ failure. Therefore, the urgent need for new antimicrobial agents to combat this serious problem is steadily increasing [26,27]. Inhibitory activity of the total crude extract was evaluated against the pathogenic gram-positive bacterial strain S. aureus ATCC 29213, which causes food poisoning, toxic shock syndrome, and scalded skin syndrome, among other diseases, as well as the Gram-negative bacterial strain E. coli ATCC 25922 known to cause food-borne illnesses [28]. The extract was only significantly active against S. aureus ATCC 29213, with an MIC value of 6.3 µg/mL. Subsequently, all isolated compounds 16 were tested for antimicrobial activity against S. aureus ATCC 29213, as well as the methicillin-resistant S. aureus (MRSA) strain ATCC 700699. Only compound 5 exhibited considerable activity against S. aureus ATCC 700699 with an MIC of 25 µM, and modest activity against S. aureus ATCC 29213 with an MIC of 100 µM. None of the other compounds showed significant activity at a dose of 100 µM.
Tuberculosis, an infectious disease caused by M. tuberculosis, is the major cause of death by an infectious bacterium, accounting for more than a million deaths every year. Although huge efforts are being made by health communities, the morbidity and mortality rates are still high, especially in developing countries, along with the problem of emerging resistant strains, which put great importance in finding new anti-tubercular agents [29,30]. Hence, the total extract as well as all isolated compounds were tested against M. tuberculosis. However, none of them showed any significant activity at 100 µM.

3. Materials and Methods

3.1. General Experimental Procedures

NMR spectra were recorded on a Bruker Avance III HD 400 MHz NMR spectrometer (Zurich, Switzerland). LC-MS Shimadzu 8045 spectrometer coupled with photodiode array (PDA) detector (LC-2030/2040) was used to record the mass spectra. HRESIMS spectra were acquired on FTHRMS-Orbitrap (Thermo-Finnigan, Weiler bei Bingen, Germany) mass spectrometer. Semi-preparative HPLC (Shimadzu, Kyoto, Japan) was utilized for purification, with Kromasil C-18 RP semi-preparative column (10 mm × 250 mm), with 5 mL/min flow rate, and UV detection at 254 nm with λ max absorption at 220–400 nm. Medium-pressure liquid chromatography was performed using the Puriflash 4125 system, Montlucon, France (Interchim software, Intersoft v5.0b09) coupled with a PDA detector. HiMedia silica gel GRM7484 (0.037–0.063 mm) was utilized for column chromatography. TLC analyses were carried out on precoated silica gel 60 F254 plates (Merck, Darmstadt, Germany), followed by UV detection at 254 and 365 nm and spraying with vanillin sulphuric acid reagent. All solvents used were priorly distilled, and spectroscopic grade solvents were used for spectroscopic measurements.

3.2. Fungal Material and Identification

Pomegranate fruit collected in Cairo, Egypt, in the summer of 2019 was identified and authenticated as P. granatum, family Lythraceae. The fruit was cleaned and cut longitudinally. Inside the aseptic area, different fruit parts were cut by sterile blades, washed with distilled water, followed by treatment with 70% ethanol to exclude any contaminants and epiphytes that might arise. The sterile dissected parts were inoculated aseptically on malt extract agar medium (MEA). Plates were grown at room temperature (25 °C). After successive purification steps, the pure fungal strain was successfully isolated from the tissues of the P. granatum fruit. The same fungal strain was simultaneously isolated from the mesocarp, calyx, and exocarp, which confirms its indigeneity in P. granatum fruits. The fungus was identified as T. purpureogenus according to a molecular biological protocol using DNA amplification and sequencing of the ITS region [31]. The obtained sequencing data were submitted to Genbank with accession number OM367903. A voucher plate for this fungal strain was deposited in the Department of Pharmacognosy, Faculty of Pharmacy, Ain-Shams University, with the ID code AMP-R-2.

3.3. Fermentation, Fractionation, and Isolation of Bioactive Compounds

Solid rice medium was prepared in 22 1-L Erlenmeyer flasks, each containing 100 g of commercial rice and 110 mL of water. The solid rice medium was autoclaved at 121 °C for 20 min prior to fungal fermentation. The fungal strain was cultivated on the rice medium for 7 weeks at room temperature. Afterwards, fungal biomass was extracted using 700 mL ethyl acetate (EtOAc) for each flask. The flasks were left in static mode overnight. The following day, the flasks were put on electric shakers at 150 rpm for 8 h. Filtration and evaporation steps were followed to obtain a dried extract. The extraction step was run four successive times, yielding 75 g of crude extract.
The crude extract was partitioned between n-hexane and 90% aqueous methanol (aq. MeOH) yielding 40 g of methanolic extract. The obtained methanolic extract was fractionated by vacuum liquid chromatography (VLC) with silica gel 230–400 mesh-packed column. Gradient elution was performed using n-hexane–EtOAc 100:0 to 0:100 and CH2Cl2–MeOH 100:0 to 0:100, collecting 23 fractions (F1–F23). All fractions were evaporated and weighed.
Fraction F4 (2.14 g), eluted from n-hexane–EtOAc 1:1, was subjected to further chromatographic fractionation by VLC (230–400 mesh), applying the same described technique. This resulted in 12 sub-fractions (F4-1 to F4-12). Sub-fractions F4-5 and F4-6, obtained from 60% and 40% n-hexane, respectively, were combined together based on high similarity in their thin layer chromatography (TLC) pattern and thus named F-4-6c (850 mg). Semi-preparative HPLC was performed on sub-fraction F-4-6c, which led to the isolation of four compounds, 1 (9.2 mg), 3 (17.2 mg), 4 (20.1 mg), and 5 (10.4 mg).
Fractions 7, 8, and 9 eluted from n-hexane-EtOAc 8:2, 9:1 and 10:0, respectively, were combined (2.0 g), and subjected to another VLC subfractionation, from which 27 sub-fractions were obtained. Sub-fractions collected from n-hexane-EtOAc 4:6 and 3:7 (twice) F7-9, F7-10, and F7-11 were combined obtaining “F7-9+”, which was subjected to flash chromatography yielding compound 2 (20.0 mg).
While running the VLC on the total extract, an orange band F-3′ was observed in a 60% n-hexane solvent system, which was collected separately from the original fraction F-3. F-3′ (590 mg) was subjected to semi-preparative HPLC to yield 6 (7.4 mg).
All fractionation and isolation steps were continually tracked by TLCs of isolated fractions, sub-fractions, and compounds in different mobile phase systems.

3.4. Antimicrobial Susceptibility Tests

The broth micro-dilution method was applied to evaluate the antimicrobial activity against Staphylococcus aureus ATCC 29213, Staphylococcus aureus ATCC 700699, Escherichia coli ATCC 25922, and the minimum inhibitory concentration (MIC) values were measured according to the Clinical and Laboratory Standards Institute (CLSI) recommendations [32]. The MIC against Mycobacterium tuberculosis H37Rv was determined in 96-well microtiter plates employing the resazurin reduction assay, as described previously [33]. Moxifloxacin and ciprofloxacin were used as positive controls for S. aureus and E. coli, whereas rifampicin was used as a positive control for M. tuberculosis. DMSO was used as the solvent control.

3.5. Computational Section

Mixed torsional/low-frequency mode conformational searches were carried out by means of the Macromodel 10.8.011 software using the MMFF with an implicit solvent model for CHCl3 [34]. Geometry re-optimizations were carried out at the ωB97X/TZVP level [35] with the PCM solvent model for MeCN. TDDFT-ECD calculations were run with various functionals (B3LYP, BH&HLYP, CAMB3LYP, and PBE0) and the TZVP basis set as implemented in the Gaussian 09 package with the same solvent model as in the preceding DFT optimization step [36]. ECD spectra were generated as sums of Gaussians with 2700 and 4200 cm−1 width at half-height, using dipole-velocity-computed rotational strength values [37]. Boltzmann distributions were estimated from the ωB97X energies. The Molekel software package (v5.4) was used for the visualization of the results [38].

4. Conclusions

Chemical investigation of the endophytic fungus Talaromyces purpureogenus, derived from Punica granatum fruits, led to the isolation of two new meroterpenoids together with two other known meroterpenoids and two known phenolic compounds. The compounds were identified based on their spectral data and by comparison with previously reported data in the literature. The absolute configuration of newly isolated compounds was confirmed by TDDFT-ECD calculations. Additionally, antimicrobial activity was evaluated. Compound 5 displayed significant activity against the MRSA strain S. aureus ATCC 700699, as well as moderate activity against the drug-susceptible reference strain S. aureus ATCC 29213. Further biological investigations of the isolated compounds from T. purpureogenus are suggested for future research.

Supplementary Materials

The following supporting information can be downloaded at https://www.mdpi.com/article/10.3390/molecules28227650/s1: Figures S1–S7: ESI-MS, 1H NMR, APT NMR, HSQC, COSY, HMBC, and NOESY spectra for compound 1; Figures S8–S16: ESI-MS, 1H NMR, APT NMR, HSQC, COSY, HMBC, and NOESY spectra for compound 2.

Author Contributions

Conceptualization, A.A., M.S.E., N.I. and S.H.E.-A.; methodology, A.A. and M.S.E.; formal analysis and investigation, A.A., M.S.E., A.M.E., A.M., T.K. and Z.L.; writing—original draft preparation, A.A.; writing—review and editing, A.A., M.S.E., A.M.E., N.I., A.M., T.K., Z.L., S.H.E.-A. and R.K.; supervision, M.S.E., N.I. and S.H.E.-A.; project administration, S.H.E.-A. and R.K. All authors have read and agreed to the published version of the manuscript.

Funding

M.S.E. is fully funded by a post-doc scholarship from the Ministry of Higher Education of the Arab Republic of Egypt. The authors would like to thank the Center of Drug Discovery, Ain-Shams University, for providing the chromatography instruments and recording the NMR spectroscopic data. We thank the CeMSA@HHU (Center for Molecular and Structural Analytics, Heinrich Heine University) for recording the mass-spectrometric data. The Hungarian authors were funded by the National Research Development and Innovation Office (Grant numbers: K-138672, FK-134725). The CPU time from the Governmental Information Technology Development Agency (KIFÜ) is gratefully acknowledged.

Institutional Review Board Statement

Not applicable.

Informed Consent Statement

Not applicable.

Data Availability Statement

Data generated and/or analyzed in this study are available in the manuscript or the Supplementary Materials or can be requested from the corresponding authors.

Conflicts of Interest

The authors declare no conflict of interest.

References

  1. Newman, D.J.; Cragg, G.M. Natural Products as Sources of New Drugs from 1981 to 2014. J. Nat. Prod. 2016, 79, 629–661. [Google Scholar] [CrossRef]
  2. Bogas, A.C.; Cruz, F.P.N.; Lacava, P.T.; Sousa, C.P. Endophytic fungi: An overview on biotechnological and agronomic potential. Braz. J. Biol. 2022, 84, e258557. [Google Scholar]
  3. Lee, C.; Shim, S.H. Endophytic Fungi Inhabiting Medicinal Plants and Their Bioactive Secondary Metabolites. Nat. Prod. Sci. 2020, 26, 10–27. [Google Scholar] [CrossRef]
  4. Gupta, S.; Chaturvedi, P.; Kulkarni, M.G.; Van Staden, J. A critical review on exploiting the pharmaceutical potential of plant endophytic fungi. Biotechnol. Adv. 2020, 39, 107462. [Google Scholar] [CrossRef] [PubMed]
  5. Digra, S.; Nonzom, S. An insight into endophytic antimicrobial compounds: An updated analysis. Plant Biotechnol. Rep. 2023, 17, 427–457. [Google Scholar]
  6. Samson, R.; Yilmaz, N.; Houbraken, J.; Spierenburg, H.; Seifert, K.; Peterson, S.; Varga, J.; Frisvad, J. Phylogeny and nomenclature of the genus Talaromyces and taxa accommodated in Penicillium subgenus Biverticillium. Stud. Mycol. 2011, 70, 159–183. [Google Scholar] [CrossRef]
  7. Feng, L.-X.; Zhang, B.-Y.; Zhu, H.-J.; Pan, L.; Cao, F. Bioactive Metabolites from Talaromyces purpureogenus, an Endophytic Fungus from Panax notoginseng. Chem. Nat. Compd. 2020, 56, 974–976. [Google Scholar] [CrossRef]
  8. Cao, X.; Shi, Y.; Wu, S.; Wu, X.; Wang, K.; Sun, H.; He, S.; Dickschat, J.S.; Wu, B. Polycyclic meroterpenoids, talaromyolides E − K for antiviral activity against pseudorabies virus from the endophytic fungus Talaromyces purpureogenus. Tetrahedron 2020, 76, 131349. [Google Scholar] [CrossRef]
  9. Do Nascimento, J.S.; Silva, F.M.; Magallanes-Noguera, C.A.; Kurina-Sanz, M.; dos Santos, E.G.; Caldas, I.S.; Luiz, J.H.H.; Silva, E.d.O. Natural trypanocidal product produced by endophytic fungi through co-culturing. Folia Microbiol. 2020, 65, 323–328. [Google Scholar] [CrossRef]
  10. Wang, W.; Wan, X.; Liu, J.; Wang, J.; Zhu, H.; Chen, C.; Zhang, Y. Two new terpenoids from Talaromyces purpurogenus. Mar. Drugs 2018, 16, 150. [Google Scholar] [CrossRef]
  11. Padmathilake, K.G.E.; Bandara, H.M.S.K.H.; Qader, M.M.; Kumar, N.S.; Jayasinghe, L.; Masubuti, H.; Fujimoto, Y. Talarofuranone, a New Talaroconvolutin Analog from the Endophytic Fungus Talaromyces purpurogenus from Pouteria campechiana Seeds. Nat. Prod. Commun. 2017, 12, 489–490. [Google Scholar] [CrossRef]
  12. Pandit, S.G.; Puttananjaih, M.H.; Harohally, N.V.; Dhale, M.A. Functional attributes of a new molecule-2-hydroxymethyl-benzoic acid 2′-hydroxy-tetradecyl ester isolated from Talaromyces purpureogenus CFRM02. Food Chem. 2018, 255, 89–96. [Google Scholar] [CrossRef]
  13. Zhao, J.-Y.; Wang, X.-J.; Liu, Z.; Meng, F.-X.; Sun, S.-F.; Ye, F.; Liu, Y.-B. Nonadride and Spirocyclic Anhydride Derivatives from the Plant Endophytic Fungus Talaromyces purpurogenus. J. Nat. Prod. 2019, 82, 2953–2962. [Google Scholar] [CrossRef] [PubMed]
  14. Ogbonna, C.; Hideki, A.; Ogbonna, J. Isolation and identification of Talaromyces purpurogenus and preliminary studies on its pigment production potentials in solid state cultures. Afr. J. Biotechnol. 2017, 16, 672–682. [Google Scholar]
  15. Sarlah, D.; Petrovčič, J.; Ungarean, C.N. Recent Chemical Methodology Advances in the Total Synthesis of Meroterpenoids. Acta Chim. Slov. 2021, 68, 247–267. [Google Scholar]
  16. Paluka, J.; Kanokmedhakul, K.; Soytong, M.; Soytong, K.; Kanokmedhakul, S. Meroditerpene pyrone, tryptoquivaline and brasiliamide derivatives from the fungus Neosartorya pseudofischeri. Fitoterapia 2019, 137, 104257. [Google Scholar] [CrossRef] [PubMed]
  17. Shang, Z.-C.; Yang, M.-H.; Liu, R.-H.; Wang, X.-B.; Kong, L.-Y. New Formyl Phloroglucinol Meroterpenoids from the Leaves of Eucalyptus robusta. Sci. Rep. 2016, 6, 39815. [Google Scholar] [CrossRef]
  18. Guo, J.; Ran, H.; Zeng, J.; Liu, D.; Xin, Z. Tafuketide, a phylogeny-guided discovery of a new polyketide from Talaromyces funiculosus Salicorn 58. Appl. Microbiol. Biotechnol. 2016, 100, 5323–5338. [Google Scholar] [CrossRef]
  19. Cen, S.; Jia, J.; Ge, Y.; Ma, Y.; Li, X.; Wei, J.; Bai, Y.; Wu, X.; Song, J.; Bi, H.; et al. A new antibacterial 3,5-dimethylorsellinic acid-based meroterpene from the marine fungus Aspergillus sp. CSYZ-1. Fitoterapia 2021, 152, 104908. [Google Scholar] [CrossRef]
  20. Stierle, D.B.; Stierle, A.A.; Patacini, B.; McIntyre, K.; Girtsman, T.; Bolstad, E. Berkeleyones and related meroterpenes from a deep water acid mine waste fungus that inhibit the production of interleukin 1-β from induced inflammasomes. J. Nat. Prod. 2011, 74, 2273–2277. [Google Scholar] [CrossRef] [PubMed]
  21. Tang, J.; Huang, L.; Liu, Y.; Toshmatov, Z.; Zhang, C.; Shao, H. Two phytotoxins isolated from the pathogenic fungus of the invasive weed Xanthium italicum. Chem. Biodivers. 2020, 17, e2000043. [Google Scholar] [CrossRef]
  22. Zhao, M.; Ruan, Q.; Pan, W.; Tang, Y.; Zhao, Z.; Cui, H. New polyketides and diterpenoid derivatives from the fungus Penicillium sclerotiorum GZU-XW03-2 and their anti-inflammatory activity. Fitoterapia 2020, 143, 104561. [Google Scholar] [CrossRef] [PubMed]
  23. Li, J.; Yang, X.; Lin, Y.; Yuan, J.; Lu, Y.; Zhu, X.; Li, J.; Li, M.; Lin, Y.; He, J.; et al. Meroterpenes and azaphilones from marine mangrove endophytic fungus Penicillium 303#. Fitoterapia 2014, 97, 241–246. [Google Scholar]
  24. Mándi, A.; Kurtán, T. Applications of OR/ECD/VCD to the structure elucidation of natural products. Nat. Prod. Rep. 2019, 36, 889–918. [Google Scholar] [CrossRef]
  25. Superchi, S.; Scafato, P.; Gorecki, M.; Pescitelli, G. Absolute configuration determination by quantum mechanical calculation of chiroptical spectra: Basics and applications to fungal metabolites. Curr. Med. Chem. 2018, 25, 287–320. [Google Scholar] [CrossRef]
  26. Dadgostar, P. Antimicrobial Resistance: Implications and Costs. Infect. Drug Resist. 2019, 12, 3903–3910. [Google Scholar] [CrossRef]
  27. Fernebro, J. Fighting bacterial infections—Future treatment options. Drug Resist. Updates 2011, 14, 125–139. [Google Scholar] [CrossRef]
  28. Barceloux, D.G. Medical Toxicology of Natural Substances: Foods, Fungi, Medicinal Herbs, Plants, and Venomous Animals; John Wiley & Sons: Hoboken, NJ, USA, 2008. [Google Scholar]
  29. Mabhula, A.; Singh, V. Drug-resistance in Mycobacterium tuberculosis: Where we stand. Medchemcomm 2019, 10, 1342–1360. [Google Scholar] [CrossRef] [PubMed]
  30. Gagneux, S. Ecology and evolution of Mycobacterium tuberculosis. Nat. Rev. Microbiol. 2018, 16, 202–213. [Google Scholar] [CrossRef] [PubMed]
  31. Kjer, J.; Debbab, A.; Aly, A.H.; Proksch, P. Methods for isolation of marine-derived endophytic fungi and their bioactive secondary products. Nat. Protoc. 2010, 5, 479–490. [Google Scholar] [CrossRef]
  32. CLSI. Methods for Dilution Antimicrobial Susceptibility Tests for Bacteria That Grow Aerobically: Approved Standard, 9th ed.; Clinical and Laboratory Standards Institute: Malvern, PA, USA, 2012. [Google Scholar]
  33. Rehberg, N.; Akone, H.S.; Ioerger, T.R.; Erlenkamp, G.; Daletos, G.; Gohlke, H.; Proksch, P.; Kalscheuer, R. Chlorflavonin Targets Acetohydroxyacid Synthase Catalytic Subunit IlvB1 for Synergistic Killing of Mycobacterium tuberculosis. ACS Infect. Dis. 2018, 4, 123–134. [Google Scholar] [CrossRef] [PubMed]
  34. MacroModel. Schrödinger LLC. 2015. Available online: https://www.schrodinger.com/products/macromodel (accessed on 1 October 2023).
  35. Chai, J.-D.; Head-Gordon, M. Systematic optimization of long-range corrected hybrid density functionals. J. Chem. Phys. 2008, 128, 084106. [Google Scholar] [CrossRef] [PubMed]
  36. Frisch, M.J.; Trucks, G.W.; Schlegel, H.B.; Scuseria, G.E.; Robb, M.A.; Cheeseman, J.R.; Scalmani, G.; Barone, V.; Mennucci, B.; Petersson, G.A.; et al. Gaussian 09, Revision E.01; Gaussian Inc.: Wallingford, CT, USA, 2013. [Google Scholar]
  37. Stephens, P.J.; Harada, N. ECD cotton effect approximated by the Gaussian curve and other methods. Chirality 2010, 22, 229–233. [Google Scholar] [CrossRef] [PubMed]
  38. Varetto, U. MOLEKEL, 5.4; Swiss National Supercomputing Centre: Manno, Switzerland, 2009. [Google Scholar]
Figure 1. Molecular structures of isolated compounds.
Molecules 28 07650 g001
Figure 2. Key COSY, HMBC, and NOESY correlations of compound 1.
Molecules 28 07650 g002
Figure 3. Experimental ECD spectrum of 1 measured in MeCN compared with the CAM-B3LYP/TZVP PCM/MeCN ECD spectrum of (7R,9S,10S,11R,12S,13S,22S,23R)-1 computed for the low-energy ωB97X/TZVP PCM/MeCN conformers. The bars represent the rotational strength values of the lowest-energy conformer.
Molecules 28 07650 g003
Figure 4. Low-energy (≥1%) conformers and Boltzmann populations of (7R,9S,10S,11R,12S,13S,22S,23R)-1. Level of DFT optimization: ωB97X/TZVP PCM/MeCN.
Molecules 28 07650 g004
Figure 5. Key COSY, HMBC, and NOESY correlations of compound 2.
Molecules 28 07650 g005
Figure 6. Experimental ECD spectrum of 2 measured in MeCN compared with the BH&HLYP/TZVP PCM/MeCN ECD spectrum of (7R,9S,10S,11S,12S,13S,22R,23R)-2 computed for the single major ωB97X/TZVP PCM/MeCN conformer. The bars represent the rotational strength values of the lowest-energy conformer.
Molecules 28 07650 g006
Figure 7. The single computed conformer of (7R,9S,10S,11S,12S,13S,22R,23R)-2 with a Boltzmann population of 99.3% optimized at the ωB97X/TZVP PCM/MeCN level.
Molecules 28 07650 g007
Table 1. 1H and APT NMR data for compounds 1 and 2 in CDCl3.
PositionδC 1δH1, Multiplicity (J in Hz)δC 2δH2, Multiplicity (J in Hz)
1168.71, C 169.11, C
231.51, CH2β 3.34, d (21.2)31.74, CH2β 3.27, d (21.1)
α 2.93, d (21.2)α 2.83, d (21.1)
3128.97, C 128.57, C
4131.65, C 129.57, C
5133.8, C 137.35, C
632.51, CH2β 2.89, d (16.2)42.54, CH2β 2.94, d (16.3)
α 2.26, d (16.2)α 2.26, d (16.3)
746.53, C 41.2, C
8173.36, C 173.36, C
970.33, CH4.07, q (6.3)67.23, CH4.62, q (6.5)
1099.10, C 109.34, C
1172.38, C 57.14, C
1252.02, C 51.12, C
1392.91, CH4.23, dd (13, 3.75)94.47, CH4.16, dd (13, 4.5)
1431.43, CH2β 2.39, dd (13, 3.75)33.75, CH2β 2.66, t (13)
α 2.20, d (13)α 2.47, dd (13, 4.5)
15130.88, C 131.25, C
1685.05, C 85.2, C
1727.69, CH31.49, s27.65, CH31.48, s
1827.79, CH31.62, s27.47, CH31.56, s
1927.91, CH31.45, s27.12, CH31.07, s
20164.80, C 169.82, C
2113.31, CH31.42, d (6.4)13.26, CH31.24, d (5.9)
2280.68, C 48.78, CH2.85, s
2398.53, CH5.97, s90.90, CH5.43, s
2418.64, CH31.38, s21.53, CH31.39, s
2517.89, CH31.90, s17.2, CH31.71, s
26 51.3, CH33.68, s
Disclaimer/Publisher’s Note: The statements, opinions and data contained in all publications are solely those of the individual author(s) and contributor(s) and not of MDPI and/or the editor(s). MDPI and/or the editor(s) disclaim responsibility for any injury to people or property resulting from any ideas, methods, instructions or products referred to in the content.

