
Seasonal Variability of Volatile Components in Calypogeia integristipula

 ,
,  , , , and
Abstract
1. Introduction
2. Results and Discussion
2.1. Volatiles Present in Calypogeia integristipula
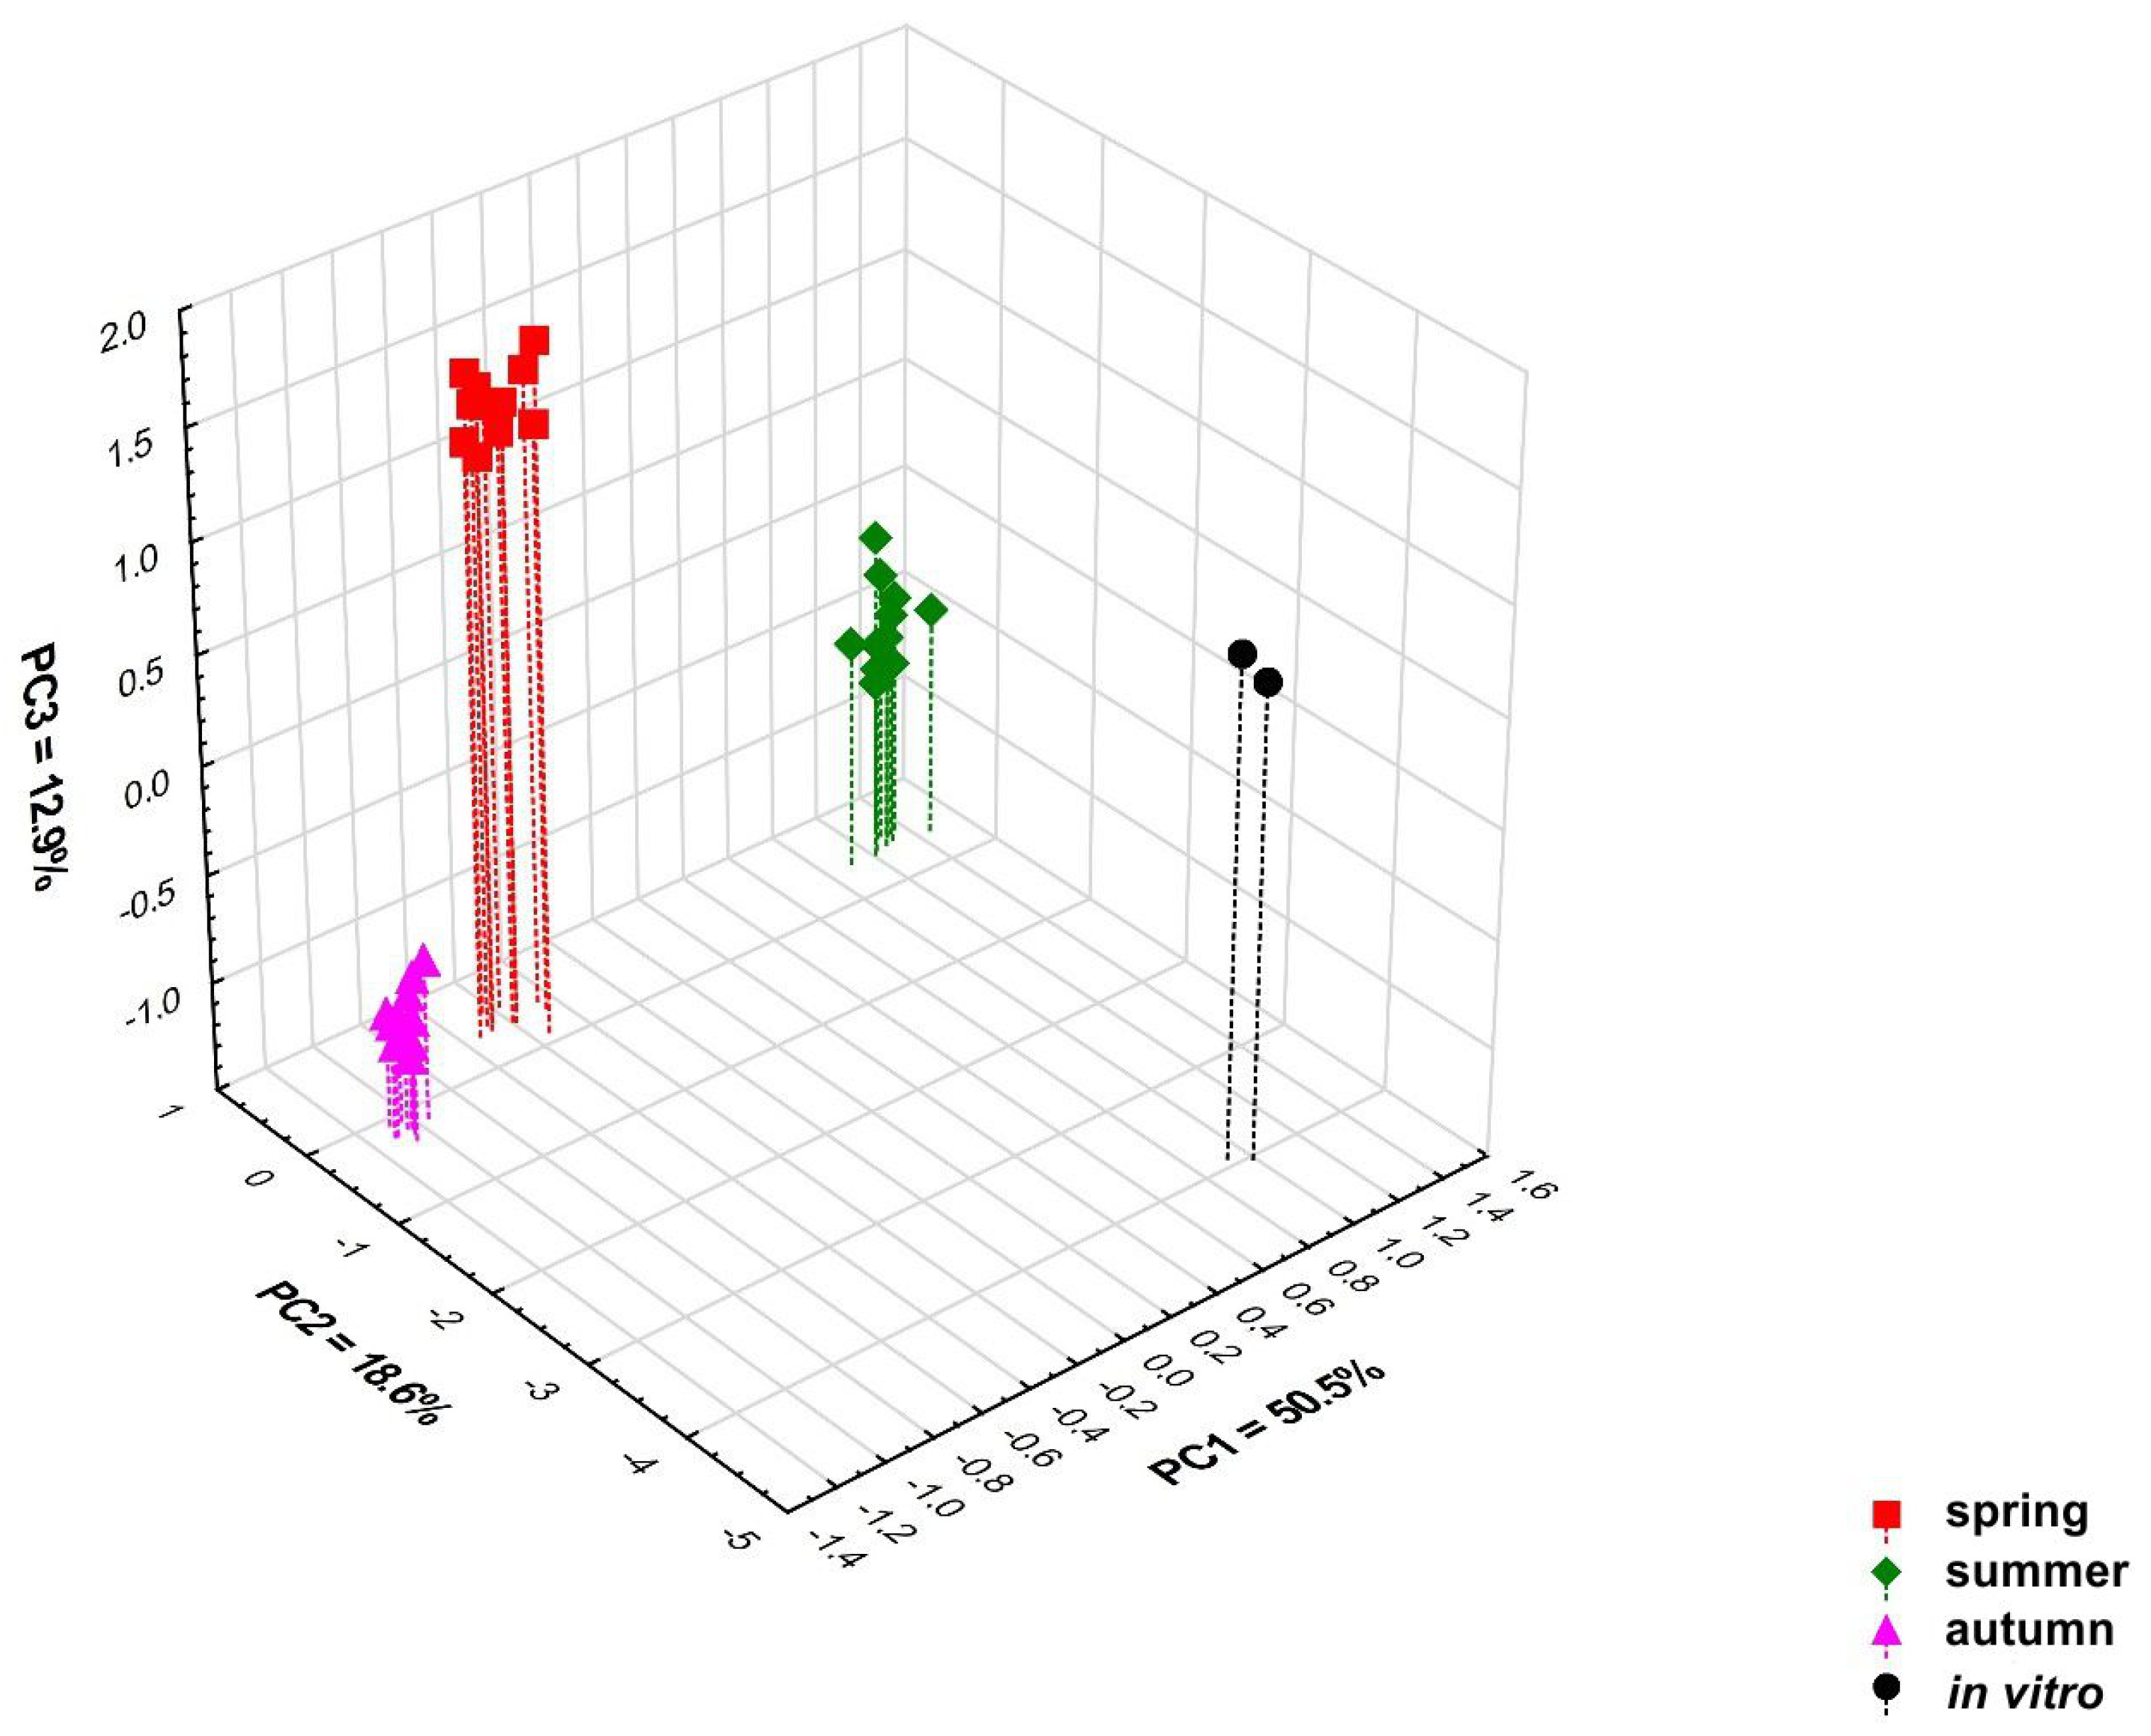
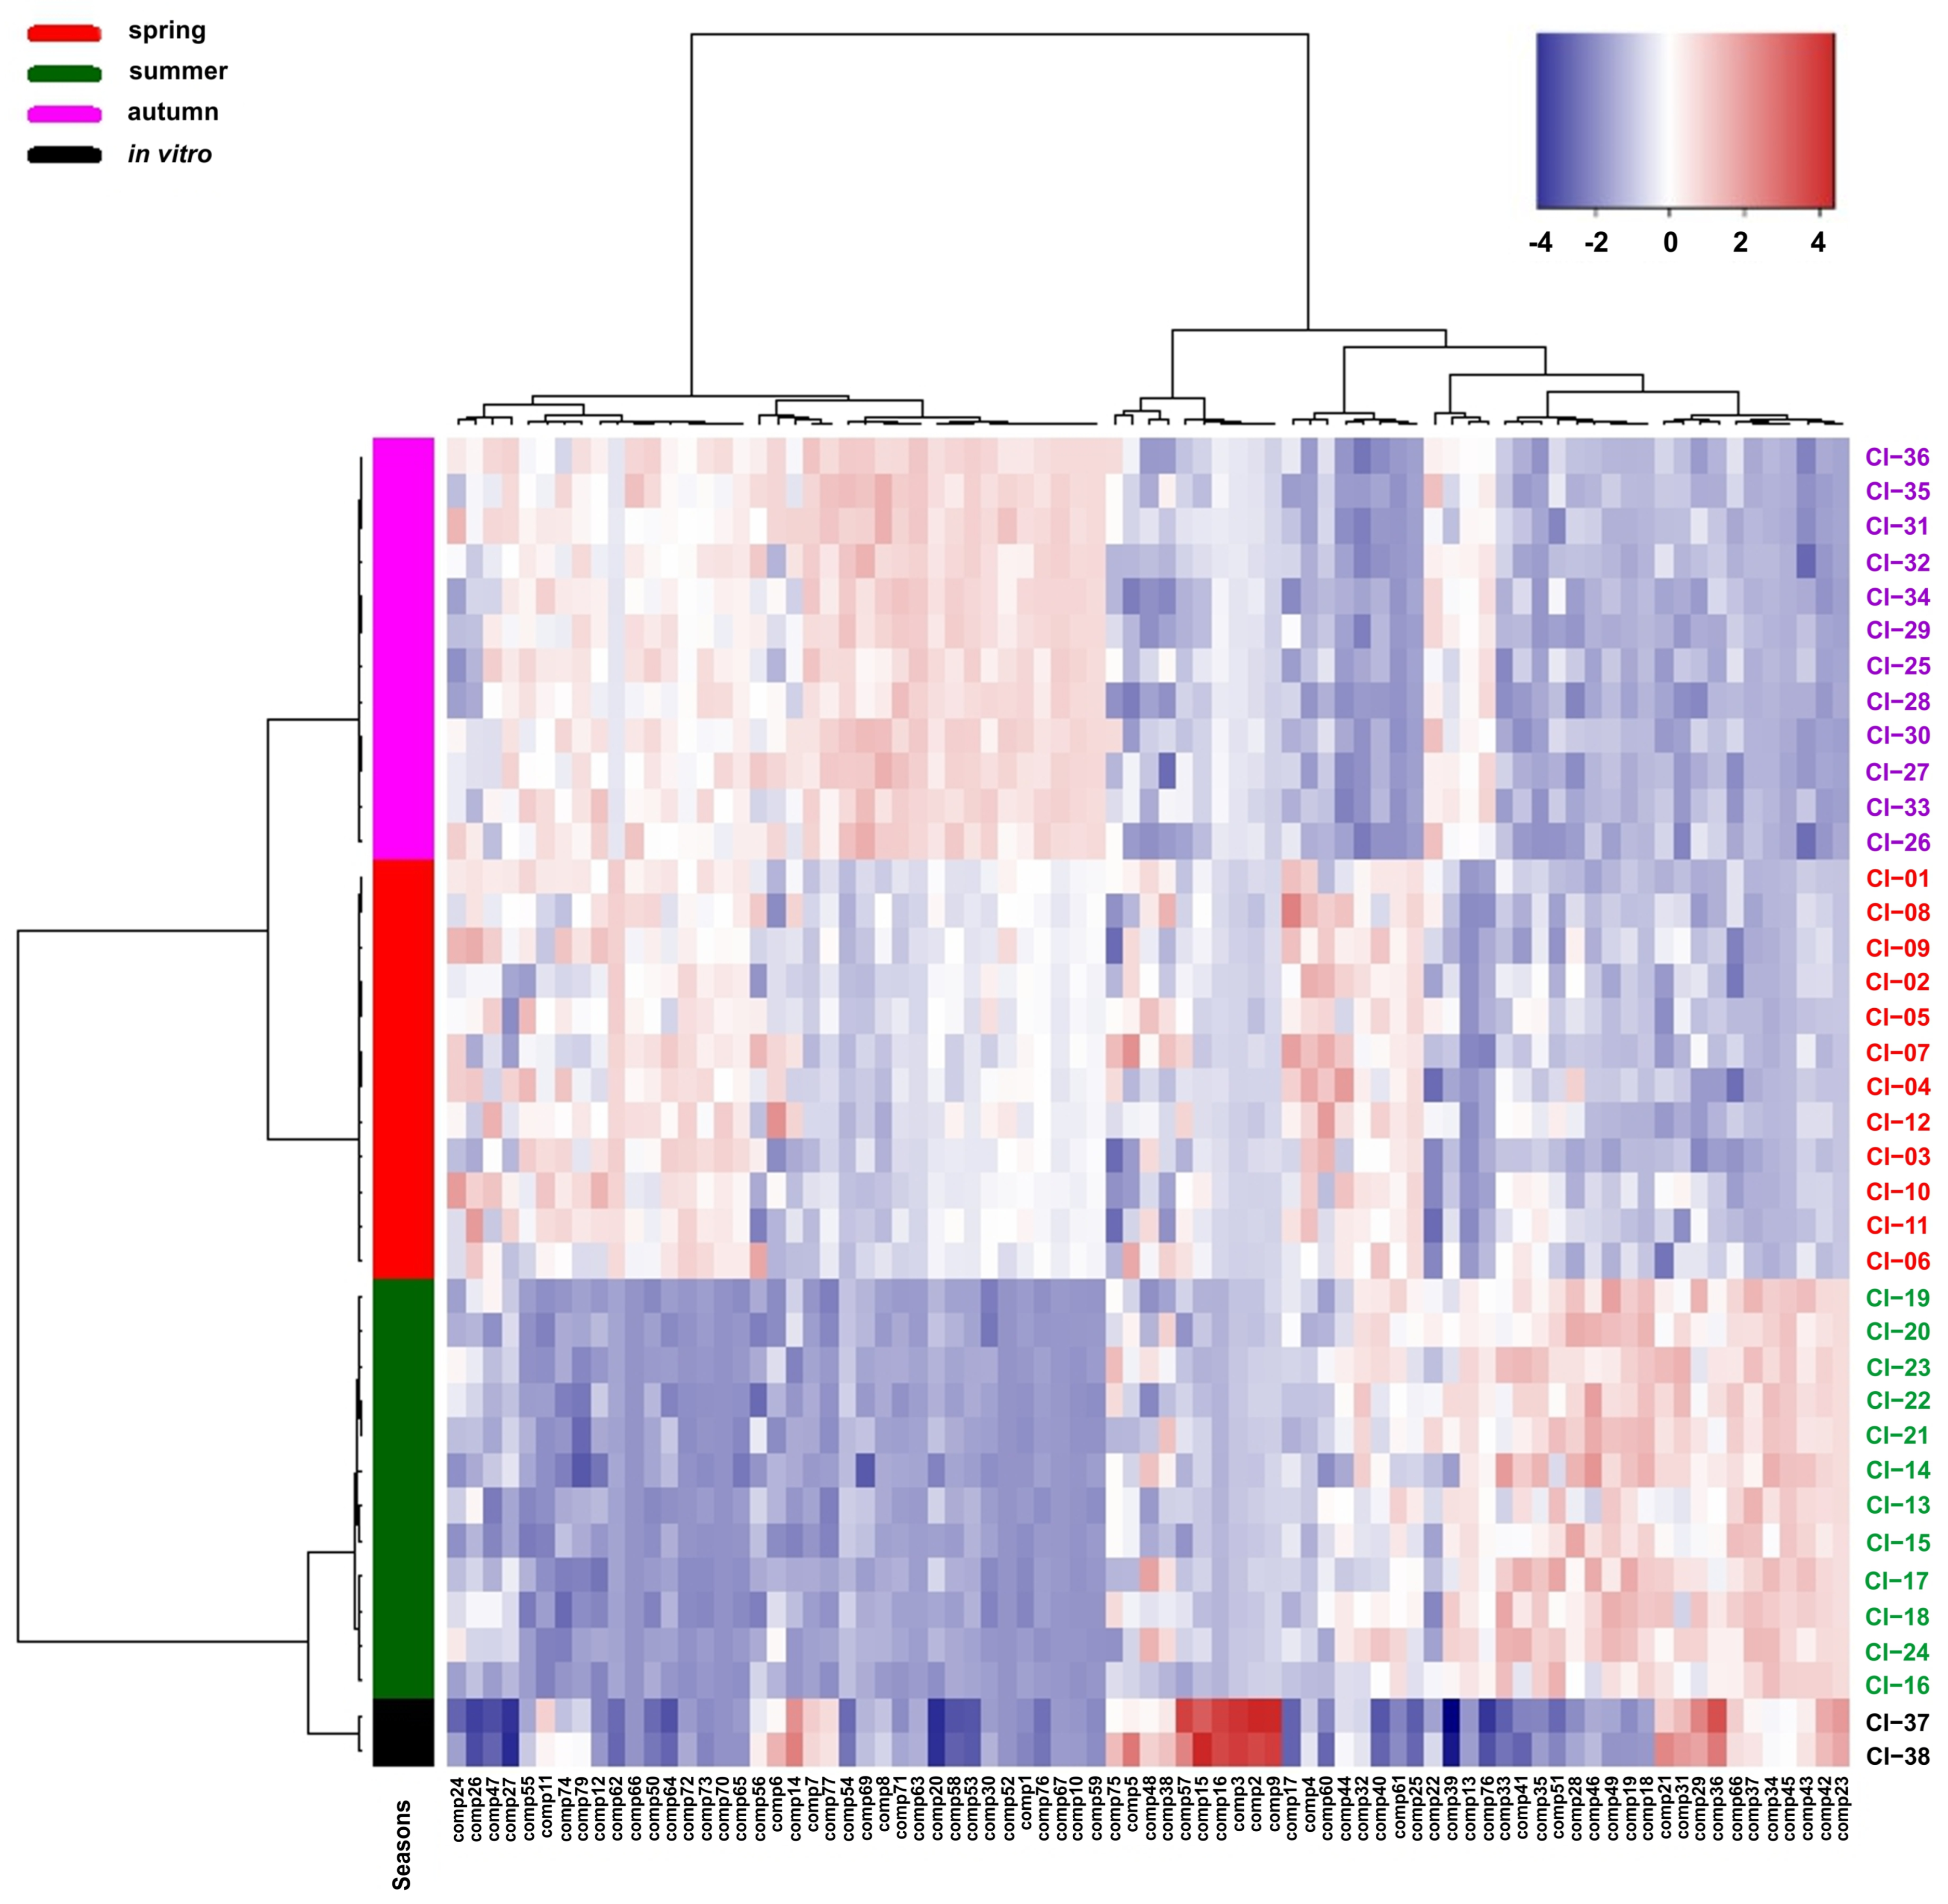
2.2. Statistical Analysis of the Obtained Results
3. Materials and Methods
3.1. Plant Material
3.2. HS-SPME Extraction
3.3. GC-MS Analysis
3.4. Statistical Analysis
4. Conclusions
Supplementary Materials
Author Contributions
Funding
Institutional Review Board Statement
Informed Consent Statement
Data Availability Statement
Acknowledgments
Conflicts of Interest
Sample Availability
References
- Mues, R. Chemistry constituents and biochemistry. In Bryophyte Biology; Cambridge University Press: Cambridge, UK, 2000; pp. 150–181. [Google Scholar]
- Asakawa, Y. Chemical constituents of the bryophytes. In Progress in the Chemistry of Organic Natural Products; Herz, W., Kirby, W.B., Moore, R.E., Steglich, W., Tamm, C., Eds.; Springer: Vienna, Austria, 1995; Volume 65, pp. 1–618. [Google Scholar]
- Asakawa, Y.; Ludwiczuk, A.; Nagashima, F. Chemical Constituences of Bryophytes. Bio- and Chemical Diversity, Biological Activity, and Chemosystematics; Springer: Vienna, Austria, 2013; pp. 1–665. [Google Scholar]
- Asakawa, Y. Chemosystematics of the Hepaticae. Phytochemistry 2004, 65, 623–669. [Google Scholar] [CrossRef] [PubMed]
- Asakawa, Y.; Ludwiczuk, A.; Nagashima, F. Phytochemical and biological studies of bryophytes. Phytochemistry 2013, 91, 52–80. [Google Scholar] [CrossRef] [PubMed]
- He, X.; Sun, Y.; Zhu, R.L. The Oil Bodies of Liverworts: Unique and Important Organelles in Land Plants. Crit. Rev. Plant Sci. 2013, 32, 293–302. [Google Scholar] [CrossRef]
- Suire, C.; Bouvier, F.; Backhaus, R.A.; Bégu, D.; Bonneu, M.; Camara, B. Cellular Localization of Isoprenoid Biosynthetic Enzymes in Marchantia polymorpha. Uncovering a New Role of Oil Bodies. Plant Physiol. 2000, 124, 971–978. [Google Scholar] [CrossRef]
- Ludwiczuk, A.; Asakawa, Y. GC/MS fingerprinting of solvent extracts and essential oils obtained from liverwort species. Nat. Prod. Commun. 2017, 12, 1301–1305. [Google Scholar] [CrossRef]
- Ludwiczuk, A.; Asakawa, Y. Fingerprinting of secondary metabolites of liverworts: Chemosystematic approach. J. AOAC Int. 2014, 97, 1234–1243. [Google Scholar] [CrossRef] [PubMed]
- Ludwiczuk, A.; Asakawa, Y. Chemosystematics of selected liverworts collected in Borneo. Trop. Bryol. 2010, 31, 33–42. [Google Scholar]
- Ludwiczuk, A.; Gradstein, S.R.; Nagashima, F.; Asakawa, Y. Chemosystematics of Porella (Marchantiophyta, Porellaceae). Nat. Prod. Commun. 2011, 6, 315–321. [Google Scholar] [CrossRef]
- Ludwiczuk, A.; Odrzykoski, I.J.; Asakawa, Y. Identification of cryptic species within liverwort Conocephalum conicum based on the volatile components. Phytochemistry 2013, 95, 234–241. [Google Scholar] [CrossRef]
- Wawrzyniak, R.; Wasiak, W.; Jasiewicz, B.; Bączkiewicz, A.; Buczkowska, K. Chemical Fingerprinting of Cryptic Species and Genetic Lineages of Aneura pinguis (L.) Dumort. (Marchantiophyta, Metzgeriidae). Molecules 2021, 26, 1180. [Google Scholar] [CrossRef]
- Yang, L.; Wen, K.-S.; Ruan, X.; Zhao, Y.-X.; Wei, F.; Wang, Q. Response of plant secondary metabolites to environmental factors. Molecules 2018, 23, 762. [Google Scholar] [CrossRef]
- Verma, R.S.; Verma, R.K.; Chauhan, A.; Yadav, A.K. Seasonal variation in essential oil content and composition of Thyme, Thymus serpyllum L. cultivated in Uttarakhand Hills. Indian J. Pharm. Sci. 2011, 73, 233–235. [Google Scholar] [CrossRef]
- Melito, S.; Petretto, G.L.; Chahine, S.; Pintore, G.; Chessa, M. Seasonal variation of essential oil in Rosmarinus officinalis leaves in Sardinia. Nat. Prod. Commun. 2019, 14, 1–7. [Google Scholar] [CrossRef]
- Rathore, S.; Mukhia, S.; Kapoor, S.; Bhatt, V.; Kumar, R.; Kumar, R. Seasonal variability in Essentials oil composition and biological activity of Rosmarinus officinalis L. accessions in the western Himalaya. Sci. Rep. 2022, 12, 3305. [Google Scholar] [CrossRef] [PubMed]
- Aćimović, M.; Zeremski, T.; Šovljanski, O.; Lončar, B.; Pezo, L.; Zheljazkov, V.D.; Pezo, M.; Šuput, D.; Kurunci, Z. Seasonal Variations in Essential Oil Composition of Immortelle Cultivated in Serbia. Horticulturae 2022, 8, 1183. [Google Scholar] [CrossRef]
- Alvarenga, J.P.; Braga, A.F.; Pacheco, F.V.; de Carvalho, A.A.; Pinto, J.E.B.P.; Bertolucci, K.S.V. Seasonal variation in essential oil content and chemical profile of mint in southeast of Brazil. Ciência Rural. Santa Maria 2021, 51, e20200979. [Google Scholar] [CrossRef]
- da Cruz, E.D.N.S.; Peixoto, L.D.S.; da Costa, J.S.; Mourão, R.H.V.; do Nascimento, W.M.O.; Maia, J.G.S.; Setzer, W.N.; da Silva, J.K.; Figueiredo, P.L.B. Seasonal variability of a caryophyllane chemotype essential oil of Eugenia patrisii Vahl occurring in the Brazilian Amazon. Molecules 2022, 27, 2417. [Google Scholar] [CrossRef]
- Guzowska, M.; Wawrzyniak, R.; Wasiak, W. Seasonal Variability and Effect of Sample Storage on Volatile. Molecules 2022, 27, 2426. [Google Scholar] [CrossRef]
- Schuster, R.M. Hepaticae and Anthocerotae of North America East of the Hundredth Meridian; Columbia University Press: New York, NY, USA, 1969; Volume 2. [Google Scholar]
- Söderström, L.; Hagborg, A.; Konrat, M. World checklist of hornworts and liverworts. PhytoKeys 2016, 59, 1–829. [Google Scholar] [CrossRef]
- Bischler, H. The Genus Calypogeia Raddi in Central and South America. I–III.; Candollea: Geneva, Switzerland, 1963; Volume 18, pp. 19–128. [Google Scholar]
- Schuster, R.M. Phylogenetic and taxonomic studies of Jungermanniidae, III. Calypogeiaceae. Fragm. Flor. Geobot. 1995, 40, 825–888. [Google Scholar]
- Damsholt, K. Illustrated Flora of Nordic Liverworts and Hornworts; Nordic Bryological Society: Lund, Sweden, 2022. [Google Scholar]
- Paton, J.A. The Liverwort Flora of the British Isles; Brill Academic Pub: Essex, UK, 1999. [Google Scholar]
- Hebert, P.D.N.; Cywinska, A.; Ball, S.L.; deWaard, J.R. Biological identifications through DNA barcodes. Proc. Biol. Sci. 2003, 270, 313–321. [Google Scholar] [CrossRef]
- Lunić, T.M.; Mandić, M.R.; Oalđe Pavlović, M.M.; Sabovljević, A.D.; Sabovljević, M.S.; Božić Nedeljković, B.; Božić, B. The Influence of Seasonality on Secondary Metabolite Profiles and Neuroprotective Activities of Moss Hypnum Cupressiforme Extracts: In Vitro and in Silico Study. Plants 2022, 11, 123. [Google Scholar] [CrossRef]
- Buczkowska, K.; Bakalin, V.; Bączkiewicz, A.; Aguero, B.; Gonera, P.; Ślipiko, M.; Szczecińska, M.; Sawicki, J. Does Calypogeia azurea (Calypogeiaceae, Marchantiophyta) occur outside Europe? Molecular and morphological evidence. PLoS ONE 2018, 13, e0204561. [Google Scholar] [CrossRef]
- Stein, S.E. NIST/EPA/NIH Mass Spectral Database (NIST 11); National Institute of Standards and Technology: Gaithersburg, MD, USA, 2011. [Google Scholar]
- Stein, S.E. NIST Chemistry WebBook. In NIST Standard Reference Database 69; National Institute of Standards and Technology: Gaithersburg, MD, USA, 2023. Available online: http://webbook.nist.gov/ (accessed on 3 October 2023).
- Adams, R.P. Identification of Essential Oil Components by Gas Chromatography/Mass Spectrometry, 4.1 ed.; Diablo Analytical, Inc.: Antioch, CA, USA, 2017; Available online: https://diabloanalytical.com/ms-software/essentialoilcomponentsbygcms/ (accessed on 3 October 2023).
- El-Sayed, A.M. The Pherobase: Database of Pheromones and Semiochemicals. Available online: http://www.pherobase.com/ (accessed on 3 October 2023).
- Gehlenborg, N.; Wong, B. Heat maps. Nat. Methods 2012, 9, 213. [Google Scholar] [CrossRef]
- Haarman, B.C.M.; Riemersma-Van der Lek, R.F.; Burger, H.; Nolen, W.A.; Mendes, R.; Drexhage, H.A.; Burger, H. Feature-expression heat maps—A new visual method to Explorer complex associations between two variable sets. J. Biomed. Inform. 2015, 53, 156–161. [Google Scholar] [CrossRef]
- Zhao, S.; Guo, Y.; Sheng, Q.; Shyr, Y. Advanced Heat Map and Clustering Analysis Using Heatmap3. BioMed Res. Int. 2014, 2014, 986048. [Google Scholar] [CrossRef]
- Zhao, S.; Yin, L.; Guo, Y.; Sheng, Q.; Shyr, Y. An Improved Heatmap Package, Version 1.1.9; CRAN: Vienna, Austria, 2021; Available online: https://cran.r-project.org/web/packages/heatmap3/heatmap3.pdf (accessed on 3 October 2023).
 spring,
  summer,
  autumn and obtained
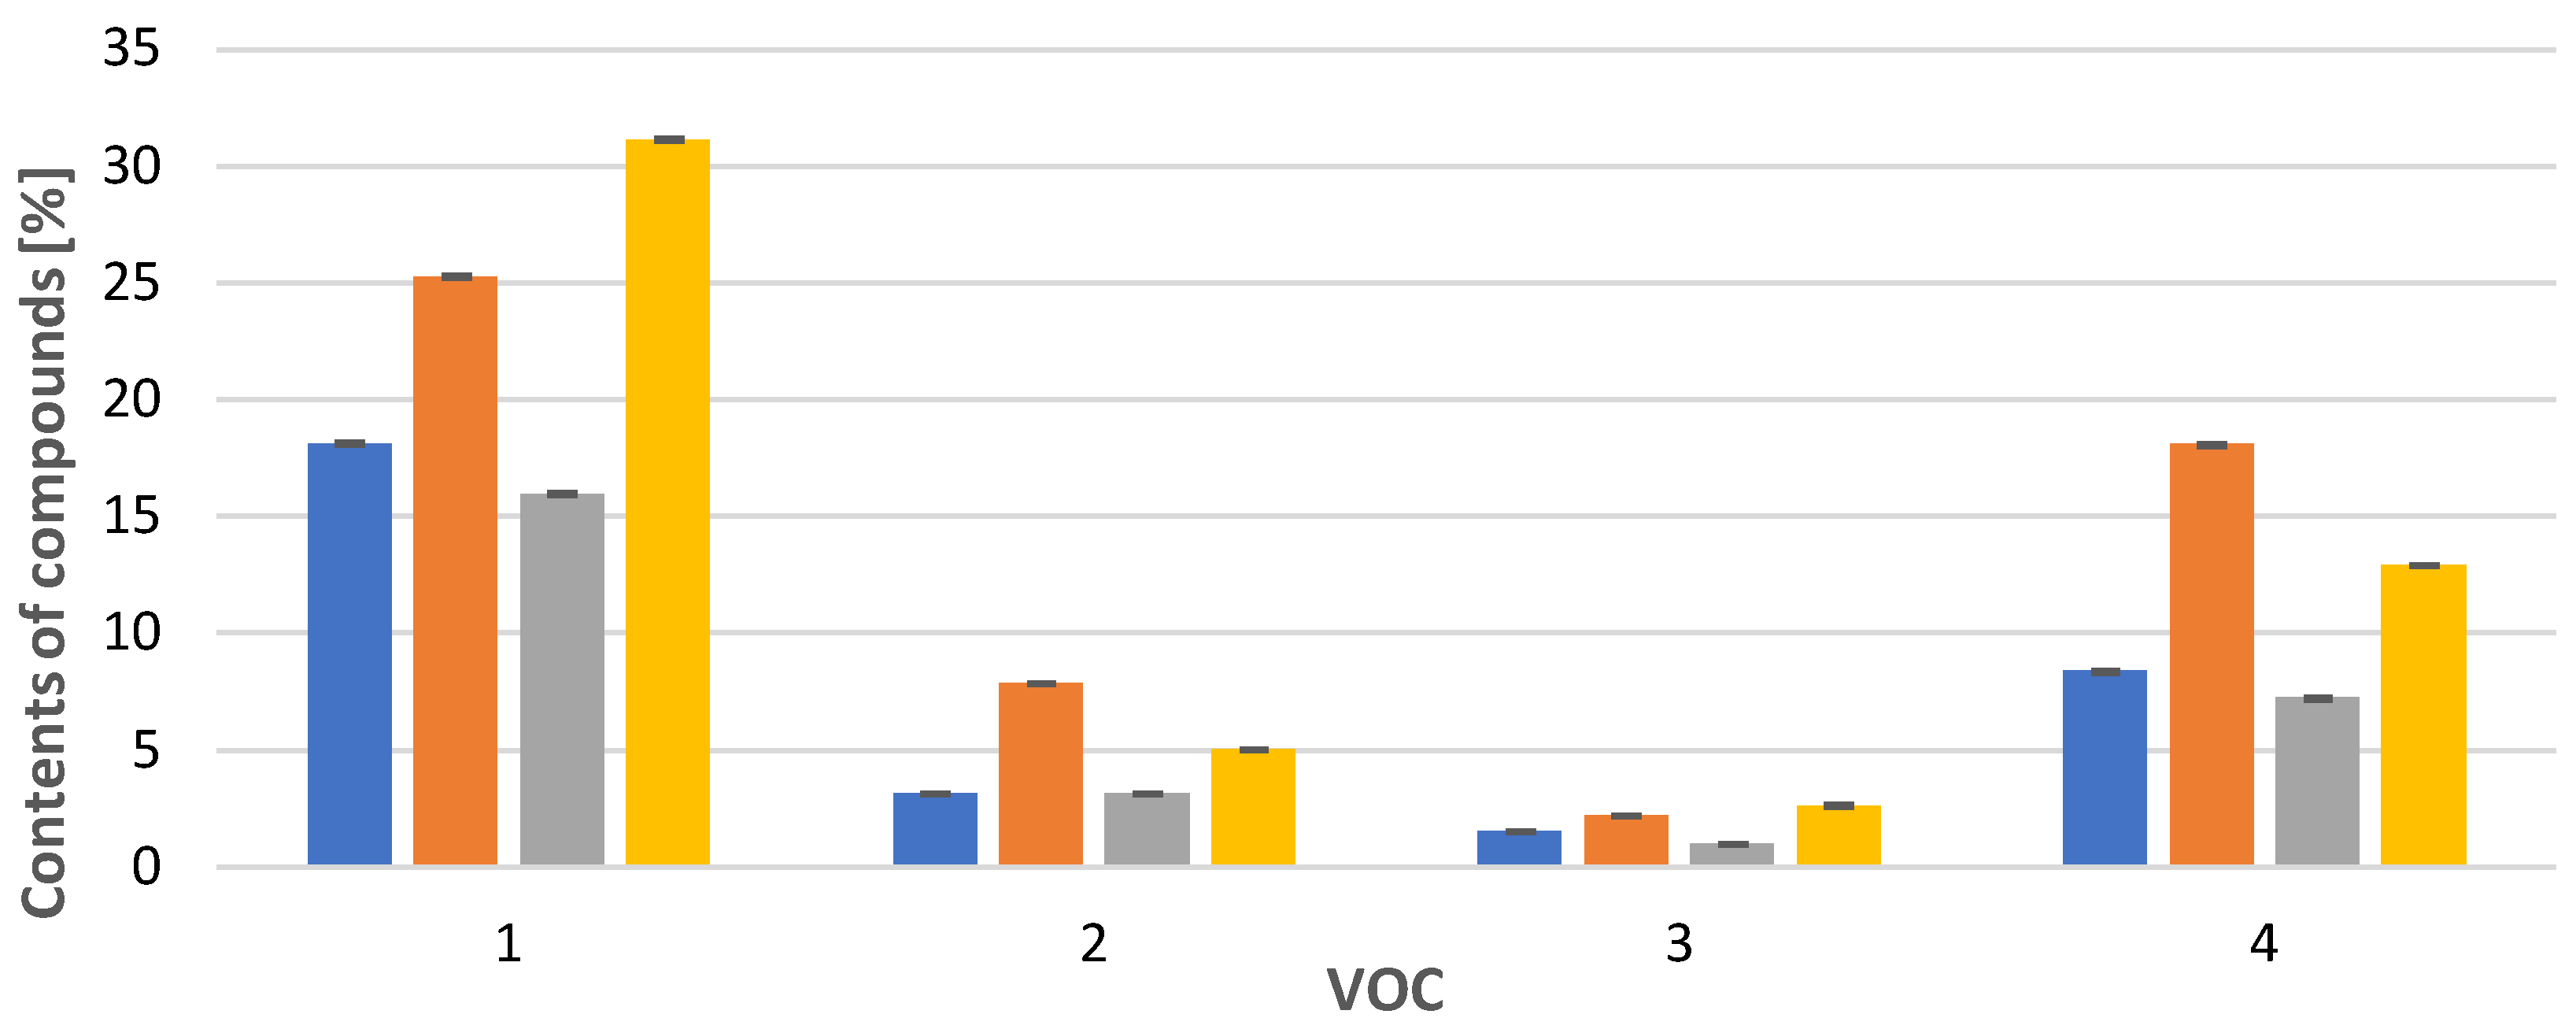
  in vitro. Compounds: 1: anastreptene (23), 2: aromandendrene (34), 3: δ-selinene (42), 4: bicyclogermacrene (45). The deviation bar shows the standard deviation for a given group.
spring, summer, autumn and obtained in vitro. Compounds: 1: anastreptene (23), 2: aromandendrene (34), 3: δ-selinene (42), 4: bicyclogermacrene (45). The deviation bar shows the standard deviation for a given group.
in vitro. Compounds: 1: anastreptene (23), 2: aromandendrene (34), 3: δ-selinene (42), 4: bicyclogermacrene (45). The deviation bar shows the standard deviation for a given group.
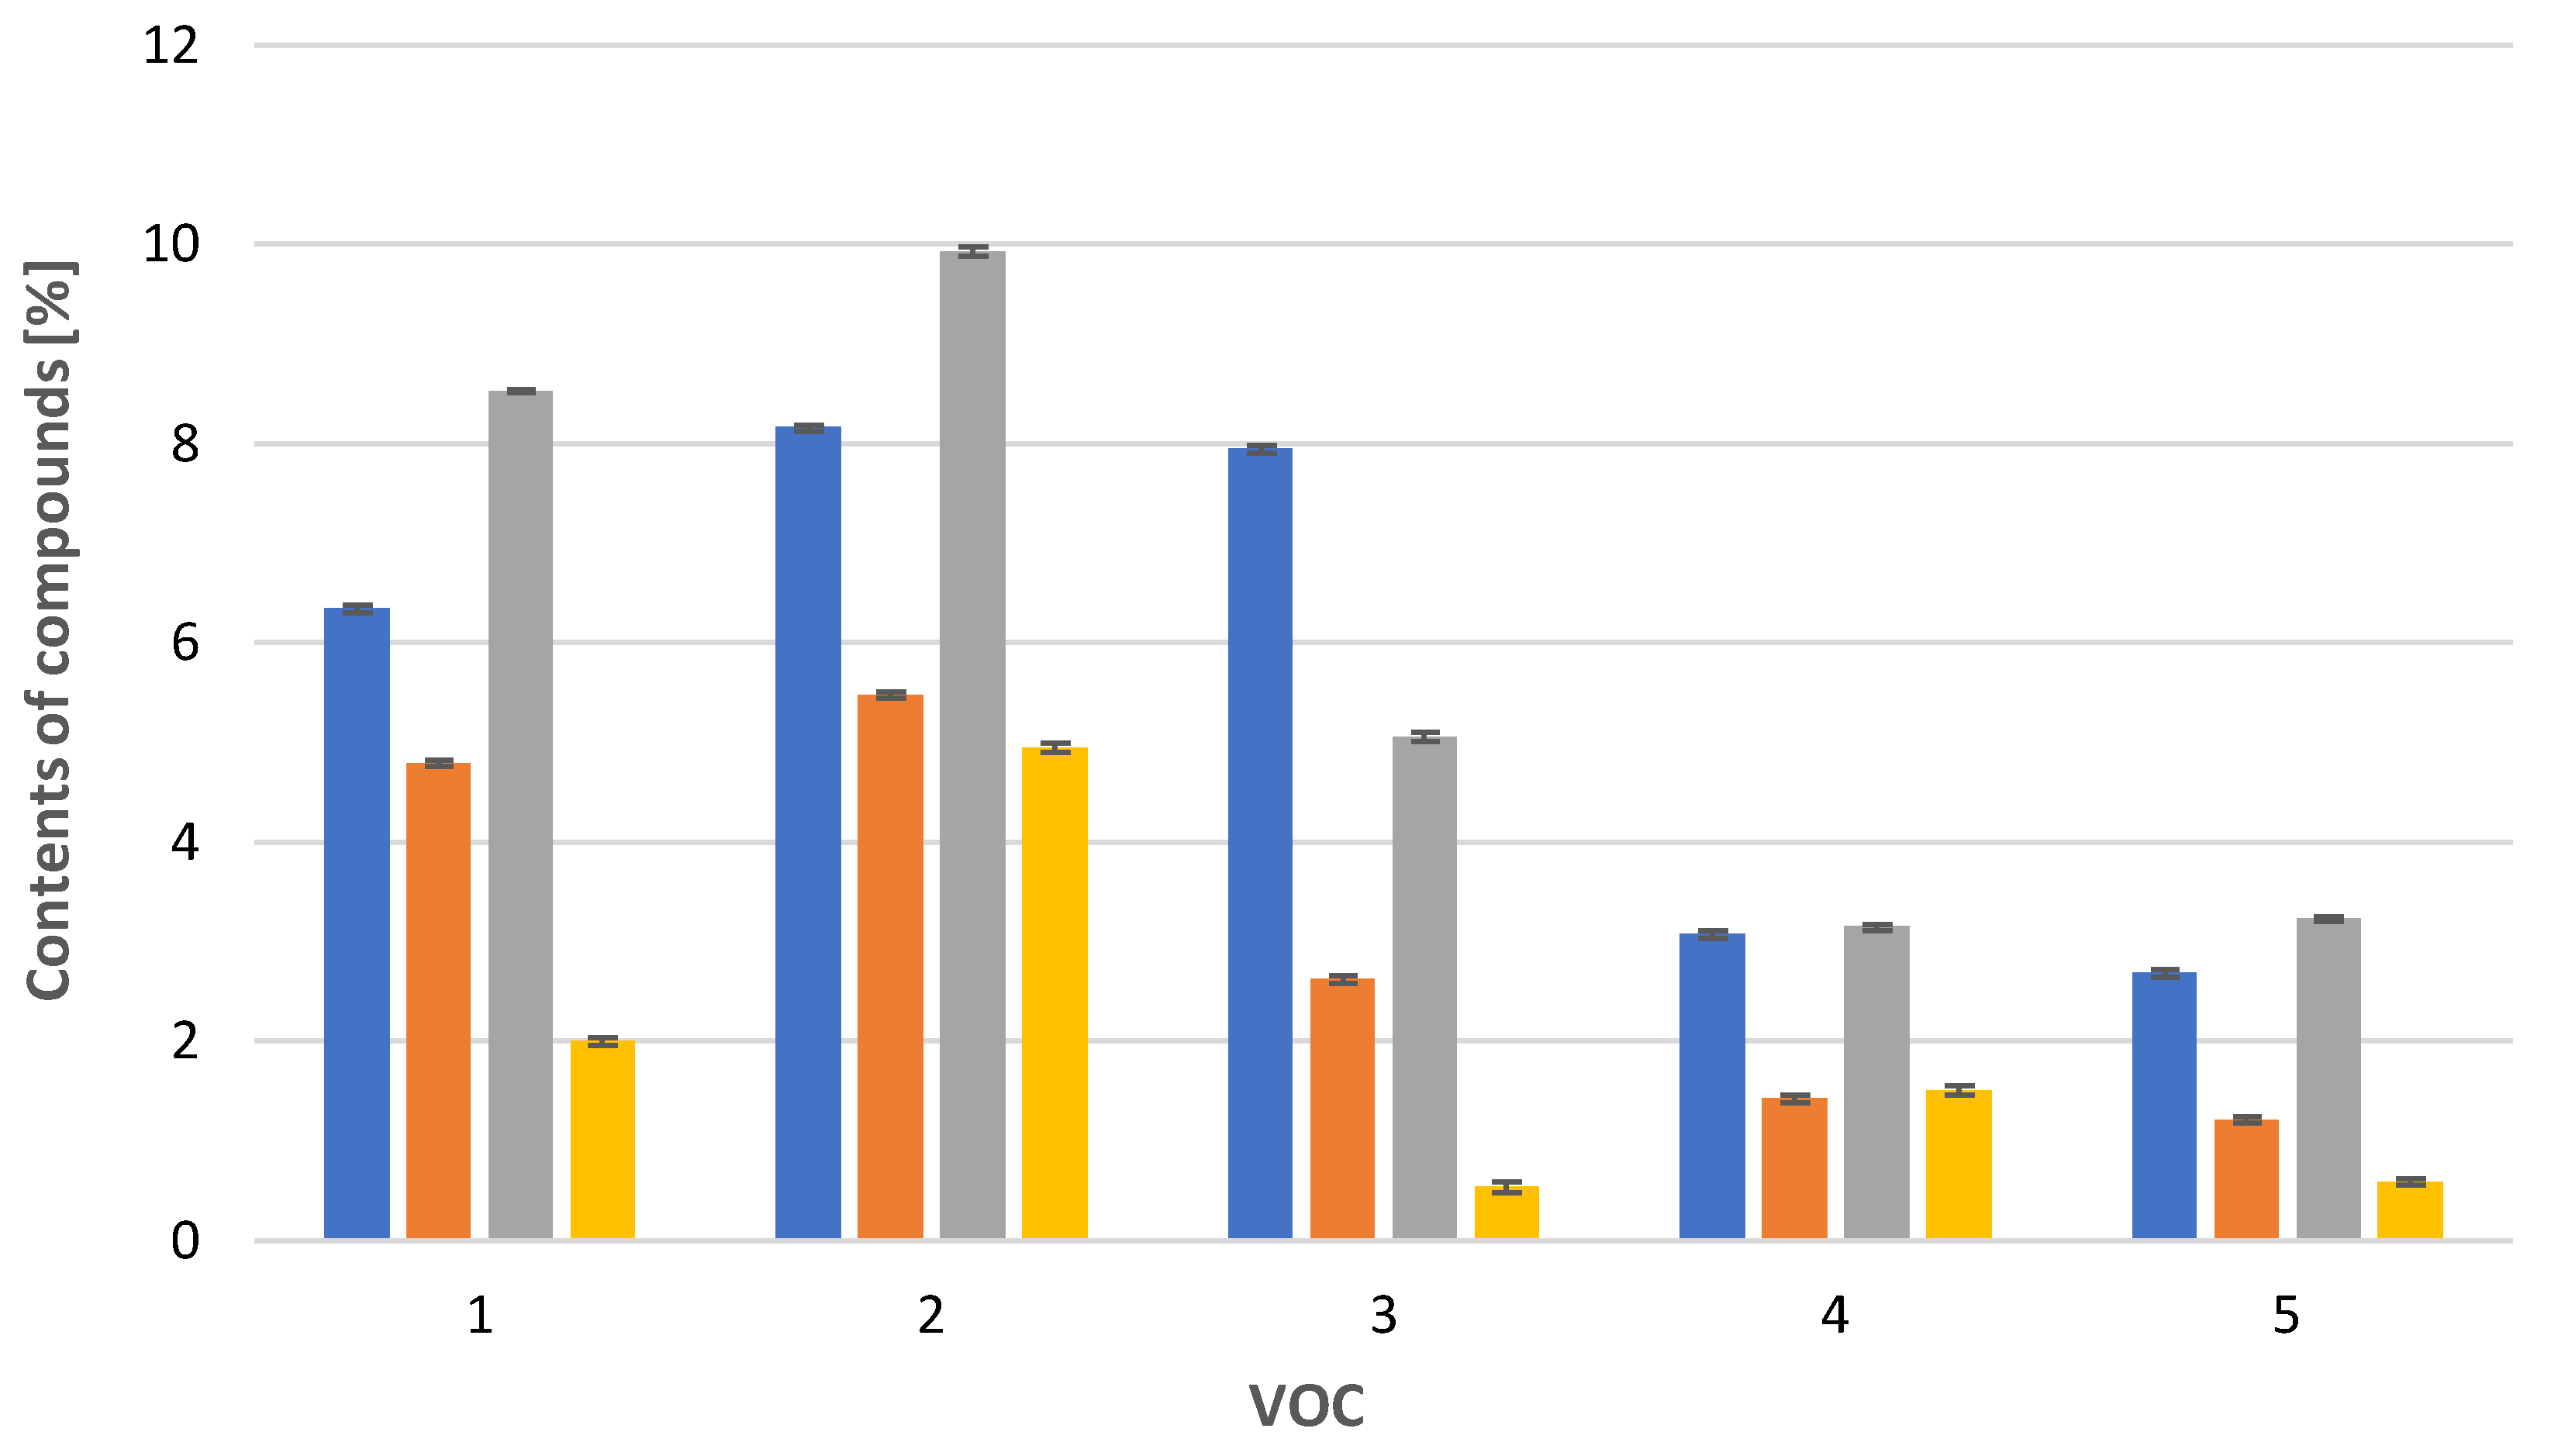
spring, summer, autumn and obtained in vitro. Compounds: 1: anastreptene (23), 2: aromandendrene (34), 3: δ-selinene (42), 4: bicyclogermacrene (45). The deviation bar shows the standard deviation for a given group. spring, summer, autumn and obtained in vitro. 1: 4,5,9,10-dehydro-isolongifolene (53), 2: palustrol (59), 3: spathulenol (62), 4: globulol (65), 5: 1,4-dimethyl-7-(1-methylethyl)-azulene (78). The deviation bar shows the standard deviation for a given group.
spring, summer, autumn and obtained in vitro. 1: 4,5,9,10-dehydro-isolongifolene (53), 2: palustrol (59), 3: spathulenol (62), 4: globulol (65), 5: 1,4-dimethyl-7-(1-methylethyl)-azulene (78). The deviation bar shows the standard deviation for a given group.
spring, summer, autumn and obtained in vitro. 1: 4,5,9,10-dehydro-isolongifolene (53), 2: palustrol (59), 3: spathulenol (62), 4: globulol (65), 5: 1,4-dimethyl-7-(1-methylethyl)-azulene (78). The deviation bar shows the standard deviation for a given group.


| Sample Code | Collection Place | Geographical Coordinates | Date Month Year |
|---|---|---|---|
| Spring | |||
| CI-1 | South-Eastern Poland, Bieszczady Mts, Rozsypaniec | 49°03′35.5″ N, 22°46′10.7″ E | May 2022 |
| CI-2 | Southern Poland, Tatry Mts, Morskie Oko | 49°12′00.0″ N, 20°04′24.3″ E | May 2022 |
| CI-3 | Southern Poland, Tatry Mts, Gąsienicowa Valley | 49°14′45.8″ N, 20°00′25.1″ E | May 2022 |
| CI-4 | Southern Poland, Tatry Mts, Kościeliska Valley | 49°15′18.3″ N, 19°51′55.4″ E | May 2022 |
| CI-5 | Southern Poland, Małe Pieniny Mts | 49°22′56.8″ N, 20°33′18.9″ E | May 2022 |
| CI-6 | Southern Poland, Pieniny Mts, Potok Kotłowy stream | 49°24′22.5″ N, 20°24′02.1″ E | May 2022 |
| CI-7 | Southern Poland, Gorce Mts, Ochotnica Dolna | 49°32′04.5″ N, 20°19′00.0″ E | May 2022 |
| CI-8 | Central Poland, Wielkopolska, Antonin | 51°30′59.8″ N, 17°50′58.1″ E | May 2022 |
| CI-9 | Western Poland, Lubuskie, Nabłoto | 51°47′31.4″ N, 14°46′55.8″ E | May 2022 |
| CI-10 | North-Eastern Poland, Suwałki Lake District, Lake Łempis | 54°02′38.2″ N, 23°28′10.8″ E | May 2022 |
| CI-11 | North-Western Poland, Pomerania, Lake Czarne | 54°22′50.7″ N, 18°12′07.6″ E | May 2022 |
| CI-12 | North-Western Poland, Pomerania, Lake Lubygość | 54°24′46.7″ N, 17°58′44.0″ E | May 2022 |
| Summer | |||
| CI-13 | South-Eastern Poland, Bieszczady Mts, Rozsypaniec | 49°03′35.5″ N, 22°46′10.7″ E | July 2022 |
| CI-14 | Southern Poland, Tatry Mts, Morskie Oko | 49°12′00.0″ N, 20°04′24.3″ E | July 2022 |
| CI-15 | Southern Poland, Tatry Mts, Gąsienicowa Valley | 49°14′45.8″ N, 20°00′25.1″ E | July 2022 |
| CI-16 | Southern Poland, Tatry Mts, Kościeliska Valley | 49°15′18.3″ N, 19°51′55.4″ E | July 2022 |
| CI-17 | Southern Poland, Małe Pieniny Mts | 49°22′56.8″ N, 20°33′18.9″ E | July 2022 |
| CI-18 | Southern Poland, Pieniny Mts, Potok Kotłowy Stream | 49°24′22.5″ N, 20°24′02.1″ E | July 2022 |
| CI-19 | Southern Poland, Gorce Mts, Ochotnica Dolna | 49°32′04.5″ N, 20°19′00.0″ E | July 2022 |
| CI-20 | Central Poland, Wielkopolska, Antonin | 51°30′59.8″ N, 17°50′58.1″ E | July 2022 |
| CI-21 | Western Poland, Lubuskie, Nabłoto | 51°47′31.4″ N, 14°46′55.8″ E | July 2022 |
| CI-22 | North-Eastern Poland, Suwałki Lake District, Lake Łempis | 54°02′38.2″ N, 23°28′10.8″ E | July 2022 |
| CI-23 | North-Western Poland, Pomerania, Lake Czarne | 54°22′50.7″ N, 18°12′07.6″ E | July 2022 |
| CI-24 | North-Western Poland, Pomerania, Lake Lubygość | 54°24′46.7″ N, 17°58′44.0″ E | July 2022 |
| Autumn | |||
| CI-25 | South-Eastern Poland, Bieszczady Mts, Rozsypaniec | 49°03′35.5″ N, 22°46′10.7″ E | September 2022 |
| CI-26 | Southern Poland, Tatry Mts, Morskie Oko | 49°12′00.0″ N, 20°04′24.3″ E | September 2022 |
| CI-27 | Southern Poland, Tatry Mts, Gąsienicowa Valley | 49°14′45.8″ N, 20°00′25.1″ E | September 2022 |
| CI-28 | Southern Poland, Tatry Mts, Kościeliska Valley | 49°15′18.3″ N, 19°51′55.4″ E | September 2022 |
| CI-29 | Southern Poland, Małe Pieniny Mts | 49°22′56.8″ N, 20°33′18.9″ E | September 2022 |
| CI-30 | Southern Poland, Pieniny Mts, Potok Kotłowy Stream | 49°24′22.5″ N, 20°24′02.1″ E | September 2022 |
| CI-31 | Southern Poland, Gorce Mts, Ochotnica Dolna | 49°32′04.5″ N, 20°19′00.0″ E | September 2022 |
| CI-32 | Central Poland, Wielkopolska, Antonin | 51°30′59.8″ N, 17°50′58.1″ E | September 2022 |
| CI-33 | Western Poland, Lubuskie, Nabłoto | 51°47′31.4″ N, 14°46′55.8″ E | September 2022 |
| CI-34 | North-Eastern Poland, Suwałki Lake District, Lake Łempis | 54°02′38.2″ N, 23°28′10.8″ E | September 2022 |
| CI-35 | North-Western Poland, Pomerania, Lake Czarne | 54°22′50.7″ N, 18°12′07.6″ E | September 2022 |
| CI-36 | North-Western Poland, Pomerania, Lake Lubygość | 54°24′46.7″ N, 17°58′44.0″ E | September 2022 |
| In vitro | |||
| CI-37 | North-Western Poland, Pomerania, Lake Lubygość | 54°24′46.7″ N, 17°58′44.0″ E | March 2022 |
| CI-38 | North-Western Poland, Pomerania, Lake Lubygość | 54°24′46.7″ N, 17°58′44.0″ E | March 2023 |
| (a) | |||||||||
|---|---|---|---|---|---|---|---|---|---|
| No. | Compounds * | RI ** | RI *** | Code **** | |||||
| CI-1 | CI-2 | CI-3 | CI-4 | CI-5 | CI-6 | ||||
| 1 | propan-1-ol | <700 a,b | 483 a | 1.11 (0.02) | 1.13 (0.03) | 1.17 (0.02) | 1.15 (0.03) | 1.09 (0.03) | 0.99 (0.05) |
| 2 | pentanal | 705 a,b,c,d | 704 c | 0.38 (0.03) | 0.32 (0.05) | 0.38 (0.03) | 0.35 (0.04) | 0.25 (0.04) | 0.34 (0.04) |
| 3 | hexanal | 802 a,b,c,d | 801 c | 0.18 (0.02) | 0.23 (0.03) | 0.18 (0.04) | 0.21 (0.02) | 0.22 (0.03) | 0.19 (0.03) |
| 4 | hexan-1-ol | 867 a,b | 869 a | 0.49 (0.05) | 0.55 (0.05) | 0.51 (0.02) | 0.56 (0.04) | 0.47 (0.04) | 0.41 (0.04) |
| 5 | heptanal | 902 a,b,c,d | 901 c | 0.06 (0.01) | 0.07 (0.02) | 0.02 (0.01) | 0.03 (0.01) | 0.06 (0.02) | 0.09 (0.02) |
| 6 | α-pinene | 939 a,b,c | 932 c | 0.02 (0.01) | 0.03 (0.01) | 0.01 (0.01) | 0.05 (0.01) | 0.03 (0.01) | 0.02 (0.01) |
| 7 | benzaldehyde | 940 a,b,c | 952 c | 0.18 (0.03) | 0.20 (0.06) | 0.15 (0.02) | 0.22 (0.03) | 0.21 (0.03) | 0.17 (0.05) |
| 8 | 2-ethylhexan-1-ol | 1023 a,b | 1025 a | 0.08 (0.02) | 0.09 (0.02) | 0.05 (0.01) | 0.06 (0.02) | 0.10 (0.04) | 0.11 (0.03) |
| 9 | phenylmethanol | 1028 a,b,c | 1026 c | 1.11 (0.03) | 1.17 (0.06) | 1.21 (0.04) | 1.05 (0.04) | 1.13 (0.03) | 1.09 (0.03) |
| 10 | phenylacetaldehyde | 1044 a,b | 1044 a | 1.18 (0.03) | 1.23 (0.03) | 1.15 (0.04) | 1.12 (0.05) | 1.19 (0.04) | 1.22 (0.04) |
| 11 | nonanal | 1102 a,b,c,d | 1100 c | 0.12 (0.01) | 0.08 (0.05) | 0.13 (0.03) | 0.09 (0.02) | 0.10 (0.03) | 0.11 (0.02) |
| 12 | 3,4-dimethylcyclohexan-1-ol | 1115 a,b | 1126 a | 0.09 (0.03) | 0.08 (0.03) | 0.11 (0.03) | 0.07 (0.02) | 0.09 (0.03) | 0.07 (0.03) |
| 13 | phenylethanol | 1121 a,b | 1121 a | 0.16 (0.02) | 0.13 (0.06) | 0.12 (0.01) | 0.15 (0.03) | 0.13 (0.04) | 0.16 (0.04) |
| 14 | decanal | 1195 a,b,c,d | 1201 c | 0.07 (0.02) | 0.05 (0.01) | 0.03 (0.01) | 0.05 (0.02) | 0.06 (0.02) | 0.04 (0.02) |
| 15 | β-cyclocitral | 1221 c | 1217 c | 0.08 (0.01) | 0.07 (0.01) | 0.07 (0.02) | 0.06 (0.02) | 0.05 (0.01) | 0.08 (0.03) |
| 16 | 2-phenoxyethan-1-ol | 1225 a,b | 1226 a | 0.95 (0.51) | 0.87 (0.05) | 0.99 (0.03) | 1.01 (0.03) | 0.92 (0.05) | 0.88 (0.05) |
| 17 | bicycloelemene | 1316 a | 1330 a | 0.14 (0.02) | 0.10 (0.03) | 0.08 (0.02) | 0.13 (0.04) | 0.11 (0.03) | 0.09 (0.02) |
| 18 | δ-elemene | 1324 a,b,c | 1335 c | 0.74 (0.04) | 0.77 (0.02) | 0.71 (0.03) | 0.78 (0.03) | 0.82 (0.04) | 0.83 (0.05) |
| 19 | 204[M+](5) 121(100) 93(89) | 1343 | ND | 0.18 (0.02) | 0.19 (0.03) | 0.15 (0.03) | 0.21 (0.04) | 0.19 (0.04) | 0.23 (0.04) |
| 20 | 200[M+](39) 159(100) 117(95) | 1345 | ND | 1.09 (0.05) | 1.07 (0.05) | 0.99 (0.04) | 1.04 (0.04) | 1.11 (0.06) | 1.05 (0.03) |
| 21 | 202[M+](13) 81(100) 96(73) | 1350 | ND | 0.11 (0.01) | 0.09 (0.01) | 0.12 (0.02) | 0.14 (0.02) | 0.08 (0.02) | 0.06 (0.02) |
| 22 | 204[M+](10) 119(100) 91(84) | 1353 | ND | 0.08 (0.01) | 0.05 (0.02) | 0.04 (0.01) | 0.03 (0.01) | 0.09 (0.02) | 0.04 (0.02) |
| 23 | anastreptene | 1370 a | 1370 a | 17.99 (0.06) | 18.13 (0.05) | 18.10 (0.06) | 17.92 (0.05) | 18.19 (0.06) | 18.21 (0.05) |
| 24 | 204[M+](5) 81(100) 93(96) | 1384 | ND | 0.21 (0.02) | 0.18 (0.02) | 0.15 (0.05) | 0.23 (0.04) | 0.19 (0.02) | 0.17 (0.05) |
| 25 | β-elemene | 1391 a,b,c | 1389 c | 2.71 (0.01) | 2.81 (0.04) | 2.72 (0.03) | 2.76 (0.04) | 2.83 (0.03) | 2.76 (0.03) |
| 26 | 204[M+](13) 157(100) 185(84) | 1398 | ND | 0.29 (0.02) | 0.25 (0.05) | 0.18 (0.02) | 0.32 (0.03) | 0.27 (0.04) | 0.32 (0.02) |
| 27 | 204[M+](13) 157(100) 185(84) | 1417 | ND | 0.34 (0.03) | 0.21 (0.02) | 0.23 (0.03) | 0.37 (0.05) | 0.18 (0.02) | 0.24 (0.04) |
| 28 | 204[M+](19) 135(100) 105(82) | 1423 | ND | 0.17 (0.01) | 0.25 (0.04) | 0.15 (0.05) | 0.31 (0.05) | 0.22 (0.04) | 0.15 (0.02) |
| 29 | 204[M+](9) 91(100) 105(93) | 1425 | ND | 0.03 (0.01) | 0.06 (0.03) | 0.01 (0.01) | 0.02 (0.01) | 0.04 (0.01) | 0.06 (0.02) |
| 30 | (-)-aristolene | 1429 a,b,c,d | 1428 a | 1.02 (0.02) | 1.12 (0.05) | 0.99 (0.05) | 1.05 (0.05) | 1.18 (0.03) | 1.06 (0.04) |
| 31 | 204[M+](9) 107(100) 79(43) | 1432 | ND | 0.15 (0.02) | 0.18 (0.03) | 0.16 (0.04) | 0.16 (0.03) | 0.20 (0.03) | 0.19 (0.04) |
| 32 | γ-maaliene | 1435 a,b | 1427 a | 0.49 (0.04) | 0.55 (0.02) | 0.47 (0.03) | 0.51 (0.04) | 0.50 (0.02) | 0.47 (0.05) |
| 33 | α-maaliene | 1443 a,b | 1442 a | 0.34 (0.04) | 0.33 (0.04) | 0.27 (0.03) | 0.35 (0.03) | 0.26 (0.04) | 0.36 (0.02) |
| 34 | aromandendrene | 1445 a,b | 1447 a | 3.25 (0.04) | 3.14 (0.05) | 3.18 (0.05) | 3.28 (0.05) | 3.02 (0.04) | 3.06 (0.05) |
| 35 | selina-5,11-diene | 1447 a,b | 1454 a | 0.47 (0.02) | 0.59 (0.03) | 0.45 (0.03) | 0.42 (0.03) | 0.63 (0.03) | 0.58 (0.05) |
| 36 | dehydroaromadendrene | 1456 c | 1460 c | 1.09 (0.04) | 1.15 (0.02) | 1.01 (0.04) | 0.99 (0.05) | 1.21 (0.03) | 1.23 (0.05) |
| 37 | 1,2,9,10-tetradehydroaristolane | 1461 | ND | 0.47 (0.02) | 0.46 (0.05) | 0.40 (0.02) | 0.43 (0.04) | 0.50 (0.02) | 0.51 (0.04) |
| 38 | 204[M+](15) 91(100) 105(84) | 1465 | ND | 0.39 (0.04) | 0.31 (0.06) | 0.33 (0.03) | 0.30 (0.03) | 0.41 (0.03) | 0.43 (0.03) |
| 39 | 204[M+](18) 128(100) 143(95) | 1469 | ND | 0.32 (0.01) | 0.33 (0.02) | 0.29 (0.04) | 0.26 (0.02) | 0.36 (0.04) | 0.37 (0.05) |
| 40 | γ-gurjunene | 1474 c,d | 1475 c | 0.49 (0.04) | 0.47 (0.04) | 0.45 (0.05) | 0.41 (0.03) | 0.52 (0.02) | 0.55 (0.03) |
| 41 | γ-muurolene | 1477 c | 1478 c | 0.14 (0.02) | 0.16 (0.04) | 0.13 (0.02) | 0.16 (0.02) | 0.19 (0.01) | 0.21 (0.05) |
| 42 | δ-selinene | 1488 c | 1492 c | 1.36 (0.03) | 1.54 (0.02) | 1.29 (0.02) | 1.35 (0.04) | 1.37 (0.04) | 1.29 (0.03) |
| 43 | ledene | 1492 a,b,c | 1496 c | 1.59 (0.04) | 1.65 (0.05) | 1.61 (0.04) | 1.59 (0.04) | 1.55 (0.05) | 1.71 (0.04) |
| 44 | 204[M+](38) 105(100) 93(96) | 1495 | ND | 0.19 (0.01) | 0.31 (0.07) | 0.15 (0.04) | 0.41 (0.05) | 0.17 (0.02) | 0.27 (0.03) |
| 45 | bicyclogermacrene | 1499 a,b,c | 1500 c | 8.41 (0.02) | 8.38 (0.06) | 8.34 (0.06) | 8.43 (0.06) | 8.25 (0.06) | 8.51 (0.05) |
| 46 | 204[M+](19) 93(100) 91(95) | 1505 | ND | 0.09 (0.04) | 0.19 (0.03) | 0.14 (0.02) | 0.19 (0.02) | 0.21 (0.04) | 0.24 (0.05) |
| 47 | 202[M+](25) 133(100) 91(89) | 1509 | ND | 0.21 (0.04) | 0.18 (0.02) | 0.19 (0.04) | 0.15 (0.03) | 0.24 (0.02) | 0.20 (0.03) |
| 48 | 206[M+](14) 191(100) 57(38) | 1514 | ND | 0.26 (0.01) | 0.21 (0.03) | 0.26 (0.03) | 0.17 (0.04) | 0.29 (0.04) | 0.20 (0.03) |
| 49 | 202[M+](33) 131(100) 145(53) | 1518 | ND | 0.18 (0.02) | 0.15 (0.05) | 0.14 (0.03) | 0.21 (0.02) | 0.19 (0.02) | 0.17 (0.02) |
| 50 | δ-cadinene | 1524 a,b,c | 1522 c | 0.33 (0.03) | 0.30 (0.07) | 0.30 (0.02) | 0.32 (0.03) | 0.29 (0.05) | 0.27 (0.05) |
| 51 | 204[M+](5) 91(100) 131(95) | 1530 | ND | 0.09 (0.01) | 0.08 (0.01) | 0.09 (0.01) | 0.11 (0.04) | 0.10 (0.04) | 0.10 (0.03) |
| 52 | 200[M+](54) 185(100) 143(91) | 1535 | ND | 0.17 (0.08) | 0.13 (0.02) | 0.15 (0.05) | 0.16 (0.02) | 0.11 (0.03) | 0.10 (0.04) |
| 53 | 4,5,9,10-dehydro-isolongifolene | 1544 a,b | 1544 a | 6.12 (0.02) | 6.34 (0.04) | 6.34 (0.06) | 6.29 (0.05) | 6.01 (0.07) | 6.40 (0.05) |
| 54 | 202[M+](4) 128(100) 157(95) | 1547 | ND | 0.69 (0.04) | 0.70 (0.04) | 0.69 (0.05) | 0.73 (0.05) | 0.75 (0.05) | 0.69 (0.05) |
| 55 | 200[M+](8) 171(100) 186(79) | 1551 | ND | 0.22 (0.03) | 0.09 (0.02) | 0.23 (0.04) | 0.25 (0.04) | 0.25 (0.04) | 0.14 (0.03) |
| 56 | 200[M+](91) 129(100) 157(88) | 1556 | ND | 0.09 (0.01) | 0.05 (0.01) | 0.11 (0.02) | 0.09 (0.02) | 0.11 (0.03) | 0.15 (0.02) |
| 57 | 204[M+](8) 143(100) 157(98) | 1559 | ND | 0.05 (0.01) | 0.08 (0.01) | 0.04 (0.01) | 0.07 (0.02) | 0.09 (0.02) | 0.11 (0.05) |
| 58 | 204[M+](82) 173(100) 189(94) | 1563 | ND | 1.38 (0.02) | 1.45 (0.02) | 1.41 (0.05) | 1.33 (0.04) | 1.45 (0.05) | 1.41 (0.03) |
| 59 | palustrol | 1567 c | 1567 c | 8.34 (0.02) | 8.16 (0.03) | 8.43 (0.04) | 8.31 (0.04) | 8.14 (0.05) | 8.21 (0.06) |
| 60 | 200[M+](11) 79(100) 93(95) | 1570 | ND | 0.47 (0.04) | 0.82 (0.02) | 0.83 (0.03) | 0.78 (0.03) | 0.74 (0.03) | 0.56 (0.03) |
| 61 | 204[M+](31) 81(100) 109(88) | 1573 | ND | 2.11 (0.11) | 2.04 (0.03) | 2.09 (0.02) | 1.99 (0.02) | 2.02 (0.02) | 1.87 (0.02) |
| 62 | spathulenol | 1576 a,b,c | 1577 c | 7.97 (0.04) | 7.95 (0.04) | 7.93 (0.04) | 7.55 (0.04) | 7.91 (0.06) | 7.44 (0.06) |
| 63 | 200[M+](56) 185(100) 143(63) | 1581 | ND | 3.64 (0.05) | 3.59 (0.04) | 3.60 (0.02) | 3.67 (0.04) | 3.59 (0.04) | 3.57 (0.02) |
| 64 | 202[M+](4) 91(100) 79(82) | 1587 | ND | 0.51 (0.03) | 0.48 (0.05) | 0.55 (0.05) | 0.53 (0.02) | 0.39 (0.02) | 0.51 (0.05) |
| 65 | globulol | 1599 a,b,c,d | 1590 c | 3.14 (0.02) | 3.07 (0.04) | 3.32 (0.03) | 2.97 (0.02) | 3.01 (0.04) | 3.11 (0.04) |
| 66 | 200[M+](8) 198(100) 183(84) | 1605 | ND | 0.24 (0.02) | 0.21 (0.02) | 0.20 (0.04) | 0.23 (0.04) | 0.24 (0.03) | 0.19 (0.02) |
| 67 | 220[M+](2) 145(100) 200(93) | 1609 | ND | 1.22 (0.02) | 1.19 (0.02) | 1.18 (0.04) | 1.11 (0.05) | 1.15 (0.02) | 1.23 (0.05) |
| 68 | (+)-bisabola-2,10-diene[1,9]oxide | 1615 a,b | 1596 a | 0.22 (0.03) | 0.11 (0.03) | 0.14 (0.03) | 0.10 (0.03) | 0.18 (0.03) | 0.24 (0.04) |
| 69 | 208[M+](3) 95(100) 85(95) | 1621 | ND | 0.83 (0.05) | 0.65 (0.04) | 0.89 (0.05) | 0.74 (0.05) | 0.69 (0.04) | 0.81 (0.04) |
| 70 | ledene oxide-(II) | 1631 a,b | 1631 a | 0.22 (0.01) | 0.24 (0.03) | 0.28 (0.02) | 0.19 (0.04) | 0.21 (0.02) | 0.23 (0.05) |
| 71 | isospathulenol | 1635 a,b | 1633 a | 0.61 (0.01) | 0.54 (0.04) | 0.57 (0.02) | 0.63 (0.04) | 0.63 (0.04) | 0.54 (0.03) |
| 72 | 220[M+](18) 91(100) 105(83) | 1639 | ND | 1.59 (0.02) | 1.96 (0.05) | 1.98 (0.03) | 1.87 (0.05) | 1.89 (0.04) | 2.01 (0.02) |
| 73 | cubenol | 1642 a,b,c,d | 1645 c | 0.53 (0.01) | 0.47 (0.03) | 0.54 (0.04) | 0.55 (0.02) | 0.51 (0.04) | 0.55 (0.06) |
| 74 | 220[M+](21) 91(100) 105(82) | 1651 | ND | 0.10 (0.01) | 0.07 (0.02) | 0.11 (0.02) | 0.12 (0.02) | 0.10 (0.03) | 0.09 (0.03) |
| 75 | 222[M+](3) 179(100) 121(92) | 1655 | ND | 0.05 (0.02) | 0.03 (0.01) | 0.01 (0.01) | 0.06 (0.01) | 0.05 (0.02) | 0.03 (0.01) |
| 76 | germacra-4(15),5,10(14)-trien-1-α-ol | 1660c | 1685c | 0.57 (0.04) | 0.61 (0.05) | 0.61(0.01) | 0.59 (0.03) | 0.62 (0.05) | 0.65 (0.05) |
| 77 | 216[M+](31) 145(100) 91(97) | 1699 | ND | 0.41 (0.03) | 0.43 (0.05) | 0.38 (0.02) | 0.40 (0.04) | 0.47 (0.05) | 0.44 (0.04) |
| 78 | 1,4-dimethyl-7-(1-methylethyl)-azulene | 1790 c | 1779 c | 2.75 (0.06) | 2.68 (0.04) | 2.77 (0.04) | 2.75 (0.05) | 2.69 (0.04) | 2.71 (0.03) |
| 79 | 14-hydroxy-δ-cadinene | 1797 c | 1803 c | 0.39 (0.02) | 0.27 (0.03) | 0.29 (0.03) | 0.31 (0.05) | 0.33 (0.03) | 0.27 (0.02) |
| Total | 96.30 (2.51) | 96.65 (2.71) | 96.22 (2.42) | 96.11 (2.64) | 96.39 (2.67) | 96.42 (2.84) | |||
| % identified | 78.15 (1.59) | 78.39 (1.65) | 78.00 (1.33) | 77.35 (1.51) | 77.76 (1.56) | 78.02 (1.72) | |||
| including: | |||||||||
| aliphatics | 2.58 (0.20) | 2.60 (0.29) | 2.58 (0.20) | 2.57 (0.22) | 2.44 (0.28) | 2.35 (0.28) | |||
| aromatics | 3.58 (0.63) | 3.60 (0.26) | 3.62 (0.14) | 3.55 (0.18) | 3.58 (0.19) | 3.52 (0.21) | |||
| monoterpene hydrocarbons | 0.02 (0.01) | 0.03 (0.01) | 0.01 (0.01) | 0.05 (0.01) | 0.03 (0.01) | 0.02 (0.01) | |||
| monoterpenoid hydrocarbons | 0.08 (0.01) | 0.07 (0.01) | 0.07 (0.02) | 0.06 (0.02) | 0.05 (0.01) | 0.08 (0.03) | |||
| sesquiterpene hydrocarbons | 49.90 (0.57) | 50.67 (0.76) | 49.61 (0.70) | 49.92 (0.77) | 50.12 (0.71) | 50.81 (0.78) | |||
| sesquiterpenoid hydrocarbons | 21.99 (0.19) | 21.42 (0.32) | 22.11 (0.26) | 21.20 (0.31) | 21.54 (0.36) | 21.24 (0.41) | |||
| (b) | |||||||||
| No. | Compounds * | RI ** | RI *** | Code **** | |||||
| CI-7 | CI-8 | CI-9 | CI-10 | CI-11 | CI-12 | ||||
| 1 | propan-1-ol | <700 a,b | 483 a | 1.18 (0.03) | 1.12 (0.03) | 1.03 (0.04) | 1.08 (0.03) | 1.19 (0.04) | 0.95 (0.03) |
| 2 | pentanal | 705 a,b,c,d | 704 c | 0.39 (0.04) | 0.26 (0.04) | 0.31 (0.03) | 0.34 (0.04) | 0.36 (0.02) | 0.29 (0.03) |
| 3 | hexanal | 802 a,b,c,d | 801 c | 0.21 (0.03) | 0.16 (0.03) | 0.19 (0.03) | 0.21 (0.02) | 0.20 (0.04) | 0.17 (0.02) |
| 4 | hexan-1-ol | 867 a,b | 869 a | 0.52 (0.04) | 0.53 (0.02) | 0.43 (0.02) | 0.50 (0.04) | 0.52 (0.03) | 0.48 (0.03) |
| 5 | heptanal | 902 a,b,c,d | 901 c | 0.10 (0.02) | 0.03 (0.01) | 0.07 (0.01) | 0.02 (0.01) | 0.04 (0.01) | 0.05 (0.01) |
| 6 | α-pinene | 939 a,b,c | 932 c | 0.05 (0.01) | 0.01 (0.04) | 0.03 (0.01) | 0.04 (0.01) | 0.02 (0.01) | 0.07 (0.01) |
| 7 | benzaldehyde | 940 a,b,c | 952 c | 0.15 (0.03) | 0.23 (0.05) | 0.19 (0.04) | 0.26 (0.02) | 0.16 (0.04) | 0.24 (0.04) |
| 8 | 2-ethylhexan-1-ol | 1023 a,b | 1025 a | 0.07 (0.03) | 0.14 (0.03) | 0.13 (0.05) | 0.07 (0.02) | 0.06 (0.01) | 0.04 (0.01) |
| 9 | phenylmethanol | 1028 a,b,c | 1026 c | 1.07 (0.05) | 1.15 (0.02) | 1.21 (0.03) | 1.04 (0.04) | 1.03 (0.04) | 1.11 (0.03) |
| 10 | phenylacetaldehyde | 1044 a,b | 1044 a | 1.24 (0.04) | 1.14 (0.05) | 1.16 (0.03) | 1.10 (0.04) | 1.16 (0.04) | 1.09 (0.03) |
| 11 | nonanal | 1102 a,b,c,d | 1100 c | 0.09 (0.02) | 0.07 (0.04) | 0.06 (0.02) | 0.15 (0.03) | 0.13 (0.02) | 0.11 (0.02) |
| 12 | 3,4-dimethylcyclohexan-1-ol | 1115 a,b | 1126 a | 0.08 (0.03) | 0.11 (0.03) | 0.13 (0.04) | 0.14 (0.03) | 0.11 (0.03) | 0.09 (0.01) |
| 13 | phenylethanol | 1121 a,b | 1121 a | 0.09 (0.03) | 0.11 (0.05) | 0.12 (0.05) | 0.14 (0.03) | 0.10 (0.04) | 0.11 (0.04) |
| 14 | decanal | 1195 a,b,c,d | 1201 c | 0.09 (0.04) | 0.10 (0.02) | 0.06 (0.04) | 0.04 (0.01) | 0.06 (0.02) | 0.10 (0.04) |
| 15 | β-cyclocitral | 1221 c | 1217 c | 0.04 (0.02) | 0.09 (0.03) | 0.08 (0.02) | 0.11 (0.04) | 0.07 (0.01) | 0.06 (0.02) |
| 16 | 2-phenoxyethan-1-ol | 1225 a,b | 1226 a | 0.89 (0.04) | 0.93 (0.02) | 0.99 (0.06) | 1.01 (0.05) | 0.89 (0.05) | 0.93 (0.03) |
| 17 | bicycloelemene | 1316 a | 1330 a | 0.16 (0.02) | 0.18 (0.05) | 0.14 (0.02) | 0.09 (0.02) | 0.12 (0.04) | 0.11 (0.02) |
| 18 | δ-elemene | 1324 a,b,c | 1335 c | 0.85 (0.03) | 0.79 (0.04) | 0.75 (0.05) | 0.71 (0.05) | 0.69 (0.05) | 0.64 (0.04) |
| 19 | 204[M+](5) 121(100) 93(89) | 1343 | ND | 0.15 (0.03) | 0.16 (0.03) | 0.23 (0.04) | 0.25 (0.04) | 0.16 (0.02) | 0.13 (0.01) |
| 20 | 200[M+](39) 159(100) 117(95) | 1345 | ND | 1.12 (0.02) | 1.16 (0.04) | 0.97 (0.06) | 1.02 (0.03) | 1.05 (0.03) | 0.96 (0.03) |
| 21 | 202[M+](13) 81(100) 96(73) | 1350 | ND | 0.09 (0.01) | 0.15 (0.05) | 0.16 (0.02) | 0.17 (0.03) | 0.14 (0.05) | 0.09 (0.02) |
| 22 | 204[M+](10) 119(100) 91(84) | 1353 | ND | 0.06 (0.02) | 0.09 (0.03) | 0.07 (0.01) | 0.04 (0.01) | 0.03 (0.01) | 0.08 (0.02) |
| 23 | anastreptene | 1370 a | 1370 a | 18.03 (0.06) | 17.92 (0.06) | 17.87 (0.06) | 18.23 (0.06) | 18.14 (0.06) | 18.06 (0.05) |
| 24 | 204[M+](5) 81(100) 93(96) | 1384 | ND | 0.23 (0.04) | 0.17 (0.03) | 0.25 (0.04) | 0.27 (0.02) | 0.17 (0.03) | 0.20 (0.04) |
| 25 | β-elemene | 1391 a,b,c | 1389 c | 2.67 (0.04) | 2.87 (0.03) | 2.75 (0.02) | 2.84 (0.04) | 2.80 (0.05) | 2.77 (0.03) |
| 26 | 204[M+](13) 157(100) 185(84) | 1398 | ND | 0.18 (0.02) | 0.29 (0.05) | 0.35 (0.04) | 0.31 (0.05) | 0.37 (0.04) | 0.21 (0.05) |
| 27 | 204[M+](13) 157(100) 185(84) | 1417 | ND | 0.20 (0.03) | 0.31 (0.06) | 0.30 (0.05) | 0.33 (0.05) | 0.37 (0.03) | 0.28 (0.03) |
| 28 | 204[M+](19) 135(100) 105(82) | 1423 | ND | 0.19 (0.03) | 0.21 (0.03) | 0.27 (0.05) | 0.16 (0.03) | 0.21 (0.05) | 0.23 (0.04) |
| 29 | 204[M+](9) 91(100) 105(93) | 1425 | ND | 0.07 (0.02) | 0.02 (0.01) | 0.04 (0.01) | 0.06 (0.01) | 0.07 (0.02) | 0.02 (0.01) |
| 30 | (-)-aristolene | 1429 a,b,c,d | 1428 a | 0.91 (0.04) | 0.96 (0.05) | 0.99 (0.03) | 1.03 (0.05) | 1.06 (0.05) | 1.11 (0.04) |
| 31 | 204[M+](9) 107(100) 79(43) | 1432 | ND | 0.14 (0.03) | 0.18 (0.05) | 0.21 (0.04) | 0.23 (0.04) | 0.10 (0.04) | 0.13 (0.03) |
| 32 | γ-maaliene | 1435 a,b | 1427 a | 0.45 (0.05) | 0.49 (0.04) | 0.52 (0.03) | 0.54 (0.02) | 0.51 (0.04) | 0.48 (0.05) |
| 33 | α-maaliene | 1443 a,b | 1442 a | 0.30 (0.04) | 0.28 (0.04) | 0.26 (0.02) | 0.36 (0.04) | 0.31 (0.04) | 0.36 (0.02) |
| 34 | aromandendrene | 1445 a,b | 1447 a | 3.09 (0.03) | 3.27 (0.05) | 3.09 (0.04) | 3.12 (0.04) | 3.29 (0.05) | 3.33 (0.04) |
| 35 | selina-5,11-diene | 1447 a,b | 1454 a | 0.56 (0.05) | 0.51 (0.02) | 0.53 (0.04) | 0.63 (0.05) | 0.67 (0.05) | 0.53 (0.05) |
| 36 | dehydroaromadendrene | 1456 c | 1460 c | 1.15 (0.06) | 1.09 (0.04) | 1.22 (0.02) | 1.21 (0.03) | 1.19 (0.03) | 1.11 (0.02) |
| 37 | 1,2,9,10-tetradehydroaristolane | 1461 | ND | 0.49 (0.04) | 0.39 (0.06) | 0.42 (0.04) | 0.45 (0.04) | 0.43 (0.03) | 0.52 (0.04) |
| 38 | 204[M+](15) 91(100) 105(84) | 1465 | ND | 0.45 (0.03) | 0.47 (0.05) | 0.29 (0.03) | 0.27 (0.03) | 0.25 (0.04) | 0.33 (0.03) |
| 39 | 204[M+](18) 128(100) 143(95) | 1469 | ND | 0.30 (0.05) | 0.29 (0.04) | 0.27 (0.03) | 0.30 (0.05) | 0.33 (0.03) | 0.35 (0.03) |
| 40 | γ-gurjunene | 1474 c,d | 1475 c | 0.46 (0.02) | 0.39 (0.04) | 0.55 (0.02) | 0.49 (0.05) | 0.45 (0.05) | 0.53 (0.03) |
| 41 | γ-muurolene | 1477 c | 1478 c | 0.13 (0.03) | 0.11 (0.03) | 0.09 (0.01) | 0.20 (0.03) | 0.18 (0.03) | 0.19 (0.05) |
| 42 | δ-selinene | 1488 c | 1492 c | 1.24 (0.03) | 1.47 (0.04) | 1.58 (0.02) | 1.49 (0.05) | 1.50 (0.02) | 1.56 (0.04) |
| 43 | ledene | 1492 a,b,c | 1496 c | 1.72 (0.03) | 1.66 (0.04) | 1.63 (0.04) | 1.62 (0.06) | 1.54 (0.05) | 1.66 (0.03) |
| 44 | 204[M+](38) 105(100) 93(96) | 1495 | ND | 0.33 (0.04) | 0.34 (0.03) | 0.26 (0.03) | 0.34 (0.02) | 0.27 (0.03) | 0.29 (0.05) |
| 45 | bicyclogermacrene | 1499 a,b,c | 1500 c | 8.43 (0.05) | 8.27 (0.06) | 8.46 (0.06) | 8.32 (0.04) | 8.24 (0.06) | 8.45 (0.06) |
| 46 | 204[M+](19) 93(100) 91(95) | 1505 | ND | 0.18 (0.03) | 0.15 (0.03) | 0.12 (0.02) | 0.23 (0.05) | 0.22 (0.03) | 0.15 (0.03) |
| 47 | 202[M+](25) 133(100) 91(89) | 1509 | ND | 0.16 (0.05) | 0.17 (0.03) | 0.24 (0.03) | 0.25 (0.03) | 0.14 (0.04) | 0.27 (0.03) |
| 48 | 206[M+](14) 191(100) 57(38) | 1514 | ND | 0.22 (0.04) | 0.24 (0.04) | 0.19 (0.05) | 0.17 (0.02) | 0.26 (0.03) | 0.20 (0.02) |
| 49 | 202[M+](33) 131(100) 145(53) | 1518 | ND | 0.19 (0.04) | 0.22 (0.04) | 0.23 (0.02) | 0.21 (0.04) | 0.22 (0.05) | 0.18 (0.04) |
| 50 | δ-cadinene | 1524 a,b,c | 1522 c | 0.35 (0.03) | 0.37 (0.03) | 0.32 (0.03) | 0.24 (0.03) | 0.26 (0.03) | 0.35 (0.05) |
| 51 | 204[M+](5) 91(100) 131(95) | 1530 | ND | 0.09 (0.04) | 0.07 (0.02) | 0.06 (0.04) | 0.12 (0.04) | 0.13 (0.02) | 0.15 (0.03) |
| 52 | 200[M+](54) 185(100) 143(91) | 1535 | ND | 0.12 (0.03) | 0.15 (0.05) | 0.21 (0.05) | 0.14 (0.05) | 0.15 (0.05) | 0.19 (0.05) |
| 53 | 4,5,9,10-dehydro-isolongifolene | 1544 a,b | 1544 a | 6.29 (0.07) | 6.34 (0.07) | 6.21 (0.06) | 6.40 (0.06) | 6.37 (0.06) | 6.39 (0.06) |
| 54 | 202[M+](4) 128(100) 157(95) | 1547 | ND | 0.67 (0.06) | 0.61 (0.05) | 0.64 (0.04) | 0.72 (0.04) | 0.75 (0.05) | 0.64 (0.04) |
| 55 | 200[M+](8) 171(100) 186(79) | 1551 | ND | 0.17 (0.04) | 0.18 (0.03) | 0.20 (0.03) | 0.16 (0.03) | 0.17 (0.03) | 0.19 (0.03) |
| 56 | 200[M+](91) 129(100) 157(88) | 1556 | ND | 0.14 (0.03) | 0.13 (0.04) | 0.08 (0.02) | 0.06 (0.02) | 0.04 (0.01) | 0.07 (0.02) |
| 57 | 204[M+](8) 143(100) 157(98) | 1559 | ND | 0.12 (0.03) | 0.06 (0.01) | 0.07 (0.02) | 0.09 (0.02) | 0.10 (0.05) | 0.12 (0.04) |
| 58 | 204[M+](82) 173(100) 189(94) | 1563 | ND | 1.33 (0.04) | 1.37 (0.05) | 1.47 (0.04) | 1.40 (0.04) | 1.48 (0.03) | 1.51 (0.04) |
| 59 | palustrol | 1567 c | 1567 c | 8.26 (0.03) | 8.46 (0.06) | 8.41 (0.06) | 8.38 (0.06) | 8.29 (0.06) | 8.27 (0.06) |
| 60 | 200[M+](11) 79(100) 93(95) | 1570 | ND | 0.85 (0.05) | 0.76 (0.04) | 0.77 (0.03) | 0.48 (0.03) | 0.55 (0.04) | 0.90 (0.05) |
| 61 | 204[M+](31) 81(100) 109(88) | 1573 | ND | 2.08 (0.04) | 2.11 (0.04) | 1.98 (0.04) | 1.96 (0.05) | 2.04 (0.05) | 2.11 (0.02) |
| 62 | spathulenol | 1576 a,b,c | 1577 c | 7.65 (0.05) | 7.81 (0.06) | 7.78 (0.07) | 7.69 (0.06) | 7.21 (0.03) | 7.54 (0.05) |
| 63 | 200[M+](56) 185(100) 143(63) | 1581 | ND | 3.67 (0.02) | 3.50 (0.06) | 3.71 (0.04) | 3.60 (0.05) | 3.54 (0.05) | 3.68 (0.05) |
| 64 | 202[M+](4) 91(100) 79(82) | 1587 | ND | 0.56 (0.04) | 0.41 (0.03) | 0.43 (0.03) | 0.52 (0.04) | 0.49 (0.05) | 0.47 (0.02) |
| 65 | globulol | 1599 a,b,c,d | 1590 c | 3.04 (0.05) | 3.11 (0.02) | 2.87 (0.04) | 2.93 (0.04) | 2.94 (0.04) | 3.13 (0.05) |
| 66 | 200[M+](8) 198(100) 183(84) | 1605 | ND | 0.27 (0.03) | 0.30 (0.05) | 0.19 (0.03) | 0.17 (0.03) | 0.24 (0.03) | 0.29 (0.03) |
| 67 | 220[M+](2) 145(100) 200(93) | 1609 | ND | 1.18 (0.02) | 1.14 (0.04) | 1.26 (0.04) | 1.31 (0.02) | 1.18 (0.03) | 1.23 (0.05) |
| 68 | (+)-bisabola-2,10-diene [1,9]oxide | 1615 a,b | 1596 a | 0.21 (0.04) | 0.22 (0.03) | 0.12 (0.03) | 0.15 (0.03) | 0.18 (0.03) | 0.20 (0.02) |
| 69 | 208[M+](3) 95(100) 85(95) | 1621 | ND | 0.80 (0.03) | 0.79 (0.05) | 0.71 (0.02) | 0.66 (0.05) | 0.73 (0.05) | 0.74 (0.40) |
| 70 | ledene oxide-(II) | 1631 a,b | 1631 a | 0.24 (0.02) | 0.19 (0.03) | 0.20 (0.03) | 0.23 (0.04) | 0.24 (0.03) | 0.29 (0.03) |
| 71 | isospathulenol | 1635 a,b | 1633 a | 0.59 (0.04) | 0.51 (0.05) | 0.49 (0.04) | 0.53 (0.05) | 0.64 (0.05) | 0.59 (0.04) |
| 72 | 220[M+](18) 91(100) 105(83) | 1639 | ND | 1.91 (0.02) | 1.67 (0.05) | 1.74 (0.05) | 1.86 (0.03) | 1.99 (0.03) | 2.01 (0.05) |
| 73 | cubenol | 1642 a,b,c,d | 1645 c | 0.47 (0.04) | 0.39 (0.03) | 0.41 (0.03) | 0.44 (0.05) | 0.49 (0.03) | 0.40 (0.04) |
| 74 | 220[M+](21) 91(100) 105(82) | 1651 | ND | 0.07 (0.03) | 0.06 (0.02) | 0.12 (0.02) | 0.10 (0.03) | 0.11 (0.02) | 0.09 (0.02) |
| 75 | 222[M+](3) 179(100) 121(92) | 1655 | ND | 0.07 (0.01) | 0.02 (0.01) | 0.01 (0.01) | 0.02 (0.01) | 0.01 (0.01) | 0.04 (0.01) |
| 76 | germacra-4(15),5,10(14)-trien-1-α-ol | 1660 c | 1685 c | 0.47 (0.02) | 0.51 (0.05) | 0.60 (0.03) | 0.57 (0.05) | 0.63 (0.03) | 0.59 (0.04) |
| 77 | 216[M+](31) 145(100) 91(97) | 1699 | ND | 0.39 (0.06) | 0.45 (0.04) | 0.51 (0.04) | 0.43 (0.03) | 0.46 (0.05) | 0.39 (0.04) |
| 78 | 1,4-dimethyl-7-(1-methylethyl)-azulene | 1790 c | 1779 c | 2.74 (0.02) | 2.62 (0.06) | 2.71 (0.03) | 2.59 (0.05) | 2.63 (0.02) | 2.75 (0.04) |
| 79 | 14-hydroxy-δ-cadinene | 1797 c | 1803 c | 0.25 (0.01) | 0.34 (0.03) | 0.40 (0.02) | 0.42 (0.02) | 0.39 (0.05) | 0.39 (0.05) |
| Total | 96.21 (2.69) | 96.10 (3.04) | 96.17 (2.67) | 96.56 (2.83) | 96.01 (2.83) | 97.11 (3.04) | |||
| % identified | 77.46 (1.54) | 77.70 (1.72) | 77.56 (1.51) | 78.15 (1.67) | 77.49 (1.61) | 78.19 (1.54) | |||
| including: | |||||||||
| aliphatics | 2.73 (0.28) | 2.52 (0.25) | 2.41 (0.28) | 2.55 (0.23) | 2.67 (0.22) | 2.28 (0.20) | |||
| aromatics | 3.44 (0.19) | 3.56 (0.19) | 3.67 (0.21) | 3.55 (0.18) | 3.34 (0.21) | 3.48 (0.17) | |||
| monoterpene hydrocarbons | 0.05 (0.01) | 0.01 (0.04) | 0.03 (0.01) | 0.04 (0.01) | 0.02 (0.01) | 0.07 (0.01) | |||
| monoterpenoid hydrocarbons | 0.04 (0.02) | 0.09 (0.03) | 0.08 (0.02) | 0.11 (0.04) | 0.07 (0.01) | 0.06 (0.02) | |||
| sesquiterpene hydrocarbons | 50.02 (0.74) | 49.98 (0.85) | 50.09 (064) | 50.56 (0.81) | 50.38 (0.81) | 50.90 (0.76) | |||
| sesquiterpenoid hydrocarbons | 21.18 (0.30) | 21.54 (0.36) | 21.28 (0.35) | 21.34 (0.40) | 21.01 (0.35) | 21.40 (0.38) | |||
| (a) | |||||||||
|---|---|---|---|---|---|---|---|---|---|
| No. | Compounds * | RI ** | RI *** | Code **** | |||||
| CI-13 | CI-14 | CI-15 | CI-16 | CI-17 | CI-18 | ||||
| 1 | propan-1-ol | <700 a,b | 483 a | 0.43 (0.03) | 0.39 (0.03) | 0.35 (0.04) | 0.48 (0.04) | 0.31 (0.04) | 0.29 (0.05) |
| 2 | pentanal | 705 a,b,c,d | 704 c | 0.32 (0.04) | 0.28 (0.05) | 0.29 (0.02) | 0.33 (0.02) | 0.35 (0.02) | 0.29 (0.01) |
| 3 | hexanal | 802 a,b,c,d | 801 c | 0.08 (0.02) | 0.07 (0.01) | 0.05 (0.01) | 0.09 (0.01) | 0.06 (0.01) | 0.05 (0.03) |
| 4 | hexan-1-ol | 867 a,b | 869 a | 0.33 (0.04) | 0.33 (0.03) | 0.29 (0.03) | 0.31 (0.03) | 0.32 (0.03) | 0.33 (0.01) |
| 5 | heptanal | 902 a,b,c,d | 901 c | 0.05 (0.03) | 0.04 (0.01) | 0.05 (0.01) | 0.04 (0.01) | 0.03 (0.01) | 0.05 (0.01) |
| 6 | α-pinene | 939 a,b,c | 932 c | 0.02 (0.01) | 0.02 (0.01) | 0.01 (0.01) | 0.02 (0.01) | 0.02 (0.01) | 0.03 (0.01) |
| 7 | benzaldehyde | 940 a,b,c | 952 c | 0.10 (0.04) | 0.07 (0.01) | 0.06 (0.02) | 0.09 (0.02) | 0.12 (0.03) | 0.08 (0.01) |
| 8 | 2-ethylhexan-1-ol | 1023 a,b | 1025 a | 0.04 (0.02) | 0.04 (0.01) | 0.03 (0.01) | 0.02 (0.01) | 0.04 (0.03) | 0.05 (0.01) |
| 9 | phenylmethanol | 1028 a,b,c | 1026 c | 1.06 (0.04) | 1.08 (0.03) | 0.98 (0.05) | 1.01 (0.04) | 1.03 (0.01) | 1.09 (0.02) |
| 10 | phenylacetaldehyde | 1044 a,b | 1044 a | 0.21 (0.04) | 0.22 (0.03) | 0.20 (0.04) | 0.18 (0.04) | 0.19 (0.03) | 0.21 (0.04) |
| 11 | nonanal | 1102 a,b,c,d | 1100 c | 0.02 (0.01) | 0.02 (0.01) | 0.01 (0.01) | 0.01 (0.00) | 0.02 (0.01) | 0.03 (0.01) |
| 12 | 3,4-dimethylcyclohexan-1-ol | 1115 a,b | 1126 a | 0.05 (0.01) | 0.01 (0.01) | 0.03 (0.01) | 0.02 (0.01) | 0.01 (0.01) | 0.02 (0.01) |
| 13 | phenylethanol | 1121 a,b | 1121 a | 0.69 (0.05) | 0.67 (0.04) | 0.71 (0.05) | 0.68 (0.05) | 0.69 (0.04) | 0.65 (0.05) |
| 14 | decanal | 1195 a,b,c,d | 1201c | 0.02 (0.01) | 0.03 (0.01) | 0.01 (0.00) | 0.02 (0.01) | 0.03 (0.01) | 0.04 (0.01) |
| 15 | β-cyclocitral | 1221 c | 1217c | 0.04 (0.01) | 0.05 (0.01) | 0.04 (0.01) | 0.03 (0.01) | 0.05 (0.01) | 0.03 (0.01) |
| 16 | 2-phenoxyethan-1-ol | 1225 a,b | 1226 a | 0.41 (0.05) | 0.38 (0.04) | 0.45 (0.05) | 0.41 (0.05) | 0.42 (0.04) | 0.43 (0.03) |
| 17 | bicycloelemene | 1316 a | 1330 a | 0.08 (0.01) | 0.09 (0.02) | 0.09 (0.03) | 0.07 (0.03) | 0.08 (0.01) | 0.06 (0.01) |
| 18 | δ-elemene | 1324 a,b,c | 1335 c | 1.31 (0.05) | 2.26 (0.04) | 1.89 (0.03) | 1.89 (0.04) | 1.97 (0.06) | 2.01 (0.06) |
| 19 | 204[M+](5) 121(100) 93(89) | 1343 | ND | 0.37 (0.04) | 0.45 (0.04) | 0.36 (0.02) | 0.33 (0.03) | 0.51 (0.02) | 0.47 (0.02) |
| 20 | 200[M+](39) 159(100) 117(95) | 1345 | ND | 0.88 (0.05) | 0.49 (0.03) | 0.64 (0.03) | 0.55 (0.04) | 0.91 (0.04) | 0.67 (0.04) |
| 21 | 202[M+](13) 81(100) 96(73) | 1350 | ND | 0.16 (0.02) | 0.21 (0.05) | 0.18 (0.04) | 0.20 (0.05) | 0.22 (0.03) | 0.23 (0.03) |
| 22 | 204[M+](10) 119(100) 91(84) | 1353 | ND | 0.07 (0.01) | 0.06 (0.02) | 0.05 (0.01) | 0.08 (0.02) | 0.06 (0.01) | 0.04 (0.03) |
| 23 | anastreptene | 1370 a | 1370 a | 25.33 (0.05) | 25.26 (0.06) | 25.21 (0.06) | 25.33 (0.06) | 25.06 (0.05) | 25.12 (0.06) |
| 24 | 204[M+](5) 81(100) 93(96) | 1384 | ND | 0.16 (0.05) | 0.12 (0.04) | 0.12 (0.02) | 0.13 (0.02) | 0.15 (0.02) | 0.17 (0.04) |
| 25 | β-elemene | 1391 a,b,c | 1389 c | 2.58 (0.03) | 1.85 (0.02) | 2.01 (0.04) | 1.98 (0.04) | 2.38 (0.04) | 2.47 (0.05) |
| 26 | 204[M+](13) 157(100) 185(84) | 1398 | ND | 0.27 (0.02) | 0.18 (0.04) | 0.19 (0.03) | 0.20 (0.03) | 0.22 (0.03) | 0.25 (0.02) |
| 27 | 204[M+](13) 157(100) 185(84) | 1417 | ND | 0.21 (0.06) | 0.28 (0.03) | 0.21 (0.03) | 0.23 (0.03) | 0.29 (0.03) | 0.27 (0.06) |
| 28 | 204[M+](19) 135(100) 105(82) | 1423 | ND | 0.23 (0.02) | 0.35 (0.04) | 0.37 (0.02) | 0.25 (0.05) | 0.26 (0.05) | 0.27 (0.02) |
| 29 | 204[M+](9) 91(100) 105(93) | 1425 | ND | 0.08 (0.02) | 0.08 (0.01) | 0.07 (0.02) | 0.06 (0.02) | 0.09 (0.02) | 0.11 (0.04) |
| 30 | (-)-aristolene | 1429 a,b,c,d | 1428 a | 0.75 (0.04) | 0.71 (0.04) | 0.77 (0.05) | 0.76 (0.05) | 0.69 (0.04) | 0.67 (0.05) |
| 31 | 204[M+](9) 107(100) 79(43) | 1432 | ND | 0.19 (0.04) | 0.26 (0.03) | 0.20 (0.03) | 0.21 (0.04) | 0.25 (0.03) | 0.17 (0.03) |
| 32 | γ-maaliene | 1435 a,b | 1427 a | 0.40 (0.03) | 0.59 (0.04) | 0.41 (0.04) | 0.39 (0.04) | 0.37 (0.04) | 0.47 (0.04) |
| 33 | α-maaliene | 1443 a,b | 1442 a | 0.29 (0.02) | 0.53 (0.03) | 0.35 (0.04) | 0.47 (0.04) | 0.44 (0.05) | 0.51 (0.04) |
| 34 | aromandendrene | 1445 a,b | 1447 a | 6.23 (0.05) | 7.87 (0.04) | 5.17 (0.04) | 7.45 (0.03) | 7.54 (0.06) | 6.96 (0.04) |
| 35 | selina-5,11-diene | 1447 a,b | 1454 a | 0.54 (0.05) | 0.87 (0.03) | 0.64 (0.03) | 0.77 (0.02) | 0.81 (0.03) | 0.79 (0.04) |
| 36 | dehydroaromadendrene | 1456 c | 1460 c | 1.44 (0.02) | 1.55 (0.02) | 1.47 (0.02) | 1.51 (0.04) | 1.38 (0.02) | 1.56 (0.03) |
| 37 | 1,2,9,10-tetradehydroaristolane | 1461 | ND | 1.31 (0.04) | 0.92 (0.04) | 1.21 (0.04) | 1.08 (0.05) | 1.11 (0.04) | 1.23 (0.03) |
| 38 | 204[M+](15) 91(100) 105(84) | 1465 | ND | 0.32 (0.03) | 0.39 (0.02) | 0.30 (0.04) | 0.29 (0.05) | 0.41 (0.04) | 0.35 (0.04) |
| 39 | 204[M+](18) 128(100) 143(95) | 1469 | ND | 0.41 (0.03) | 0.25 (0.04) | 0.39 (0.04) | 0.38 (0.04) | 0.34 (0.02) | 0.44 (0.02) |
| 40 | γ-gurjunene | 1474 c,d | 1475 c | 0.43 (0.04) | 0.46 (0.02) | 0.40 (0.02) | 0.45 (0.03) | 0.39 (0.05) | 0.47 (0.04) |
| 41 | γ-muurolene | 1477 c | 1478 c | 0.22 (0.06) | 0.24 (0.05) | 0.18 (0.04) | 0.16 (0.03) | 0.27 (0.04) | 0.21 (0.04) |
| 42 | δ-selinene | 1488 c | 1492 c | 2.14 (0.05) | 2.21 (0.04) | 2.01 (0.03) | 2.25 (0.04) | 2.19 (0.03) | 2.20 (0.03) |
| 43 | ledene | 1492 a,b,c | 1496 c | 1.97 (0.03) | 2.08 (0.03) | 2.00 (0.04) | 2.01 (0.03) | 2.10 (0.02) | 2.03 (0.02) |
| 44 | 204[M+](38) 105(100) 93(96) | 1495 | ND | 0.23 (0.02) | 0.10 (0.02) | 0.25 (0.04) | 0.18 (0.03) | 0.15 (0.02) | 0.27 (0.05) |
| 45 | bicyclogermacrene | 1499 a,b,c | 1500 c | 17.62 (0.03) | 18.09 (0.05) | 17.72 (0.06) | 16.78 (0.05) | 16.89 (0.01) | 16.45 (0.05) |
| 46 | 204[M+](19) 93(100) 91(95) | 1505 | ND | 0.20 (0.04) | 0.64 (0.06) | 0.41 (0.02) | 0.23 (0.04) | 0.57 (0.03) | 0.44 (0.03) |
| 47 | 202[M+](25) 133(100) 91(89) | 1509 | ND | 0.07 (0.03) | 0.14 (0.05) | 0.08 (0.01) | 0.10 (0.03) | 0.12 (0.03) | 0.18 (0.03) |
| 48 | 206[M+](14) 191(100) 57(38) | 1514 | ND | 0.10 (0.02) | 0.29 (0.03) | 0.12 (0.03) | 0.15 (0.03) | 0.33 (0.04) | 0.18 (0.04) |
| 49 | 202[M+](33) 131(100) 145(53) | 1518 | ND | 0.42 (0.04) | 0.38 (0.05) | 0.41 (0.03) | 0.37 (0.04) | 0.35 (0.03) | 0.47 (0.04) |
| 50 | δ-cadinene | 1524 a,b,c | 1522 c | 0.09 (0.01) | 0.14 (0.03) | 0.10 (0.04) | 0.15 (0.04) | 0.12 (0.04) | 0.08 (0.02) |
| 51 | 204[M+](5) 91(100) 131(95) | 1530 | ND | 0.19 (0.04) | 0.11 (0.02) | 0.16 (0.04) | 0.20 (0.02) | 0.21 (0.04) | 0.14 (0.03) |
| 52 | 200[M+](54) 185(100) 143(91) | 1535 | ND | - | - | - | - | - | - |
| 53 | 4,5,9,10-dehydro-isolongifolene | 1544 a,b | 1544 a | 4.89 (0.04) | 4.14 (0.03) | 4.79 (0.03) | 4.38 (0.04) | 4.56 (0.02) | 4.78 (0.03) |
| 54 | 202[M+](4) 128(100) 157(95) | 1547 | ND | 0.81 (0.03) | 0.69 (0.03) | 0.79 (0.02) | 0.71 (0.03) | 0.65 (0.03) | 0.83 (0.02) |
| 55 | 200[M+](8) 171(100) 186(79) | 1551 | ND | 0.07 (0.02) | 0.10 (0.02) | 0.06 (0.03) | 0.09 (0.02) | 0.11 (0.04) | 0.06 (0.01) |
| 56 | 200[M+](91) 129(100) 157(88) | 1556 | ND | 0.08 (0.02) | 0.05 (0.01) | 0.07 (0.01) | 0.08 (0.02) | 0.06 (0.01) | 0.04 (0.01) |
| 57 | 204[M+](8) 143(100) 157(98) | 1559 | ND | 0.06 (0.02) | 0.04 (0.01) | 0.02 (0.04) | 0.03 (0.02) | 0.05 (0.01) | 0.07 (0.01) |
| 58 | 204[M+](82) 173(100) 189(94) | 1563 | ND | 1.23 (0.05) | 1.21 (0.04) | 1.18 (0.04) | 1.22 (0.05) | 1.24 (0.03) | 1.19 (0.04) |
| 59 | palustrol | 1567 c | 1567 c | 5.11 (0.02) | 5.58 (0.04) | 5.48 (0.03) | 5.34 (0.04) | 5.37 (0.03) | 5.27 (0.06) |
| 60 | 200[M+](11) 79(100) 93(95) | 1570 | ND | 0.64 (0.04) | 0.37 (0.03) | 0.55 (0.03) | 0.47 (0.04) | 0.59 (0.04) | 0.62 (0.03) |
| 61 | 204[M+](31) 81(100) 109(88) | 1573 | ND | 2.36 (0.02) | 1.43 (0.03) | 2.11 (0.04) | 2.21 (0.02) | 1.89 (0.04) | 1.89 (0.03) |
| 62 | spathulenol | 1576 a,b,c | 1577 c | 2.59 (0.05) | 2.75 (0.04) | 2.63 (0.04) | 2.71 (0.03) | 2.65 (0.06) | 2.57 (0.04) |
| 63 | 200[M+](56) 185(100) 143(63) | 1581 | ND | 2.39 (0.05) | 2.60 (0.06) | 2.47 (0.03) | 2.41 (0.03) | 2.46 (0.03) | 2.53 (0.03) |
| 64 | 202[M+](4) 91(100) 79(82) | 1587 | ND | 0.28 (0.02) | 0.35 (0.03) | 0.33 (0.02) | 0.29 (0.04) | 0.31 (0.03) | 0.34 (0.02) |
| 65 | globulol | 1599 a,b,c,d | 1590 c | 1.52 (0.04) | 1.07 (0.03) | 1.43 (0.04) | 1.37 (0.06) | 1.37 (0.04) | 1.29 (0.03) |
| 66 | 200[M+](8) 198(100) 183(84) | 1605 | ND | - | - | - | - | - | - |
| 67 | 220[M+](2) 145(100) 200(93) | 1609 | ND | 0.09 (0.01) | 0.09 (0.02) | 0.09 (0.04) | 0.08 (0.02) | 0.10 (0.04) | 0.07 (0.01) |
| 68 | (+)-bisabola-2,10-diene[1,9]oxide | 1615 a,b | 1596 a | 0.30 (0.04) | 0.29 (0.04) | 0.33 (0.02) | 0.27 (0.02) | 0.28 (0.03) | 0.31 (0.04) |
| 69 | 208[M+](3) 95(100) 85(95) | 1621 | ND | 0.72 (0.03) | 0.11 (0.03) | 0.68 (0.03) | 0.57 (0.03) | 0.49 (0.02) | 0.57 (0.04) |
| 70 | ledene oxide-(II) | 1631 a,b | 1631 a | - | - | - | - | - | - |
| 71 | isospathulenol | 1635 a,b | 1633 a | 0.33 (0.05) | 0.37 (0.04) | 0.36 (0.05) | 0.30 (0.04) | 0.41 (0.02) | 0.35 (0.03) |
| 72 | 220[M+](18) 91(100) 105(83) | 1639 | ND | 0.77 (0.03) | 0.75 (0.05) | 0.77 (0.03) | 0.73 (0.05) | 0.70 (0.04) | 0.69 (0.03) |
| 73 | cubenol | 1642 a,b,c,d | 1645 c | 0.10 (0.02) | 0.05 (0.01) | 0.07 (0.02) | 0.09 (0.01) | 0.05 (0.01) | 0.04 (0.01) |
| 74 | 220[M+](21) 91(100) 105(82) | 1651 | ND | 0.05 (0.02) | 0.03 (0.01) | 0.06 (0.01) | 0.04 (0.01) | 0.03 (0.01) | 0.02 (0.01) |
| 75 | 222[M+](3) 179(100) 121(92) | 1655 | ND | 0.05 (0.02) | 0.05 (0.01) | 0.05 (0.01) | 0.04 (0.01) | 0.03 (0.01) | 0.06 (0.02) |
| 76 | germacra-4(15),5,10(14)-trien-1-α-ol | 1660 c | 1685 c | 0.88 (0.05) | 0.90 (0.05) | 0.89 (0.05) | 0.91 (0.04) | 0.85 (0.05) | 0.87 (0.03) |
| 77 | 216[M+](31) 145(100) 91(97) | 1699 | ND | 0.15 (0.05) | 0.23 (0.06) | 0.16 (0.05) | 0.19 (0.03) | 0.25 (0.03) | 0.20 (0.04) |
| 78 | 1,4-dimethyl-7-(1-methylethyl)-azulene | 1790 c | 1779 c | 1.06 (0.06) | 1.33 (0.05) | 1.21 (0.03) | 1.23 (0.02) | 1.27 (0.04) | 1.30 (0.05) |
| 79 | 14-hydroxy-δ-cadinene | 1797 c | 1803 c | 0.19 (0.03) | 0.02 (0.01) | 0.18 (0.04) | 0.15 (0.02) | 0.10 (0.02) | 0.12 (0.01) |
| Total | 97.88 (2.47) | 98.80 (2.34) | 96.46 (2.30) | 97.29 (2.37) | 98.79 (2.23) | 98.16 (2.26) | |||
| % identified | 83.57 (1.46) | 85.92 (1.28) | 82.56 (1.37) | 83.99 (1.34) | 84.39 (1.29) | 83.86 (1.30) | |||
| including: | |||||||||
| aliphatics | 1.34 (0.21) | 1.21 (0.17) | 1.11 (0.14) | 1.32 (0.14) | 1.17 (0.17) | 1.15 (0.15) | |||
| aromatics | 2.47 (0.22) | 2.42 (0.15) | 2.40 (0.21) | 2.37 (0.20) | 2.45 (0.15) | 2.46 (0.15) | |||
| monoterpene hydrocarbons | 0.02 (0.01) | 0.02 (0.01) | 0.01 (0.01) | 0.02 (0.01) | 0.02 (0.01) | 0.03 (0.01) | |||
| monoterpenoid hydrocarbons | 0.04 (0.01) | 0.05 (0.01) | 0.04 (0.01) | 0.03 (0.01) | 0.05 (0.01) | 0.03 (0.01) | |||
| sesquiterpene hydrocarbons | 68.68 (0.71) | 71.19 (0.68) | 67.63 (0.71) | 69.11 (0.72) | 69.62 (0.69) | 69.37 (0.73) | |||
| sesquiterpenoid hydrocarbons | 11.02 (0.30) | 11.03 (0.26) | 11.37 (0.29) | 11.14 (0.26) | 11.08 (0.26) | 10.82 (0.25) | |||
| (b) | |||||||||
| No. | Compounds * | RI ** | RI *** | Code **** | |||||
| CI-19 | CI-20 | CI-21 | CI-22 | CI-23 | CI-24 | ||||
| 1 | propan-1-ol | <700 a,b | 483 a | 0.44 (0.03) | 0.46 (0.03) | 0.36 (0.03) | 0.38 (0.03) | 0.42 (0.03) | 0.44 (0.02) |
| 2 | pentanal | 705 a,b,c,d | 704 c | 0.27 (0.01) | 0.26 (0.01) | 0.31 (0.05) | 0.34 (0.01) | 0.33 (0.04) | 0.30 (0.04) |
| 3 | hexanal | 802 a,b,c,d | 801 c | 0.04 (0.01) | 0.06 (0.01) | 0.07 (0.01) | 0.09 (0.01) | 0.08 (0.01) | 0.09 (0.02) |
| 4 | hexan-1-ol | 867 a,b | 869 a | 0.35 (0.04) | 0.29 (0.04) | 0.31 (0.03) | 0.32 (0.02) | 0.34 (0.04) | 0.35 (0.03) |
| 5 | heptanal | 902 a,b,c,d | 901 c | 0.04 (0.01) | 0.06 (0.01) | 0.03 (0.01) | 0.04 (0.01) | 0.05 (0.01) | 0.04 (0.01) |
| 6 | α-pinene | 939 a,b,c | 932 c | 0.01 (0.01) | 0.01 (0.01) | 0. 01 (0.01) | 0.02 (0.04) | 0.03 (0.01) | 0.04 (0.01) |
| 7 | benzaldehyde | 940 a,b,c | 952 c | 0.06 (0.01) | 0.08 (0.04) | 0.11 (0.01) | 0.12 (0.04) | 0.10 (0.02) | 0.09 (0.02) |
| 8 | 2-ethylhexan-1-ol | 1023 a,b | 1025 a | 0.03 (0.01) | 0.02 (0.01) | 0.03 (0.01) | 0.04 (0.01) | 0.04 (0.01) | 0.05 (0.01) |
| 9 | phenylmethanol | 1028 a,b,c | 1026 c | 1.11 (0.03) | 0.96 (0.04) | 0.96 (0.03) | 1.02 (0.03) | 1.01 (0.04) | 1.07 (0.03) |
| 10 | phenylacetaldehyde | 1044 a,b | 1044 a | 0.23 (0.04) | 0.25 (0.03) | 0.19 (0.03) | 0.18 (0.01) | 0.20 (0.03) | 0.23 (0.03) |
| 11 | nonanal | 1102 a,b,c,d | 1100 c | 0.02 (0.01) | 0.01 (0.01) | 0.02 (0.01) | 0.03 (0.01) | 0.02 (0.01) | 0.01 (0.01) |
| 12 | 3,4-dimethylcyclohexan-1-ol | 1115 a,b | 1126 a | 0.03 (0.01) | 0.05 (0.01) | 0.04 (0.01) | 0.06 (0.03) | 0.03 (0.01) | 0.04 (0.01) |
| 13 | phenylethanol | 1121 a,b | 1121 a | 0.64 (0.03) | 0.63 (0.02) | 0.71 (0.02) | 0.72 (0.03) | 0.75 (0.02) | 0.74 (0.04) |
| 14 | decanal | 1195 a,b,c,d | 1201 c | 0.05 (0.01) | 0.06 (0.01) | 0.03 (0.01) | 0.02 (0.01) | 0.01 (0.01) | 0.02 (0.01) |
| 15 | β-cyclocitral | 1221 c | 1217 c | 0.02 (0.01) | 0.04 (0.01) | 0.05 (0.01) | 0.03 (0.03) | 0.02 (0.01) | 0.06 (0.01) |
| 16 | 2-phenoxyethan-1-ol | 1225 a,b | 1226 a | 0.37 (0.04) | 0.38 (0.04) | 0.39 (0.04) | 0.40 (0.01) | 0.43 (0.04) | 0.42 (0.02) |
| 17 | bicycloelemene | 1316 a | 1330 a | 0.09 (0.01) | 0.10 (0.01) | 0.06 (0.01) | 0.07 (0.01) | 0.08 (0.02) | 0.09 (0.01) |
| 18 | δ-elemene | 1324 a,b,c | 1335 c | 2.13 (0.05) | 2.22 (0.03) | 2.18 (0.05) | 2.09 (0.01) | 2.04 (0.03) | 1.76 (0.05) |
| 19 | 204[M+](5) 121(100) 93(89) | 1343 | ND | 0.42 (0.04) | 0.44 (0.03) | 0.46 (0.01) | 0.39 (0.03) | 0.41 (0.02) | 0.45 (0.03) |
| 20 | 200[M+](39) 159(100) 117(95) | 1345 | ND | 0.74 (0.02) | 0.81 (0.01) | 0.80 (0.01) | 0.71 (0.01) | 0.73 (0.04) | 0.75 (0.03) |
| 21 | 202[M+](13) 81(100) 96(73) | 1350 | ND | 0.19 (0.04) | 0.17 (0.05) | 0.20 (0.03) | 0.21 (0.06) | 0.24 (0.05) | 0.18 (0.04) |
| 22 | 204[M+](10) 119(100) 91(84) | 1353 | ND | 0.08 (0.02) | 0.09 (0.02) | 0.10 (0.01) | 0.08 (0.02) | 0.06 (0.01) | 0.05 (0.04) |
| 23 | anastreptene | 1370 a | 1370 a | 25.41 (0.06) | 25.32 (0.06) | 25.29 (0.06) | 25.30 (0.04) | 25.24 (0.04) | 25.26 (0.02) |
| 24 | 204[M+](5) 81(100) 93(96) | 1384 | ND | 0.13 (0.02) | 0.14 (0.02) | 0.15 (0.02) | 0.18 (0.03) | 0.20 (0.03) | 0.21 (0.03) |
| 25 | β-elemene | 1391 a,b,c | 1389 c | 2.46 (0.04) | 2.38 (0.04) | 2.21 (0.04) | 2.18 (0.03) | 1.99 (0.03) | 2.01 (0.04) |
| 26 | 204[M+](13) 157(100) 185(84) | 1398 | ND | 0.24 (0.03) | 0.19 (0.05) | 0.20 (0.03) | 0.22 (0.06) | 0.24 (0.04) | 0.22 (0.03) |
| 27 | 204[M+](13) 157(100) 185(84) | 1417 | ND | 0.25 (0.03) | 0.27 (0.03) | 0.26 (0.03) | 0.24 (0.02) | 0.26 (0.03) | 0.27 (0.02) |
| 28 | 204[M+](19) 135(100) 105(82) | 1423 | ND | 0.33 (0.05) | 0.36 (0.01) | 0.31 (0.06) | 0.30 (0.04) | 0.29 (0.03) | 0.27 (0.01) |
| 29 | 204[M+](9) 91(100) 105(93) | 1425 | ND | 0.12 (0.02) | 0.08 (0.02) | 0.09 (0.02) | 0.07 (0.01) | 0.06 (0.01) | 0.10 (0.01) |
| 30 | (-)-aristolene | 1429 a,b,c,d | 1428 a | 0.65 (0.04) | 0.63 (0.01) | 0.76 (0.04) | 0.77 (0.05) | 0.80 (0.02) | 0.73 (0.01) |
| 31 | 204[M+](9) 107(100) 79(43) | 1432 | ND | 0.21 (0.03) | 0.26 (0.05) | 0.27 (0.03) | 0.30 (0.02) | 0.31 (0.04) | 0.27 (0.04) |
| 32 | γ-maaliene | 1435 a,b | 1427 a | 0.52 (0.06) | 0.55 (0.04) | 0.57 (0.03) | 0.61 (0.06) | 0.54 (0.03) | 0.56 (0.06) |
| 33 | α-maaliene | 1443 a,b | 1442 a | 0.35 (0.03) | 0.34 (0.02) | 0.33 (0.05) | 0.34 (0.02) | 0.47 (0.03) | 0.49 (0.03) |
| 34 | aromandendrene | 1445 a,b | 1447 a | 6.87 (0.02) | 6.78 (0.04) | 7.21 (0.03) | 7.44 (0.04) | 6.45 (0.05) | 7.54 (0.03) |
| 35 | selina-5,11-diene | 1447 a,b | 1454 a | 0.63 (0.04) | 0.67 (0.02) | 0.72 (0.04) | 0.75 (0.05) | 0.81 (0.02) | 0.76 (0.04) |
| 36 | dehydroaromadendrene | 1456c | 1460 c | 1.49 (0.04) | 1.39 (0.06) | 1.40 (0.03) | 1.61 (0.03) | 1.57 (0.04) | 1.52 (0.03) |
| 37 | 1,2,9,10-tetradehydroaristolane | 1461 | ND | 1.29 (0.02) | 1.04 (0.03) | 1.00 (0.04) | 0.98 (0.01) | 1.24 (0.03) | 1.27 (0.02) |
| 38 | 204[M+](15) 91(100) 105(84) | 1465 | ND | 0.27 (0.05) | 0.43 (0.04) | 0.45 (0.05) | 0.30 (0.02) | 0.36 (0.02) | 0.42 (0.03) |
| 39 | 204[M+](18) 128(100) 143(95) | 1469 | ND | 0.33 (0.03) | 0.37 (0.02) | 0.38 (0.06) | 0.42 (0.01) | 0.33 (0.03) | 0.43 (0.02) |
| 40 | γ-gurjunene | 1474 c,d | 1475 c | 0.49 (0.04) | 0.52 (0.04) | 0.39 (0.03) | 0.41 (0.05) | 0.51 (0.02) | 0.55 (0.06) |
| 41 | γ-muurolene | 1477c | 1478 c | 0.22 (0.03) | 0.19 (0.04) | 0.20 (0.05) | 0.23 (0.04) | 0.26 (0.04) | 0.27 (0.02) |
| 42 | δ-selinene | 1488 c | 1492 c | 2.17 (0.04) | 2.10 (0.03) | 2.09 (0.02) | 2.22 (0.02) | 2.25 (0.04) | 2.16 (0.04) |
| 43 | ledene | 1492 a,b,c | 1496 c | 2.11 (0.03) | 1.87 (0.02) | 1.92 (0.04) | 1.95 (0.02) | 1.90 (0.02) | 1.87 (0.05) |
| 44 | 204[M+](38) 105(100) 93(96) | 1495 | ND | 0.16 (0.02) | 0.18 (0.05) | 0.21 (0.03) | 0.24 (0.05) | 0.26 (0.05) | 0.27 (0.03) |
| 45 | bicyclogermacrene | 1499 a,b,c | 1500 c | 17.63 (0.04) | 18.02 (0.05) | 17.54 (0.06) | 17.43 (0.03) | 17.73 (0.03) | 16.27 (0.03) |
| 46 | 204[M+](19) 93(100) 91(95) | 1505 | ND | 0.38 (0.01) | 0.55 (0.03) | 0.57 (0.03) | 0.61 (0.04) | 0.37 (0.04) | 0.46 (0.02) |
| 47 | 202[M+](25) 133(100) 91(89) | 1509 | ND | 0.20 (0.03) | 0.09 (0.03) | 0.11 (0.02) | 0.12 (0.03) | 0.13 (0.03) | 0.15 (0.01) |
| 48 | 206[M+](14) 191(100) 57(38) | 1514 | ND | 0.09 (0.03) | 0.13 (0.04) | 0.15 (0.04) | 0.08 (0.04) | 0.25 (0.04) | 0.31 (0.05) |
| 49 | 202[M+](33) 131(100) 145(53) | 1518 | ND | 0.50 (0.04) | 0.44 (0.03) | 0.43 (0.04) | 0.37 (0.03) | 0.35 (0.03) | 0.45 (0.04) |
| 50 | δ-cadinene | 1524 a,b,c | 1522 c | 0.09 (0.01) | 0.13 (0.03) | 0.14 (0.01) | 0.17 (0.02) | 0.12 (0.02) | 0.13 (0.02) |
| 51 | 204[M+](5) 91(100) 131(95) | 1530 | ND | 0.16 (0.04) | 0.17 (0.02) | 0.19 (0.03) | 0.14 (0.04) | 0.16 (0.04) | 0.18 (0.04) |
| 52 | 200[M+](54) 185(100) 143(91) | 1535 | ND | - | - | - | - | - | - |
| 53 | 4,5,9,10-dehydro-isolongifolene | 1544 a,b | 1544 a | 4.28 (0.04) | 4.35 (0.04) | 4.29 (0.03) | 4.57 (0.05) | 4.51 (0.04) | 4.32 (0.06) |
| 54 | 202[M+](4) 128(100) 157(95) | 1547 | ND | 0.74 (0.03) | 0.75 (0.03) | 0.68 (0.04) | 0.83 (0.03) | 0.78 (0.03) | 0.71 (0.03) |
| 55 | 200[M+](8) 171(100) 186(79) | 1551 | ND | 0.09 (0.02) | 0.08 (0.01) | 0.11 (0.01) | 0.09 (0.01) | 0.08 (0.02) | 0.09 (0.04) |
| 56 | 200[M+](91) 129(100) 157(88) | 1556 | ND | 0.06 (0.03) | 0.04 (0.01) | 0.09 (0.04) | 0.03 (0.03) | 0.06 (0.01) | 0.06 (0.01) |
| 57 | 204[M+](8) 143(100) 157(98) | 1559 | ND | 0.06 (0.01) | 0.02 (0.01) | 0.07 (0.01) | 0.06 (0.03) | 0.05 (0.01) | 0.06 (0.01) |
| 58 | 204[M+](82) 173(100) 189(94) | 1563 | ND | 1.20 (0.04) | 1.25 (0.03) | 1.23 (0.04) | 1.19 (0.04) | 1.20 (0.03) | 1.22 (0.03) |
| 59 | palustrol | 1567 c | 1567 c | 5.32 (0.04) | 5.43 (0.03) | 5.22 (0.04) | 5.09 (0.01) | 5.49 (0.03) | 5.23 (0.04) |
| 60 | 200[M+](11) 79(100) 93(95) | 1570 | ND | 0.41 (0.03) | 0.46 (0.04) | 0.53 (0.03) | 0.50 (0.03) | 0.61 (0.04) | 0.43 (0.02) |
| 61 | 204[M+](31) 81(100) 109(88) | 1573 | ND | 2.32 (0.02) | 1.79 (0.04) | 1.95 (0.02) | 1.87 (0.03) | 2.14 (0.03) | 2.29 (0.03) |
| 62 | spathulenol | 1576 a,b,c | 1577 c | 2.62 (0.05) | 2.69 (0.06) | 2.57 (0.05) | 2.72 (0.04) | 2.67 (0.03) | 2.63 (0.03) |
| 63 | 200[M+](56) 185(100) 143(63) | 1581 | ND | 2.41 (0.04) | 2.39 (0.03) | 2.57 (0.04) | 2.45 (0.01) | 2.58 (0.02) | 2.44 (0.04) |
| 64 | 202[M+](4) 91(100) 79(82) | 1587 | ND | 0.30 (0.04) | 0.27 (0.03) | 0.37 (0.02) | 0.26 (0.04) | 0.30 (0.04) | 0.31 (0.03) |
| 65 | globulol | 1599 a,b,c,d | 1590 c | 1.33 (0.02) | 1.46 (0.02) | 1.27 (0.03) | 1.39 (0.03) | 1.49 (0.03) | 1.50 (0.04) |
| 66 | 200[M+](8) 198(100) 183(84) | 1605 | ND | - | - | - | - | - | - |
| 67 | 220[M+](2) 145(100) 200(93) | 1609 | ND | 0.11 (0.03) | 0.08 (0.02) | 0.10 (0.02) | 0.09 (0.04) | 0.08 (0.02) | 0.06 (0.03) |
| 68 | (+)-bisabola-2,10-diene[1,9]oxide | 1615 a,b | 1596 a | 0.30 (0.03) | 0.29 (0.03) | 0.31 (0.03) | 0.32 (0.04) | 0.28 (0.05) | 0.27 (0.02) |
| 69 | 208[M+](3) 95(100) 85(95) | 1621 | ND | 0.62 (0.03) | 0.63 (0.04) | 0.70 (0.03) | 0.46 (0.03) | 0.53 (0.04) | 0.61 (0.02) |
| 70 | ledene oxide-(II) | 1631 a,b | 1631 a | - | - | - | - | - | - |
| 71 | isospathulenol | 1635 a,b | 1633 a | 0.32 (0.04) | 0.38 (0.04) | 0.34 (0.03) | 0.29 (0.02) | 0.39 (0.02) | 0.37 (0.01) |
| 72 | 220[M+](18) 91(100) 105(83) | 1639 | ND | 0.78 (0.04) | 0.75 (0.06) | 0.71 (0.03) | 0.73 (0.03) | 0.77 (0.03) | 0.75 (0.03) |
| 73 | cubenol | 1642 a,b,c,d | 1645 c | 0.11 (0.06) | 0.10 (0.03) | 0.08 (0.02) | 0.07 (0.01) | 0.09 (0.02) | 0.10 (0.03) |
| 74 | 220[M+](21) 91(100) 105(82) | 1651 | ND | 0.04 (0.03) | 0.05 (0.03) | 0.04 (0.01) | 0.03 (0.01) | 0.05 (0.01) | 0.03 (0.01) |
| 75 | 222[M+](3) 179(100) 121(92) | 1655 | ND | 0.05 (0.03) | 0.04 (0.01) | 0.03 (0.01) | 0.06 (0.01) | 0.07 (0.01) | 0.02 (0.01) |
| 76 | germacra-4(15),5,10(14)-trien-1-α-ol | 1660 c | 1685 c | 0.87 (0.04) | 0.90 (0.03) | 0.87 (0.04) | 0.92 (0.03) | 0.95 (0.01) | 0.83 (0.04) |
| 77 | 216[M+](31) 145(100) 91(97) | 1699 | ND | 0.15 (0.04) | 0.17 (0.04) | 0.19 (0.02) | 0.20 (0.03) | 0.22 (0.04) | 0.25 (0.04) |
| 78 | 1,4-dimethyl-7-(1-methylethyl)-azulene | 1790 c | 1779 c | 1.07 (0.05) | 1.16 (0.02) | 1.24 (0.03) | 1.29 (0.04) | 1.33 (0.06) | 1.09 (0.04) |
| 79 | 14-hydroxy-δ-cadinene | 1797 c | 1803 c | 0.16 (0.01) | 0.17 (0.02) | 0.05 (0.01) | 0.08 (0.04) | 0.11 (0.03) | 0.16 (0.04) |
| Total | 98.83 (2.30) | 98.74 (2.18) | 98.57 (2.18) | 98.93 (2.13) | 99.71 (2.13) | 98.50 (2.13) | |||
| % identified | 84.69 (1.29) | 84.80 (1.20) | 83.87 (1.26) | 85.10 (1.17) | 85.17 (1.17) | 83.73 (1.23) | |||
| including: | |||||||||
| aliphatics | 1.27 (0.14) | 1.27 (0.13) | 1.20 (0.17) | 1.32 (0.14) | 1.32 (0.17) | 1.34 (0.16) | |||
| aromatics | 2.41 (0.15) | 2.30 (0.17) | 2.36 (0.13) | 2.44 (0.12) | 2.49 (0.15) | 2.55 (0.14) | |||
| monoterpene hydrocarbons | 0.01 (0.01) | 0.01 (0.00) | 0.01 (0.01) | 0.02 (0.04) | 0.03 (0.01) | 0.04 (0.01) | |||
| monoterpenoid hydrocarbons | 0.02 (0.01) | 0.04 (0.01) | 0.05 (0.01) | 0.03 (0.03) | 0.02 (0.01) | 0.06 (0.01) | |||
| sesquiterpene hydrocarbons | 69.95 (0.69) | 69,76 (0.63) | 69.54 (0.69) | 70.41 (0.62) | 69.84 (0.61) | 68.65 (0.62) | |||
| sesquiterpenoid hydrocarbons | 11.03 (0.29) | 11.42 (0.26) | 10.71 (0.25) | 10.88 (0.22) | 11.47 (0.22) | 11.09 (0.25) | |||
| (a) | |||||||||
|---|---|---|---|---|---|---|---|---|---|
| No. | Compounds * | RI ** | RI *** | Code **** | |||||
| CI-25 | CI-26 | CI-27 | CI-28 | CI-29 | CI-30 | ||||
| 1 | propan-1-ol | <700 a,b | 483 a | 1.42 (0.03) | 1.23 (0.03) | 1.32 (0.03) | 1.43 (0.03) | 1.36 (0.05) | 1.45 (0.05) |
| 2 | pentanal | 705 a,b,c,d | 704 c | 0.39 (0.04) | 0.45 (0.01) | 0.41 (0.03) | 0.39 (0.04) | 0.42 (0.03) | 0.47 (0.03) |
| 3 | hexanal | 802 a,b,c,d | 801 c | 0.43 (0.02) | 0.39 (0.01) | 0.42 (0.03) | 0.43 (0.02) | 0.40 (0.05) | 0.38 (0.04) |
| 4 | hexan-1-ol | 867 a,b | 869 a | 0.32 (0.03) | 0.29 (0.04) | 0.26 (0.04) | 0.25 (0.04) | 0.30 (0.03) | 0.31 (0.03) |
| 5 | heptanal | 902 a,b,c,d | 901 c | 0.03 (0.01) | 0.02 (0.01) | 0.05 (0.01) | 0.01 (0.01) | 0.03 (0.01) | 0.02 (0.01) |
| 6 | α-pinene | 939 a,b,c | 932 c | 0.02 (0.01) | 0.05 (0.02) | 0.05 (0.01) | 0.04 (0.01) | 0.03 (0.01) | 0.04 (0.01) |
| 7 | benzaldehyde | 940 a,b,c | 952 c | 0.53 (0.04) | 0.48 (0.03) | 0.41 (0.04) | 0.44 (0.02) | 0.45 (0.02) | 0.43 (0.03) |
| 8 | 2-ethylhexan-1-ol | 1023 a,b | 1025 a | 0.16 (0.02) | 0.21 (0.03) | 0.25 (0.02) | 0.17 (0.02) | 0.20 (0.05) | 0.23 (0.03) |
| 9 | phenylmethanol | 1028 a,b,c | 1026 c | 1.08 (0.04) | 0.98 (0.03) | 1.02 (0.02) | 1.00 (0.04) | 0.99 (0.03) | 1.03 (0.02) |
| 10 | phenylacetaldehyde | 1044 a,b | 1044 a | 1.75 (0.03) | 1.65 (0.03) | 1.72 (0.03) | 1.70 (0.02) | 1.68 (0.03) | 1.75 (0.03) |
| 11 | nonanal | 1102 a,b,c,d | 1100 c | 0.12 (0.01) | 0.13 (0.04) | 0.10 (0.02) | 0.11 (0.04) | 0.09 (0.02) | 0.10 (0.03) |
| 12 | 3,4-dimethylcyclohexan-1-ol | 1115 a,b | 1126 a | 0.09 (0.02) | 0.12 (0.02) | 0.09 (0.01) | 0.08 (0.02) | 0.10 (0.03) | 0.11 (0.04) |
| 13 | phenylethanol | 1121 a,b | 1121 a | 0.60 (0.05) | 0.57 (0.04) | 0.55 (0.04) | 0.59 (0.03) | 0.57 (0.03) | 0.61 (0.03) |
| 14 | decanal | 1195 a,b,c,d | 1201 c | 0.07 (0.01) | 0.06 (0.01) | 0.09 (0.01) | 0.05 (0.01) | 0.07 (0.01) | 0.09 (0.02) |
| 15 | β-cyclocitral | 1221 c | 1217 c | 0.07 (0.01) | 0.03 (0.01) | 0.05 (0.01) | 0.04 (0.01) | 0.03 (0.01) | 0.05 (0.01) |
| 16 | 2-phenoxyethan-1-ol | 1225 a,b | 1226 a | 1.28 (0.05) | 1.14 (0.02) | 1.32 (0.05) | 1.15 (0.04) | 1.30 (0.04) | 1.29 (0.02) |
| 17 | bicycloelemene | 1316 a | 1330 a | 0.05 (0.01) | 0.09 (0.02) | 0.08 (0.02) | 0.08 (0.02) | 0.10 (0.03) | 0.06 (0.01) |
| 18 | δ-elemene | 1324 a,b,c | 1335 c | 0.74 (0.05) | 0.69 (0.04) | 0.71 (0.04) | 0.68 (0.05) | 0.70 (0.02) | 0.73 (0.05) |
| 19 | 204[M+](5) 121(100) 93(89) | 1343 | ND | 0.11 (0.03) | 0.15 (0.02) | 0.12 (0.02) | 0.10 (0.02) | 0.13 (0.05) | 0.15 (0.02) |
| 20 | 200[M+](39) 159(100) 117(95) | 1345 | ND | 1.33 (0.05) | 1.27 (0.04) | 1.22 (0.05) | 1.30 (0.03) | 1.25 (0.05) | 1.26 (0.04) |
| 21 | 202[M+](13) 81(100) 96(73) | 1350 | ND | 0.09 (0.02) | 0.14 (0.03) | 0.12 (0.02) | 0.10 (0.03) | 0.11 (0.02) | 0.09 (0.01) |
| 22 | 204[M+](10) 119(100) 91(84) | 1353 | ND | 0.08 (0.02) | 0.11 (0.01) | 0.09 (0.01) | 0.09 (0.01) | 0.10 (0.04) | 0.11 (0.03) |
| 23 | anastreptene | 1370 a | 1370 a | 15.73 (0.05) | 15.98 (0.05) | 15.51 (0.06) | 16.01 (0.03) | 15.48 (0.04) | 15.27 (0.04) |
| 24 | 204[M+](5) 81(100) 93(96) | 1384 | ND | 0.12 (0.03) | 0.23 (0.03) | 0.18 (0.01) | 0.13 (0.04) | 0.15 (0.03) | 0.20 (0.03) |
| 25 | β-elemene | 1391 a,b,c | 1389 c | 1.32 (0.03) | 1.24 (0.04) | 1.29 (0.02) | 1.30 (0.04) | 1.25 (0.04) | 1.27 (0.05) |
| 26 | 204[M+](13) 157(100) 185(84) | 1398 | ND | 0.19 (0.02) | 0.28 (0.02) | 0.23 (0.04) | 0.18 (0.03) | 0.20 (0.03) | 0.23 (0.03) |
| 27 | 204[M+](13) 157(100) 185(84) | 1417 | ND | 0.34 (0.03) | 0.31 (0.05) | 0.37 (0.04) | 0.33 (0.02) | 0.30 (0.05) | 0.35 (0.01) |
| 28 | 204[M+](19) 135(100) 105(82) | 1423 | ND | 0.19 (0.02) | 0.14 (0.02) | 0.12 (0.03) | 0.11 (0.05) | 0.13 (0.03) | 0.19 (0.03) |
| 29 | 204[M+](9) 91(100) 105(93) | 1425 | ND | 0.04 (0.01) | 0.06 (0.01) | 0.03 (0.01) | 0.01 (0.01) | 0.03 (0.01) | 0.05 (0.01) |
| 30 | (-)-aristolene | 1429 a,b,c,d | 1428 a | 1.12 (0.04) | 1.23 (0.03) | 1.18 (0.05) | 1.21 (0.02) | 1.19 (0.03) | 1.11 (0.03) |
| 31 | 204[M+](9) 107(100) 79(43) | 1432 | ND | 0.16 (0.04) | 0.09 (0.01) | 0.11 (0.05) | 0.10 (0.04) | 0.11 (0.02) | 0.12 (0.02) |
| 32 | γ-maaliene | 1435 a,b | 1427 a | 0.28 (0.03) | 0.18 (0.02) | 0.23 (0.02) | 0.25 (0.03) | 0.19 (0.03) | 0.23 (0.04) |
| 33 | α-maaliene | 1443 a,b | 1442 a | 0.18 (0.02) | 0.27 (0.04) | 0.29 (0.04) | 0.19 (0.03) | 0.25 (0.02) | 0.23 (0.03) |
| 34 | aromandendrene | 1445 a,b | 1447 a | 3.35 (0.05) | 3.15 (0.04) | 3.21 (0.02) | 3.23 (0.04) | 3.21 (0.04) | 3.18 (0.04) |
| 35 | selina-5,11-diene | 1447 a,b | 1454 a | 0.31 (0.05) | 0.26 (0.03) | 0.32 (0.04) | 0.33 (0.03) | 0.27 (0.03) | 0.30 (0.03) |
| 36 | dehydroaromadendrene | 1456 c | 1460 c | 1.05 (0.02) | 1.24 (0.02) | 1.15 (0.04) | 1.12 (0.05) | 1.06 (0.04) | 1.16 (0.04) |
| 37 | 1,2,9,10-tetradehydroaristolane | 1461 | ND | 0.44 (0.04) | 0.54 (0.05) | 0.47 (0.03) | 0.45 (0.03) | 0.51 (0.03) | 0.47 (0.03) |
| 38 | 204[M+](15) 91(100) 105(84) | 1465 | ND | 0.38 (0.03) | 0.26 (0.05) | 0.21 (0.02) | 0.25 (0.02) | 0.27 (0.04) | 0.33 (0.02) |
| 39 | 204[M+](18) 128(100) 143(95) | 1469 | ND | 0.32 (0.03) | 0.36 (0.02) | 0.39 (0.03) | 0.33 (0.03) | 0.39 (0.03) | 0.34 (0.02) |
| 40 | γ-gurjunene | 1474 c,d | 1475 c | 0.34 (0.04) | 0.28 (0.04) | 0.33 (0.05) | 0.29 (0.02) | 0.34 (0.02) | 0.33 (0.02) |
| 41 | γ-muurolene | 1477 c | 1478 c | 0.14 (0.03) | 0.09 (0.03) | 0.11 (0.02) | 0.09 (0.01) | 0.12 (0.02) | 0.08 (0.01) |
| 42 | δ-selinene | 1488 c | 1492 c | 1.08 (0.05) | 0.98 (0.03) | 1.12 (0.04) | 1.00 (0.04) | 1.11 (0.02) | 1.09 (0.01) |
| 43 | ledene | 1492 a,b,c | 1496 c | 1.59 (0.03) | 1.21 (0.04) | 1.38 (0.03) | 1.47 (0.04) | 1.55 (0.05) | 1.38 (0.04) |
| 44 | 204[M+](38) 105(100) 93(96) | 1495 | ND | 0.08 (0.02) | 0.09 (0.03) | 0.05 (0.01) | 0.06 (0.01) | 0.09 (0.01) | 0.10 (0.03) |
| 45 | bicyclogermacrene | 1499 a,b,c | 1500 c | 7.87 (0.03) | 7.23 (0.05) | 6.99 (0.04) | 7.59 (0.04) | 7.68 (0.04) | 7.36 (0.05) |
| 46 | 204[M+](19) 93(100) 91(95) | 1505 | ND | 0.09 (0.02) | 0.19 (0.03) | 0.14 (0.03) | 0.10 (0.03) | 0.13 (0.03) | 0.18 (0.01) |
| 47 | 202[M+](25) 133(100) 91(89) | 1509 | ND | 0.24 (0.03) | 0.13 (0.02) | 0.16 (0.02) | 0.19 (0.04) | 0.21 (0.05) | 0.16 (0.02) |
| 48 | 206[M+](14) 191(100) 57(38) | 1514 | ND | 0.17 (0.02) | 0.09 (0.03) | 0.15 (0.02) | 0.11 (0.03) | 0.09 (0.01) | 0.16 (0.04) |
| 49 | 202[M+](33) 131(100) 145(53) | 1518 | ND | 0.21 (0.04) | 0.14 (0.02) | 0.20 (0.02) | 0.19 (0.02) | 0.16 (0.02) | 0.21 (0.02) |
| 50 | δ-cadinene | 1524 a,b,c | 1522c | 0.38 (0.03) | 0.29 (0.03) | 0.34 (0.03) | 0.30 (0.05) | 0.33 (0.04) | 0.36 (0.02) |
| 51 | 204[M+](5) 91(100) 131(95) | 1530 | ND | 0.12 (0.04) | 0.06 (0.01) | 0.08 (0.02) | 0.09 (0.01) | 0.07 (0.02) | 0.11 (0.04) |
| 52 | 200[M+](54) 185(100) 143(91) | 1535 | ND | 0.20 (0.03) | 0.16 (0.04) | 0.22 (0.03) | 0.21 (0.04) | 0.18 (0.02) | 0.23 (0.03) |
| 53 | 4,5,9,10-dehydro-isolongifolene | 1544 a,b | 1544 a | 8.71 (0.04) | 8.03 (0.05) | 8.53 (0.02) | 8.24 (0.05) | 8.47 (0.04) | 8.68 (0.04) |
| 54 | 202[M+](4) 128(100) 157(95) | 1547 | ND | 1.43 (0.03) | 1.63 (0.04) | 1.54 (0.04) | 1.44 (0.05) | 1.61 (0.03) | 1.59 (0.05) |
| 55 | 200[M+](8) 171(100) 186(79) | 1551 | ND | 0.22 (0.02) | 0.17 (0.03) | 0.18 (0.05) | 0.21 (0.03) | 0.19 (0.02) | 0.16 (0.01) |
| 56 | 200[M+](91) 129(100) 157(88) | 1556 | ND | 0.09 (0.02) | 0.11 (0.04) | 0.13 (0.04) | 0.10 (0.02) | 0.11 (0.05) | 0.09 (0.02) |
| 57 | 204[M+](8) 143(100) 157(98) | 1559 | ND | 0.05 (0.02) | 0.03 (0.03) | 0.08 (0.03) | 0.06 (0.04) | 0.04 (0.01) | 0.05 (0.01) |
| 58 | 204[M+](82) 173(100) 189(94) | 1563 | ND | 1.55 (0.05) | 1.65 (0.02) | 1.62 (0.04) | 1.56 (0.03) | 1.64 (0.02) | 1.63 (0.02) |
| 59 | palustrol | 1567 c | 1567 c | 9.79 (0.05) | 9.86 (0.05) | 9.93 (0.05) | 9.81 (0.03) | 9.89 (0.02) | 9.91 (0.05) |
| 60 | 200[M+](11) 79(100) 93(95) | 1570 | ND | 0.57 (0.04) | 0.46 (0.05) | 0.51 (0.03) | 0.45 (0.04) | 0.50 (0.02) | 0.56 (0.05) |
| 61 | 204[M+](31) 81(100) 109(88) | 1573 | ND | 0.90 (0.03) | 0.87 (0.04) | 0.92 (0.03) | 0.89 (0.03) | 0.93 (0.05) | 0.86 (0.06) |
| 62 | spathulenol | 1576 a,b,c | 1577 c | 4.96 (0.05) | 5.01 (0.03) | 5.06 (0.04) | 5.00 (0.02) | 4.98 (0.05) | 5.03 (0.03) |
| 63 | 200[M+](56) 185(100) 143(63) | 1581 | ND | 5.64 (0.05) | 5.24 (0.05) | 5.43 (0.03) | 5.36 (0.05) | 5.48 (0.06) | 5.57 (0.04) |
| 64 | 202[M+](4) 91(100) 79(82) | 1587 | ND | 0.51 (0.02) | 0.46 (0.03) | 0.48 (0.02) | 0.44 (0.03) | 0.52 (0.03) | 0.49 (0.02) |
| 65 | globulol | 1599 a,b,c,d | 1590 c | 2.97 (0.04) | 3.06 (0.02) | 3.15 (0.03) | 3.00 (0.02) | 2.98 (0.04) | 3.05 (0.05) |
| 66 | 200[M+](8) 198(100) 183(84) | 1605 | ND | 0.28 (0.03) | 0.35 (0.04) | 0.21 (0.04) | 0.19 (0.04) | 0.29 (0.02) | 0.27 (0.03) |
| 67 | 220[M+](2) 145(100) 200(93) | 1609 | ND | 2.22 (0.01) | 2.01 (0.03) | 2.14 (0.04) | 2.18 (0.02) | 2.14 (0.05) | 1.99 (0.06) |
| 68 | (+)-bisabola-2,10-diene[1,9]oxide | 1615 a,b | 1596 a | 0.22 (0.04) | 0.16 (0.03) | 0.13 (0.02) | 0.18 (0.05) | 0.20 (0.05) | 0.21 (0.03) |
| 69 | 208[M+](3) 95(100) 85(95) | 1621 | ND | 1.09 (0.03) | 1.57 (0.04) | 1.38 (0.04) | 1.10 (0.05) | 1.22 (0.06) | 1.48 (0.04) |
| 70 | ledene oxide-(II) | 1631 a,b | 1631 a | 0.22 (0.02) | 0.16 (0.03) | 0.27 (0.03) | 0.26 (0.06) | 0.16 (0.03) | 0.18 (0.03) |
| 71 | isospathulenol | 1635 a,b | 1633 a | 0.86 (0.05) | 0.94 (0.02) | 0.99 (0.04) | 1.01 (0.03) | 0.95 (0.04) | 0.87 (0.02) |
| 72 | 220[M+](18) 91(100) 105(83) | 1639 | ND | 1.56 (0.03) | 1.64 (0.05) | 1.52 (0.03) | 1.62 (0.04) | 1.57 (0.03) | 1.60 (0.03) |
| 73 | cubenol | 1642 a,b,c,d | 1645 c | 0.54 (0.02) | 0.44 (0.03) | 0.41 (0.02) | 0.55 (0.03) | 0.43 (0.02) | 0.39 (0.03) |
| 74 | 220[M+](21) 91(100) 105(82) | 1651 | ND | 0.10 (0.02) | 0.10 (0.02) | 0.08 (0.02) | 0.09 (0.02) | 0.08 (0.01) | 0.11 (0.04) |
| 75 | 222[M+](3) 179(100) 121(92) | 1655 | ND | 0.05 (0.02) | 0.05 (0.01) | 0.03 (0.01) | 0.02 (0.01) | 0.04 (0.01) | 0.06 (0.02) |
| 76 | germacra-4(15),5,10(14)-trien-1-α-ol | 1660 c | 1685 c | 0.99 (0.05) | 0.83 (0.02) | 1.02 (0.04) | 1.01 (0.03) | 0.95 (0.02) | 0.87 (0.04) |
| 77 | 216[M+](31) 145(100) 91(97) | 1699 | ND | 0.61 (0.05) | 0.53 (0.05) | 0.67 (0.03) | 0.55 (0.02) | 0.60 (0.03) | 0.64 (0.05) |
| 78 | 1,4-dimethyl-7-(1-methylethyl)-azulene | 1790 c | 1779 c | 3.02 (0.06) | 3.56 (0.05) | 3.23 (0.02) | 3.11 (0.01) | 3.45 (0.02) | 3.27 (0.06) |
| 79 | 14-hydroxy-δ-cadinene | 1797 c | 1803 c | 0.40 (0.03) | 0.36 (0.06) | 0.41 (0.05) | 0.39 (0.02) | 0.42 (0.04) | 0.37 (0.03) |
| Total | 98.34 (2.47) | 96.29 (2.43) | 97.06 (2.35) | 96.27 (2.35) | 97.30 (2.42) | 97.52 (2.39) | |||
| % identified | 77.01 (1.47) | 75.16 (1.37) | 75.95 (1.35) | 76.03 (1.32) | 76.24 (1.36) | 75.80 (1.38) | |||
| including: | |||||||||
| aliphatics | 3.03 (0.19) | 2.90 (0.20) | 2.99 (0.20) | 2.92 (0.23) | 2.97 (0.28) | 3.16 (0.28) | |||
| aromatics | 5.24 (0.21) | 4.82 (0.15) | 5.02 (0.18) | 4.88 (0.15) | 4.99 (0.15) | 5.11 (0.13) | |||
| monoterpene hydrocarbons | 0.02 (0.01) | 0.05 (0.02) | 0.05 (0.01) | 0.04 (0.01) | 0.03 (0.01) | 0.04 (0.01) | |||
| monoterpenoid hydrocarbons | 0.07 (0.01) | 0.03 (0.01) | 0.05 (0.01) | 0.04 (0.01) | 0.03 (0.01) | 0.05 (0.01) | |||
| sesquiterpene hydrocarbons | 47.70 (0.70) | 46.54 (0.70) | 46.47 (0.63) | 46.94 (0.63) | 47.26 (0.60) | 46.56 (0.64) | |||
| sesquiterpenoid hydrocarbons | 20.95 (0.35) | 20.82 (0.29) | 21.37 (0.32) | 21.21 (0.29) | 20.96 (0.31) | 20.88 (0.31) | |||
| (b) | |||||||||
| No. | Compounds * | RI ** | RI *** | Code **** | |||||
| CI-31 | CI-32 | CI-33 | CI-34 | CI-35 | CI-36 | ||||
| 1 | propan-1-ol | <700 a,b | 483 a | 1.37 (0.03) | 1.21 (0.04) | 1.33 (0.05) | 1.41 (0.04) | 1.39 (0.04) | 1.30 (0.05) |
| 2 | pentanal | 705 a,b,c,d | 704 c | 0.43 (0.03) | 0.40 (0.03) | 0.36 (0.05) | 0.46 (0.02) | 0.42 (0.03) | 0.41 (0.03) |
| 3 | hexanal | 802 a,b,c,d | 801 c | 0.42 (0.02) | 0.45 (0.03) | 0.39 (0.04) | 0.40 (0.02) | 0.42 (0.01) | 0.43 (0.01) |
| 4 | hexan-1-ol | 867 a,b | 869 a | 0.27 (0.04) | 0.29 (0.04) | 0.33 (0.03) | 0.29 (0.03) | 0.27 (0.03) | 0.26 (0.02) |
| 5 | heptanal | 902 a,b,c,d | 901 c | 0.04 (0.01) | 0.03 (0.01) | 0.05 (0.01) | 0.01 (0.01) | 0.04 (0.01) | 0.05 (0.01) |
| 6 | α-pinene | 939 a,b,c | 932 c | 0.05 (0.01) | 0.02 (0.01) | 0.03 (0.01) | 0.04 (0.01) | 0.05 (0.01) | 0.05 (0.01) |
| 7 | benzaldehyde | 940 a,b,c | 952 c | 0.48 (0.03) | 0.50 (0.03) | 0.49 (0.05) | 0.52 (0.04) | 0.47 (0.03) | 0.53 (0.03) |
| 8 | 2-ethylhexan-1-ol | 1023 a,b | 1025 a | 0.25 (0.04) | 0.19 (0.02) | 0.18 (0.03) | 0.21 (0.03) | 0.25 (0.04) | 0.19 (0.03) |
| 9 | phenylmethanol | 1028 a,b,c | 1026 c | 1.10 (0.04) | 1.11 (0.04) | 0.97 (0.06) | 1.03 (0.03) | 1.06 (0.02) | 1.01 (0.04) |
| 10 | phenylacetaldehyde | 1044 a,b | 1044 a | 1.63 (0.03) | 1.69 (0.04) | 1.71 (0.03) | 1.74 (0.05) | 1.67 (0.03) | 1.70 (0.03) |
| 11 | nonanal | 1102 a,b,c,d | 1100 c | 0.12 (0.04) | 0.11 (0.03) | 0.13 (0.04) | 0.14 (0.02) | 0.09 (0.02) | 0.10 (0.03) |
| 12 | 3,4-dimethylcyclohexan-1-ol | 1115 a,b | 1126 a | 0.09 (0.02) | 0.08 (0.01) | 0.13 (0.03) | 0.10 (0.03) | 0.09 (0.01) | 0.10 (0.01) |
| 13 | phenylethanol | 1121 a,b | 1121 a | 0.60 (0.03) | 0.62 (0.05) | 0.59 (0.02) | 0.55 (0.02) | 0.54 (0.05) | 0.57 (0.02) |
| 14 | decanal | 1195 a,b,c,d | 1201 c | 0.10 (0.02) | 0.09 (0.02) | 0.07 (0.01) | 0.05 (0.01) | 0.06 (0.01) | 0.07 (0.01) |
| 15 | β-cyclocitral | 1221 c | 1217 c | 0.07 (0.01) | 0.06 (0.01) | 0.05 (0.01) | 0.03 (0.01) | 0.03 (0.01) | 0.05 (0.01) |
| 16 | 2-phenoxyethan-1-ol | 1225 a,b | 1226 a | 1.16 (0.05) | 1.11 (0.02) | 1.35 (0.04) | 1.29 (0.03) | 1.31 (0.02) | 1.21 (0.02) |
| 17 | bicycloelemene | 1316 a | 1330 a | 0.07 (0.02) | 0.08 (0.01) | 0.06 (0.01) | 0.04 (0.01) | 0.05 (0.01) | 0.09 (0.02) |
| 18 | δ-elemene | 1324 a,b,c | 1335 c | 0.69 (0.05) | 0.67 (0.02) | 0.74 (0.04) | 0.73 (0.02) | 0.71 (0.03) | 0.69 (0.05) |
| 19 | 204[M+](5) 121(100) 93(89) | 1343 | ND | 0.13 (0.02) | 0.11 (0.02) | 0.12 (0.05) | 0.13 (0.02) | 0.15 (0.01) | 0.14 (0.02) |
| 20 | 200[M+](39) 159(100) 117(95) | 1345 | ND | 1.25 (0.03) | 1.27 (0.06) | 1.32 (0.06) | 1.29 (0.04) | 1.31 (0.05) | 1.30 (0.04) |
| 21 | 202[M+](13) 81(100) 96(73) | 1350 | ND | 0.12 (0.03) | 0.15 (0.03) | 0.13 (0.03) | 0.10 (0.04) | 0.13 (0.04) | 0.14 (0.04) |
| 22 | 204[M+](10) 119(100) 91(84) | 1353 | ND | 0.08 (0.01) | 0.09 (0.02) | 0.09 (0.02) | 0.10 (0.03) | 0.11 (0.04) | 0.09 (0.01) |
| 23 | anastreptene | 1370 a | 1370 a | 15.72 (0.05) | 15.64 (0.04) | 15.34 (0.04) | 15.28 (0.03) | 15.69 (0.04) | 15.70 (0.04) |
| 24 | 204[M+](5) 81(100) 93(96) | 1384 | ND | 0.25 (0.04) | 0.19 (0.03) | 0.18 (0.03) | 0.13 (0.05) | 0.15 (0.02) | 0.21 (0.03) |
| 25 | β-elemene | 1391 a,b,c | 1389 c | 1.29 (0.04) | 1.27 (0.03) | 1.33 (0.03) | 1.35 (0.05) | 1.31 (0.05) | 1.29 (0.05) |
| 26 | 204[M+](13) 157(100) 185(84) | 1398 | ND | 0.25 (0.03) | 0.21 (0.02) | 0.19 (0.02) | 0.22 (0.02) | 0.25 (0.04) | 0.27 (0.03) |
| 27 | 204[M+](13) 157(100) 185(84) | 1417 | ND | 0.36 (0.02) | 0.31 (0.02) | 0.30 (0.02) | 0.34 (0.04) | 0.36 (0.03) | 0.37 (0.01) |
| 28 | 204[M+](19) 135(100) 105(82) | 1423 | ND | 0.20 (0.05) | 0.18 (0.05) | 0.15 (0.05) | 0.14 (0.02) | 0.16 (0.04) | 0.18 (0.03) |
| 29 | 204[M+](9) 91(100) 105(93) | 1425 | ND | 0.06 (0.01) | 0.04 (0.01) | 0.04 (0.01) | 0.02 (0.01) | 0.03 (0.01) | 0.02 (0.01) |
| 30 | (-)-aristolene | 1429 a,b,c,d | 1428 a | 1.20 (0.03) | 1.19 (0.04) | 1.25 (0.04) | 1.19 (0.04) | 1.18 (0.03) | 1.22 (0.03) |
| 31 | 204[M+](9) 107(100) 79(43) | 1432 | ND | 0.15 (0.04) | 0.14 (0.02) | 0.11 (0.02) | 0.13 (0.03) | 0.16 (0.04) | 0.15 (0.02) |
| 32 | γ-maaliene | 1435 a,b | 1427 a | 0.19 (0.03) | 0.20 (0.04) | 0.23 (0.04) | 0.27 (0.02) | 0.25 (0.03) | 0.17 (0.04) |
| 33 | α-maaliene | 1443 a,b | 1442 a | 0.30 (0.03) | 0.29 (0.04) | 0.21 (0.04) | 0.24 (0.03) | 0.27 (0.05) | 0.28 (0.03) |
| 34 | aromandendrene | 1445 a,b | 1447 a | 3.16 (0.04) | 3.37 (0.04) | 3.30 (0.04) | 3.29 (0.05) | 3.18 (0.03) | 3.33 (0.04) |
| 35 | selina-5,11-diene | 1447 a,b | 1454 a | 0.32 (0.03) | 0.29 (0.02) | 0.26 (0.02) | 0.27 (0.02) | 0.31 (0.02) | 0.26 (0.03) |
| 36 | dehydroaromadendrene | 1456 c | 1460 c | 1.19 (0.05) | 1.21 (0.05) | 1.23 (0.05) | 1.27 (0.04) | 1.08 (0.03) | 1.11 (0.04) |
| 37 | 1,2,9,10-tetradehydroaristolane | 1461 | ND | 0.49 (0.03) | 0.50 (0.05) | 0.53 (0.03) | 0.46 (0.03) | 0.43 (0.02) | 0.41 (0.03) |
| 38 | 204[M+](15) 91(100) 105(84) | 1465 | ND | 0.31 (0.02) | 0.29 (0.02) | 0.36 (0.02) | 0.24 (0.02) | 0.39 (0.03) | 0.26 (0.02) |
| 39 | 204[M+](18) 128(100) 143(95) | 1469 | ND | 0.29 (0.03) | 0.38 (0.04) | 0.40 (0.03) | 0.36 (0.02) | 0.32 (0.04) | 0.38 (0.02) |
| 40 | γ-gurjunene | 1474 c,d | 1475 c | 0.29 (0.02) | 0.28 (0.04) | 0.34 (0.02) | 0.33 (0.03) | 0.31 (0.04) | 0.27 (0.02) |
| 41 | γ-muurolene | 1477 c | 1478 c | 0.13 (0.03) | 0.10 (0.03) | 0.13 (0.03) | 0.15 (0.02) | 0.09 (0.01) | 0.11 (0.05) |
| 42 | δ-selinene | 1488 c | 1492 c | 1.07 (0.04) | 0.99 (0.04) | 1.02 (0.04) | 0.96 (0.02) | 1.05 (0.05) | 1.14 (0.03) |
| 43 | ledene | 1492 a,b,c | 1496 c | 1.33 (0.04) | 1.18 (0.03) | 1.57 (0.03) | 1.46 (0.02) | 1.35 (0.03) | 1.29 (0.04) |
| 44 | 204[M+](38) 105(100) 93(96) | 1495 | ND | 0.06 (0.01) | 0.09 (0.01) | 0.04 (0.01) | 0.11 (0.03) | 0.08 (0.01) | 0.07 (0.01) |
| 45 | bicyclogermacrene | 1499 a,b,c | 1500 c | 7.48 (0.05) | 7.83 (0.03) | 7.16 (0.03) | 7.79 (0.02) | 7.64 (0.03) | 7.75 (0.05) |
| 46 | 204[M+](19) 93(100) 91(95) | 1505 | ND | 0.20 (0.03) | 0.16 (0.02) | 0.14 (0.02) | 0.13 (0.03) | 0.14 (0.02) | 0.16 (0.01) |
| 47 | 202[M+](25) 133(100) 91(89) | 1509 | ND | 0.23 (0.04) | 0.17 (0.03) | 0.20 (0.04) | 0.15 (0.02) | 0.17 (0.05) | 0.23 (0.02) |
| 48 | 206[M+](14) 191(100) 57(38) | 1514 | ND | 0.18 (0.03) | 0.14 (0.02) | 0.12 (0.03) | 0.09 (0.02) | 0.12 (0.01) | 0.10 (0.04) |
| 49 | 202[M+](33) 131(100) 145(53) | 1518 | ND | 0.17 (0.02) | 0.18 (0.03) | 0.19 (0.04) | 0.20 (0.05) | 0.22 (0.04) | 0.18 (0.02) |
| 50 | δ-cadinene | 1524 a,b,c | 1522 c | 0.28 (0.05) | 0.30 (0.02) | 0.31 (0.03) | 0.27 (0.04) | 0.36 (0.05) | 0.38 (0.02) |
| 51 | 204[M+](5) 91(100) 131(95) | 1530 | ND | 0.05 (0.01) | 0.09 (0.01) | 0.10 (0.04) | 0.13 (0.03) | 0.12 (0.03) | 0.11 (0.04) |
| 52 | 200[M+](54) 185(100) 143(91) | 1535 | ND | 0.25 (0.04) | 0.17 (0.02) | 0.19 (0.03) | 0.17 (0.04) | 0.22 (0.03) | 0.19 (0.03) |
| 53 | 4,5,9,10-dehydro-isolongifolene | 1544 a,b | 1544 a | 8.70 (0.05) | 8.64 (0.04) | 8.59 (0.02) | 8.43 (0.05) | 8.66 (0.02) | 8.72 (0.04) |
| 54 | 202[M+](4) 128(100) 157(95) | 1547 | ND | 1.48 (0.03) | 1.59 (0.03) | 1.43 (0.02) | 1.55 (0.04) | 1.65 (0.04) | 1.55 (0.03) |
| 55 | 200[M+](8) 171(100) 186(79) | 1551 | ND | 0.19 (0.03) | 0.20 (0.03) | 0.23 (0.02) | 0.19 (0.01) | 0.18 (0.03) | 0.17 (0.02) |
| 56 | 200[M+](91) 129(100) 157(88) | 1556 | ND | 0.10 (0.02) | 0.13 (0.04) | 0.08 (0.01) | 0.09 (0.02) | 0.12 (0.03) | 0.11 (0.02) |
| 57 | 204[M+](8) 143(100) 157(98) | 1559 | ND | 0.07 (0.01) | 0.06 (0.01) | 0.08 (0.01) | 0.04 (0.01) | 0.06 (0.04) | 0.05 (0.01) |
| 58 | 204[M+](82) 173(100) 189(94) | 1563 | ND | 1.59 (0.03) | 1.60 (0.02) | 1.57 (0.02) | 1.63 (0.02) | 1.50 (0.03) | 1.61 (0.02) |
| 59 | palustrol | 1567 c | 1567 c | 9.90 (0.03) | 9.94 (0.02) | 9.78 (0.01) | 9.82 (0.03) | 9.86 (0.03) | 9.88 (0.05) |
| 60 | 200[M+](11) 79(100) 93(95) | 1570 | ND | 0.54 (0.04) | 0.51 (0.02) | 0.49 (0.03) | 0.47 (0.02) | 0.53 (0.05) | 0.56 (0.05) |
| 61 | 204[M+](31) 81(100) 109(88) | 1573 | ND | 0.91 (0.03) | 0.93 (0.03) | 0.87 (0.03) | 0.90 (0.03) | 0.88 (0.03) | 0.94 (0.02) |
| 62 | spathulenol | 1576 a,b,c | 1577 c | 5.11 (0.03) | 5.05 (0.02) | 4.91 (0.04) | 4.93 (0.02) | 4.98 (0.02) | 4.99 (0.03) |
| 63 | 200[M+](56) 185(100) 143(63) | 1581 | ND | 5.61 (0.05) | 5.37 (0.03) | 5.29 (0.03) | 5.54 (0.03) | 5.59 (0.04) | 5.64 (0.04) |
| 64 | 202[M+](4) 91(100) 79(82) | 1587 | ND | 0.47 (0.03) | 0.46 (0.02) | 0.51 (0.03) | 0.49 (0.02) | 0.47 (0.02) | 0.48 (0.02) |
| 65 | globulol | 1599 a,b,c,d | 1590 c | 3.11 (0.02) | 3.14 (0.03) | 3.03 (0.05) | 2.99 (0.03) | 3.07 (0.03) | 2.94 (0.05) |
| 66 | 200[M+](8) 198(100) 183(84) | 1605 | ND | 0.21 (0.04) | 0.26 (0.02) | 0.23 (0.02) | 0.22 (0.03) | 0.36 (0.03) | 0.31 (0.05) |
| 67 | 220[M+](2) 145(100) 200(93) | 1609 | ND | 2.21 (0.02) | 2.19 (0.03) | 2.17 (0.04) | 2.11 (0.04) | 2.16 (0.02) | 2.03 (0.06) |
| 68 | (+)-bisabola-2,10-diene[1,9]oxide | 1615 a,b | 1596 a | 0.16 (0.03) | 0.17 (0.03) | 0.14 (0.02) | 0.19 (0.02) | 0.21 (0.03) | 0.22 (0.03) |
| 69 | 208[M+](3) 95(100) 85(95) | 1621 | ND | 1.33 (0.03) | 1.54 (0.04) | 1.47 (0.05) | 1.23 (0.03) | 1.42 (0.04) | 1.37 (0.04) |
| 70 | ledene oxide-(II) | 1631 a,b | 1631 a | 0.21 (0.02) | 0.25 (0.02) | 0.19 (0.03) | 0.22 (0.04) | 0.17 (0.03) | 0.26 (0.03) |
| 71 | isospathulenol | 1635 a,b | 1633 a | 0.91 (0.03) | 0.89 (0.03) | 0.93 (0.03) | 0.98 (0.05) | 0.94 (0.03) | 0.88 (0.02) |
| 72 | 220[M+](18) 91(100) 105(83) | 1639 | ND | 1.59 (0.04) | 1.63 (0.02) | 1.51 (0.03) | 1.58 (0.01) | 1.53 (0.01) | 1.62 (0.01) |
| 73 | cubenol | 1642 a,b,c,d | 1645 c | 0.42 (0.03) | 0.51 (0.03) | 0.56 (0.04) | 0.40 (0.02) | 0.43 (0.03) | 0.52 (0.01) |
| 74 | 220[M+](21) 91(100) 105(82) | 1651 | ND | 0.10 (0.03) | 0.08 (0.02) | 0.09 (0.01) | 0.10 (0.01) | 0.11 (0.02) | 0.07 (0.02) |
| 75 | 222[M+](3) 179(100) 121(92) | 1655 | ND | 0.05 (0.01) | 0.03 (0.01) | 0.04 (0.01) | 0.03 (0.01) | 0.05 (0.01) | 0.06 (0.01) |
| 76 | germacra-4(15),5,10(14)-trien-1-α-ol | 1660 c | 1685 c | 0.89 (0.03) | 0.96 (0.03) | 1.03 (0.04) | 0.99 (0.05) | 0.94 (0.02) | 0.86 (0.02) |
| 77 | 216[M+](31) 145(100) 91(97) | 1699 | ND | 0.68 (0.02) | 0.58 (0.04) | 0.53 (0.03) | 0.56 (0.05) | 0.69 (0.03) | 0.61 (0.04) |
| 78 | 1,4-dimethyl-7-(1-methylethyl)-azulene | 1790 c | 1779 c | 3.43 (0.04) | 3.52 (0.02) | 3.50 (0.04) | 3.49 (0.06) | 3.27 (0.04) | 3.33 (0.03) |
| 79 | 14-hydroxy-δ-cadinene | 1797 c | 1803 c | 0.36 (0.03) | 0.42 (0.04) | 0.40 (0.03) | 0.38 (0.03) | 0.36 (0.02) | 0.41 (0.02) |
| Total | 98.30 (2.39) | 98.36 (2.20) | 97.19 (2.38) | 97.35 (2.23) | 98.24 (2.27) | 98.26 (2.21) | |||
| % identified | 76.58 (1.42) | 76.84 (1.31) | 76.23 (1.42) | 76.44 (1.29) | 76.31 (1.22) | 76.53 (1.30) | |||
| including: | |||||||||
| aliphatics | 3.09 (0.25) | 2.85 (0.23) | 2.97 (0.29) | 3.07 (0.21) | 3.03 (0.20) | 2.91 (0.20) | |||
| aromatics | 4.97 (0.18) | 5.03 (0.18) | 5.11 (0.20) | 5.13 (0.17) | 5.05 (0.15) | 5.02 (0.14) | |||
| monoterpene hydrocarbons | 0.05 (0.01) | 0.02 (0.01) | 0.03 (0.01) | 0.04 (0.01) | 0.05 (0.01) | 0.05 (0.01) | |||
| monoterpenoid hydrocarbons | 0.07 (0.01) | 0.06 (0.01) | 0.05 (0.01) | 0.03 (0.01) | 0.03 (0.01) | 0.05 (0.01) | |||
| sesquiterpene hydrocarbons | 47.33 (0.72) | 47.55 (0.63) | 47.10 (0.62) | 47.27 (0.60) | 47.19 (0.61) | 47.54 (0.68) | |||
| sesquiterpenoid hydrocarbons | 21.07 (0.25) | 21.33 (0.25) | 20.97 (0.29) | 20.90 (0.29) | 20.96 (0.24) | 20.96 (0.26) | |||
| No. | Compounds * | RI ** | RI *** | Code **** | |
|---|---|---|---|---|---|
| CI-37 | CI-38 | ||||
| 1 | propan-1-ol | <700 a,b | 483 a | 0.34 (0.03) | 0.29 (0.04) |
| 2 | pentanal | 705 a,b,c,d | 704 c | 1.76 (0.04) | 1.57 (0.02) |
| 3 | hexanal | 802 a,b,c,d | 801 c | 3.26 (0.02) | 3.14 (0.02) |
| 4 | hexan-1-ol | 867 a,b | 869 a | 0.33 (0.03) | 0.37 (0.03) |
| 5 | heptanal | 902 a,b,c,d | 901 c | 0.06 (0.01) | 0.11 (0.02) |
| 6 | α-pinene | 939 a,b,c | 932 c | 0.04 (0.01) | 0.06 (0.02) |
| 7 | benzaldehyde | 940 a,b,c | 952 c | 0.50 (0.02) | 0.47 (0.03) |
| 8 | 2-ethylhexan-1-ol | 1023 a,b | 1025 a | 0.07 (0.01) | 0.09 (0.02) |
| 9 | phenylmethanol | 1028 a,b,c | 1026 c | 5.47 (0.04) | 5.12 (0.04) |
| 10 | phenylacetaldehyde | 1044 a,b | 1044 a | 0.23 (0.03) | 0.27 (0.03) |
| 11 | nonanal | 1102 a,b,c,d | 1100 c | 0.14 (0.02) | 0.11 (0.02) |
| 12 | 3,4-dimethylcyclohexan-1-ol | 1115 a,b | 1126 a | 0.02 (0.01) | 0.03 (0.01) |
| 13 | phenylethanol | 1121 a,b | 1121 a | 0.15 (0.02) | 0.18 (0.04) |
| 14 | decanal | 1195 a,b,c,d | 1201 c | 0.14 (0.02) | 0.15 (0.02) |
| 15 | β-cyclocitral | 1221 c | 1217 c | 0.27 (0.03) | 0.33 (0.03) |
| 16 | 2-phenoxyethan-1-ol | 1225 a,b | 1226 a | 4.61 (0.05) | 4.47 (0.04) |
| 17 | bicycloelemene | 1316 a | 1330 a | 0.02 (0.01) | 0.02 (0.01) |
| 18 | δ-elemene | 1324 a,b,c | 1335 c | 0.49 (0.03) | 0.39 (0.06) |
| 19 | 204[M+](5) 121(100) 93(89) | 1343 | ND | 0.05 (0.01) | 0.07 (0.02) |
| 20 | 200[M+](39) 159(100) 117(95) | 1345 | ND | 0.05 (0.01) | 0.06 (0.01) |
| 21 | 202[M+](13) 81(100) 96(73) | 1350 | ND | 0.22 (0.02) | 0.29 (0.03) |
| 22 | 204[M+](10) 119(100) 91(84) | 1353 | ND | 0.05 (0.01) | 0.07 (0.01) |
| 23 | anastreptene | 1370 a | 1370 a | 31.14 (0.06) | 29.98 (0.05) |
| 24 | 204[M+](5) 81(100) 93(96) | 1384 | ND | 0.09 (0.01) | 0.13 (0.02) |
| 25 | β-elemene | 1391 a,b,c | 1389 c | 0.55 (0.03) | 0.65 (0.04) |
| 26 | 204[M+](13) 157(100) 185(84) | 1398 | ND | 0.08 (0.01) | 0.09 (0.01) |
| 27 | 204[M+](13) 157(100) 185(84) | 1417 | ND | 0.08 (0.01) | 0.07 (0.01) |
| 28 | 204[M+](19) 135(100) 105(82) | 1423 | ND | 0.12 (0.02) | 0.15 (0.02) |
| 29 | 204[M+](9) 91(100) 105(93) | 1425 | ND | 0.15 (0.01) | 0.13 (0.02) |
| 30 | (-)-aristolene | 1429 a,b,c,d | 1428 a | 0.75 (0.03) | 0.82 (0.04) |
| 31 | 204[M+](9) 107(100) 79(43) | 1432 | ND | 0.30 (0.04) | 0.34 (0.03) |
| 32 | γ-maaliene | 1435 a,b | 1427 a | 0.38 (0.03) | 0.41 (0.04) |
| 33 | α-maaliene | 1443 a,b | 1442 a | 0.12 (0.02) | 0.15 (0.05) |
| 34 | aromandendrene | 1445 a,b | 1447 a | 5.04 (0.05) | 5.12 (0.06) |
| 35 | selina-5,11-diene | 1447 a,b | 1454 a | 0.22 (0.05) | 0.29 (0.03) |
| 36 | dehydroaromadendrene | 1456 c | 1460 c | 2.35 (0.02) | 2.14 (0.03) |
| 37 | 1,2,9,10-tetradehydroaristolane | 1461 | ND | 0.91 (0.04) | 1.01 (0.02) |
| 38 | 204[M+](15) 91(100) 105(84) | 1465 | ND | 0.40 (0.03) | 0.45 (0.04) |
| 39 | 204[M+](18) 128(100) 143(95) | 1469 | ND | 0.06 (0.01) | 0.09 (0.02) |
| 40 | γ-gurjunene | 1474 c,d | 1475 c | 0.19 (0.04) | 0.21 (0.05) |
| 41 | γ-muurolene | 1477 c | 1478 c | 0.07 (0.01) | 0.04 (0.01) |
| 42 | δ-selinene | 1488 c | 1492 c | 2.63 (0.05) | 2.47 (0.03) |
| 43 | ledene | 1492 a,b,c | 1496 c | 1.88 (0.03) | 1.93 (0.02) |
| 44 | 204[M+](38) 105(100) 93(96) | 1495 | ND | 0.18 (0.02) | 0.22 (0.02) |
| 45 | bicyclogermacrene | 1499 a,b,c | 1500 c | 12.91 (0.03) | 13.01 (0.04) |
| 46 | 204[M+](19) 93(100) 91(95) | 1505 | ND | 0.11 (0.02) | 0.15 (0.03) |
| 47 | 202[M+](25) 133(100) 91(89) | 1509 | ND | 0.03 (0.01) | 0.05 (0.01) |
| 48 | 206[M+](14) 191(100) 57(38) | 1514 | ND | 0.22 (0.02) | 0.27 (0.04) |
| 49 | 202[M+](33) 131(100) 145(53) | 1518 | ND | 0.15 (0.01) | 0.12 (0.03) |
| 50 | δ-cadinene | 1524 a,b,c | 1522 c | 0.04 (0.01) | 0.06 (0.01) |
| 51 | 204[M+](5) 91(100) 131(95) | 1530 | ND | 0.03 (0.01) | 0.05 (0.01) |
| 52 | 200[M+](54) 185(100) 143(91) | 1535 | ND | - | - |
| 53 | 4,5,9,10-dehydro-isolongifolene | 1544 a,b | 1544 a | 2.00 (0.04) | 2.12 (0.03) |
| 54 | 202[M+](4) 128(100) 157(95) | 1547 | ND | 0.15 (0.03) | 0.21 (0.03) |
| 55 | 200[M+](8) 171(100) 186(79) | 1551 | ND | 0.10 (0.02) | 0.13 (0.04) |
| 56 | 200[M+](91) 129(100) 157(88) | 1556 | ND | 0.09 (0.02) | 0.11 (0.02) |
| 57 | 204[M+](8) 143(100) 157(98) | 1559 | ND | 0.23 (0.02) | 0.18 (0.03) |
| 58 | 204[M+](82) 173(100) 189(94) | 1563 | ND | 0.97 (0.05) | 1.01 (0.03) |
| 59 | palustrol | 1567 c | 1567 c | 4.95 (0.05) | 5.06 (0.04) |
| 60 | 200[M+](11) 79(100) 93(95) | 1570 | ND | 0.35 (0.04) | 0.28 (0.04) |
| 61 | 204[M+](31) 81(100) 109(88) | 1573 | ND | 0.74 (0.03) | 0.81 (0.04) |
| 62 | spathulenol | 1576 a,b,c | 1577 c | 0.54 (0.05) | 0.44 (0.03) |
| 63 | 200[M+](56) 185(100) 143(63) | 1581 | ND | 2.72 (0.03) | 2.81 (0.03) |
| 64 | 202[M+](4) 91(100) 79(82) | 1587 | ND | 0.18 (0.02) | 0.21 (0.03) |
| 65 | globulol | 1599 a,b,c,d | 1590 c | 1.51 (0.04) | 1.41 (0.04) |
| 66 | 200[M+](8) 198(100) 183(84) | 1605 | ND | - | - |
| 67 | 220[M+](2) 145(100) 200(93) | 1609 | ND | 0.11 (0.01) | 0.13 (0.04) |
| 68 | (+)-bisabola-2,10-diene[1,9]oxide | 1615 a,b | 1596 a | 0.31 (0.04) | 0.29 (0.03) |
| 69 | 208[M+](3) 95(100) 85(95) | 1621 | ND | 0.62 (0.03) | 0.67 (0.02) |
| 70 | ledene oxide-(II) | 1631 a,b | 1631 a | - | - |
| 71 | isospathulenol | 1635 a,b | 1633 a | 0.27 (0.02) | 0.37 (0.02) |
| 72 | 220[M+](18) 91(100) 105(83) | 1639 | ND | 0.81 (0.03) | 0.93 (0.04) |
| 73 | cubenol | 1642 a,b,c,d | 1645 c | 0.05 (0.01) | 0.03 (0.01) |
| 74 | 220[M+](21) 91(100) 105(82) | 1651 | ND | 0.06 (0.01) | 0.09 (0.01) |
| 75 | 222[M+](3) 179(100) 121(92) | 1655 | ND | 0.05 (0.01) | 0.07 (0.01) |
| 76 | germacra-4(15),5,10(14)-trien-1-α-ol | 1660 c | 1685 c | 0.23 (0.05) | 0.32 (0.03) |
| 77 | 216[M+](31) 145(100) 91(97) | 1699 | ND | 0.61 (0.05) | 0.59 (0.03) |
| 78 | 1,4-dimethyl-7-(1-methylethyl)-azulene | 1790 c | 1779 c | 0.59 (0.03) | 0.64 (0.04) |
| 79 | 14-hydroxy-δ-cadinene | 1797 c | 1803 c | 0.26 (0.03) | 0.33 (0.02) |
| Total | 97.95 (1.97) | 97.50 (2.13) | |||
| % identified | 87.79 (1.29) | 86.47 (1.31) | |||
| including: | |||||
| aliphatics | 6.12 (0.19) | 5.86 (0.20) | |||
| aromatics | 10.96 (0.16) | 10.51 (0.18) | |||
| monoterpene hydrocarbons | 0.04 (0.01) | 0.06 (0.02) | |||
| monoterpenoid hydrocarbons | 0.27 (0.03) | 0.33 (0.03) | |||
| sesquiterpene hydrocarbons | 62.28 (0.61) | 61.46 (0.66) | |||
| sesquiterpenoid hydrocarbons | 8.12 (0.29) | 8.25 (0.22) | |||
| No. | Compounds * | RI ** | RI *** | Spring (May) | Summer (July) | Autumn (September) | In Vitro Culture |
|---|---|---|---|---|---|---|---|
| 1 | propan-1-ol | <700 a,b | 483 a | 1.10 (0.08) | 0.40 (0.06) | 1.35 (0.08) | 0.32 (0.04) |
| 2 | pentanal | 705 a,b,c,d | 704 c | 0.33 (0.05) | 0.31 (0.03) | 0.42 (0.03) | 1.67 (0.13) |
| 3 | hexanal | 802 a,b,c,d | 801 c | 0.20 (0.02) | 0.07 (0.02) | 0.41 (0.02) | 3.20 (0.08) |
| 4 | hexan-1-ol | 867 a,b | 869 a | 0.50 (0.04) | 0.32 (0.02) | 0.29 (0.03) | 0.35 (0.03) |
| 5 | heptanal | 902 a,b,c,d | 901 c | 0.05 (0.03) | 0.04 (0.01) | 0.03 (0.01) | 0.09 (0.04) |
| 6 | α-pinene | 939 a,b,c | 932 c | 0.03 (0.02) | 0.02 (0.01) | 0.04 (0.01) | 0.05 (0.01) |
| 7 | benzaldehyde | 940 a,b,c | 952 c | 0.20 (0.04) | 0.09 (0.02) | 0.48 (0.04) | 0.49 (0.02) |
| 8 | 2-ethylhexan-1-ol | 1023 a,b | 1025 a | 0.08 (0.03) | 0.04 (0.01) | 0.21 (0.03) | 0.08 (0.01) |
| 9 | phenylmethanol | 1028 a,b,c | 1026 c | 1.11 (0.06) | 1.03 (0.05) | 1.03 (0.05) | 5.30 (0.25) |
| 10 | phenylacetaldehyde | 1044 a,b | 1044 a | 1.17 (0.05) | 0.21 (0.02) | 1.70 (0.04) | 0.25 (0.03) |
| 11 | nonanal | 1102 a,b,c,d | 1100 c | 0.10 (0.03) | 0.02 (0.01) | 0.11 (0.02) | 0.13 (0.02) |
| 12 | 3,4-dimethylcyclohexan-1-ol | 1115 a,b | 1126 a | 0.10 (0.02) | 0.03 (0.02) | 0.10 (0.02) | 0.03 (0.01) |
| 13 | phenylethanol | 1121 a,b | 1121 a | 0.13 (0.02) | 0.69 (0.04) | 0.58 (0.03) | 0.17 (0.02) |
| 14 | decanal | 1195 a,b,c,d | 1201 c | 0.06 (0.02) | 0.03 (0.02) | 0.07 (0.02) | 0.15 (0.01) |
| 15 | β-cyclocitral | 1221 c | 1217 c | 0.07 (0.02) | 0.04 (0.01) | 0.05 (0.01) | 0.30 (0.04) |
| 16 | 2-phenoxyethan-1-ol | 1225 a,b | 1226 a | 0.94 (0.05) | 0.41 (0.02) | 1.24 (0.08) | 4.54 (0.10) |
| 17 | bicycloelemene | 1316 a | 1330 a | 0.12 (0.03) | 0.08 (0.01) | 0.07 (0.02) | 0.02 (0.00) |
| 18 | δ-elemene | 1324 a,b,c | 1335 c | 0.76 (0.06) | 1.98 (0.26) | 0.71 (0.02) | 0.44 (0.07) |
| 19 | 204[M+](5) 121(100) 93(89) | 1343 | ND | 0.19 (0.04) | 0.42 (0.05) | 0.13 (0.02) | 0.06 (0.01) |
| 20 | 200[M+](39) 159(100) 117(95) | 1345 | ND | 1.05 (0.06) | 0.72 (0.12) | 1.28 (0.03) | 0.06 (0.01) |
| 21 | 202[M+](13) 81(100) 96(73) | 1350 | ND | 0.12 (0.04) | 0.20 (0.02) | 0.12 (0.02) | 0.26 (0.05) |
| 22 | 204[M+](10) 119(100) 91(84) | 1353 | ND | 0.06 (0.02) | 0.07 (0.02) | 0.10 (0.01) | 0.06 (0.01) |
| 23 | anastreptene | 1370 a | 1370 a | 18.07 (0.12) | 25.26 (0.10) | 15.61 (0.25) | 30.56 (0.82) |
| 24 | 204[M+](5) 81(100) 93(96) | 1384 | ND | 0.20 (0.04) | 0.16 (0.03) | 0.18 (0.04) | 0.11 (0.03) |
| 25 | β-elemene | 1391 a,b,c | 1389 c | 2.77 (0.06) | 2.21 (0.24) | 1.29 (0.03) | 0.60 (0.07) |
| 26 | 204[M+](13) 157(100) 185(84) | 1398 | ND | 0.28 (0.06) | 0.22 (0.03) | 0.23 (0.03) | 0.09 (0.01) |
| 27 | 204[M+](13) 157(100) 185(84) | 1417 | ND | 0.28 (0.07) | 0.25 (0.03) | 0.34 (0.03) | 0.08 (0.01) |
| 28 | 204[M+](19) 135(100) 105(82) | 1423 | ND | 0.21 (0.05) | 0.30 (0.05) | 0.16 (0.03) | 0.14 (0.02) |
| 29 | 204[M+](9) 91(100) 105(93) | 1425 | ND | 0.04 (0.02) | 0.08 (0.02) | 0.04 (0.02) | 0.14 (0.01) |
| 30 | (-)-aristolene | 1429 a,b,d | 1428 a | 1.04 (0.07) | 0.72 (0.05) | 1.19 (0.04) | 0.79 (0.05) |
| 31 | 204[M+](9) 107(100) 79(43) | 1432 | ND | 0.17 (0.04) | 0.24 (0.04) | 0.13 (0.02) | 0.32 (0.03) |
| 32 | γ-maaliene | 1435 a | 1427 a | 0.50 (0.03) | 0.50 (0.09) | 0.22 (0.04) | 0.40 (0.02) |
| 33 | α-maaliene | 1443 a | 1442 a | 0.32 (0.04) | 0.41 (0.08) | 0.25 (0.04) | 0.14 (0.02) |
| 34 | aromandendrene | 1445 a,b | 1447 a | 3.18 (0.10) | 6.96 (0.74) | 3.25 (0.08) | 5.08 (0.06) |
| 35 | selina-5,11-diene | 1447 a,b | 1454 a | 0.55 (0.08) | 0.73 (0.09) | 0.29 (0.03) | 0.26 (0.05) |
| 36 | dehydroaromadendrene | 1456 c | 1460 c | 1.14 (0.08) | 1.49 (0.08) | 1.16 (0.07) | 2.25 (0.15) |
| 37 | 1,2,9,10-tetradehydroaristolane | 1461 | ND | 0.46 (0.04) | 1.14 (0.13) | 0.48 (0.04) | 0.96 (0.07) |
| 38 | 204[M+](15) 91(100) 105(84) | 1465 | ND | 0.35 (0.07) | 0.36 (0.06) | 0.30 (0.06) | 0.43 (0.04) |
| 39 | 204[M+](18) 128(100) 143(95) | 1469 | ND | 0.31 (0.04) | 0.37 (0.05) | 0.36 (0.03) | 0.08 (0.02) |
| 40 | γ-gurjunene | 1474 c,d | 1475 c | 0.48 (0.05) | 0.46 (0.05) | 0.31(0.03) | 0.20 (0.01) |
| 41 | γ-muurolene | 1477 c | 1478 c | 0.16 (0.04) | 0.22 (0.04) | 0.11 (0.02) | 0.06 (0.02) |
| 42 | δ-selinene | 1488 c | 1492 c | 1.42 (0.12) | 2.17 (0.07) | 1.05 (0.06) | 2.55 (0.11) |
| 43 | ledene | 1492 a,b,c | 1496 c | 1.63 (0.06) | 1.98 (0.09) | 1.40 (0.14) | 1.91 (0.04) |
| 44 | 204[M+](38) 105(100) 93(96) | 1495 | ND | 0.28 (0.08) | 0.21 (0.05) | 0.08 (0.02) | 0.20 (0.03) |
| 45 | bicyclogermacrene | 1499 a,b,c | 1500 c | 8.37 (0.09) | 17.35 (0.60) | 7.53 (0.29) | 12.96 (0.07) |
| 46 | 204[M+](19) 93(100) 91(95) | 1505 | ND | 0.18 (0.05) | 0.45 (0.14) | 0.15 (0.03) | 0.13 (0.03) |
| 47 | 202[M+](25) 133(100) 91(89) | 1509 | ND | 0.20 (0.04) | 0.12 (0.04) | 0.19 (0.04) | 0.04 (0.01) |
| 48 | 206[M+](14) 191(100) 57(38) | 1514 | ND | 0.22 (0.04) | 0.18 (0.09) | 0.13 (0.03) | 0.25 (0.04) |
| 49 | 202[M+](33) 131(100) 145(53) | 1518 | ND | 0.19 (0.03) | 0.41 (0.05) | 0.19 (0.02) | 0.14 (0.02) |
| 50 | δ-cadinene | 1524 a,b,c | 1522 c | 0.31 (0.04) | 0.12 (0.03) | 0.33 (0.04) | 0.05 (0.01) |
| 51 | 204[M+](5) 91(100) 131(95) | 1530 | ND | 0.10 (0.03) | 0.17 (0.03) | 0.09 (0.03) | 0.04 (0.01) |
| 52 | 200[M+](54) 185(100) 143(91) | 1535 | ND | 0.15 (0.03) | - | 0.20 (0.03) | - |
| 53 | 4,5,9,10-dehydro-isolongifolene | 1544 a,b | 1544 a | 6.29 (0.12) | 4.49 (0.24) | 8.53 (0.21) | 2.06 (0.08) |
| 54 | 202[M+](4) 128(100) 157(95) | 1547 | ND | 0.69 (0.04) | 0.75 (0.06) | 1.54 (0.08) | 0.18 (0.04) |
| 55 | 200[M+](8) 171(100) 186(79) | 1551 | ND | 0.19 (0.05) | 0.09 (0.02) | 0.19 (0.02) | 0.12 (0.02) |
| 56 | 200[M+](91) 129(100) 157(88) | 1556 | ND | 0.09 (0.04) | 0.06 (0.02) | 0.11 (0.02) | 0.10 (0.01) |
| 57 | 204[M+](8) 143(100) 157(98) | 1559 | ND | 0.08 (0.03) | 0.05 (0.02) | 0.06 (0.02) | 0.21 (0.04) |
| 58 | 204[M+](82) 173(100) 189(94) | 1563 | ND | 1.42 (0.06) | 1.21 (0.02) | 1.60 (0.04) | 0.99 (0.03) |
| 59 | palustrol | 1567 c | 1567 c | 8.31 (0.10) | 5.33 (0.15) | 9.86 (0.05) | 5.01 (0.08) |
| 60 | 200[M+](11) 79(100) 93(95) | 1570 | ND | 0.71 (0.15) | 0.52 (0.09) | 0.51 (0.04) | 0.32 (0.05) |
| 61 | 204[M+](31) 81(100) 109(88) | 1573 | ND | 2.03 (0.07) | 2.02 (0.27) | 0.90 (0.03) | 0.78 (0.05) |
| 62 | spathulenol | 1576 a,b,c | 1577 c | 7.70 (0.24) | 2.65 (0.06) | 5.00 (0.06) | 0.49 (0.07) |
| 63 | 200[M+](56) 185(100) 143(63) | 1581 | ND | 3.61 (0.06) | 2.48 (0.08) | 5.48 (0.14) | 2.77 (0.06) |
| 64 | 202[M+](4) 91(100) 79(82) | 1587 | ND | 0.49 (0.05) | 0.31 (0.03) | 0.48 (0.02) | 0.20 (0.02) |
| 65 | globulol | 1599 a,b,c,d | 1590 c | 3.05 (0.12) | 1.37 (0.13) | 3.04 (0.07) | 1.46 (0.07) |
| 66 | 200[M+](8) 198(100) 183(84) | 1605 | ND | 0.23 (0.04) | - | 0.27 (0.06) | - |
| 67 | 220[M+](2) 145(100) 200(93) | 1609 | ND | 1.20 (0.06) | 0.09 (0.01) | 2.13 (0.08) | 0.12 (0.01) |
| 68 | (+)-bisabola-2,10-diene[1,9]oxide | 1615 a,b | 1596 a | 0.17 (0.05) | 0.30 (0.02) | 0.18 (0.03) | 0.30 (0.01) |
| 69 | 208[M+](3) 95(100) 85(95) | 1621 | ND | 0.75 (0.07) | 0.56 (0.16) | 1.35 (0.16) | 0.65 (0.04) |
| 70 | ledene oxide-(II) | 1631 a,b | 1631 a | 0.23 (0.03) | - | 0.21 (0.04) | - |
| 71 | isospathulenol | 1635 a,b | 1633 a | 0.57 (0.05) | 0.35 (0.04) | 0.93 (0.05) | 0.32 (0.07) |
| 72 | 220[M+](18) 91(100) 105(83) | 1639 | ND | 1.87 (0.14) | 0.74 (0.03) | 1.58 (0.04) | 0.87 (0.08) |
| 73 | cubenol | 1642 a,b,c,d | 1645 c | 0.48 (0.06) | 0.08 (0.02) | 0.47 (0.06) | 0.04 (0.01) |
| 74 | 220[M+](21) 91(100) 105(82) | 1651 | ND | 0.10 (0.02) | 0.04 (0.01) | 0.09 (0.01) | 0.08 (0.02) |
| 75 | 222[M+](3) 179(100) 121(92) | 1655 | ND | 0.03 (0.02) | 0.05 (0.01) | 0.04 (0.01) | 0.06 (0.01) |
| 76 | germacra-4(15),5,10(14)-trien-1-α-ol | 1660 c | 1685 c | 0.59 (0.05) | 0.89 (0.03) | 0.95 (0.07) | 0.28 (0.06) |
| 77 | 216[M+](31) 145(100) 91(97) | 1699 | ND | 0.43 (0.04) | 0.20 (0.04) | 0.60 (0.06) | 0.60 (0.01) |
| 78 | 1,4-dimethyl-7-(1-methylethyl)-azulene | 1790 c | 1779 c | 2.70 (0.06) | 1.22 (0.10) | 3.35 (0.17) | 0.62 (0.04) |
| 79 | 14-hydroxy-δ-cadinene | 1797 c | 1803 c | 0.34 (0.06) | 0.12 (0.05) | 0.39 (0.02) | 0.30 (0.05) |
| Total | 96.38 (4.42) | 98.43 (5.75) | 97.60 (3.96) | 97.91 (3.90) | |||
| % identified | 77.88 (2.63) | 84.33 (3.96) | 76.27 (2.59) | 87.23 (3.02) | |||
| including: | |||||||
| aliphatics | 2.52 (0.32) | 1.26 (0.20) | 2.99 (0.26) | 6.02 (0.37) | |||
| aromatics | 3.55 (0.22) | 2.43 (0.15) | 5.03 (0.24) | 10.75 (0.42) | |||
| monoterpene hydrocarbons | 0.03 (0.02) | 0.02 (0.01) | 0.04 (0.01) | 0.05 (0.01) | |||
| monoterpenoid hydrocarbons | 0.07 (0.02) | 0.04 (0.01) | 0.05 (0.01) | 0.30 (0.01) | |||
| sesquiterpene hydrocarbons | 50.27 (1.29) | 69.49 (3.09) | 47.13 (1.62) | 61.91 (1.76) | |||
| sesquiterpenoid hydrocarbons | 21.44 (0.76) | 11.09 (0.50) | 21.03 (0.45) | 8.20 (0.42) |
| No. | Compounds | Spring | Summer | Autumn | In Vitro |
|---|---|---|---|---|---|
| Highest loading (≥95%) in PC1 | |||||
| 1 | 2-propanol | 0.95–1.19 | 0.29–0.48 | 1.21–1.45 | 0.29–0.34 |
| 10 | benzeneacetaldehyde | 1.09–1.24 | 0.18–0.25 | 1.63–1.75 | 0.23–0.27 |
| 23 | anastreptene | 17.87–18.23 | 25.06–25.41 | 15.27–16.01 | 29.98–31.14 |
| 30 | (-)-aristolene | 0.91–1.18 | 0.63–0.80 | 1.11–1.25 | 0.75–0.82 |
| 42 | δ-selinene | 1.24–1.58 | 2.01–2.25 | 0.96–1.14 | 2.47–2.63 |
| 45 | bicyclogermacrene | 8.24–8.51 | 16.27–18.09 | 6.99–7.87 | 12.91–13.01 |
| 52 | 200[M+](54) 185(100) 143(91) | 0.10–0.21 | 0.00–0.00 | 0.16–0.25 | 0.00–0.00 |
| 59 | palustrol | 8.14–8.46 | 5.09–5.58 | 9.78–9.94 | 4.95–5.06 |
| 65 | globulol | 2.87–3.32 | 1.07–1.52 | 2.94–3.15 | 1.41–1.51 |
| 67 | 220[M+](2) 145(100) 200(93) | 1.11–1.31 | 0.06–0.11 | 1.99–2.22 | 0.11–0.13 |
| 78 | 1,4-dimethyl-7-(1-methylethyl)-azulene | 2.59–2.77 | 1.06–1.33 | 3.02–3.56 | 0.59–0.64 |
| Highest loading (≥75%) in PC2 | |||||
| 2 | pentanal | 0.25–0.39 | 0.26–0.35 | 0.36–0.47 | 1.57–1.76 |
| 3 | hexanal | 0.16–0.23 | 0.04–0.09 | 0.38–0.45 | 3.14–3.26 |
| 9 | benzenemethanol | 1.03–1.21 | 0.96–1.11 | 0.97–1.11 | 5.12–5.47 |
| 16 | phenoxyethanol | 0.87–1.01 | 0.37–0.45 | 1.11–1.35 | 4.47–4.61 |
| 39 | 204[M+](18) 128(100) 143(95) | 0.26–0.37 | 0.25–0.44 | 0.29–0.40 | 0.06–0.09 |
| 57 | 204[M+](8) 143(100) 157(98) | 0.04–0.12 | 0.02–0.07 | 0.03–0.08 | 0.18–0.23 |
| Highest loading (≥85%) in PC3 | |||||
| 4 | 1-hexanol | 0.41–0.56 | 0.29–0.35 | 0.25–0.33 | 0.33–0.37 |
| 13 | benzeneethanol | 0.09–0.16 | 0.63–0.75 | 0.54–0.62 | 0.15–0.18 |
| 76 | germacra-4(15),5,10(14)-trien-1-α-ol | 0.47–0.65 | 0.83–0.95 | 0.83–1.03 | 0.23–0.32 |
Disclaimer/Publisher’s Note: The statements, opinions and data contained in all publications are solely those of the individual author(s) and contributor(s) and not of MDPI and/or the editor(s). MDPI and/or the editor(s) disclaim responsibility for any injury to people or property resulting from any ideas, methods, instructions or products referred to in the content. |
© 2023 by the authors. Licensee MDPI, Basel, Switzerland. This article is an open access article distributed under the terms and conditions of the Creative Commons Attribution (CC BY) license (https://creativecommons.org/licenses/by/4.0/).
Share and Cite
Wawrzyniak, R.; Guzowska, M.; Wasiak, W.; Jasiewicz, B.; Bączkiewicz, A.; Buczkowska, K. Seasonal Variability of Volatile Components in Calypogeia integristipula. Molecules 2023, 28, 7276. https://doi.org/10.3390/molecules28217276
Wawrzyniak R, Guzowska M, Wasiak W, Jasiewicz B, Bączkiewicz A, Buczkowska K. Seasonal Variability of Volatile Components in Calypogeia integristipula. Molecules. 2023; 28(21):7276. https://doi.org/10.3390/molecules28217276
Chicago/Turabian StyleWawrzyniak, Rafał, Małgorzata Guzowska, Wiesław Wasiak, Beata Jasiewicz, Alina Bączkiewicz, and Katarzyna Buczkowska. 2023. "Seasonal Variability of Volatile Components in Calypogeia integristipula" Molecules 28, no. 21: 7276. https://doi.org/10.3390/molecules28217276
APA StyleWawrzyniak, R., Guzowska, M., Wasiak, W., Jasiewicz, B., Bączkiewicz, A., & Buczkowska, K. (2023). Seasonal Variability of Volatile Components in Calypogeia integristipula. Molecules, 28(21), 7276. https://doi.org/10.3390/molecules28217276