Abstract
To systematically and comprehensively investigate the metabolic characteristics of coloring substances and floral aroma substances in Camellia oleifera petals with different colors, ultrahigh-performance liquid chromatography–mass spectrometry (UPLC–MS/MS) and headspace solid phase microextraction and gas chromatography–mass spectrometry (HS–SPME–GC–MS) metabolomics methods were applied to determine the metabolic profiles of white, candy-pink and dark-red petals. The results revealed that 270 volatile organic compounds were detected, mainly terpenoids, heterocyclic, esters, hydrocarbons, aldehydes, and alcohols, in which phenylethyl alcohol, lilac alcohol, and butanoic acid, 1-methylhexyl ester, hotrienol, alpha-terpineol and 7-Octen-4-ol, 2-methyl-6-methylene-, (S)-, butanoic acid, 2-methyl-, 2-methylbutyl ester, 2,4-Octadienal, (E,E)- could act as the floral scent compounds. A total of 372 flavonoid compounds were identified, and luteolin, kaempferol, cyanidin and peonidin derivatives were considered as the main coloring substances for candy-pink and dark-red petal coloration. In conclusion, this study intuitively and quantitatively exhibited the variations in flower color and floral scent of C. oleifera petal with different colors caused by changes in variations of flavonoids and volatile organic compound composition, and provided useful data for improving the sensory quality and breeding of C. oleifera petals.
1. Introduction
Camellia oleifera, belonging to Camellia in Theaceae, is a unique woody oil plant in China with high oil content [1]. C. oleifera flowers are complete flowers with high ornamental value [2]. The petals are generally white, and a few are pink or red, with unique delicate fragrance and sweetness [3]. C. oleifera petals are rich in phenolic compounds and volatile compounds, including phenolic acids, flavonoids, alcohols, ketones, aromatic hydrocarbons, esters and aldehydes, which are the most important secondary metabolites [4,5]. In addition, C. oleifera petals are abundant in biochemical components such as amino acids, proteins, tea polysaccharides and saponins, which have significant antioxidant, lipid-lowering, anti-allergy, hypoglycemic, gastrointestinal protection and immunity-enhancement functions [6].
Petal color is the typical target of research in ornamental plants, as flowers attract pollinators, absorb ultraviolet (UV) radiation, and decorate the environment [7,8]. Petals’ color diversity is mainly caused by the pigment types and contents [9]. Pigment compounds are widely distributed in plant tissues, and the three main types controlling petal color are flavonoids, carotenoids and betaines [10,11]. Camellia oleifera petals have been the subject of recent studies due to the plant’s status as an ornamental plant [12]. The pigments in Camellia petals are mainly flavonoids (especially anthocyanins), which are contributed to the formation of pink and red petals [7,13]. Cyanidin-core structure pigments (such as cyanidin 3,5-di-O-glucoside) have the potential to produce the most dominant phenotype among wild red-flowered Camellia species in China [14]. Cyanidin-3-O-(6″-O-malonyl) glucoside was the main anthocyanin component in the Camellia japonica petals, while cyanidin-3-O-rutinoside, peonidin-3-O-glucoside, cyanidin-3-Oglucoside, and pelargonidin-3-O-glucoside were responsible for the color intensity of the C. japonica petals [7]. Further research on these pigments will have important guiding significance for exploring the molecular regulation mechanism of flower color change in C. oleifera.
Flower fragrance is an important trait of ornamental plants and the main basis for evaluating the quality of flowers [15,16]. Volatile organic compounds (VOCs) emitted from flowers are mainly divided into three groups: terpenoids, phenylpropanoids/benzenoids, and fatty acid derivatives [17,18]. The content of volatile substances in C. oleifera petals is obviously different due to different flowering periods and varieties. Amounts of 22 fatty acid derivatives, 12 aromatic compounds and 2 terpenoids were identified from C. oleifera flowers, while the VOCs in nectar were mainly fatty acid derivatives. Amounts of 26, 36 and 48 aroma compounds were identified from C. japonica, C. oleifera, and Camellia sinensis, in which eugenol and decylacetate were the characteristic compounds in C. japonica petal, dihydro-3-methyl-2(3H)-furanone and myrcene were the characteristic compounds in C. oleifera petal, and 6,10,14-trimethyl-2-pentadecanone and citral were the characteristic compounds in C. sinensis petal [19]. A total of 5 terpenes, 1 aromatic hydrocarbons, 1 alkanes and 1 esters were found in Siraitia grosvenorii, in which the terpenes occupied a relative content of 71.07%, ranking the highest content [20]. Robin et al. found that the contents of volatile substances such as linalool, geranyl, linalool oxide, acetophenone, pentadienal, benzaldehyde and caproic acid were higher in tea flower petals during the flowering phase [21]. The five most abundant compounds, including beta-cis-ocimene, cis linalool oxide, lilac alcohol, phenylethyl alcohol, and 6-ethenyldihydro-2,2,6-trimethyl-2H-Pyran-3(4 H)-one were identified from 22 species within genus Camellia. L-linaloo was the compound with the highest relative amount (75.94%) in the flowers of 12 Camellia species, followed by (Z)-3-Hexenyl acetate (42.48%), Heptan-2-one (31.67%), (Z)-3-Hexen-1-ol (23.79%), and (S)-2-Heptanol (20.95%) [22].
Petal color and fragrances in C. oleifera are very diverse, and flower color and scent have always been the important characters in the selection process [23,24]. However, the research on C. oleifera is mainly concentrated in seedling-raising techniques, cultivation and management techniques, stress resistance study and so on. The investigations on characteristics of key coloring substances and VOCs in C. oleifera petals have not been reported. Here, ultrahigh-performance liquid chromatography–mass spectrometry (UPLC–MS/MS) and headspace solid phase microextraction and gas chromatography–mass spectrometry (HS–SPME–GC–MS) were employed to identify and quantify the differential flavonoids and VOCs in C. oleifera petals with different color. The complete chemical characterization of flavonoids and VOCs in C. oleifera petals was established to understand the petals’ color and fragrance variations. The results laid a metabolic foundation for further revealing the flower color and the VOCs variations in C. oleifera petals, and provided valuable information for understanding the flower color and scent change mechanism and metabolic pathways in C. oleifera petals.
2. Results
2.1. Analysis of Metabolite Profiling in C. oleifera Petals with Different Color
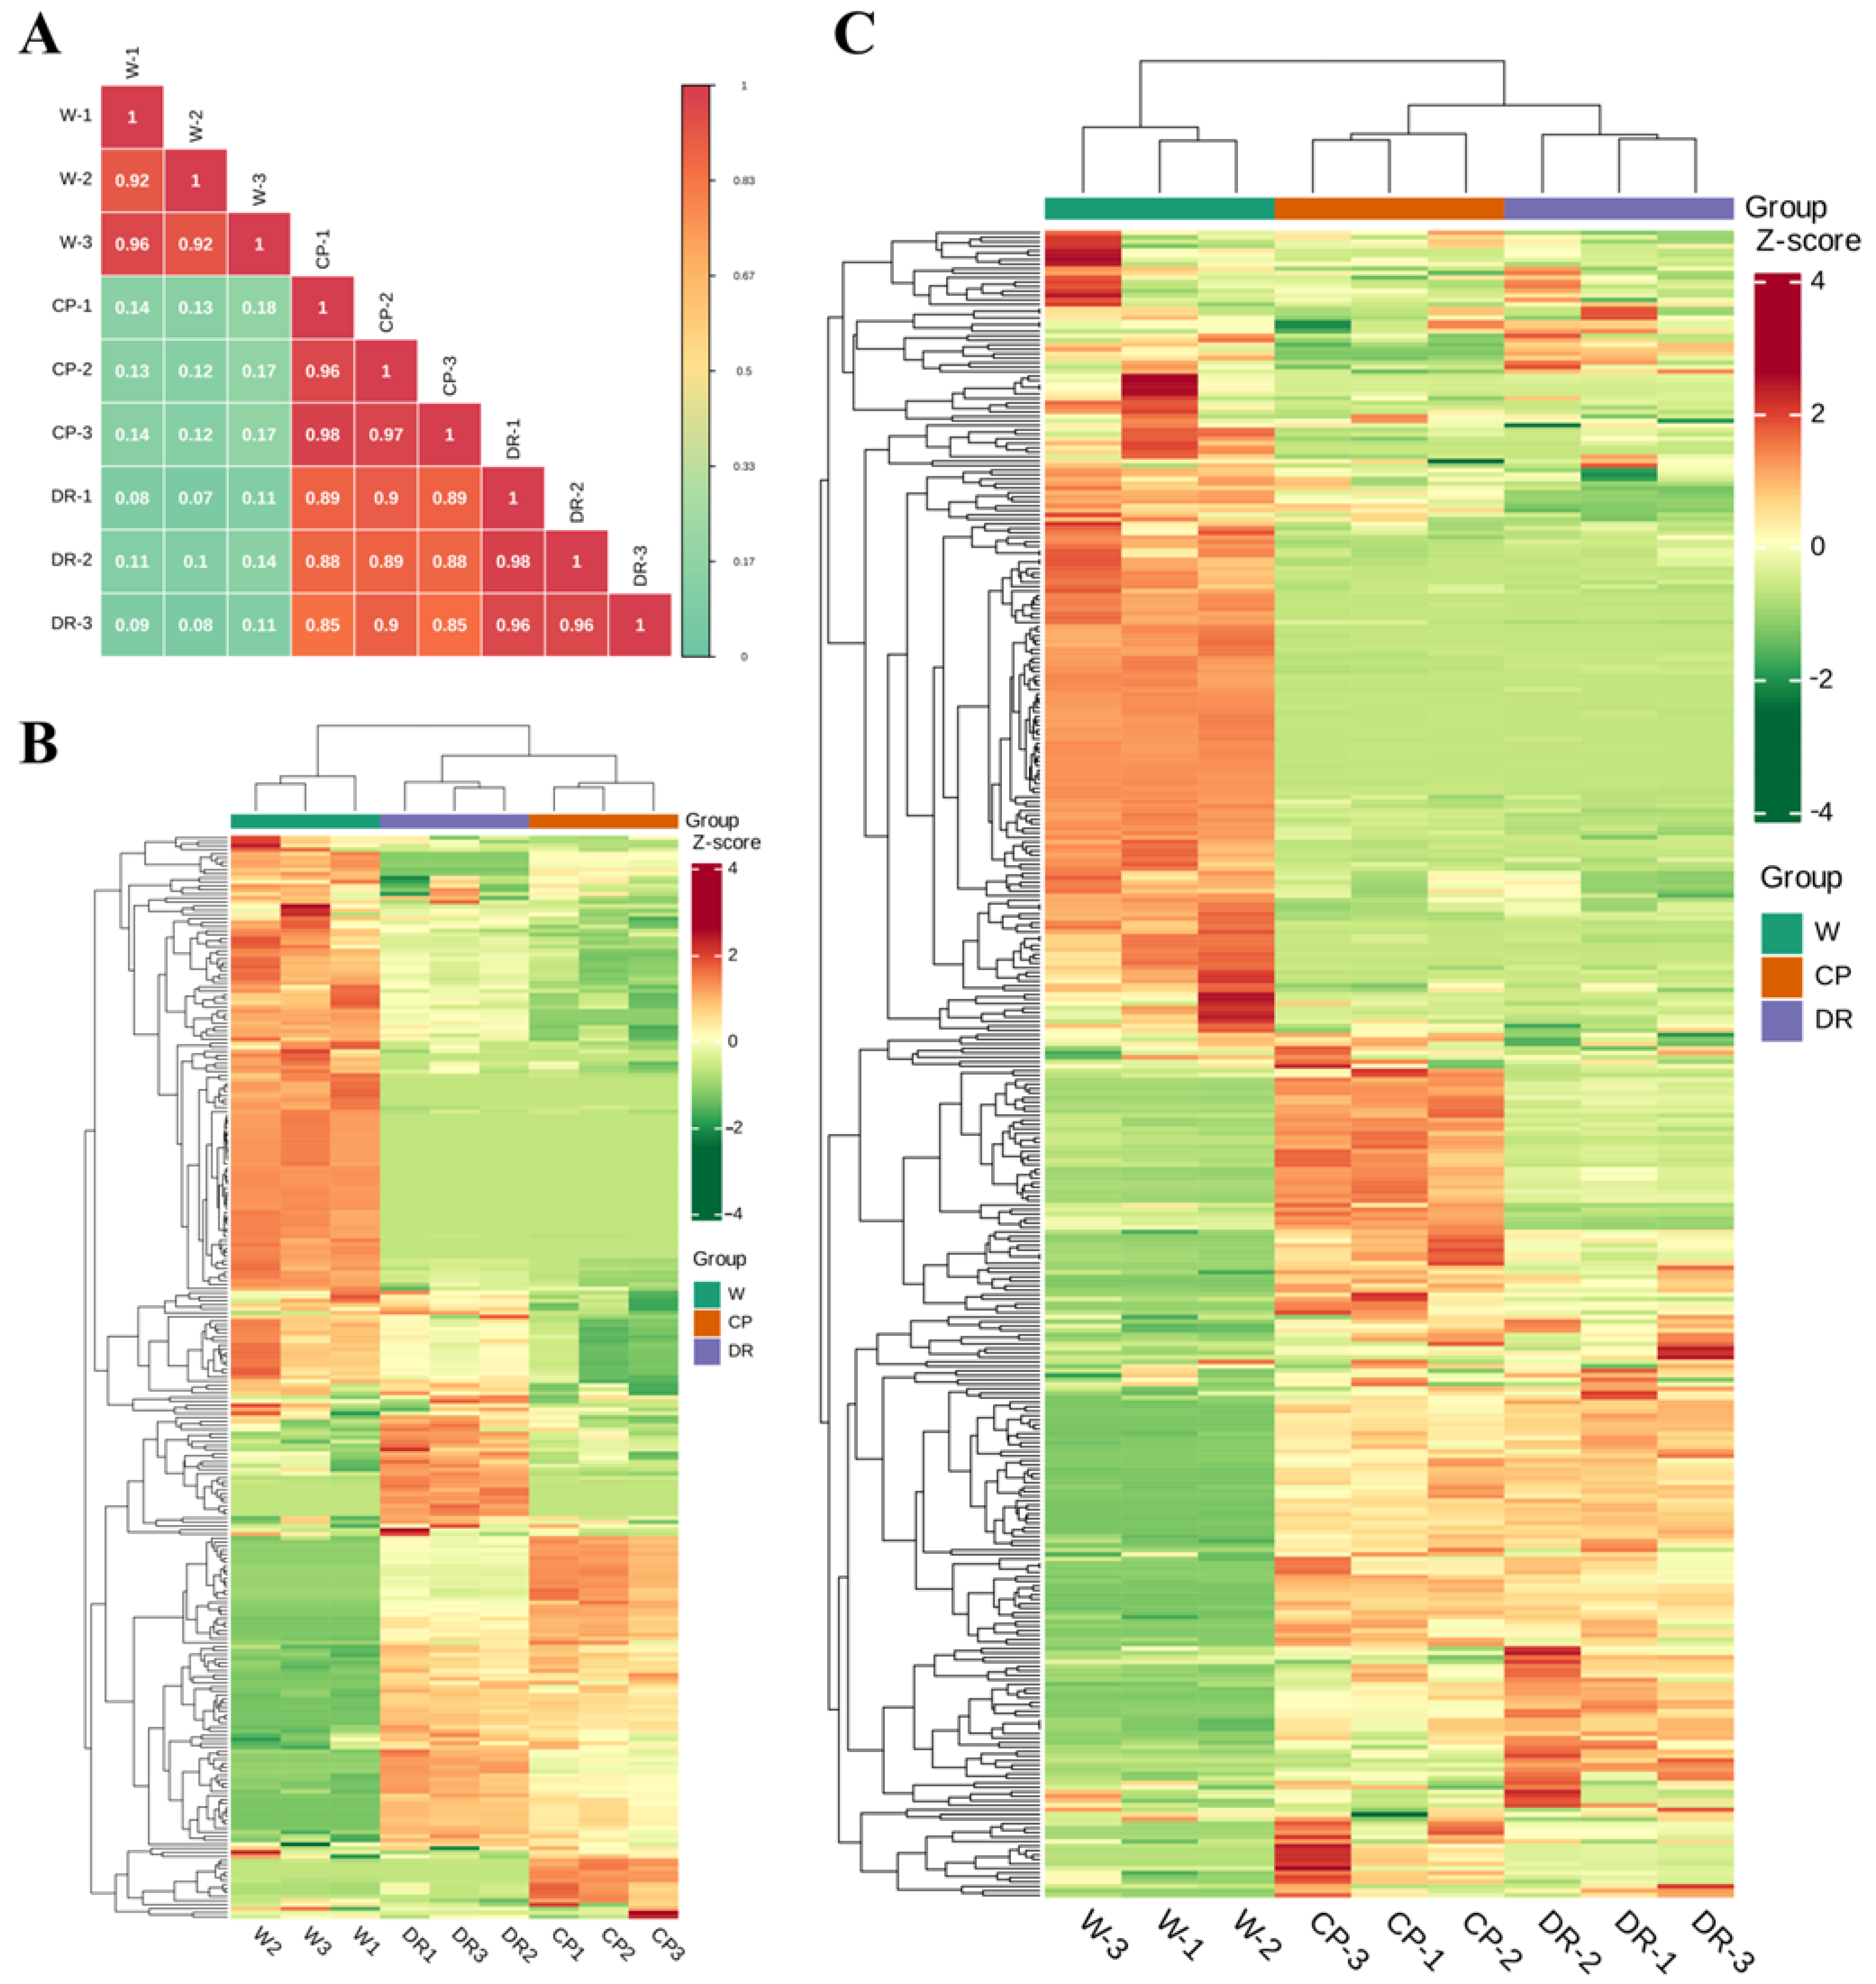
To further understand differences of flavonoids and volatile profiling in C. oleifera petals with different colors, the flavonoids and VOCs were determined by UPLC–MS/MS and HS–SPME–GC–MS. Pearson’s correlation coefficient r was applied to evaluate the biological repeatability of each group of the petal samples. When r2 was close to 1, the correlation between the two repeated samples was stronger, which indicated that the metabolite data had good homogeneity (Figure 1A).
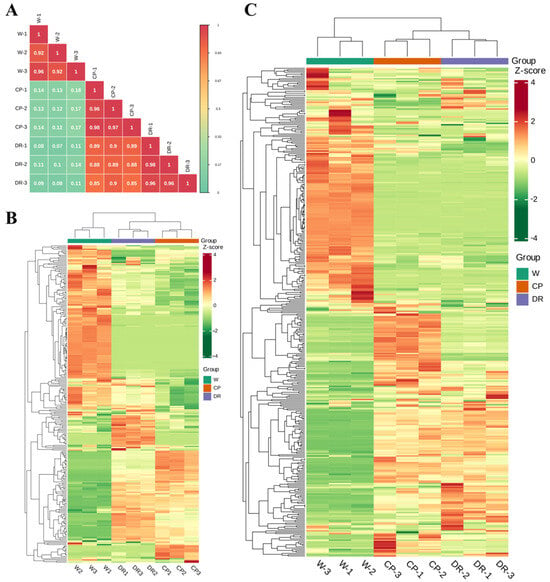
Figure 1.
Differential petals chemotype in C. oleifera petals with different color, W = white petals, CP = candy-pink petal, DR = dark-red petal. (A): Correlation analysis of three C. oleifera petals based on identified VOCs and flavonoids; (B): Heatmap of the 270 VOCs identified in three C. oleifera petals with three biological replicates; (C): Heatmap of flavonoids identified in three C. oleifera petals with three biological replicates. The relative content values of all metabolites were denoted with a unique color, among which red color indicated a high accumulation level, and green color indicated a low accumulation level.
Based on the quality evaluation, there were significant differences in the levels of VOCs among the W, CP, and DR petals (Figure 1B). A total of 270 VOCs were tentatively detected and identified, including 49 terpenoids, 47 heterocyclic compounds, 43 esters, 30 hydrocarbons, 27 aldehydes, 23 alcohols, 17 ketones, 8 amines, 6 phenols, 6 nitrogen compounds, 5 acids, 4 aromatics, 3 sulfur compounds, and 2 others (Table S1), which indicated that terpenoids, esters, heterocyclic compound, hydrocarbons, and alcohol were the main VOCs in C. oleifera petals. Moreover, the relative content of VOCs in W petals was significantly different from that in CP and DR petals. Cluster analysis of the detected petal samples and metabolites indicated that there were significant differences in VOC accumulation patterns in the three petals samples, indicating that there were significant differences in the composition of the three petals (Figure 1B).
Qualitative and quantitative analysis of flavonoid metabolites in W, CP, and DR petals by UPLC-MS/MS was carried out, and a total of 372 flavonoid metabolite species were detected and quantified, including 26 proanthocyanidins, 8 biflavones, 38 tannins, 22 flavanols, 83 flavonols, 85 flavonoids, 27 anthocyanins, 11 dihydroflavonols, 27 flavanones, 6 aurones, 23 chalcones (including C-glucosylquinochalcones), and 9 others (Table S2). Nine samples could be clearly divided into three groups based on the HCA heatmap (Figure 1C). Interestingly, a clear separation was found between W, CP, and DR petals, demonstrating that the accumulation of flavonoids in the three petals were obviously distinct. The above statistical results demonstrated that all petal samples had good repeatability, and the data of flavonoid metabolites were reliable, and were suitable for further qualitative and quantitative analysis.
2.2. PCA and OPLS-DA of the Three C. oleifera Petals with Different Colors
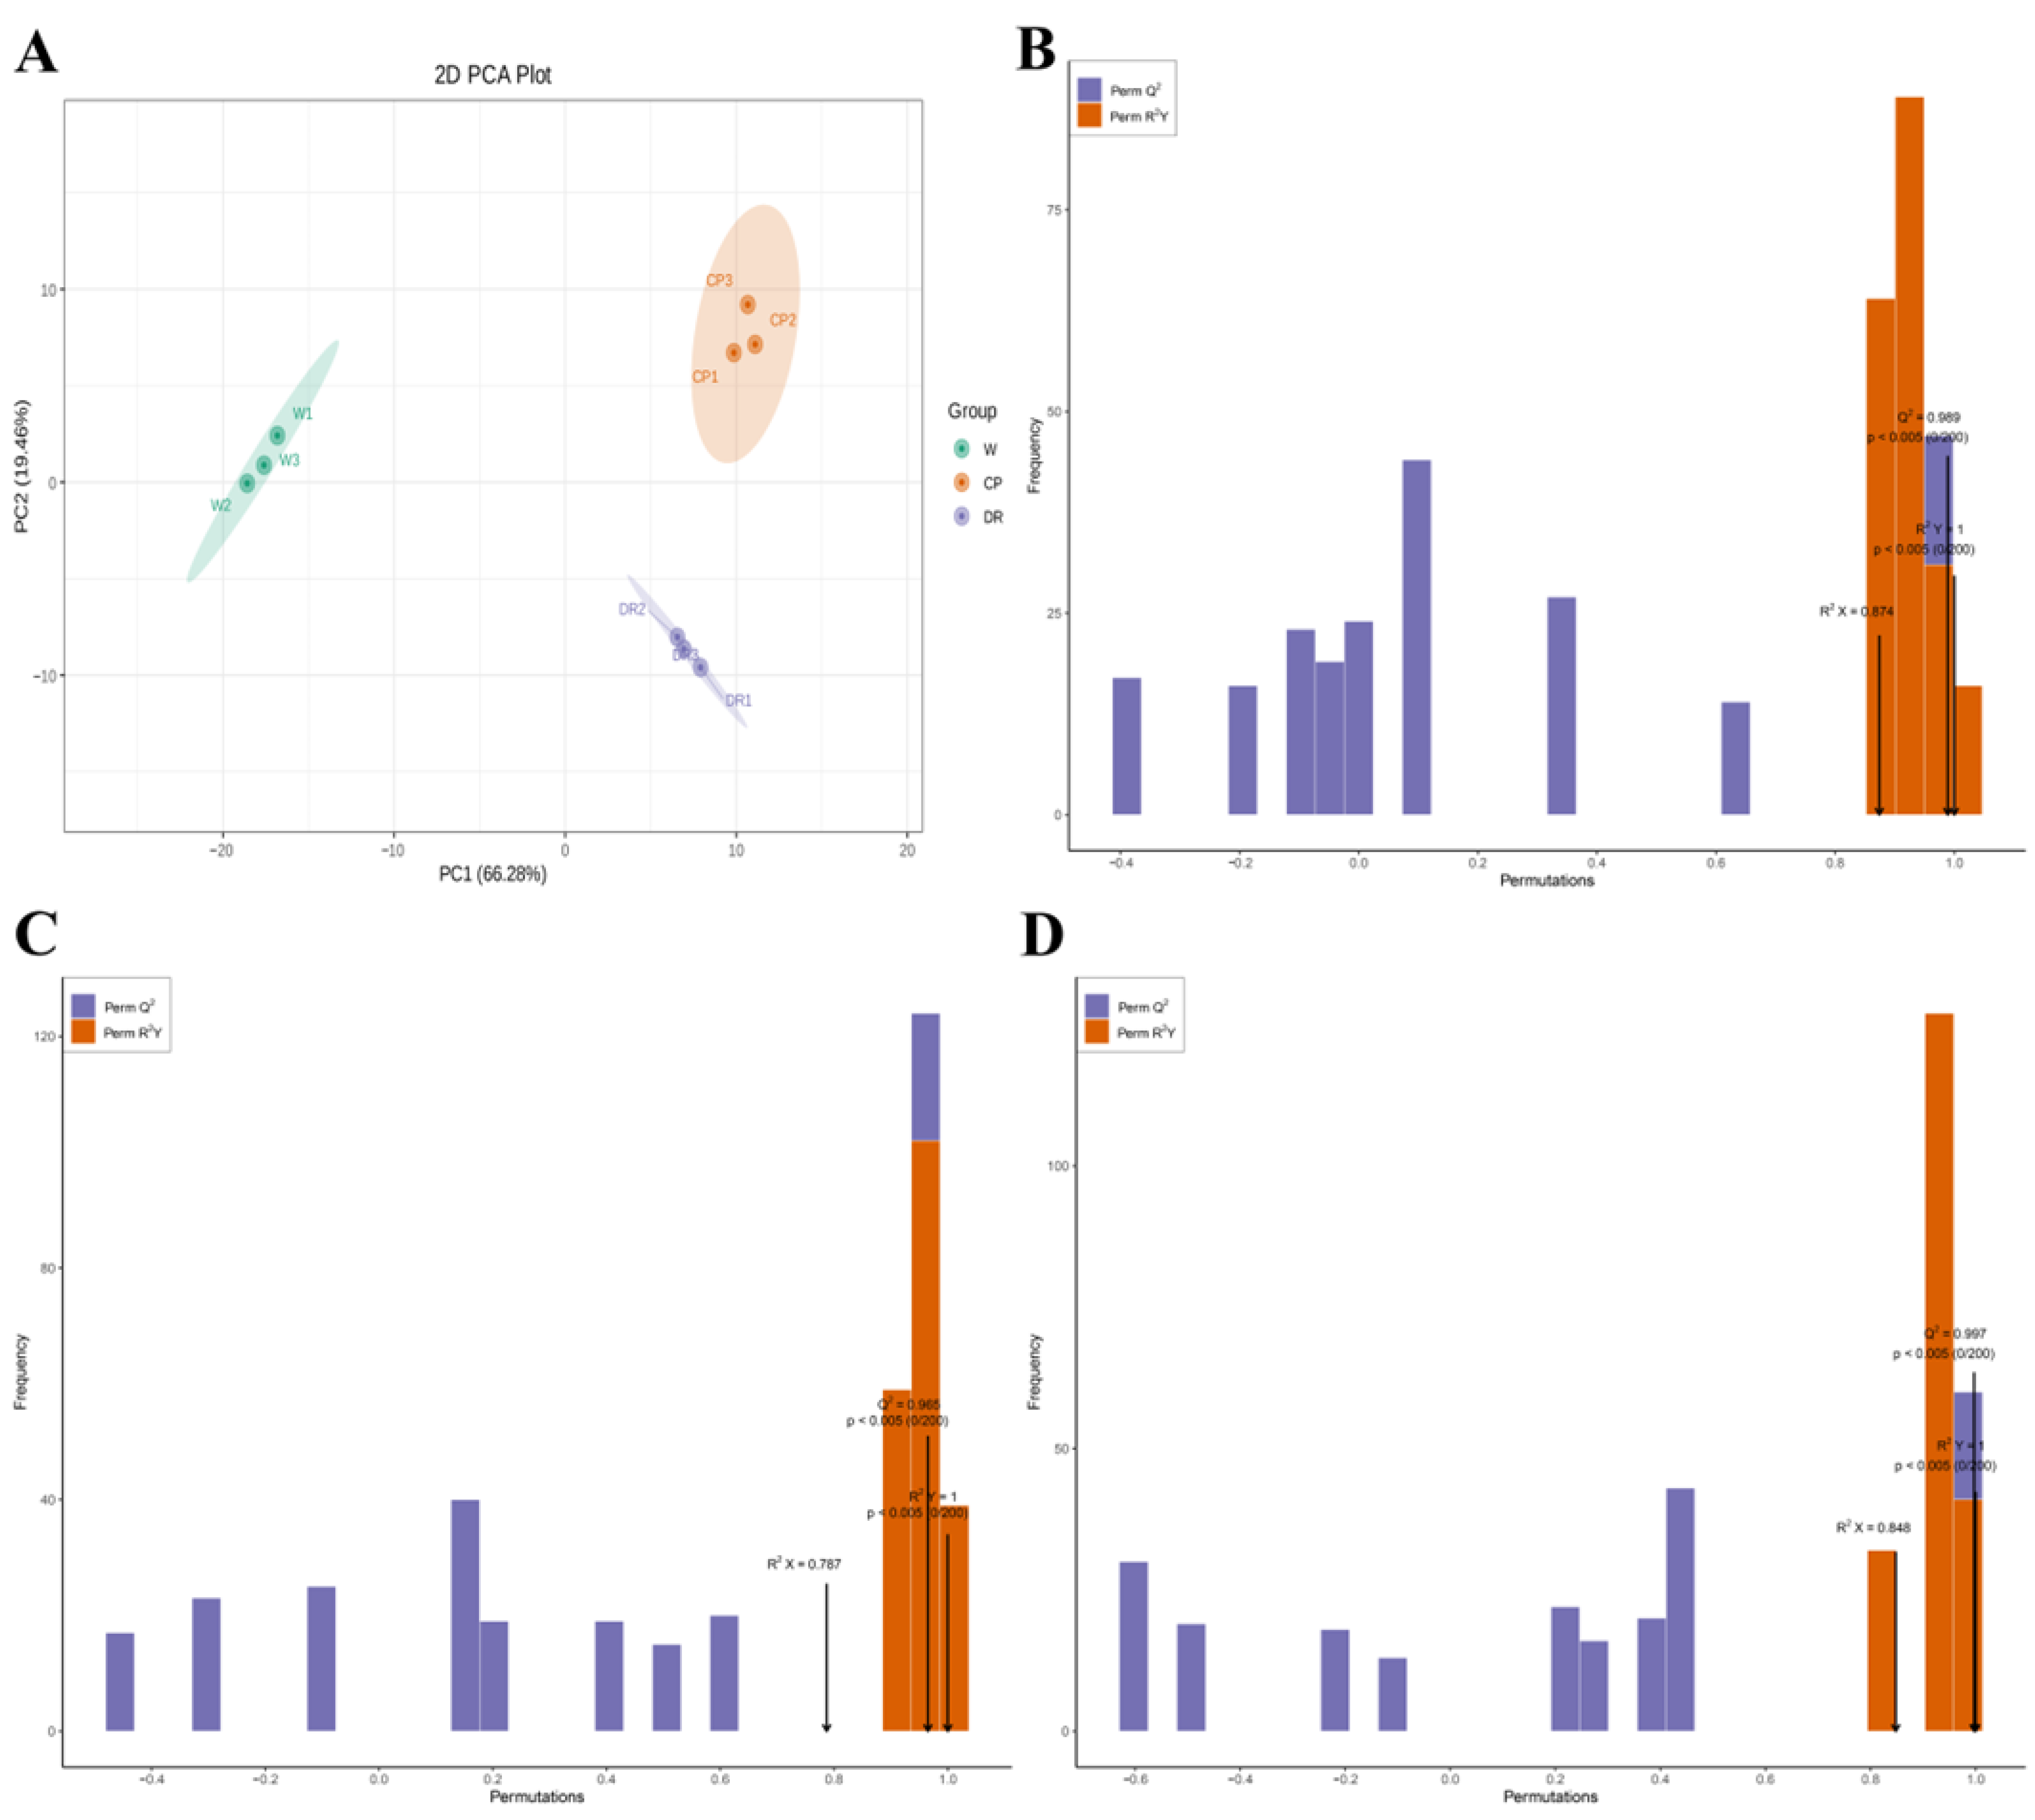
In the 2D-PCA score plot, the results exhibited that the flavonoid and VOCs metabolites in three petals displayed a clear separation trend between groups, and there was a tight aggregation trend within groups. It could be seen that the cumulative contribution rate of two principal components (PC1 66.28% × PC2 19.46%) reached 85.74% (Figure 2A). W, CP, and DR petals were obviously separated, and the biologically repeated same petals were closely grouped. These results indicated that the volatile profiling data had high repeatability, which was convenient for further analysis.
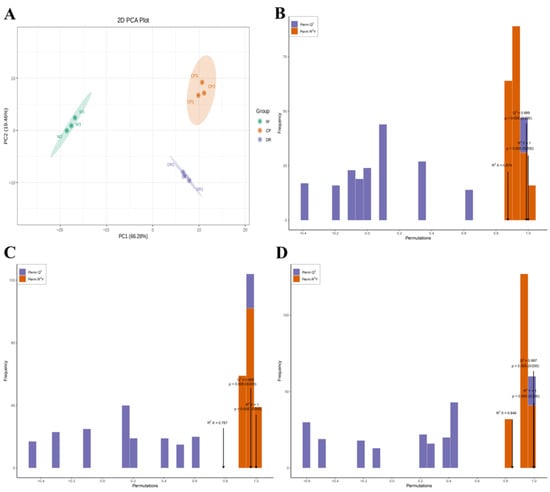
Figure 2.
The 2D-PCA plot and OPLS-DA plot of the three C. oleifera petals based on the relative content of flavonoids and VOCs. (A): The 2D-PCA score plot of W, CP, and DR petals; (B): Score plots of the OPLS-DA model for W_vs_CP; (C): Score plots of the OPLS-DA model for CP_vs_DR; (D): Score plots of the OPLS-DA model for W_vs_DR. W = white petals; CP = candy-pink petal; DR = dark-red petal.
The OPLS-DA model was applied to compare the differential accumulation metabolites (DAMs) in the three C. oleifera petals with different colors. When high predictability (Q2) > 0.9 and the goodness of fit was strong (R2X, R2Y was close to 1), the model was considered to be excellent and stable. Here, the high Q2, R2X, and R2Y were obtained to evaluate the validity of OPLS-DA model between the three C. oleifera petals. All the flavonoids and VOCs in three C. oleifera petals were accessed to determine the difference in the W_vs_CP comparison (Q2 = 0.989, R2X = 0.874, and R2Y = 1.000; Figure 2B), CP_vs_DR comparison (Q2 = 0.965, R2X = 0.787, and R2Y = 1.000; Figure 2C), and W_vs_DR comparison (Q2 = 0.997, R2X = 0.848, and R2Y = 1.000; Figure 2D) based on the OPLS-DA model through pairwise comparison. The results of OPLS–DA analysis and cross validation demonstrated that the Q2 of the three comparison groups was greater than 0.9, indicating that the model was accurate and stable, which explained the variations of flavonoids and VOCs in the three C. oleifera petals and could be performed to further screen the DAMs among different comparison groups using VIP values.
2.3. Differential Accumulation Metabolites of Volatile Organic Compounds Analysis of C. oleifera Petals
2.3.1. Differentially Accumulated Metabolites of Volatile Organic Compounds
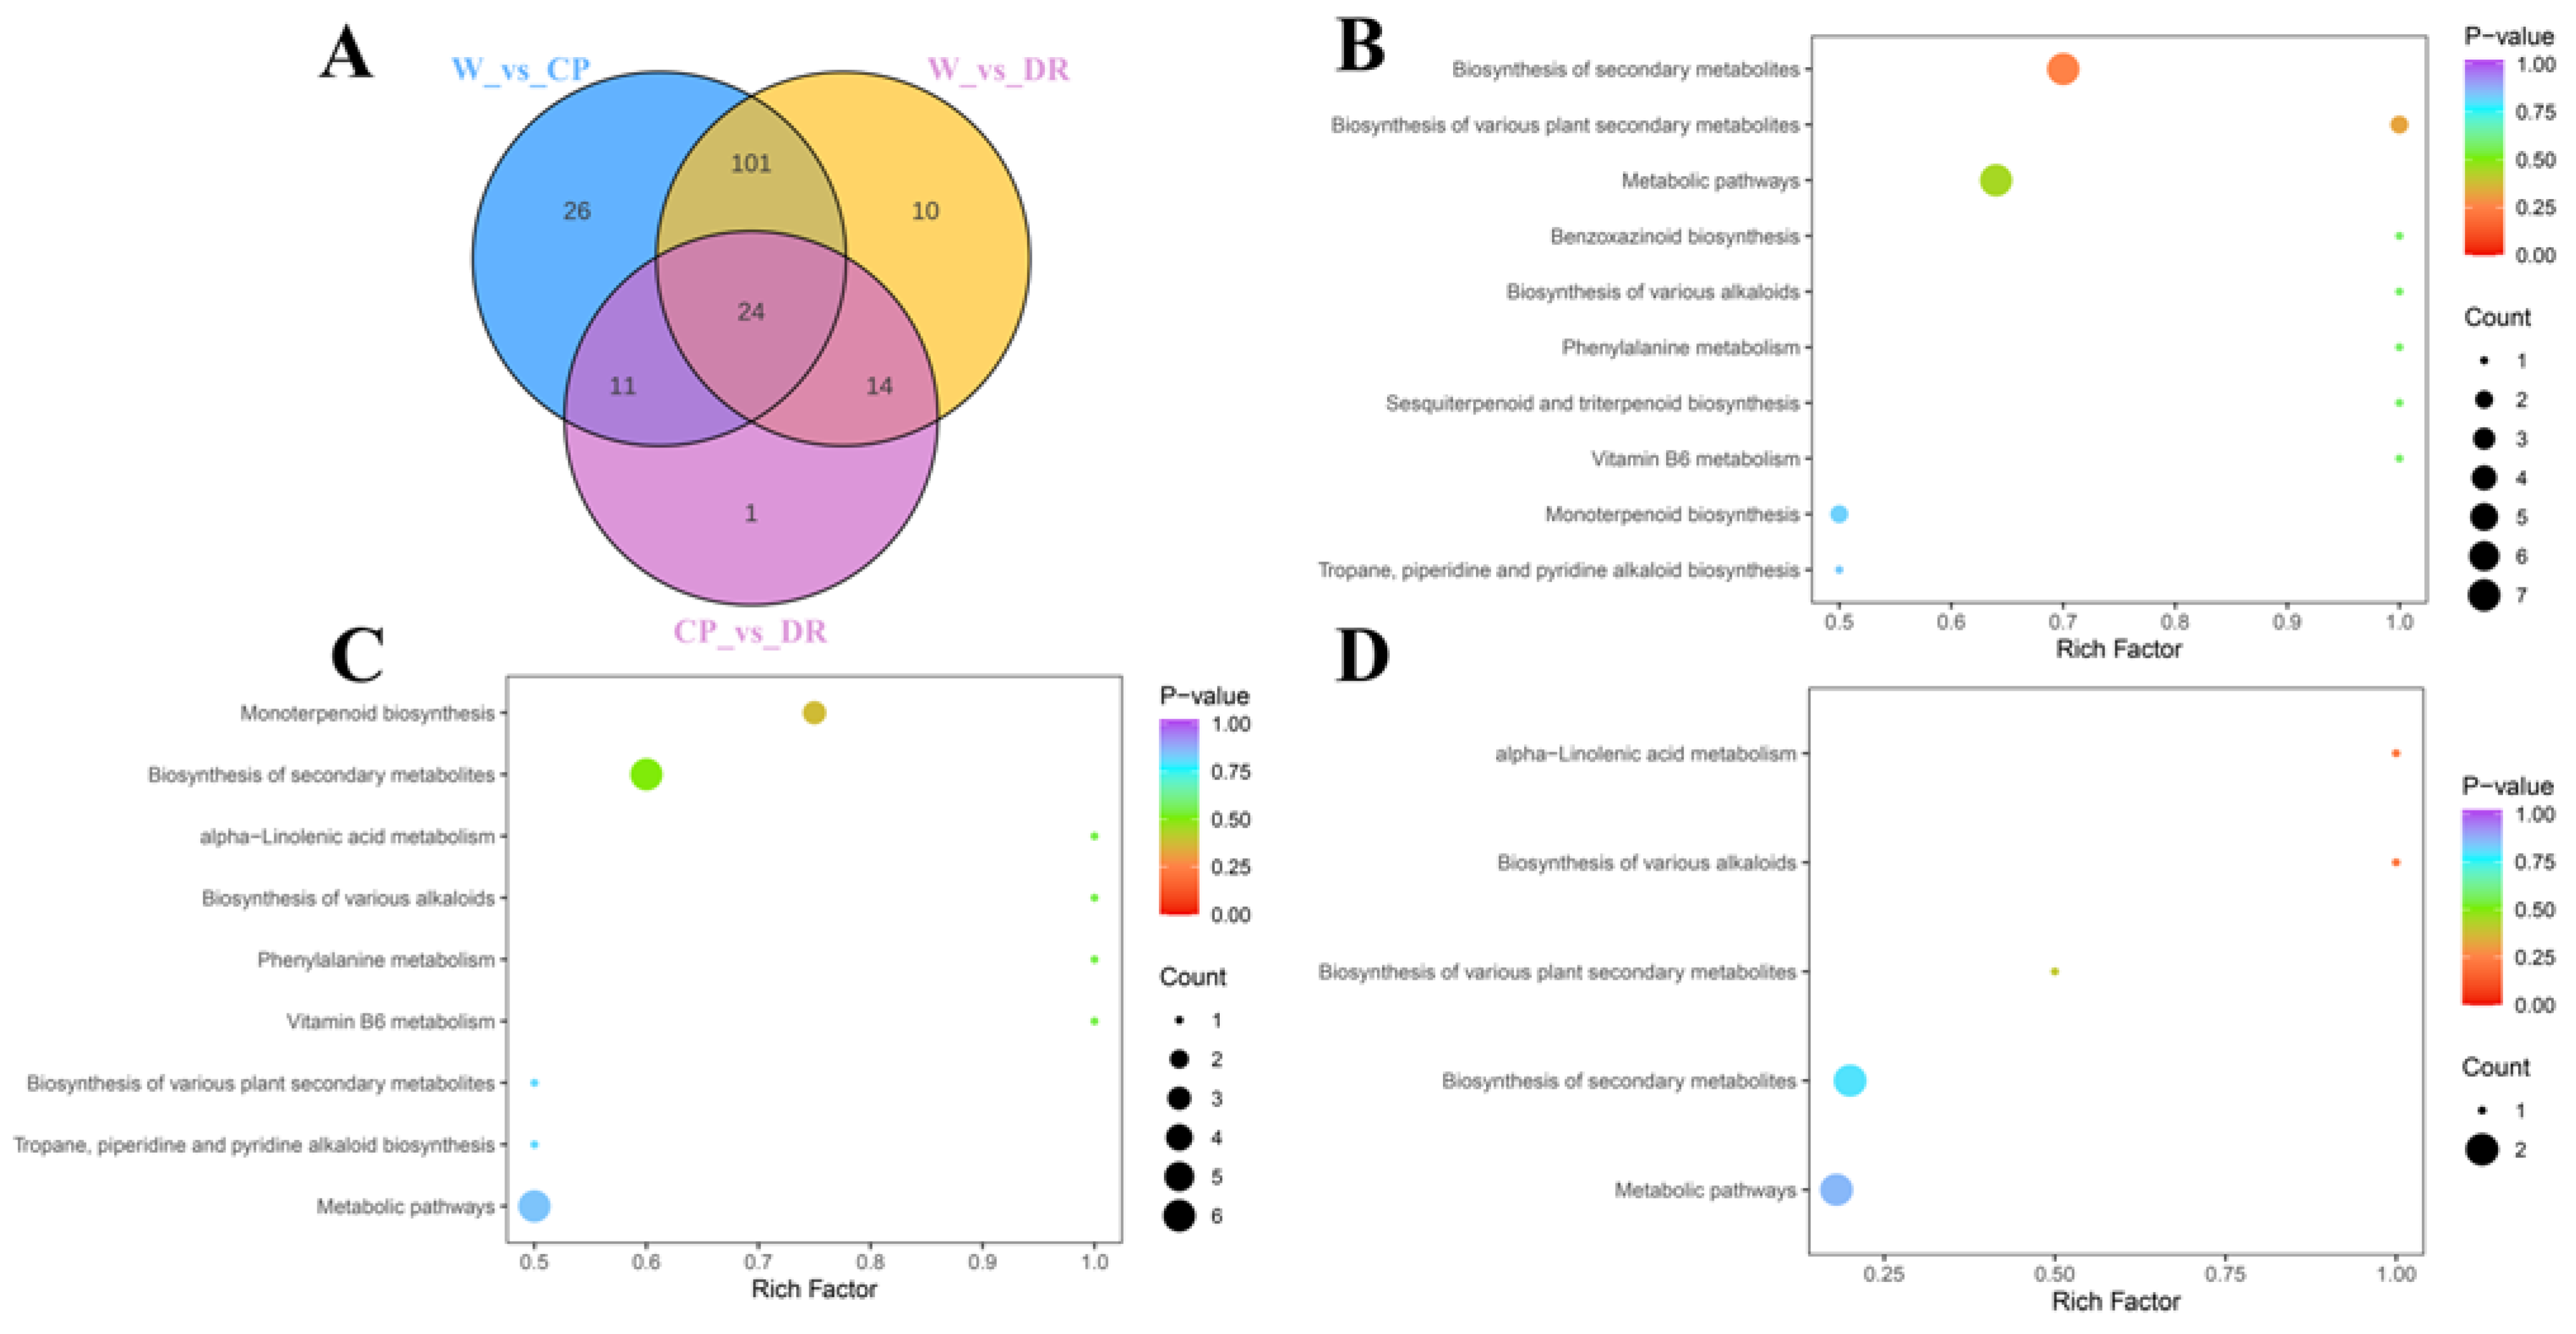
To screen the differential accumulation metabolites of volatile organic compounds (VOCs-DAMs) among three C. oleifera petals, the 270 VOCs metabolites were selected based on the one-dimensional analysis t test (p < 0.05), multidimensional analysis of VIP value (VIP > 1) of OPLS-DA, and fold change of ≥2 or ≤0.5, and there were 180 VOCs-DAMs in the W_vs_CP_vs DR comparison (Table S3). There were 162 VOCs-DAMs (74 up-regulated, and 88 down-regulated) in the W_vs_CP comparison (Table S4), 149 VOCs-DAMs (79 up-regulated, and 70 down-regulated) in the W_vs_DR comparison (Table S5), 50 VOCs-DAMs (21 up-regulated, and 29 down-regulated) in the CP_vs_DR comparison (Table S6). Next, VOCs-DAMs in the three comparison groups (W_vs_CP, W_vs_DR, and CP_vs_DR) were classified into 11, 12, and 10 different categories, respectively, and the most common VOCs-DAMs were esters, hydrocarbons, terpenoids, and alcohols. In addition, 24 VOCs-DAMs were identified among the three groups, indicating that these 24 VOCs-DAMs were differentially accumulated among the three C. oleifera petals (Figure 3A).
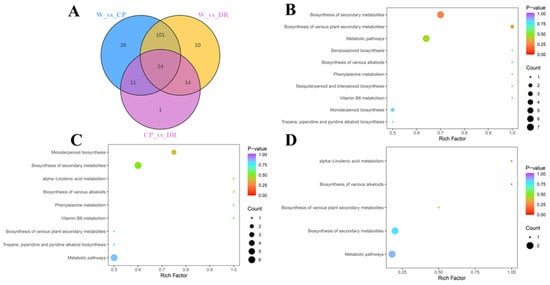
Figure 3.
Venn diagram and pathway analysis of VOCs-DAMs in three C. oleifera petals. (A): The Venn diagram results among W_vs_CP, W_vs_DR, and CP_vs_DR comparisons. (B–D): KEGG pathway enrichment of the VOCs-DAMs of the W_vs_CP, W_vs_DR, and CP_vs_DR comparison, respectively. W = white petals; CP = candy-pink petal; DR = dark-red petal.
Enrichment analysis of VOCs-DAMs in three C. oleifera petals samples was performed by KEGG to obtain comprehensive functional information, and Most of the VOCs-DAMs were categorized into metabolic pathways, biosynthesis of secondary metabolites, alpha-Linolenic acid metabolism, biosynthesis of various alkaloids, and biosynthesis of various plant secondary metabolites (Figure 3B–D).
2.3.2. Crucial Differential VOCs Related to C. oleifera Petals Aroma
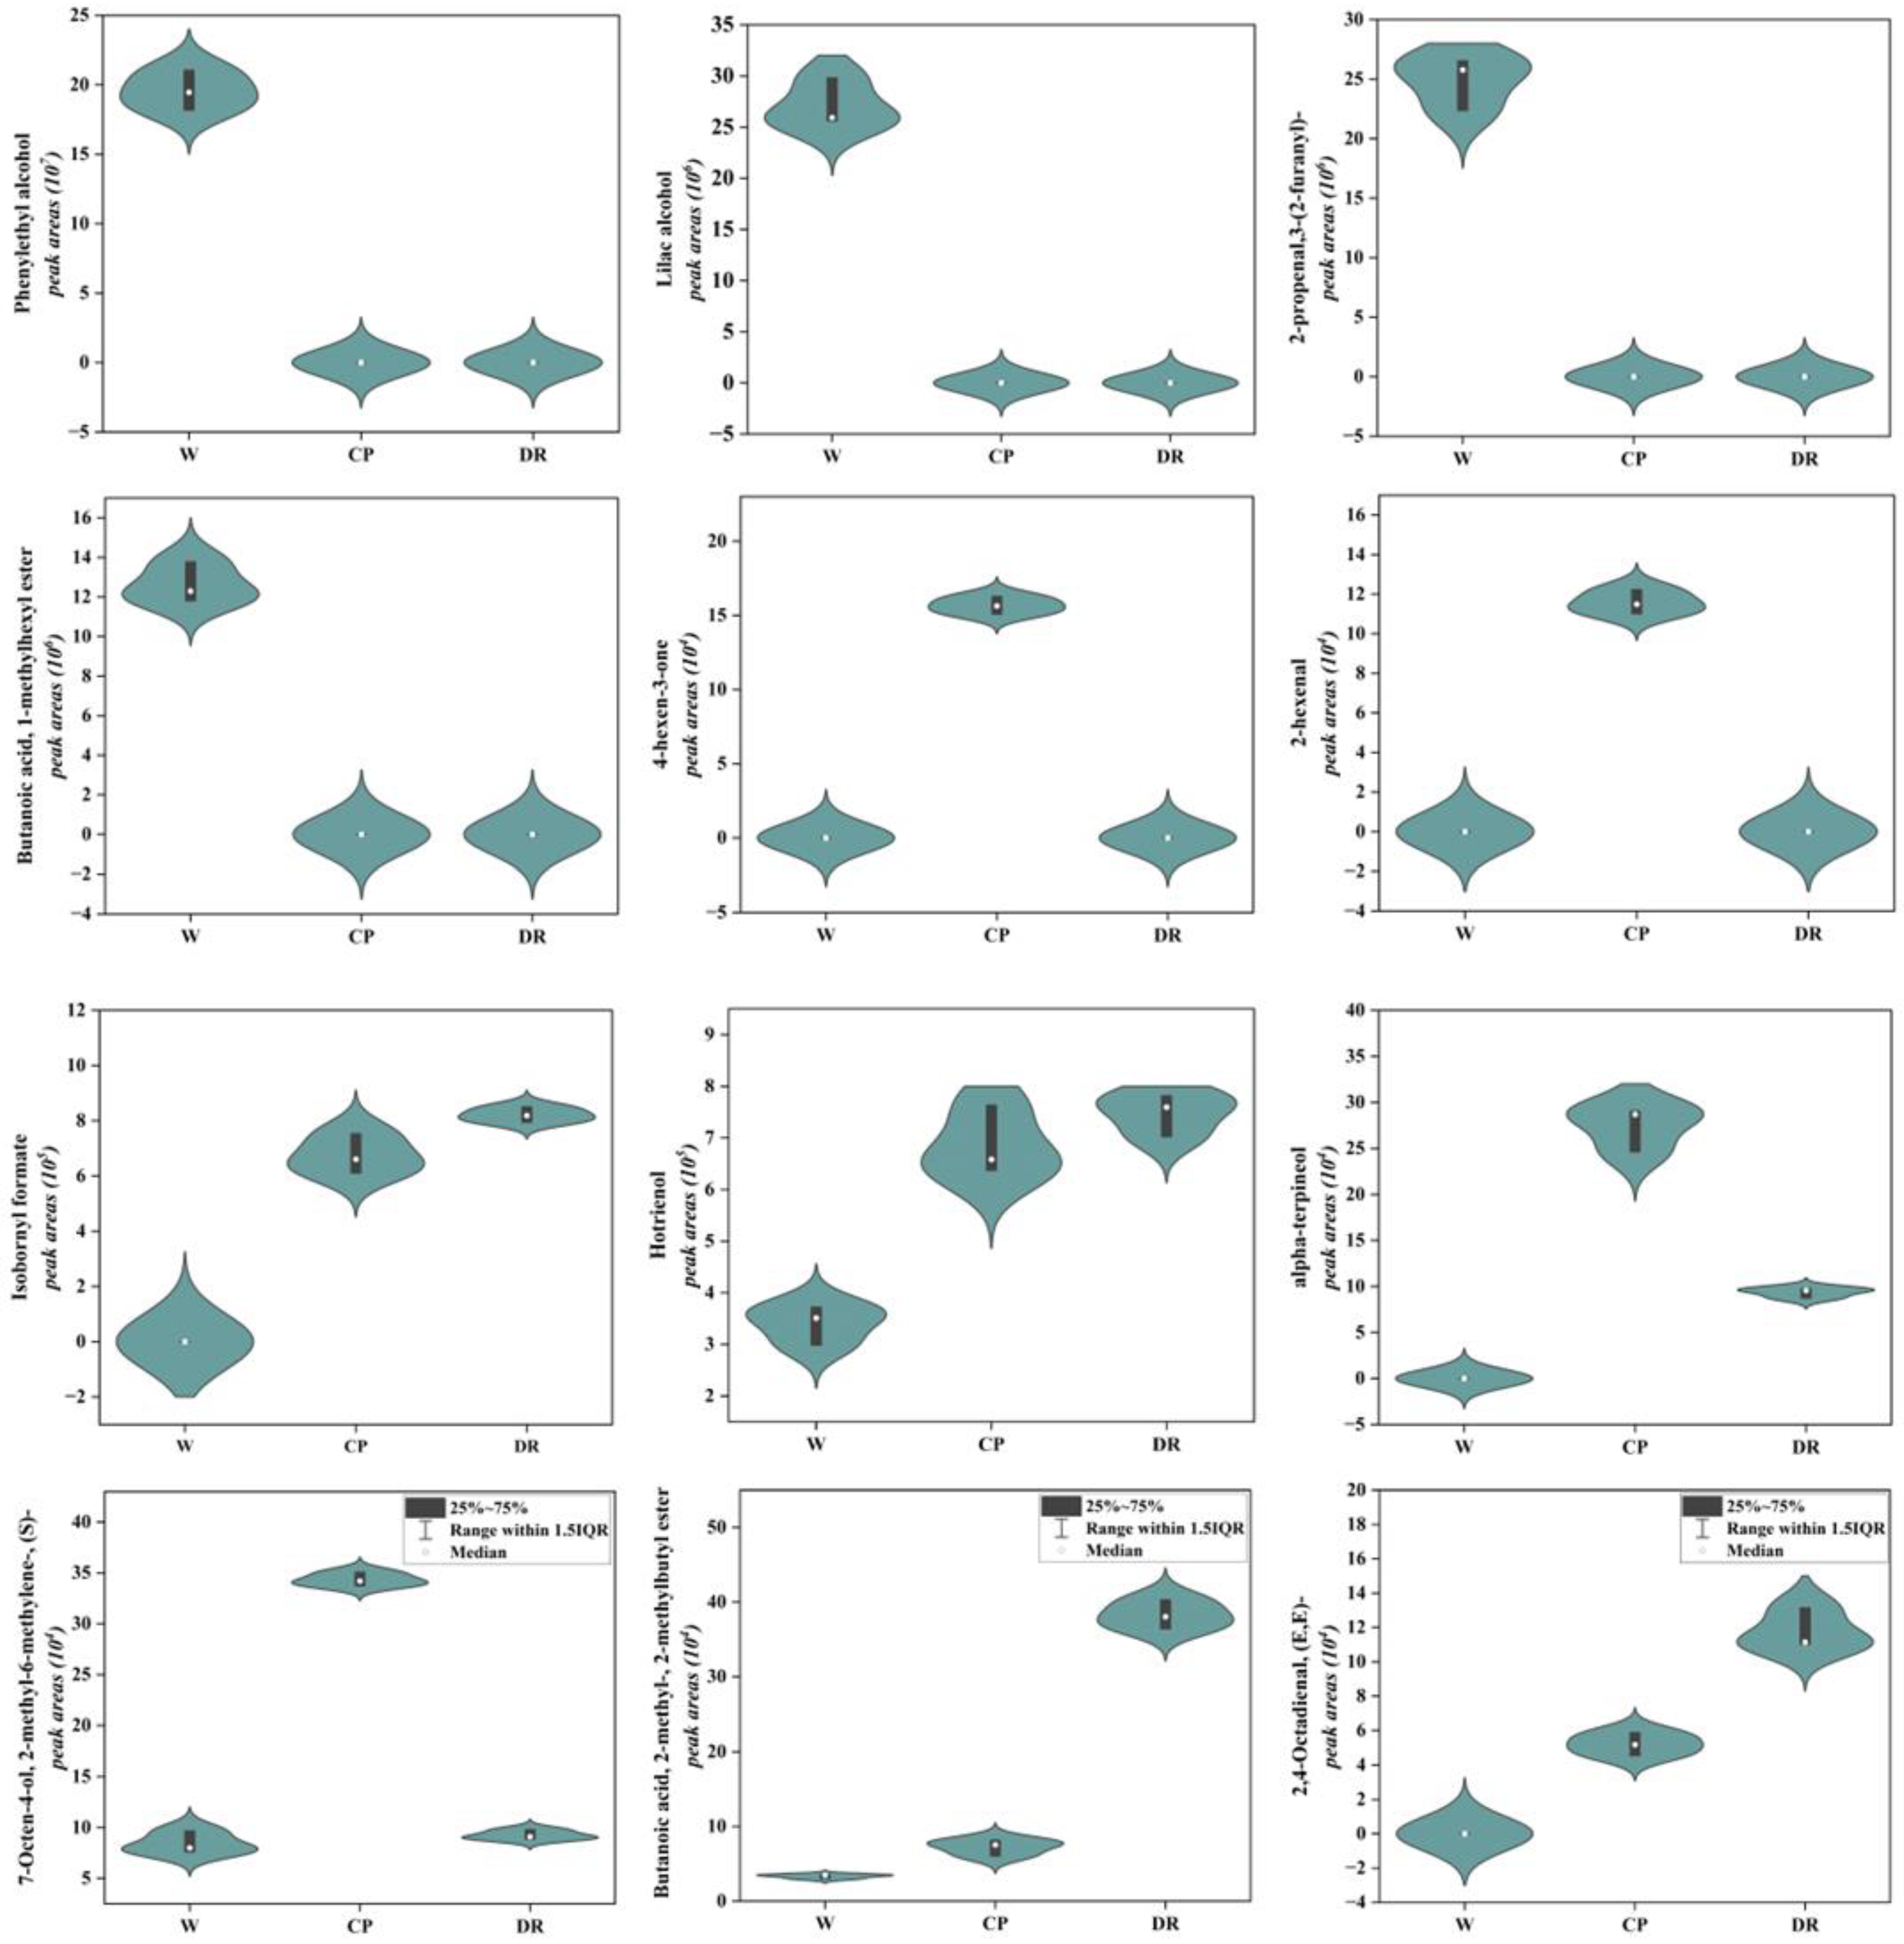
As shown in Figure 4, the phenylethyl alcohol, lilac alcohol, 2-propenal,3-(2-furanyl)-, and butanoic acid, 1-methylhexyl ester were only detected in W petals, and displayed a higher accumulation level. 4-hexen-3-one and 2-hexenal were found only in CP petals with a higher level. Isobornyl formate, and hotrienol were present at a higher level in DR petals. In the W_vs_CP comparison, most VOCs-DAMs were terpenoidsthe. The top five up-regulated VOCs with higher content in CP petals were Butanoic acid, 3-hexenyl ester, (E)- (S)- (4.15-fold), 7-Octen-4-ol, 2-methyl-6-methylene-, (S)- (4.08-fold), (E)-2,6-Dimethylocta-5,7-dien-2-ol (3.54-fold), cyclohexene, 1-methyl-4-(1-methylethylidene)- (2.73-fold), and hotrienol (2.02-fold). Lilac aldehyde (0.132-fold), tetradecane (0.131-fold), isopinocarveol (0.106-fold), gamma-terpinene (0.059-fold), and undecane, 3,5-dimethyl- (0.007-fold) were significantly down-regulated from W petal to CP petal. In the W_vs_DR comparison, the higher concentrations in the DR petals were furan, 3-(4-methyl-3-pentenyl)-, hotrienol, 2-isopropyl-5-methylhex-2-enal, 1-Nonen-4-ol, Cyclohexene, 1-methyl-4-(1-methylethylidene)-, 3-hexen-1-ol, propanoate, (Z)-, and butanoic acid, 2-methyl-, 2-methylbutyl ester, which were up-regulated by 2.05-, 2.20-, 2.58-, 2.38-, 2.35-, 2.68-, and 11.49-fold, respectively. Undecane, 3,5-dimethyl-, gamma-terpinene, and (3R,6R)-2,2,6-trimethyl-6-vinyltetrahydro-2H-pyran-3-ol were up-regulated by 0.009-, 0.058-, and 0.082-fold, respectively.
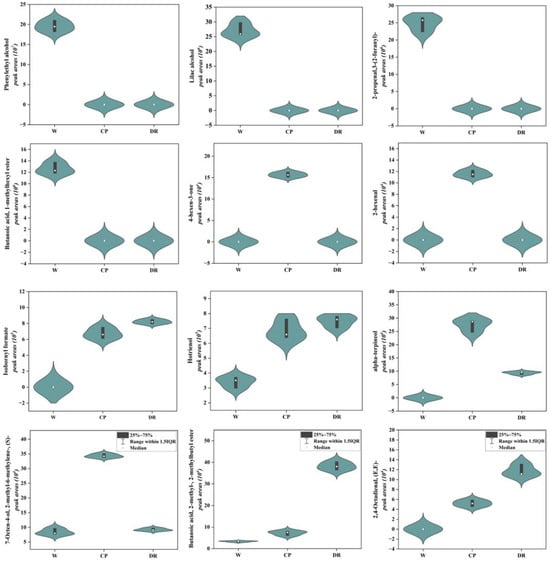
Figure 4.
Violin plots of peak areas values of 12 crucial differential VOCs identified in W, CP, and DR petals. W = white petals; CP = candy-pink petal; DR = dark-red petal. The distribution and probability density of the 12 VOCs-DAMs were represented by a combination of box plots and density plots. The outer shapes represented the density of the peak area values distribution, the black rectangular box in the middle represents the quartile range, and the white circle in the middle represents the median.
In the CP_vs_DR comparison, it was found that butanoic acid, 2-methyl-, 2-methylbutyl ester, 2,4-Octadienal, (E,E)-, and 1H-Imidazole, 2-propyl- displayed a high accumulation level in the DR petals, which were up-regulated by 5.28-, 2.26- and 2.99-fold, respectively. 7-Octen-4-ol, 2-methyl-6-methylene-, (S)- and alpha-terpineol were down-regulated by 0.269- and 0.341-fold, respectively.
Overall, the contents of phenylethyl alcohol, lilac alcohol, and butanoic acid, 1-methylhexyl ester with rose, fruity, and honey aroma attributes in white C. oleifera petals were significantly higher than those in candy-pink and dark-red petals, which might make the white petals richer in aroma. The hotrienol, alpha-terpineol and 7-Octen-4-ol, 2-methyl-6-methylene-, (S)- with sweet and delicate fragrance flavor exhibited a higher accumulation level in candy-pink C. oleifera petals. The hotrienol, butanoic acid, 2-methyl-, 2-methylbutyl ester, and 2,4-Octadienal, (E,E)- with wood and fruity flavor were the primary VOCs in the dark-red C. oleifera petals.
2.4. Differential Flavonoid Compounds Analysis of C. oleifera Petals
2.4.1. Differentially Accumulated Metabolites of Flavonoid Compounds
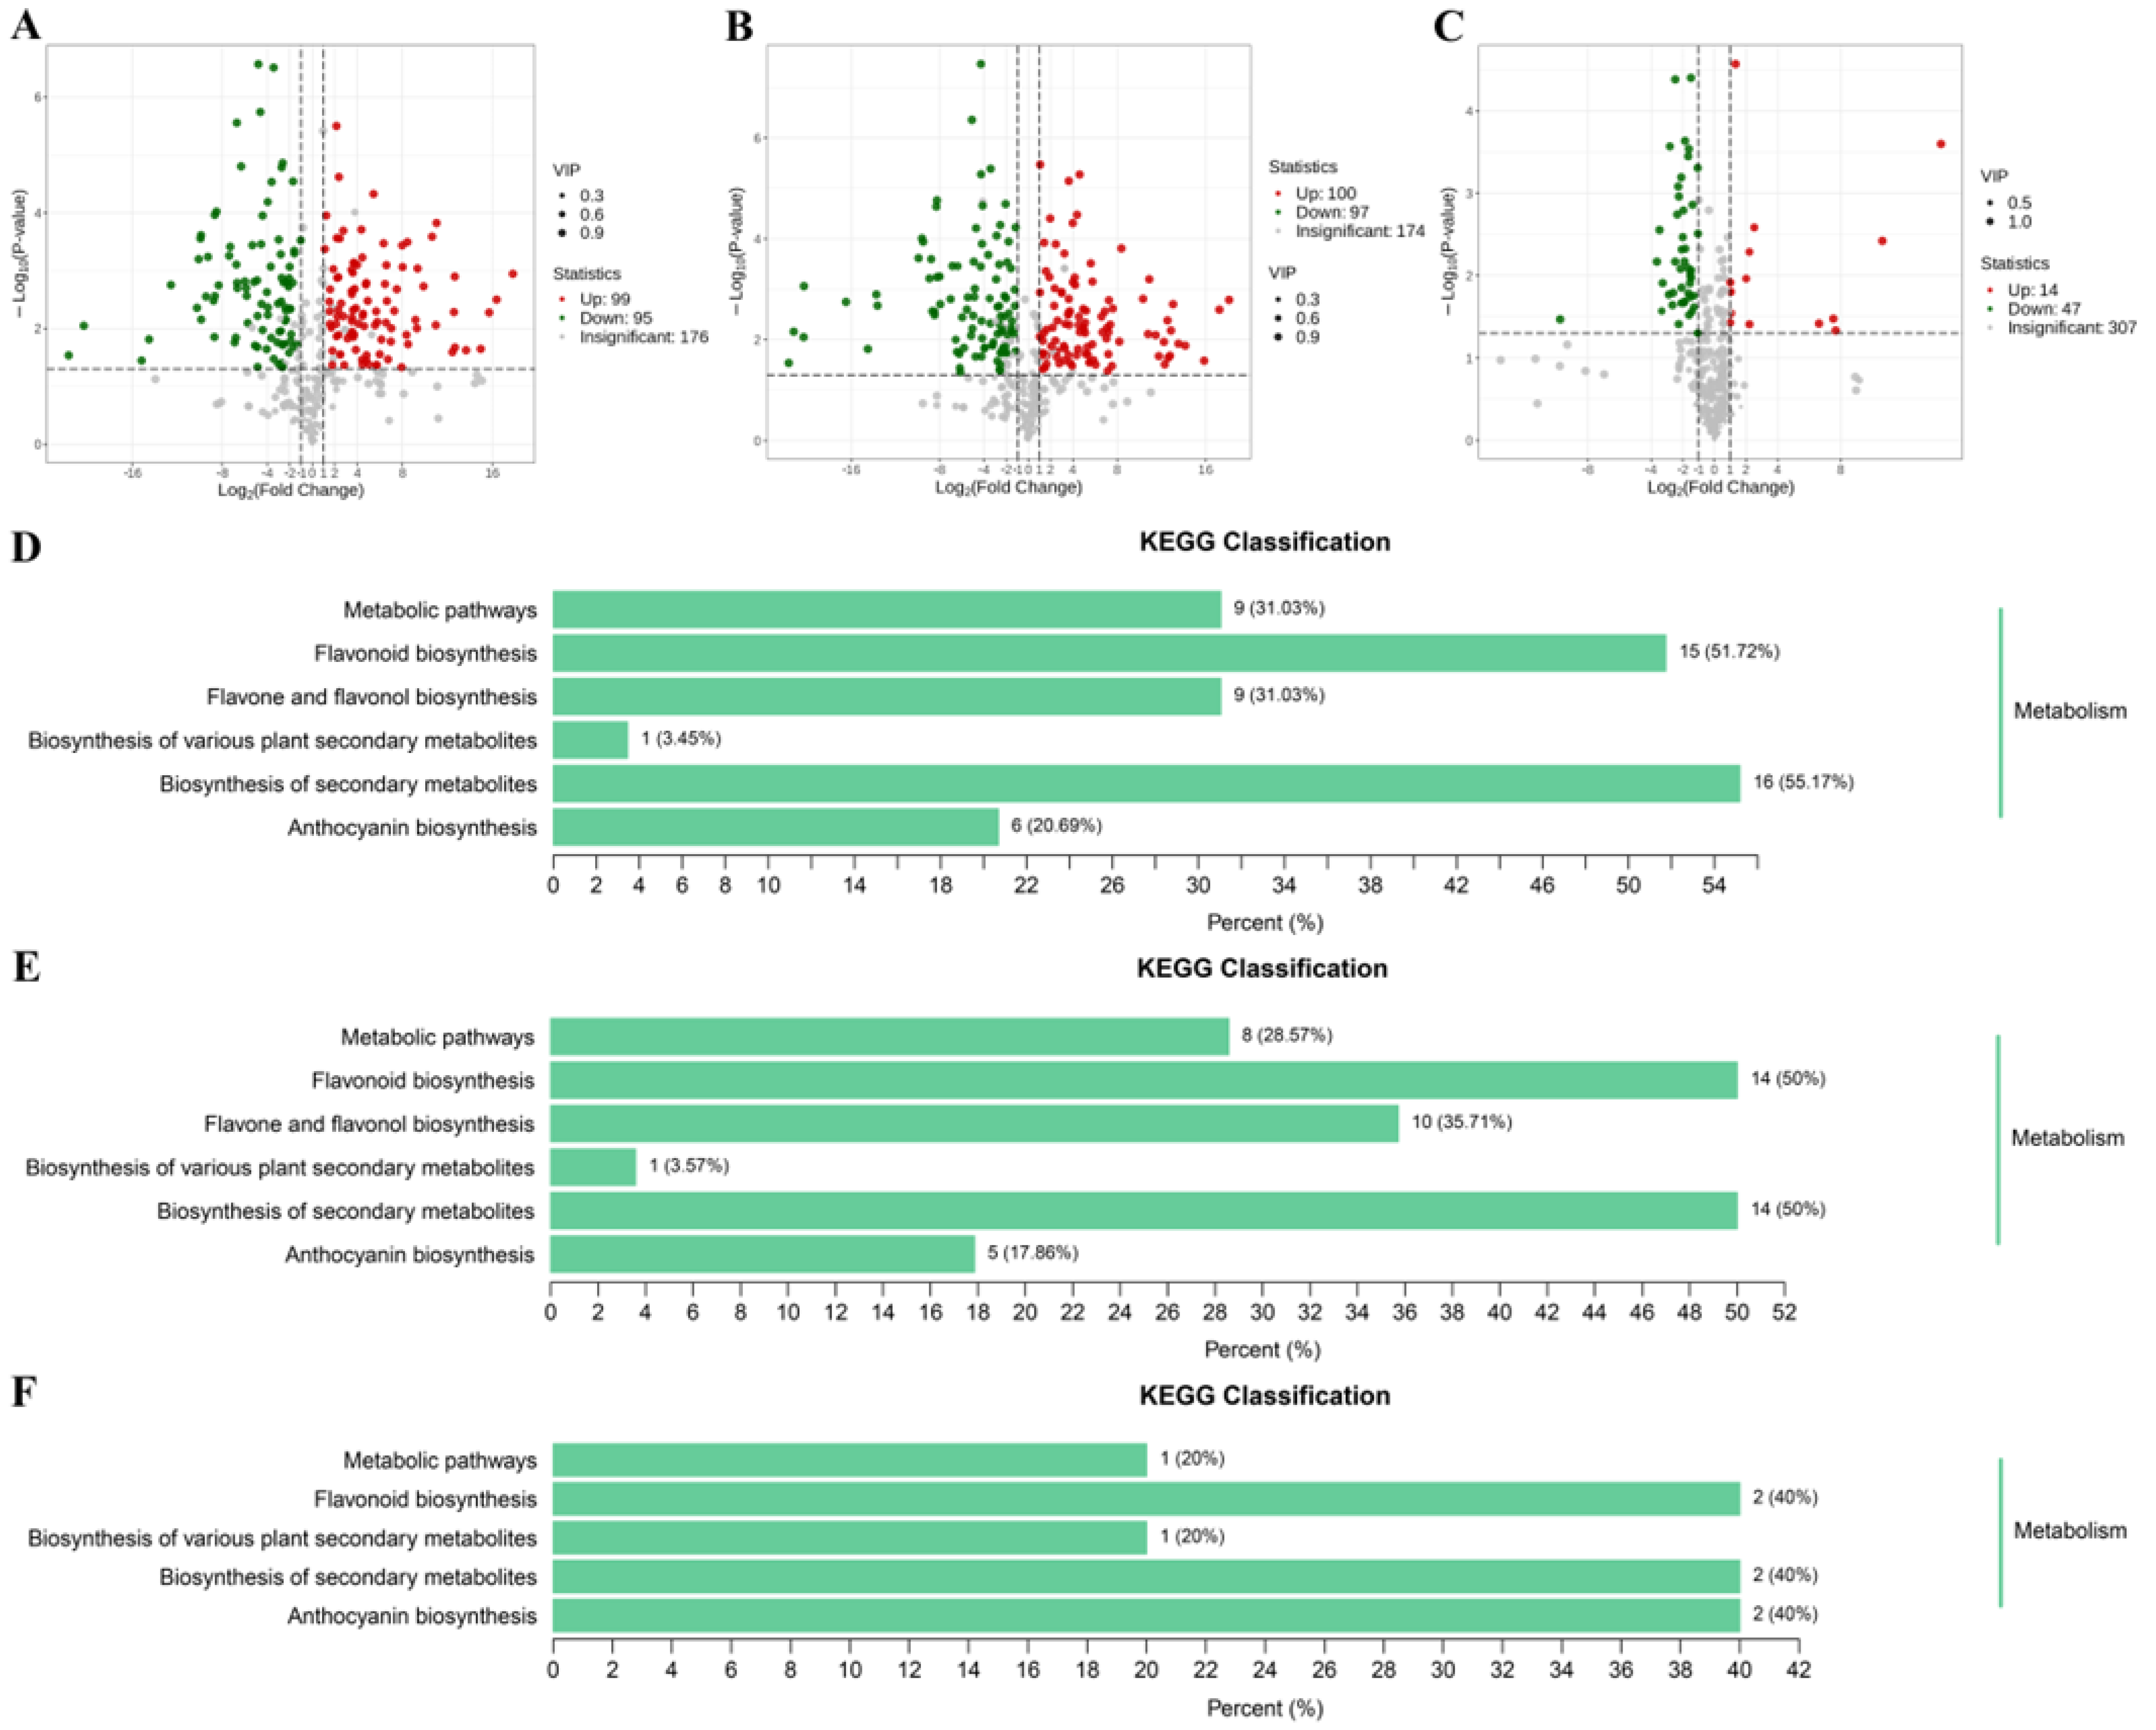
C. oleifera petals were found to be rich in flavonoids, and their flavonoid contents were markedly influence by color genotypes. In our study, the differentially accumulated metabolites (DAMs) between pairwise comparisons among W_vs_CP, W_vs_DR, and CP_vs_DR were screened by the variable importance in projection values (VIP) ≥ 1 and fold change ≥ 2 or fold change ≤ 0.5. The W_vs_CP comparison and W_vs_DR comparison had the largest number of up-regulated and down-regulated DAMs (Figure 5). Among these comparisons, there were 194 DAMs (99 up-regulated and 95 down-regulated) in the W_vs_CP comparison (Figure 5A), 197 DAMs (100 up-regulated and 97 down-regulated) in the W_vs_DR comparison (Figure 5B), and 61 DAMs (14 up-regulated and 47 down-regulated) in the CP_vs_DR comparison (Figure 5C), respectively. KEGG pathway enrichment analyses were carried out to gain further insights into the biochemical pathway to which the DAMs belonged to. The top three enriched KEGG pathways between the three comparisons were anthocyanin biosynthesis, flavonoid biosynthesis, and flavone and flavonol biosynthesis (Figure 5D–F). Given the role of anthocyanins and flavonoids in petal coloration, we deduced that the DAMs in anthocyanin biosynthesis pathway and flavonoid biosynthesis pathway might be likely the key metabolites underlying the variations in C. oleifera petals.
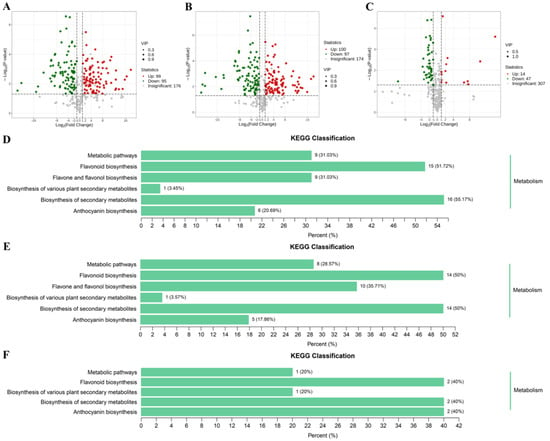
Figure 5.
(A–C): Volcano plots of DAMs in W_vs_CP, W_vs_DR, and CP_vs_DR comparisons; red indicated up-regulated differential metabolites, and blue indicated down-regulated differential metabolites; (D–F): KEGG pathway enrichment analysis of the DAMs in W_vs_CP, W_vs_DR, and CP_vs_DR comparisons.
2.4.2. Crucial Differential Compounds Related to C. oleifera Petals Color
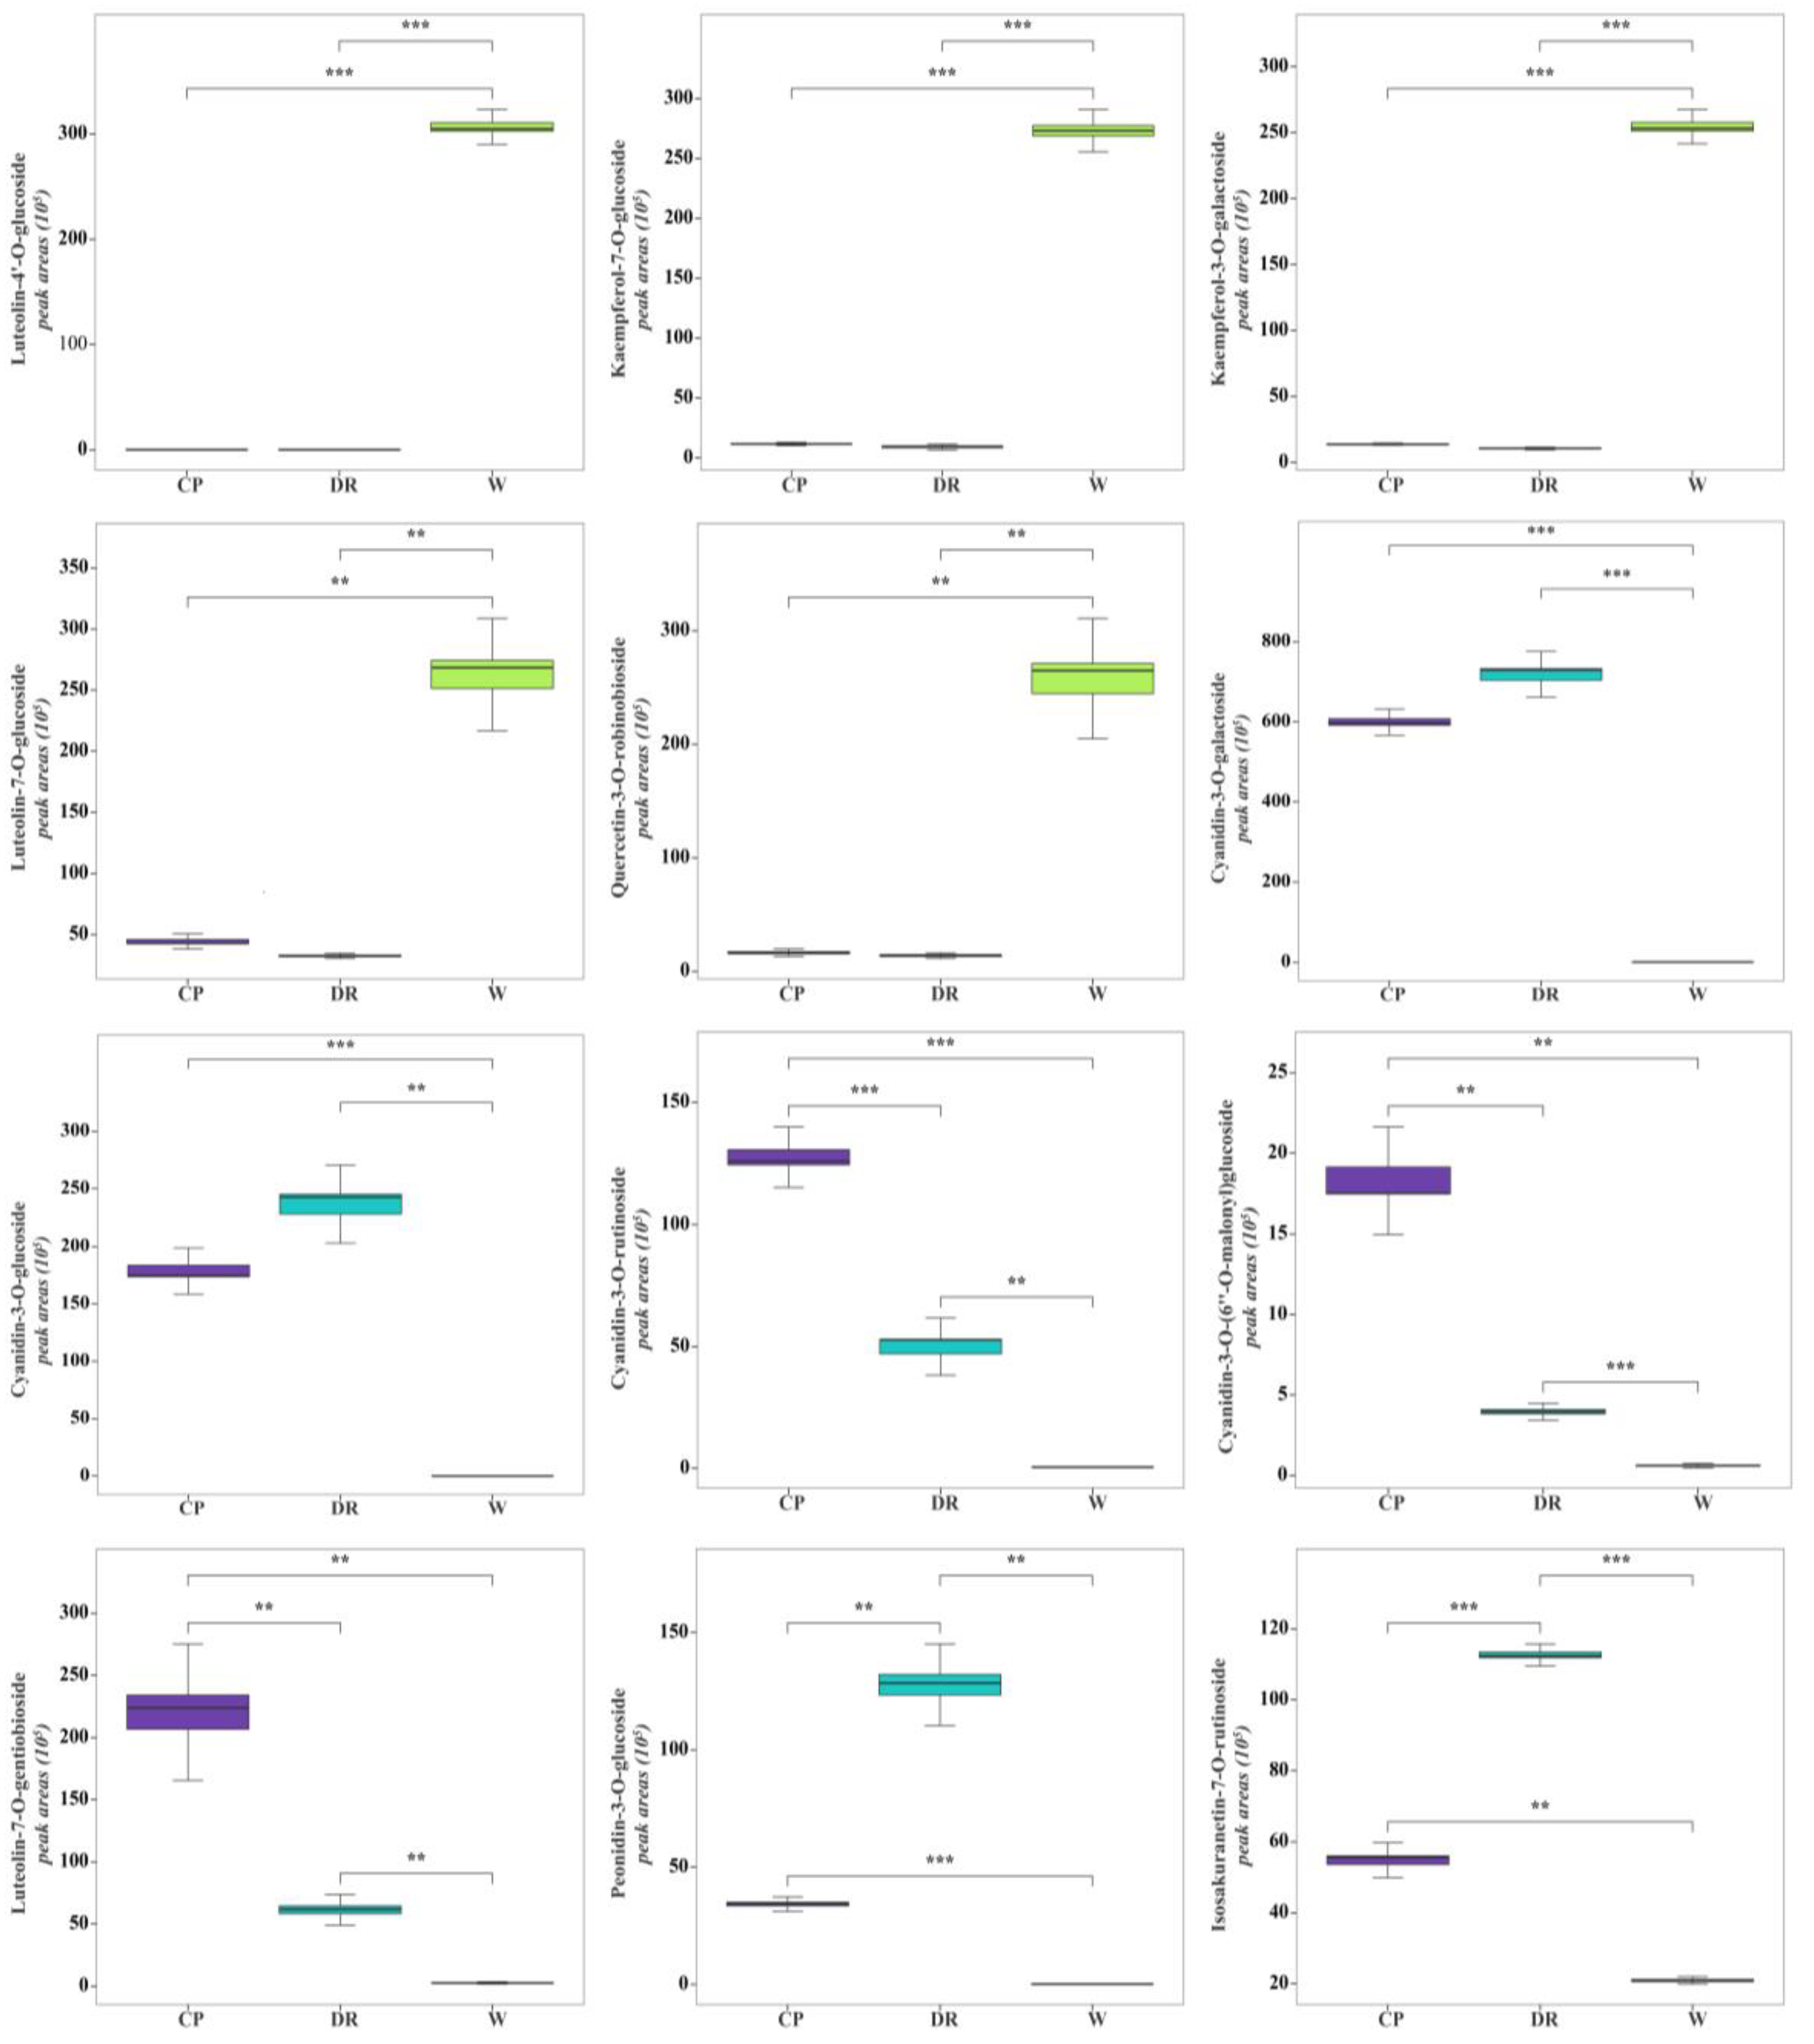
In the W petals, the concentrations of luteolin-4′-O-glucoside, kaempferol-7-O-glucoside, luteolin-7-O-glucoside, quercetin-3-O-robinobioside, and kaempferol-3-O-galactoside were significantly higher than those in CP and DR petals (Figure 6). In the W_vs_CP comparison, flavonols and anthocyanins accumulated to significantly higher levels in CP petals compared to W petals, especially cyanidin-3-O-galactoside, luteolin-7-O-gentiobioside, cyanidin-3-O-glucoside, cyanidin-3-O-rutinoside, kaempferol-3-O-glucorhamnoside, and kaempferol-3-O-glucoside-7-O-rhamnoside, which were up-regulated by 1596.79-, 70.58-, 6475.94-, 260.10-, 88.10, and 63.58-fold, respectively. In the W_vs_DR comparison, the top three most differentially abundant anthocyanins and flavanones with higher concentrations were cyanidin-3-O-galactoside, cyanidin-3-O-glucoside, peonidin-3-O-glucoside, and isosakuranetin-7-O-rutinoside, which were up-regulated by 1901.72-, 8447.98-, 1290.22, and 5.36-fold, respectively. In the CP_vs_DR comparisons, peonidin-3-O-glucoside and isosakuranetin-7-O-rutinoside in DR petals were 4.63- and 2.07-fold higher than that in CP petals, while cyanidin-3-O-(6″-O-malonyl)glucoside and luteolin-7-O-gentiobioside were decreased by 0.195- and 0.329-fold, respectively. However, the cyanidin-3-O-galactoside and cyanidin-3-O-glucoside with higher concentrations had no significant difference between CP and DR petals, which indicated that cyanidin-3-O-galactoside and cyanidin-3-O-glucoside were responsible for the coloration in CP and DR petals.
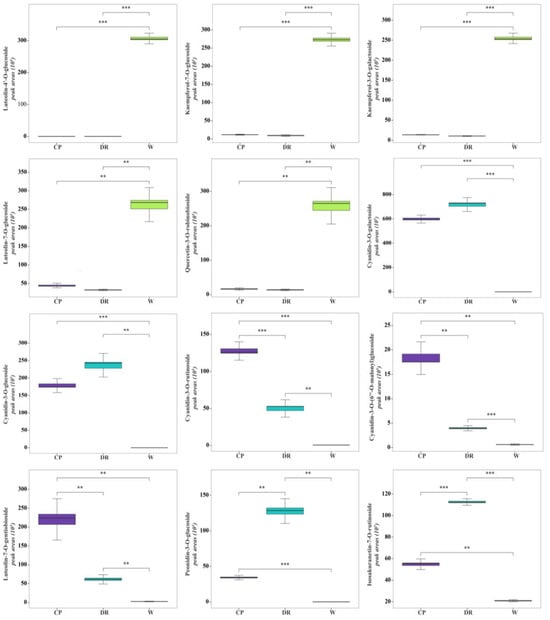
Figure 6.
Histogram of peak areas of 12 differentially accumulated metabolites identified in W, CP, and DR petals. W = white petals; CP = candy-pink petal; DR = dark-red petal. Duncan’s test was applied to evaluate the significant difference among petals with different color. ** indicated the significant difference at the p < 0.05 level; *** indicated the significant difference at p < 0.01 level.
Accordingly, luteolin-4′-O-glucoside, kaempferol-7-O-glucoside, luteolin-7-O-glucoside, quercetin-3-O-robinobioside, and kaempferol-3-O-galactoside might be the key coloring substances for white color formation in C. oleifera petals. Cyanidin-3-O-glucoside, cyanidin-3-O-galactoside, cyanidin-3-O-rutinoside, cyanidin-3-O-(6″-O-malonyl)glucoside, luteolin-7-O-gentiobioside, peonidin-3-O-glucoside, and isosakuranetin-7-O-rutinoside were speculated to lead to the candy-pink and dark-red petal coloration, among which cyanidin-3-O-(6″-O-malonyl)glucoside and luteolin-7-O-gentiobioside were the key metabolites for CP petals coloration, and peonidin-3-O-glucoside and isosakuranetin-7-O-rutinoside were the main pigments contributing to dark-red coloration.
3. Discussion
Camellia chekiangoleosa with a bright flower color and beautiful flower type, and Camellia yuhsienensis with a heavy floral scent were the excellent garden greening and woody oil tree species. Flower color and floral fragrance, as important ornamental traits of plants, are the main indicators to identify and distinguish different varieties, and affect the ornamental value and economic value of plants [8,25,26]. However, the regulation mechanism on the formation of flower color and fragrance between different flower color varieties of C. oleifera is still unclear.
Flavonoids are one of the main pigment components involved in the formation of flower color [27]. The difference of composition and anthocyanin content directly affects the flower color of plants [28]. Previous studies have confirmed that cyanidin and its derivatives widely acted on red petals of plants [29]. For example, it was found that the content of cyanidin in Rhododendron simsii Planch. with red flower colors was the highest. Jin et al. (2018) had found that cyanidin was the main flavonoid component in rosa crimson glory, and its content was significantly higher than other substances [30]; it has also been found that the main pigment in the Rosa rugosa × Rosa Sertata was cyanidin-3-glucose [31]. Peonidin-3-O-glucoside and kaempferol derivatives were mainly detected from the red rapeseed petals [9]. The white petals of rosa glaucca pourr contained only flavonoids, while the pink petals and purple petals of rosa glaucca pourr contained flavonoids and anthocyanins [32]. White Rosa multiflora petal and white chrysanthemum petals only contain light yellow or near colorless pigments, such as flavonoids and flavonols [33]. Therefore, the difference of flavonols, flavones, and anthocyanin content will direct influence on plant petals color. Here, the qualitative and quantitative analysis of flavonoids and anthocyanins in white, candy-pink, and dark-red color petals of three C. oleifera cultivars was identified and detected by UPLC–MS/MS in this study. In the white petals, luteolin-4′-O-glucoside, kaempferol-7-O-glucoside, luteolin-7-O-glucoside, quercetin-3-O-robinobioside, and kaempferol-3-O-galactoside were the main pigments in white petals, which was in accordance with the results that luteolin and kaempferol were the main substances that determined the white color of ‘Rosa alba’ [34]. In the candy-pink and dark-red petals, cyanidin-3-O-glucoside, cyanidin-3-O-galactoside, cyanidin-3-O-rutinoside, cyanidin-3-O-(6″-O-malonyl)glucoside, and peonidin-3-O-glucoside displayed higher accumulation levels, which was consistent with this conclusion that those above pigments were the main anthocyanin components in red petals of C.japonica [35]. Moreover, the combination of flavonoids and other related co-pigment compounds with anthocyanins exhibited a hyperchromic effect, and the co-color effects also increased with the increase in anthocyanin methylation and glycosylation, of which the flavonol and flavonoids are the most common co-pigments [36]. Luteolin-7-O-gentiobioside and isosakuranetin-7-O-rutinoside were found at higher accumulation levels in candy-pink and dark-red petals, respectively, which might be combined with cyanidin and peonidin derivatives to form a co-pigmentation effect to make the petals pinker and redder. Therefore, luteolin, kaempferol, cyanidin, and peonidin derivatives were acted as the main pigments for C. oleifera petal coloration.
Floral scent is a mixture of chemical compounds emitted by plant tissues, which is a crucial factor that affects the overall aroma and consumer preference [37]. The petal flavor is strongly influenced by the type and amount of aroma components present [38]. VOCs are the main components of flowers, and the flowers of different plant varieties contain different VOCs [39]. For example, the main VOCs in ‘Gesang Lv’ were linalool, caryophyllene, oxidized linalool, and pinene, the main VOCs in ‘Gesang Hong’ included macrophyllene D, methyl decanoate, hexol, and pinene, and the main VOCs in ‘Gesang Huang’ were linalool, caryophyllene, methyl decanoate, and germacrene [40]. The volatile components of the flowers within the genus Chimonanthus were mainly terpenes and esters, and terpenoids and aromatic hydrocarbons were the main VOCs in rose [41]. A total of 270 volatile organic compounds were identified using HS–SPME in conjunction with GC–MS. Esters, hydrocarbons, terpenoids, and alcohols were the dominant aroma components in three C. oleifera petals in terms of quantity and proportion. Phenylethyl alcohol was the main aroma component, widely existing in plant essential oils, which is an important aroma compound, with rose, fruity, and honey flavor [42]. Here, phenylethyl alcohol was the main VOCs in the white petals, which was in accordance with the results that phenylethyl alcohol was the unique compound of ‘Fragrant cloud’ varieties and phenylethyl alcohol was the highest aroma components in Rosa. odorata var odorata [43]. The hotrienol and alpha-terpineol were detected with a high content in candy-pink petals. In accordance with our results, Liu et al. (2016) identified hotrienol and alpha-terpineol as the important aroma compounds in red freesia flower [44]. Zhang Ming et al. (2020) detected as main aroma constituent butanoic acid, 2-methyl-, 2-methylbutyl ester in Areca catechu flower [45], in which we detected a high accumulation of butanoic acid, 2-methyl-, 2-methylbutyl ester in the dark-red C. oleifera petal. Different volatile organic compounds and release amount were together contributed to the unique aroma of C. oleifera petals, which not only increased the ornamental value, but also had important significance for the commercial development of aromatic C. oleifera petals. In summary, phenylethyl alcohol, hotrienol, alpha-terpineol, and butanoic acid, 2-methyl-, 2-methylbutyl ester were generally present in white, candy-pink, and dark-red C. oleifera petal, which mainly contributed to the perfumery value.
Our understanding of the floral scent traits of C. oleifera petals with different colors is limited. A comprehensive knowledge of the coloring substances and volatile compounds in C. oleifera petals is the first step in cultivating colorful and aroma varieties. Esters, alcohols and terpenoids are ubiquitous in floral volatiles. Functional studies of genes involved in the biosynthesis of terpenoids would be very prospective. Finally, with the support of biotechnology tools, metabolic engineering methods for flower color and fragrance-related products could be realized. Therefore, our research not only would be helpful to provide comprehensive information about the characteristic components of flower color and fragrance in C. oleifera petals with different colors, but also lay a fundamental reference for cultivating excellent C. oleifera varieties with specific flower color and fragrance.
4. Materials and Methods
4.1. Materials
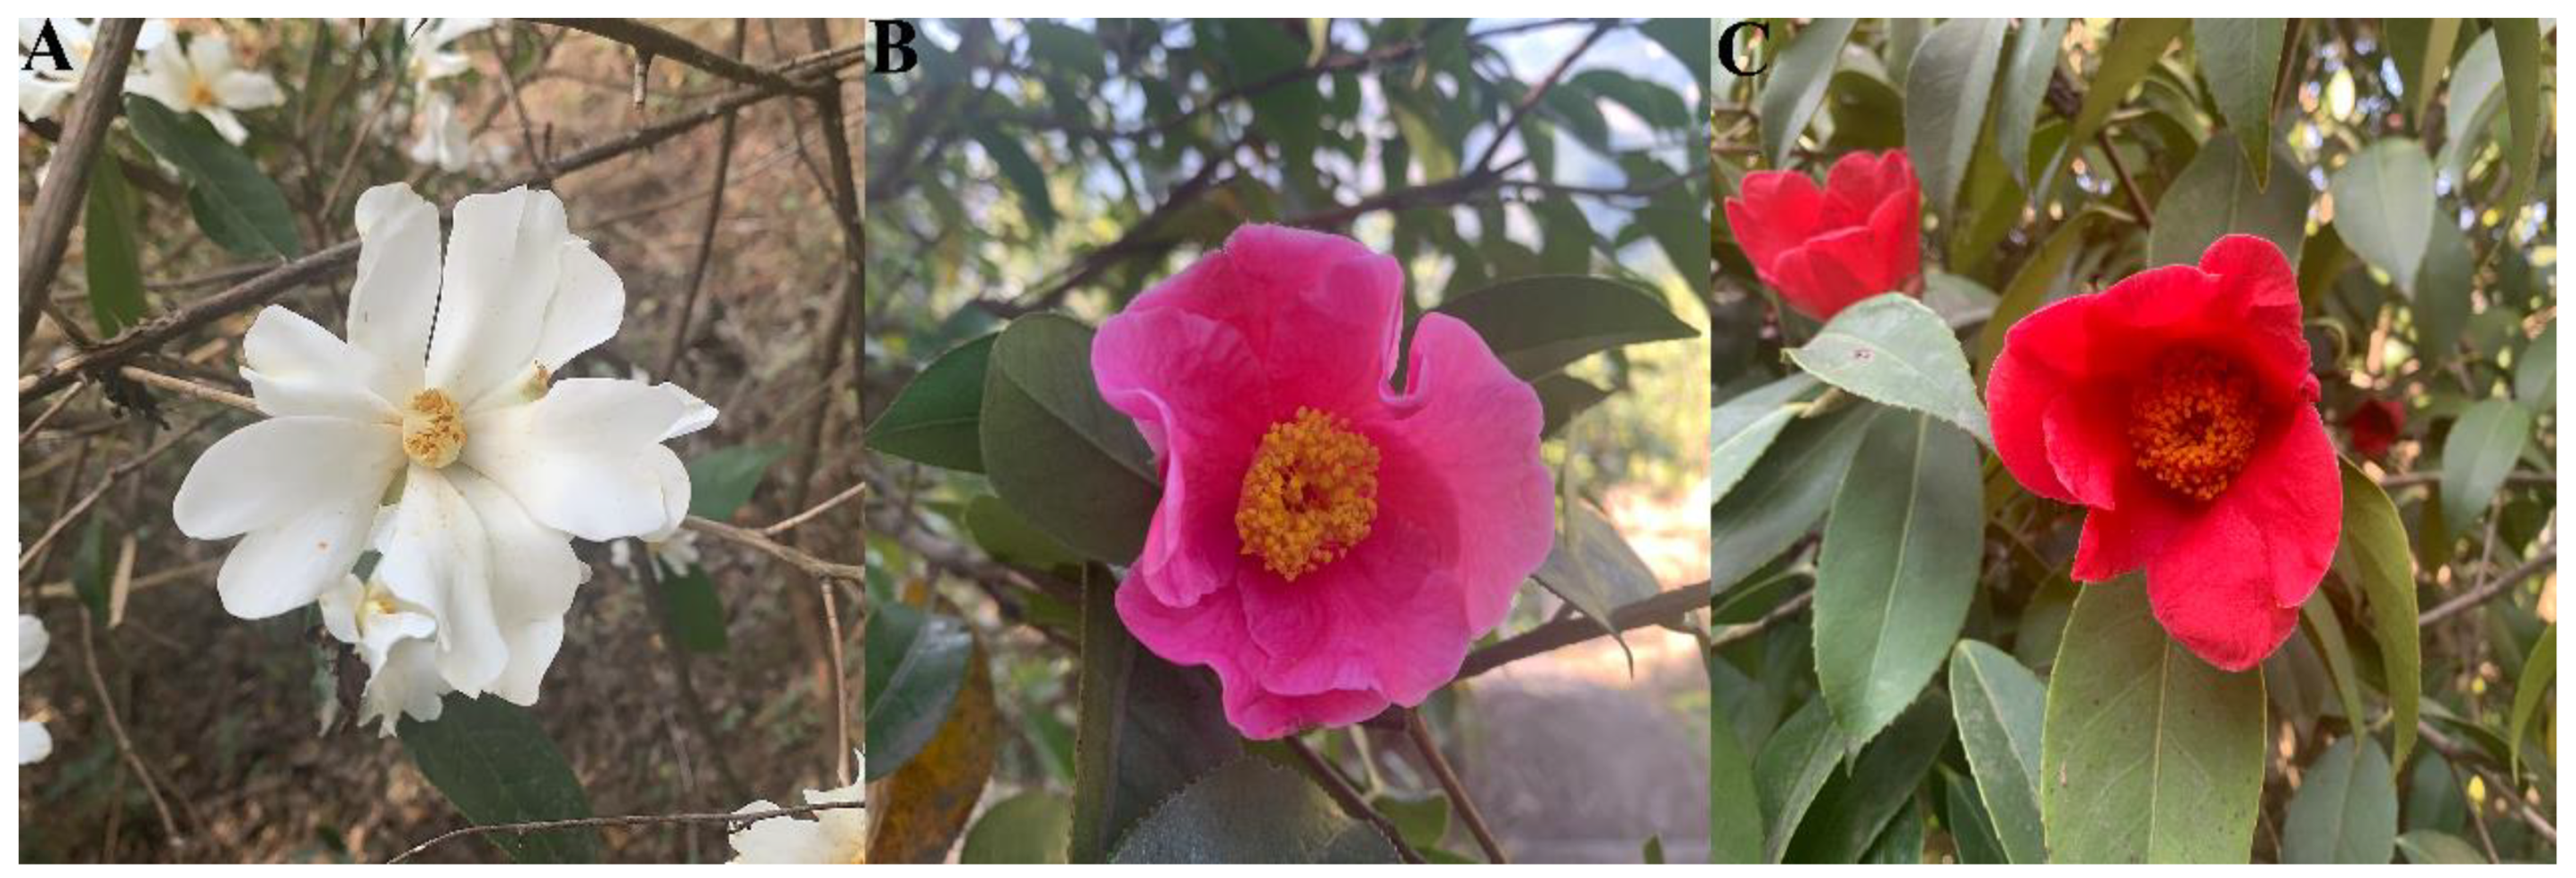
Three C. oleifera varieties with different-colored petals were planted in the Shaanxi C. oleifera germplasm repository with similar soil conditions in Nanzheng District, Shaanxi Province, China. The petal colors of three C. oleifera varieties, namely “Camellia yuhsienensis” (White, W), “Camellia semiserrata” (Candy-pink, CP), and “Camellia chekiangoleosa” (Dark-red, DR) were white, candy-pink and dark-red, respectively (Figure 7). Three C. oleifera petals samples were collected from fresh petals during full flowering, with three biological replicates on 8 March 2023. Then, the petals were immediately stripped, put into liquid nitrogen, and brought back to the laboratory for storage at −80 °C for the flavonoid and volatile organic compound determination.
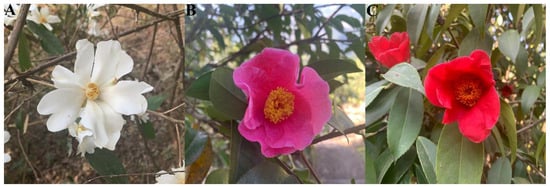
Figure 7.
Petals colors of three C. oleifera varieties: (A): “Camellia yuhsienensis” (White, W); (B): “Camellia semiserrata” (Candy-pink, CP); (C): “Camellia chekiangoleosa” (Dark-red, DR).
4.2. UPLC-MS/MS Analysis
4.2.1. Petal Preparation and Extraction
Fresh petal samples were freeze-dried, and pulverized to powder with a grinder (MM 400, Retsch, Haan, Germany) at 30 Hz for 1.5 min. For each sample, 100 mg of powder was extracted in 1.0 mL of methanol. The extracts were vortexed once every 30 min for 30 s 6 times, and then put in the refrigerator at 4 °C overnight. After the sample was centrifuged (rotational speed 12,000 r·min−1, 10 min) at 4 °C for 3 min, the supernatant was absorbed, filtered by microporous filter membrane (pore size 0.22μm, Anpel Laboratory Technologies, Shanghai, China), and stored in the sample vial for UPLC-MS/MS analysis.
4.2.2. UPLC–MS/MS Conditions
The abundances of flavonoid compounds were quantified with ultrahigh-performance liquid chromatography (UPLC)–mass spectrometry (MS/MS). The UPLC conditions were as follows: (1) SB-C18 column (1.8 µm, 2.1 mm × 100 mm, Agilent, Palo Alto, CA, USA); (2) column temperature: 40 °C; (3) flow rate: 0.35 mL per minute; (4) injection volume: 2.0 µL; (5) fluid phase: phase A is 0.1% formic acid solution, phase B is 0.1% formic acid acetonitrile solution; (6) elution procedure: 0 min, 95% A, 5% B; 0–9 min, 5% A, 95% B; 9–10 min, 5% A, 95% B; 10–11.1 min, 95% A, 5.0% B; 11.1–14 min, 95% A, 5.0% B. The quadrupole orbital trap mass spectrum conditions were as follows: (1) detection mode: positive ion mode (P+), 5500 V and negative ion mode, −4500 V; (2) ESI temperature: 550 °C; (3) GSI, 50 psi; GSII, 60 psi; the curtain gas, 25.0 psi; (4) collision-induced ionization parameter: high; (5) quality scanning range m/z 100–1200, scanning time 0.2 s; (6) a specific set of MRM transitions were monitored for each period according to the metabolites eluted within this period.
The metabolites were analyzed qualitatively by comparing the UPLC-MS/MS data with the local metabolite databases built by Met Ware, and the quantitative analysis of each metabolite was completed by MRM analysis of triple quadrupole mass spectrometry. And then, the mass spectrogram of all metabolites in petals with different color were obtained and the peak area of the mass spectrogram of each metabolite was integrated. Analyst 1.6.3 software (AB SCIEX, Concord, ON, Canada) was applied to process the UPLC-MS/MS data. The MultiaQuant™ software 3.0.3 (AB SCIEX, Concord, ON, Canada) was used to integrate and correct the chromatographic peaks, and the peak area of each chromatographic peak represented the relative content of the corresponding metabolite.
4.3. HS–SPME–GC–MS Analysis
4.3.1. Petal Sample Preparation and Treatment
The fresh petal samples were ground to a powder in liquid nitrogen. An amount of 500 mg of the petal powder was immediately added to a 20 mL head-space vial (Agilent, Palo Alto, CA, USA) with NaCl saturated solution, and then the vials were sealed immediately and balanced for 5 min. Each vial was placed in 60 °C for 5 min for SPME analysis, then 120 μm Divinylbenzene (DVB)/Carboxen (CAR)/Polydimethylsiloxane (PDMS) extraction fibers (Agilent, CA, USA) were exposed to the headspace of the sample for 15 min at 60 °C. Desorption was performed at 250 °C at the injection port of GC-MS for 5 min.
4.3.2. GC–MS Conditions
The GC–MS conditions were as follows: (1) column: DB-5MS capillary column (30 m × 0.25 mm, 0.25 μm, Agilent, Folsom, CA, USA); (2) shunt ratio: 1:15; (3) carrier gas: He (99.9999%); (4) flow rate: 1.2 mL/min; (5) injector temperature: 250 °C and detector: 280 °C; (6) temperature rise condition: 40 °C for 3.5 min, increasing at 10 °C/min to 100 °C, at 7 °C/min to 180 °C, at 25 °C/min to 280 °C, hold for 5 min. The MS conditions were as follows: (1): electron impact (EI) ionisation mode: 70 eV; (2): ion source temperature: 230 °C; (3) quadrupole mass detector: 150 °C; (4): transfer line temperature: 280 °C; (5): collection mode: Scan; (6) quality scanning range: m/z 40~400.
The mass spectrograms corresponding to each chromatographic peak were compared with NIST05 and NIST05s standard spectrum library (NIST Mass Spectral Database 2.2) to identify the volatile organic compounds in three C. oleifera petals. Each sample was repeated three times. The MassHunter quantitative software (version B.08.00, Agilent Technologies Inc., Santa Clara, CA, USA) was carried out to integrate and correct the chromatographic peaks, and peak area normalization method was applied to determine the relative content of each component after detection by GC-MS. The peak area of each chromatographic peak represented the relative content of the corresponding metabolite.
4.4. Qualitative and Quantitative Analyses of Metabolites
Orthogonal partial least squares discriminant (OPLS–DA) analysis was conducted on the total metabolites between samples of different groups and metabolites within samples of different groups to investigate the differences of flavonoid metabolites among the petals of three C. oleifera petals. The screening standards for differential metabolites were (1) Variable importance in projection (VIP), VIP > 1; (2) significance threshold, p < 0.05; (3) fold change ≥ 2 or fold change ≤ 0.5. Through searching the KEGG (Kyoto Encyclopedia of Genes and Genomes) database, functional annotation analysis and metabolic pathway enrichment analysis were performed on metabolites with significantly different contents obtained from metabolomics analysis.
4.5. Statistical Analysis
Chemometric analyses such as hierarchical cluster analysis (HCA), correlation analysis (CA) and orthogonal partial least squares discriminant analysis (OPLS–DA) were performed to systematically analyze the difference of the flavonoid compounds and volatile organic compounds in three C. oleifera petals, which were generated by using R (http://www.r-project.org/ (accessed on 20 September 2023)). Variance of flavonoid compounds and volatile organic compounds among three petals was calculated and generated by using SPSS 26.0 for Windows (SPSS Inc., Chicago, IL, USA). The violin plots and histograms were drawn and generated by using the Origin Pro 2023 for statistics and computing (Origin Lab, Northampton, MA, USA).
5. Conclusions
In our study, the metabolic profiles of coloring substances and volatile organic compounds in three C. oleifera petals with different colors were systematically evaluated to explore the differences in metabolites based on the UPLC–MS/MS and HS–SPME–GC–MS approach. The results demonstrated that a total of 372 flavonoid compounds and 270 volatile organic compounds were detected in the C. oleifera petals, which visually revealed how changes in the composition of flavonoid compounds and volatile organic compounds affected the overall flower color and floral scent of C. oleifera petals. Among them, phenylethyl alcohol, lilac alcohol, and butanoic acid, and 1-methylhexyl ester were the major flavor substances in white C. oleifera petals; hotrienol, alpha-terpineol and 7-Octen-4-ol, 2-methyl-6-methylene-, (S)- were the main flavor substances in candy-pink C. oleifera petals; and hotrienol, butanoic acid, 2-methyl-, 2-methylbutyl ester, and 2,4-Octadienal, (E,E)- were the primary flavor substances in the dark-red C. oleifera petals. Luteolin and kaempferol derivatives might be the key coloring substances contributed to white color formation, and cyanidin and peonidin derivatives were considered as the main coloring substances for candy-pink and dark-red petal coloration. In summary, this study not only investigated the key metabolites that controlled the flower color and fragrance of C. oleifera petals, but also aided in evaluating the metabolic quality of C. oleifera petals by laying a solid foundation for further cultivating C. oleifera varieties with a specific color and strong fragrance.
Supplementary Materials
The following supporting information can be downloaded at: https://www.mdpi.com/article/10.3390/molecules28217248/s1, Table S1: A total of 270 volatile organic compounds tentatively detected and identified from three C. oleifera petal; Table S2: A total of 372 flavonoid metabolite tentatively detected and identified from three C. oleifera petal; Table S3: Differential accumulation metabolites of volatile organic compounds in the W_vs_CP_vs DR comparison; Table S4: Differential accumulation metabolites of volatile organic compounds in the W_vs_CP comparison; Table S5: Differential accumulation metabolites of volatile organic compounds in the W_vs_DR comparison; Table S6: Differential accumulation metabolites of volatile organic compounds in the CP_vs_DR comparison.
Author Contributions
H.Z. and T.Z. conceived and designed the experiments; T.Z. analyzed the data, optimized images, and wrote the manuscript; Q.T., H.X. and M.C. conducted experiments. All authors have read and agreed to the published version of the manuscript.
Funding
This research was supported by the “Qinba State Key Laboratory of Biological Resources and Ecological Environment (Incubation), ‘co-construction of city and school’ scientific research project (second batch) industrialization project” (SXC-2309) and “Talent Initiation Project of Shaanxi University of Technology” (SLGRCQD-2307).
Institutional Review Board Statement
Not applicable.
Informed Consent Statement
Not applicable.
Data Availability Statement
The datasets generated or analyzed in the current study are available from the corresponding author on reasonable request.
Conflicts of Interest
The authors declare that they have no known competing financial interests or personal relationships that could have appeared to influence the work reported in this paper.
Sample Availability
Not applicable.
References
- Xin, T.; de Riek, J.; Guo, H.; Jarvis, D.; Ma, L.; Long, C. Impact of traditional culture on Camellia reticulata in Yunnan, China. J. Ethnobiol. Ethnomed. 2015, 11, 74. [Google Scholar] [CrossRef]
- Yu, X.; Xiao, J.; Chen, S.; Yu, Y.; Ma, J.; Lin, Y.; Li, R.; Lin, J.; Fu, Z.; Zhou, Q.; et al. Metabolite signatures of diverse Camellia sinensis tea populations. Nat. Commun. 2020, 11, 5586. [Google Scholar] [CrossRef] [PubMed]
- Geng, F.; Nie, R.; Yang, N.; Cai, L.; Hu, Y.; Chen, S.; Cheng, X.; Wang, Z.; Chen, L. Integrated transcriptome and metabolome profiling of Camellia reticulata reveal mechanisms of flower color differentiation. Front. Genet. 2022, 13, 1059717. [Google Scholar] [CrossRef] [PubMed]
- Wang, Y.-J.; Kan, Z.-P.; Wan, X.-C.; McGinley, J.-N.; Thompson, H.-J. Differences in chemical composition predictive of in vitro biological activity among commercially important cultivars of genus Camellia. Food Chem. 2019, 297, 124950. [Google Scholar] [CrossRef]
- Jun-ichiro, H.; Kazutoshi, S.; Tomoko, I.; Yurica, S.; Arisa, W.; Chie, T.; Fumina, O.; Tetsuya, S.; Jun, I.; Akihiko, K.; et al. Identification of a novel hedycaryol synthase gene isolated from Camellia brevistyla flowers and floral scent of Camellia cultivars. Planta 2016, 243, 959–972. [Google Scholar]
- Xiang, Z.-Y.; Xia, C.; Feng, S.-L.; Chen, T.; Zhou, L.-J.; Liu, L.; Kong, Q.-B.; Yang, H.-Y.; Ding, C.-B. Assessment of free and bound phenolics in the flowers and floral organs of two Camellia species flower and their antioxidant activities. Food Biosci. 2022, 49, 101905. [Google Scholar] [CrossRef]
- Fu, M.; Yang, X.; Zheng, J.; Wang, L.; Yang, X.; Tu, Y.; Ye, J.; Zhang, W.; Liao, Y.; Cheng, S.; et al. Unraveling the regulatory mechanism of color diversity in Camellia japonica petals by integrative transcriptome and metabolome analysis. Front. Plant Sci. 2021, 12, 685136. [Google Scholar] [CrossRef] [PubMed]
- Zhao, D.; Tao, J. Recent advances on the development and regulation of flower color in ornamental plants. Front. Plant Sci. 2015, 6, 261. [Google Scholar] [CrossRef] [PubMed]
- Zeng, H.-T.; Zheng, T.; Li, Y.; Chen, Q.; Xue, Y.; Tang, Q.; Xu, H.; Chen, M.-J. Characterization variation of the differential coloring substances in rapeseed petals with different colors using UPLC-HESI-MS/MS. Molecules 2023, 28, 5670. [Google Scholar] [CrossRef]
- Tanaka, Y.; Sasaki, N.; Ohmiya, A. Biosynthesis of plant pigments: Anthocyanins, betalains and carotenoids. Plant J. 2008, 54, 733–749. [Google Scholar] [CrossRef] [PubMed]
- Zhao, X.; Zhang, Y.; Long, T.; Wang, S.; Yang, J. Regulation mechanism of plant pigments biosynthesis: Anthocyanins, carotenoids, and betalains. Metabolites 2022, 12, 871. [Google Scholar] [CrossRef] [PubMed]
- Zeng, L.; Huang, L.-J.; Yu, P.-Y.; Chen, J.-L.; Du, S.-X.; Qin, G.-N.; Zhang, L.; Li, N.; Yuan, D.-Y. Development of a protoplast isolation system for functional gene expression and characterization using petals of Camellia oleifera. Plant Physiol. Bioch. 2023, 201, 107885. [Google Scholar]
- Liu, W.; Yu, S.; Feng, Y.; Mo, R.; Wang, K.; Fan, M.; Fan, Z.; Yin, H.; Li, J.; Li, X. Comparative transcriptome and pigment analyses reveal changes in gene expression associated with flavonol metabolism in yellow Camellia. Forests 2022, 13, 1094. [Google Scholar] [CrossRef]
- Post, P.C.; Schlautman, M.-A. Measuring Camellia petal color using a portable color sensor. Horticulturae 2020, 6, 53. [Google Scholar] [CrossRef]
- Caser, M.; Scariot, V. The contribution of volatile organic compounds (VOCs) emitted by petals and pollen to the scent of garden roses. Horticulturae 2022, 8, 409. [Google Scholar] [CrossRef]
- Fan, Z.; Li, J.; Li, X.; Yin, H. Composition analysis of floral scent within genus Camellia uncovers substantial interspecific variations. Sci. Hortic. 2019, 250, 207–213. [Google Scholar] [CrossRef]
- Ibrahim, M.; Agarwal, M.; Hardy, G.-E.-S.-J.; Ren, Y. Optimized methods to analyze rose plant volatile organic compounds by HS-SPME-GC-FID/MSD. J. Biosci. Med. 2017, 5, 13–31. [Google Scholar] [CrossRef]
- Muhlemann, J.; Klempien, A.; Dudareva, N. Floral volatiles: From biosynthesis to function. Plant Cell Environ. 2014, 37, 1936–1949. [Google Scholar] [CrossRef]
- Gan, X.-H.; Liang, Z.-Y.; Wang, D.-P.; Wang, R. Analysis of aroma components in flowers of three kinds of Camellia by HS-SPME/GC-MS. Food Sci. 2013, 34, 204–207. [Google Scholar]
- Fang, Z.-M.; Hu, X.-H.; Liu, C.-Q.; Huang, S.-X. A new method for quantitative analysis of flower scent of Siraitia grosvenorii. Guihaia 2018, 38, 1505–1511. [Google Scholar]
- Robin, J.; Poona, M.; Ashu, G. Biochemical attributes of tea flowers (Camellia sinensis) at different developmental stages in the Kangra region of India. Sci. Hortic. 2011, 130, 266–274. [Google Scholar]
- Qiu, J.-S.; Zhang, Y.-X.; Chen, J.-Y.; Tian, M.-J.; Xie, Z.-H.; Chen, X.-M. Study on the volatile components in flowers of 12 Camellia species. Forest Res. 2015, 28, 358–364. [Google Scholar]
- Ma, Y.; Liu, M.; Tan, T.; Yan, A.; Guo, L.; Jiang, K.; Tan, C.-H.; Wan, Y. Deep eutectic solvents used as extraction solvent for the determination of flavonoids from Camellia oleifera flowers by high-performance liquid chromatography. Phytochem. Anal. 2018, 29, 639–648. [Google Scholar] [CrossRef] [PubMed]
- Fu, W.; Chen, D.; Pan, Q.; Li, F.; Zhao, Z.; Ge, X.; Li, Z. Production of red-flowered oilseed rape via the ectopic expression of Orychophragmus violaceus OvPAP2. Plant Biotechnol. J. 2018, 16, 367–380. [Google Scholar] [CrossRef]
- Mekapogu, M.; Vasamsetti, B.-M.-K.; Kwon, O.-K.; Ahn, M.-S.; Lim, S.-H.; Jung, J.-A. Anthocyanins in floral colors: Biosynthesis and regulation in Chrysanthemum flowers. Int. J. Mol. Sci. 2020, 21, 6537. [Google Scholar] [CrossRef] [PubMed]
- Nishihara, M.; Nakatsuka, T. Genetic engineering of novel flower colors in floricultural plants: Recent advances via transgenic approaches. Methods Mol. Biol. 2010, 589, 325–347. [Google Scholar] [PubMed]
- Li, S.; Li, X.; Wang, X.; Chang, T.; Peng, Z.; Guan, C.; Guan, M. Flavonoid synthesis-related genes determine the color of flower petals in Brassica napus L. Int. J. Mol. Sci. 2023, 24, 6472. [Google Scholar] [CrossRef]
- Horiuchi, R.; Nishizaki, Y.; Okawa, N.; Ogino, A.; Sasaki, N. Identification of the biosynthetic pathway for anthocyanin triglucoside, the precursor of polyacylated anthocyanin, in Red cabbage. J. Agric. Food Chem. 2020, 68, 9750–9758. [Google Scholar] [CrossRef] [PubMed]
- Khoo, H.-E.; Azlan, A.; Tang, S.-T.; Lim, S.-M. Anthocyanidins and anthocyanins: Colored pigmentsas food, pharmaceutical ingredients, and the potential health benefits. Food Nutr. Res. 2017, 61, 1361779. [Google Scholar] [CrossRef]
- Jin, J.; Yang, X.; Zhou, W. Research progress of flavonoids on Rosa rugosa Thunb. J. Anhui Agric. Sci. 2019, 47, 14–17. [Google Scholar]
- Gong, H.-L.; Xu, J.; Tian, Z.; Chen, Q.-Q.; Bao, J.-T.; Yuan, H.-J. Preliminary study on the extraction and stability of red pigmentfrom kushui rose. Storage Proc. 2019, 19, 112–118. [Google Scholar]
- Zhang, L.; Xu, Z.-D.; Tang, T.-F. Analysis of anthocyanins related compounds and their biosynthesis pathways in Rosa rugosa ‘Zi zhi’ at blooming stages. Sci. Agric. Sin. 2015, 48, 2600–2611. [Google Scholar]
- Zhou, L.; Wang, Y.; Peng, Z.-H. Advances in study on formation mechanism and genetic engineering of yellow flowers. Sci. Silv. Sin. 2009, 45, 111–119. [Google Scholar]
- Wei, L.Q.; Chong, P.-F.; Bao, X.-G.; He, H.-L.; Li, Q.-Q. Metabolomics analysis of flower color substances in three Rose rugosa cultivars. Guihaia 2023, 1–15. [Google Scholar]
- Li, X.-L.; Wang, J.-T.; Sun, Z.-Y. Anthocyanin components and their relationship with flower colors in petals of Camellia japonica ‘Chidan’ and its bud mutation cultivars. Sci. Silv. Sin. 2019, 55, 19–26. [Google Scholar]
- Yi, D.-B.; Zhang, H.-N.; Lai, B.; Liu, L.-Q.; Pan, X.-L.; Ma, Z.-L.; Wang, Y.-C.; Xie, J.-H.; Shi, S.-Y.; Wei, Y.-Z. Integrative analysis of the coloring mechanism of red longan pericarp through metabolome and transcriptome analyses. J. Agric. Food Chem. 2021, 69, 1806–1815. [Google Scholar] [CrossRef]
- Liu, X.; Han, Y.; Luo, L.; Pan, H.; Cheng, T.; Zhang, Q. Multiomics analysis reveals the mechanisms underlying the different floral colors and fragrances of Rosa hybrida cultivars. Plant Physiol. Bioch. 2023, 195, 101–113. [Google Scholar] [CrossRef] [PubMed]
- Zhang, W.; Yan, M.; Zheng, X.; Chen, Z.; Li, H.; Mao, J.; Qin, H.; Zhu, C.; Du, H.; Abd El-Aty, A.-M. Exploring the aroma fingerprint of various chinese pear cultivars through qualitative and quantitative analysis of volatile compounds using HS-SPME and GC×GC-TOFMS. Molecules 2023, 28, 4794. [Google Scholar] [CrossRef] [PubMed]
- Goliáš, J.; Balík, J.; Létal, J. Identification of volatiles formed in Asian pear cultivars subjected to short-term storage using multinomial logistic regression. J. Food Compos. Anal. 2021, 97, 103793. [Google Scholar] [CrossRef]
- Ding, X.-W.; Wang, Z.-Z.; Wang, Q.-G.; Jiang, H.-Y.; Chen, M.; Li, S.-F. Analysis of floral volatile components of in Paeonia delavayi with differrent colors. Southern Hortic. 2022, 33, 25–30. [Google Scholar]
- Ohashi, T.; Miyazawa, Y.; Ishizaki, S.; Kurobayashi, Y.; Saito, T. Identification of odor-active trace compounds in blooming flower of damask rose (Rosa damascena). J. Agric. Food Chem. 2019, 67, 7410–7415. [Google Scholar] [CrossRef] [PubMed]
- Joichi, A.; Yomogida, K.; Awano, K.-I.; Ueda, Y. Volatile components of tea-scented modern roses and ancient Chinese roses. Flavour Frag. J. 2005, 20, 152–157. [Google Scholar] [CrossRef]
- Liu, J.-H.; Yan, H.-J.; Yang, J.-H.; Jian, H.-Y.; Zhang, H.; Chen, M.; Tang, K.-X. Analysis of Volatile components from Rosa odorata complex by SPME-GC/MS. Southwest China J. Agric. Sci. 2018, 31, 587–591. [Google Scholar]
- Liu, B.-F.; Gao, F.-Z.; Fang, Q.; Wang, L. Determination of red freesia flower volatiles with indirect headspace solid phase microextraction coupled to gas chromatography and mass spectrometry. Chinese J. Anal. Chem. 2015, 44, 444–450. [Google Scholar]
- Zhang, M.; Huang, Y.-L.; Song, F.; Chen, W.-J.; Zhao, S.-L.; Deng, F.-M. SPME-GC/MS combined analysis of aroma components of Areca catechu. J. Trop. Agric. Sci. 2014, 35, 1244–1249. [Google Scholar]
Disclaimer/Publisher’s Note: The statements, opinions and data contained in all publications are solely those of the individual author(s) and contributor(s) and not of MDPI and/or the editor(s). MDPI and/or the editor(s) disclaim responsibility for any injury to people or property resulting from any ideas, methods, instructions or products referred to in the content. |
© 2023 by the authors. Licensee MDPI, Basel, Switzerland. This article is an open access article distributed under the terms and conditions of the Creative Commons Attribution (CC BY) license (https://creativecommons.org/licenses/by/4.0/).

