


Thermodynamic Assessment of Triclocarban Dissolution Process in N-Methyl-2-pyrrolidone + Water Cosolvent Mixtures

 , ,
, ,  and
and 
Abstract
:
1. Introduction
2. Results
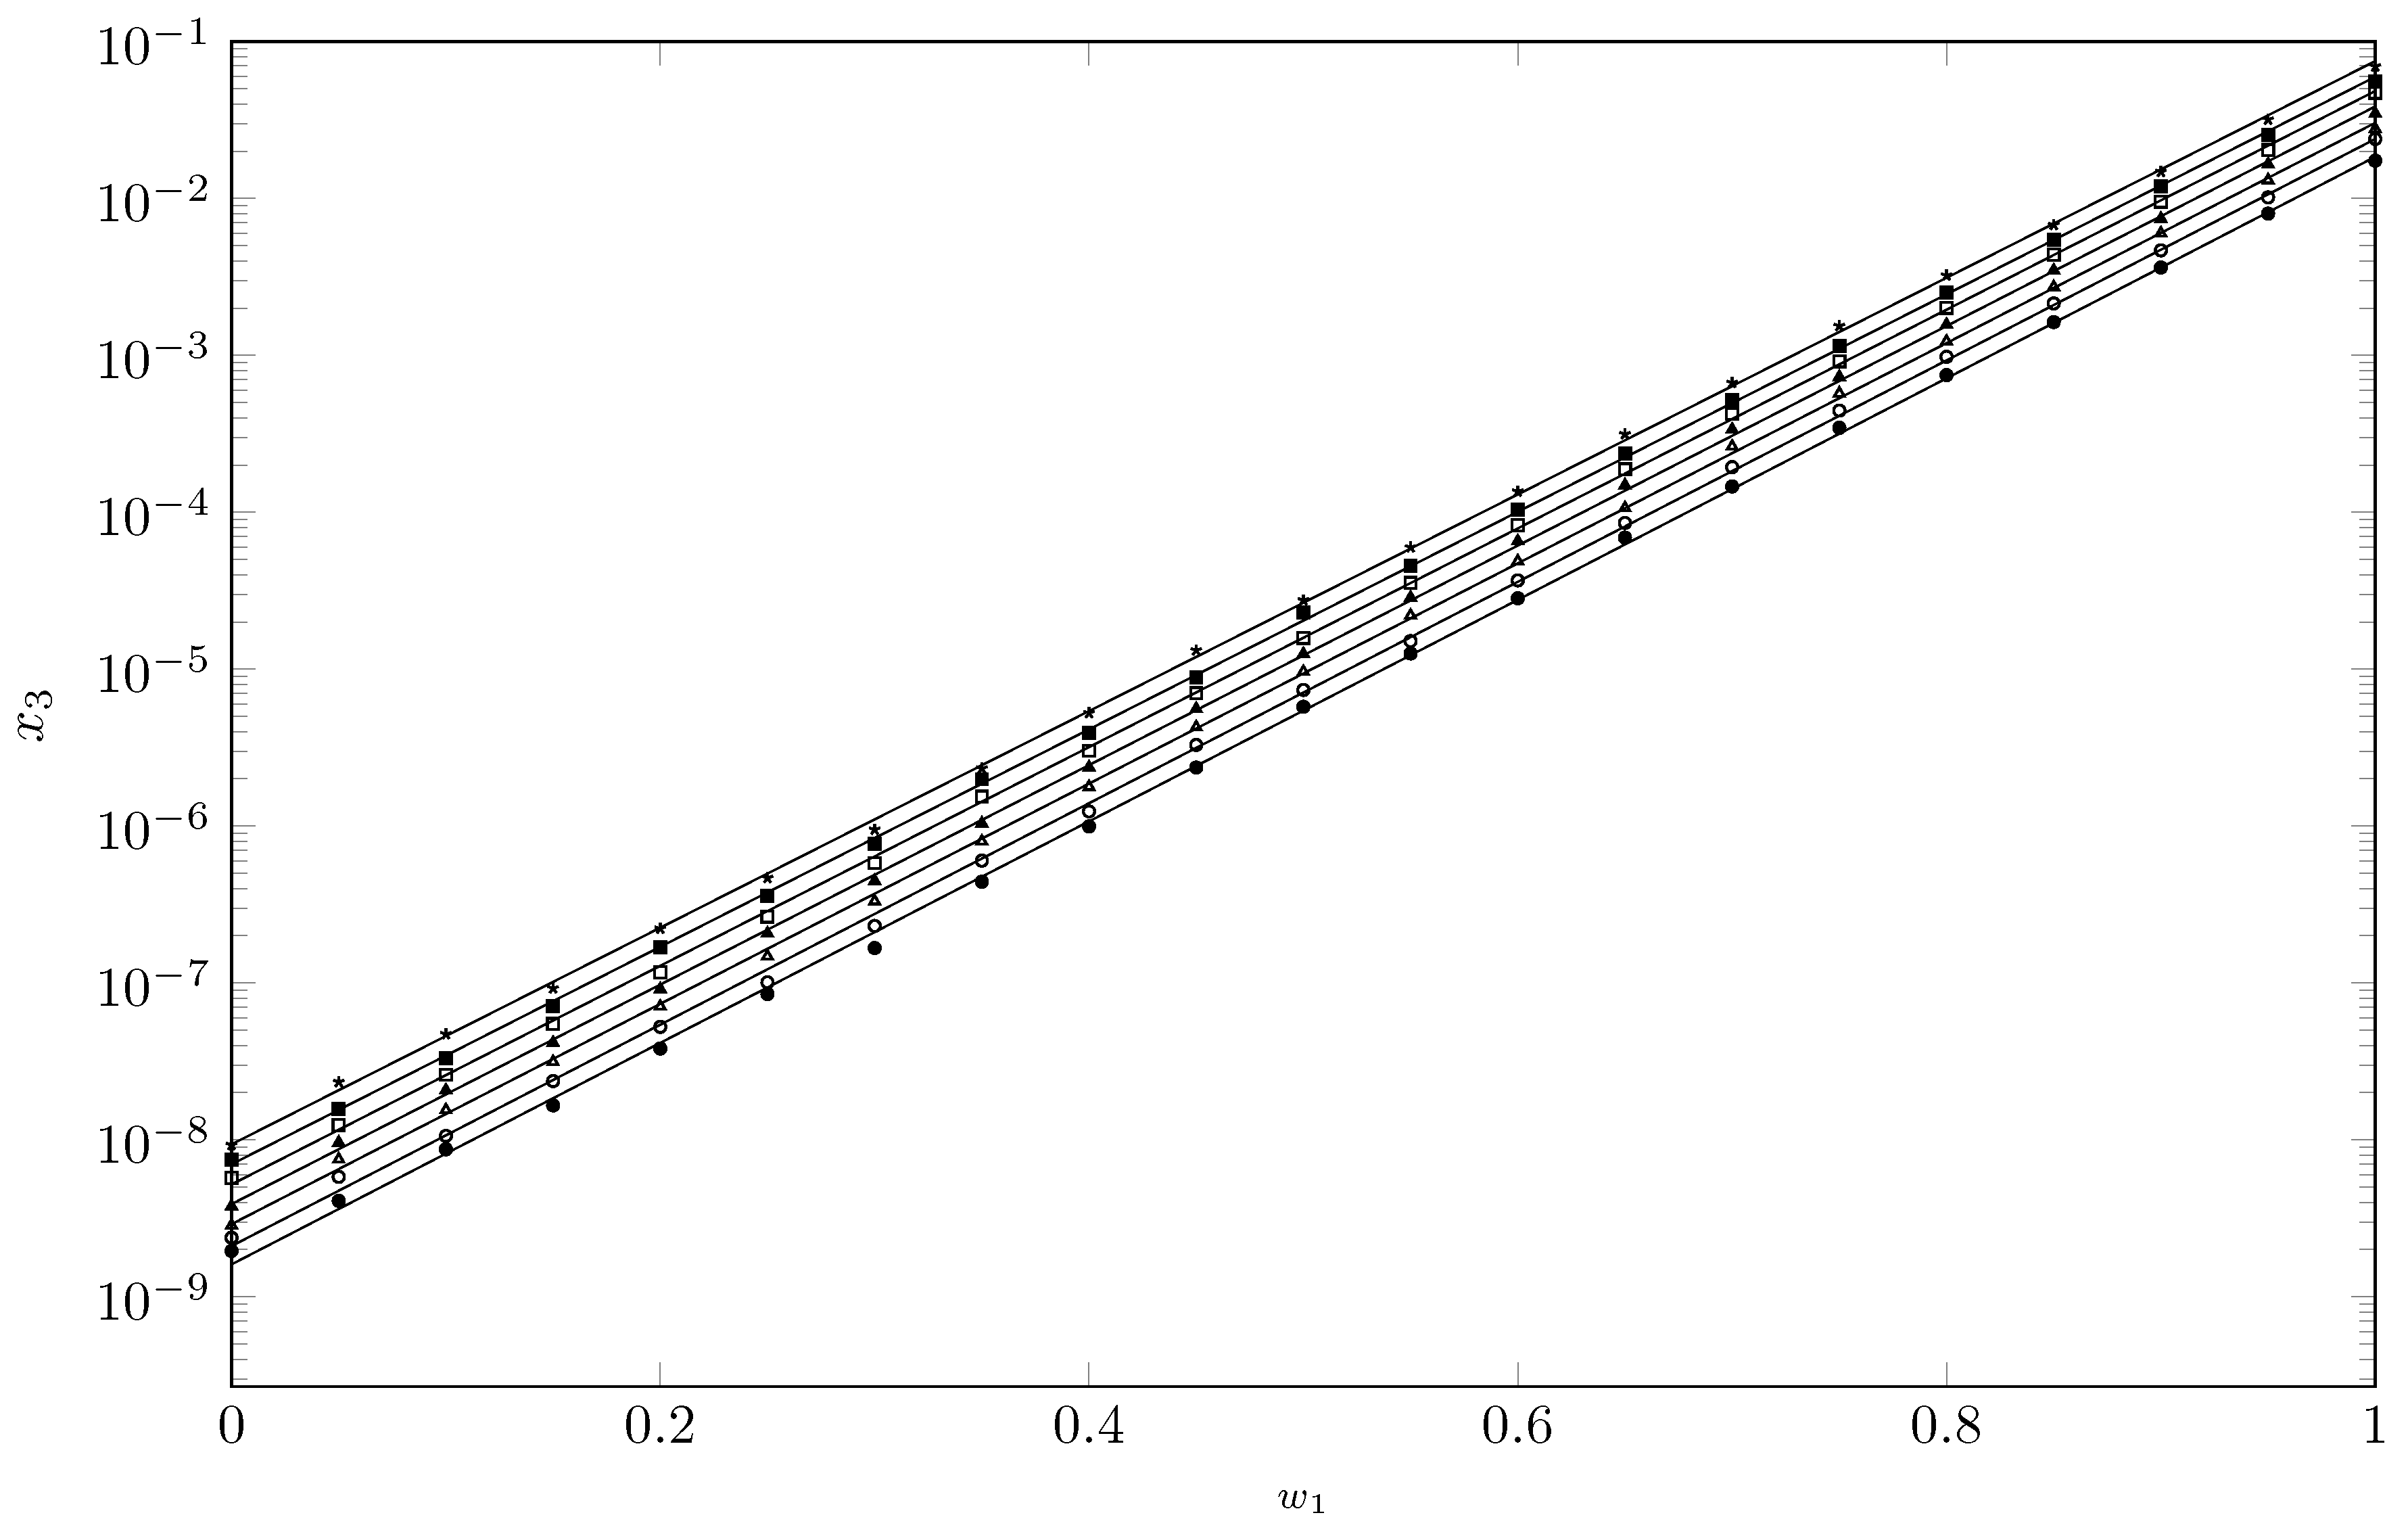
2.1. Experimental Solubility ()

| Temperature/K | ||||
|---|---|---|---|---|
| 288.15 | 293.15 | 298.15 | 303.15 | |
| 0.00 | 1.96 × 10⁻⁹ d | 2.38 × 10⁻⁹ d | 2.85 × 10⁻⁹ d | 3.78 × 10⁻⁹ d |
| 0.05 | 4.088 (0.020) × 10 | 5.81 (0.07) × 10 | 7.52 (0.10) × 10 | 9.61 (0.10) × 10 |
| 0.10 | 8.71 (0.11) × 10 | 10.56 (0.09) × 10 | 15.48 (0.28) × 10 | 20.68 (0.2) × 10 |
| 0.15 | 1.66 (0.009) × 10 | 2.368 (0.013) × 10 | 3.143 (0.017) × 10 | 4.155 (0.042) × 10 |
| 0.20 | 3.82 (0.04) × 10 | 5.25 (0.04) × 10 | 7.09 (0.07) × 10 | 9.14 (0.04) × 10 |
| 0.25 | 8.5 (0.14) × 10 | 10.12 (0.13) × 10 | 14.751 (0.023) × 10 | 20.68 (0.06) × 10 |
| 0.30 | 1.669 (0.016) × 10 | 2.305 (0.026) × 10 | 3.32 (0.04) × 10 | 4.47 (0.04) × 10 |
| 0.35 | 4.424 (0.012) × 10 | 6.02 (0.06) × 10 | 7.99 (0.04) × 10 | 10.36 (0.04) × 10 |
| 0.40 | 0.996 (0.008) × 10 | 1.245 (0.007) × 10 | 1.783 (0.02) × 10 | 2.375 (0.018) × 10 |
| 0.45 | 2.363 (0.016) × 10 | 3.29 (0.04) × 10 | 4.27 (0.04) × 10 | 5.58 (0.04) × 10 |
| 0.50 | 5.76 (0.05) × 10 | 7.371 (0.023) × 10 | 9.64 (0.14) × 10 | 12.52 (0.05) × 10 |
| 0.55 | 1.258 (0.007) × 10 | 1.505 (0.01) × 10 | 2.205 (0.005) × 10 | 2.86 (0.029) × 10 |
| 0.60 | 2.827 (0.031) × 10 | 3.679 (0.032) × 10 | 4.884 (0.015) × 10 | 6.542 (0.035) × 10 |
| 0.65 | 6.89 (0.07) × 10 | 8.55 (0.09) × 10 | 10.64 (0.11) × 10 | 14.86 (0.05) × 10 |
| 0.70 | 1.459 (0.013) × 10 | 1.94 (0.021) × 10 | 2.628 (0.009) × 10 | 3.369 (0.03) × 10 |
| 0.75 | 3.456 (0.024) × 10 | 4.449 (0.033) × 10 | 5.73 (0.014) × 10 | 7.29 (0.04) × 10 |
| 0.80 | 7.48 (0.08) × 10 | 9.79 (0.1) × 10 | 12.28 (0.2) × 10 | 15.7 (0.13) × 10 |
| 0.85 | 1.631 (0.025) × 10 | 2.143 (0.009) × 10 | 2.728 (0.023) × 10 | 3.48 (0.018) × 10 |
| 0.90 | 3.63 (0.03) × 10 | 4.669 (0.03) × 10 | 6.004 (0.029) × 10 | 7.43 (0.13) × 10 |
| 0.95 | 8.01 (0.06) × 10 | 10.16 (0.09) × 10 | 13.09 (0.10) × 10 | 16.52 (0.10) × 10 |
| 1.00 | 1.741 (0.009) × 10 | 2.396 (0.017) × 10 | 2.777 (0.018) × 10 | 3.473 (0.015) × 10 |
| Temperature/K | ||||
| 308.15 | 313.15 | 318.15 | ||
| 0.00 | 5.72 × 10⁻⁹ d | 7.48 × 10⁻⁹ d | 9.28 × 10⁻⁹ d | |
| 0.05 | 12.39 (0.08) × 10 | 15.83 (0.1) × 10 | 23.42 (0.3) × 10 | |
| 0.10 | 25.99 (0.27) × 10 | 33.2 (0.3) × 10 | 47.2 (0.8) × 10 | |
| 0.15 | 5.48 (0.05) × 10 | 7.13 (0.07) × 10 | 9.25 (0.11) × 10 | |
| 0.20 | 11.7 (0.12) × 10 | 16.87 (0.18) × 10 | 22.19 (0.25) × 10 | |
| 0.25 | 26.48 (0.27) × 10 | 36.05 (0.37) × 10 | 46.7 (0.6) × 10 | |
| 0.30 | 5.81 (0.08) × 10 | 7.68 (0.1) × 10 | 9.49 (0.07) × 10 | |
| 0.35 | 15.35 (0.15) × 10 | 19.92 (0.19) × 10 | 23.3 (0.31) × 10 | |
| 0.40 | 3.02 (0.02) × 10 | 3.93 (0.03) × 10 | 5.25 (0.01) × 10 | |
| 0.45 | 7.028 (0.016) × 10 | 8.877 (0.02) × 10 | 13.18 (0.1) × 10 | |
| 0.50 | 15.83 (0.11) × 10 | 22.96 (0.16) × 10 | 27.5 (0.28) × 10 | |
| 0.55 | 3.55 (0.04) × 10 | 4.57 (0.05) × 10 | 5.979 (0.024) × 10 | |
| 0.60 | 8.281 (0.025) × 10 | 10.415 (0.032) × 10 | 13.57 (0.2) × 10 | |
| 0.65 | 18.82 (0.05) × 10 | 23.63 (0.07) × 10 | 31.47 (0.13) × 10 | |
| 0.70 | 4.24 (0.04) × 10 | 5.186 (0.004) × 10 | 6.69 (0.05) × 10 | |
| 0.75 | 9.176 (0.031) × 10 | 11.49 (0.04) × 10 | 15.4 (0.16) × 10 | |
| 0.80 | 20.05 (0.17) × 10 | 25.07 (0.22) × 10 | 32.31 (0.32) × 10 | |
| 0.85 | 4.388 (0.032) × 10 | 5.48 (0.04) × 10 | 6.79 (0.05) × 10 | |
| 0.90 | 9.54 (0.06) × 10 | 11.89 (0.08) × 10 | 14.78 (0.11) × 10 | |
| 0.95 | 20.33 (0.26) × 10 | 25.32 (0.33) × 10 | 31.84 (0.23) × 10 | |
| 1.00 | 4.72 (0.04) × 10 | 5.585 (0.018) × 10 | 6.95 (0.11) × 10 | |
2.2. Ideal Solubility and Activity Coefficients
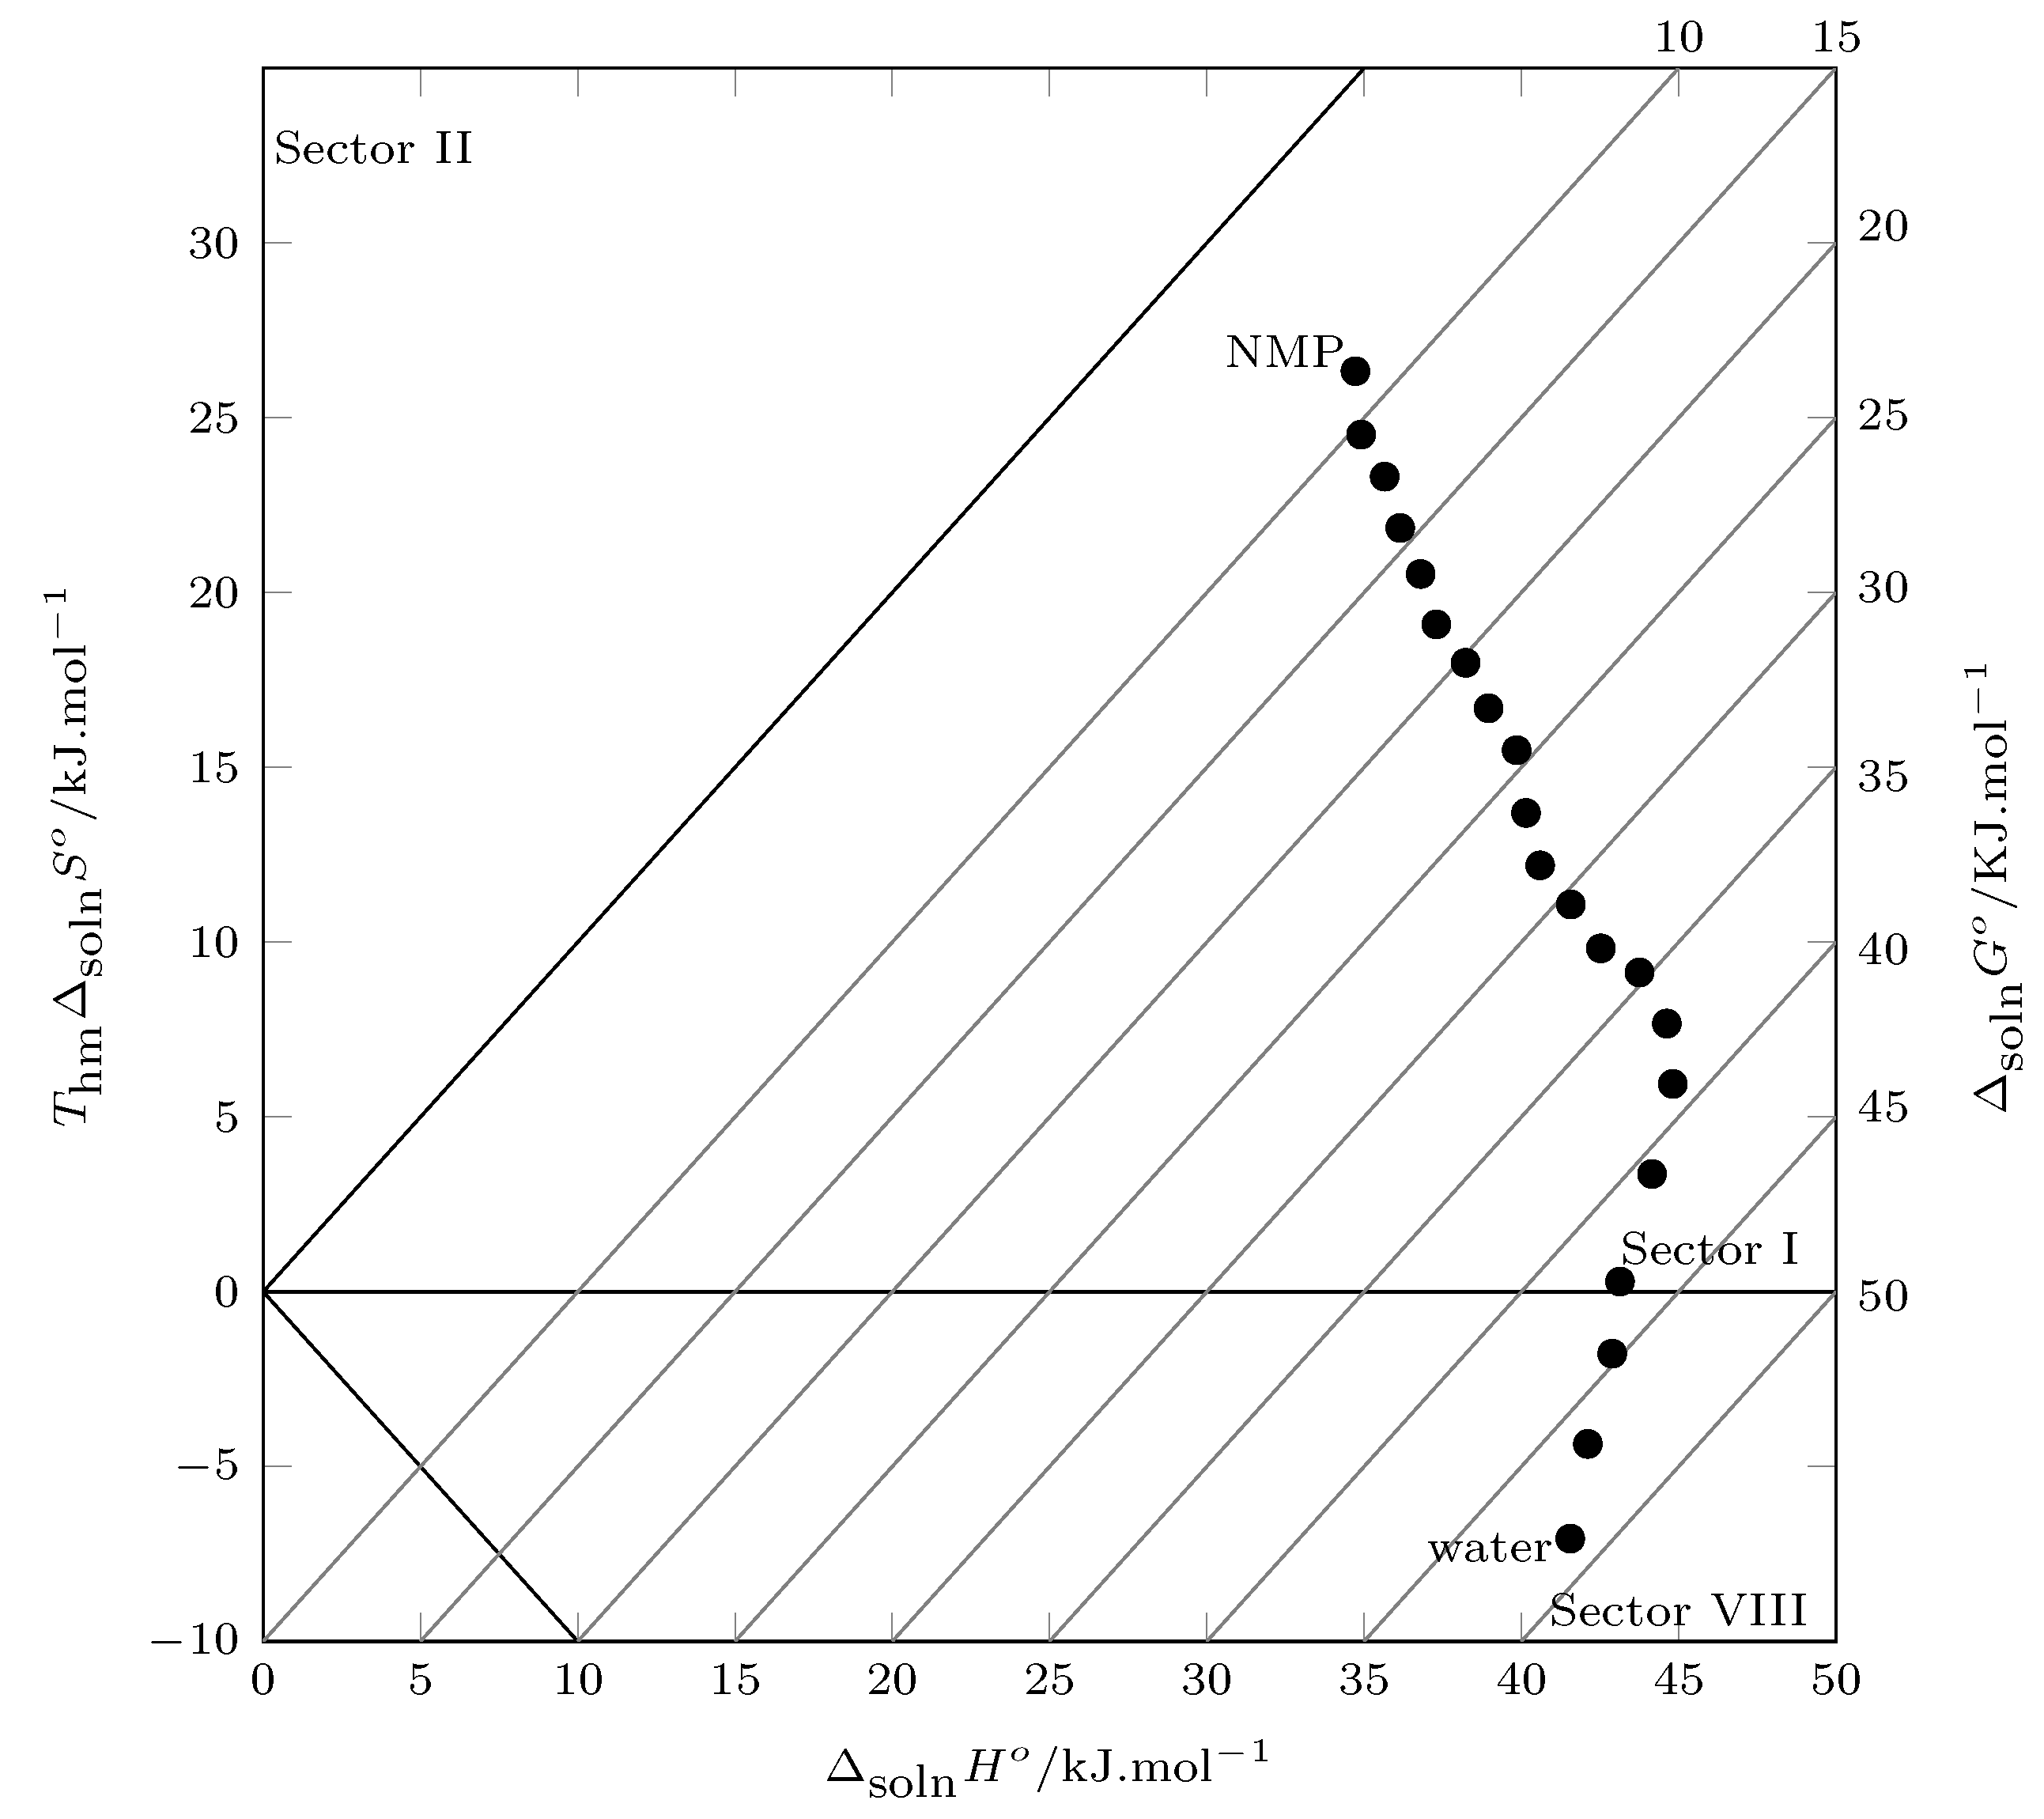
2.3. Thermodynamic Functions of Solution
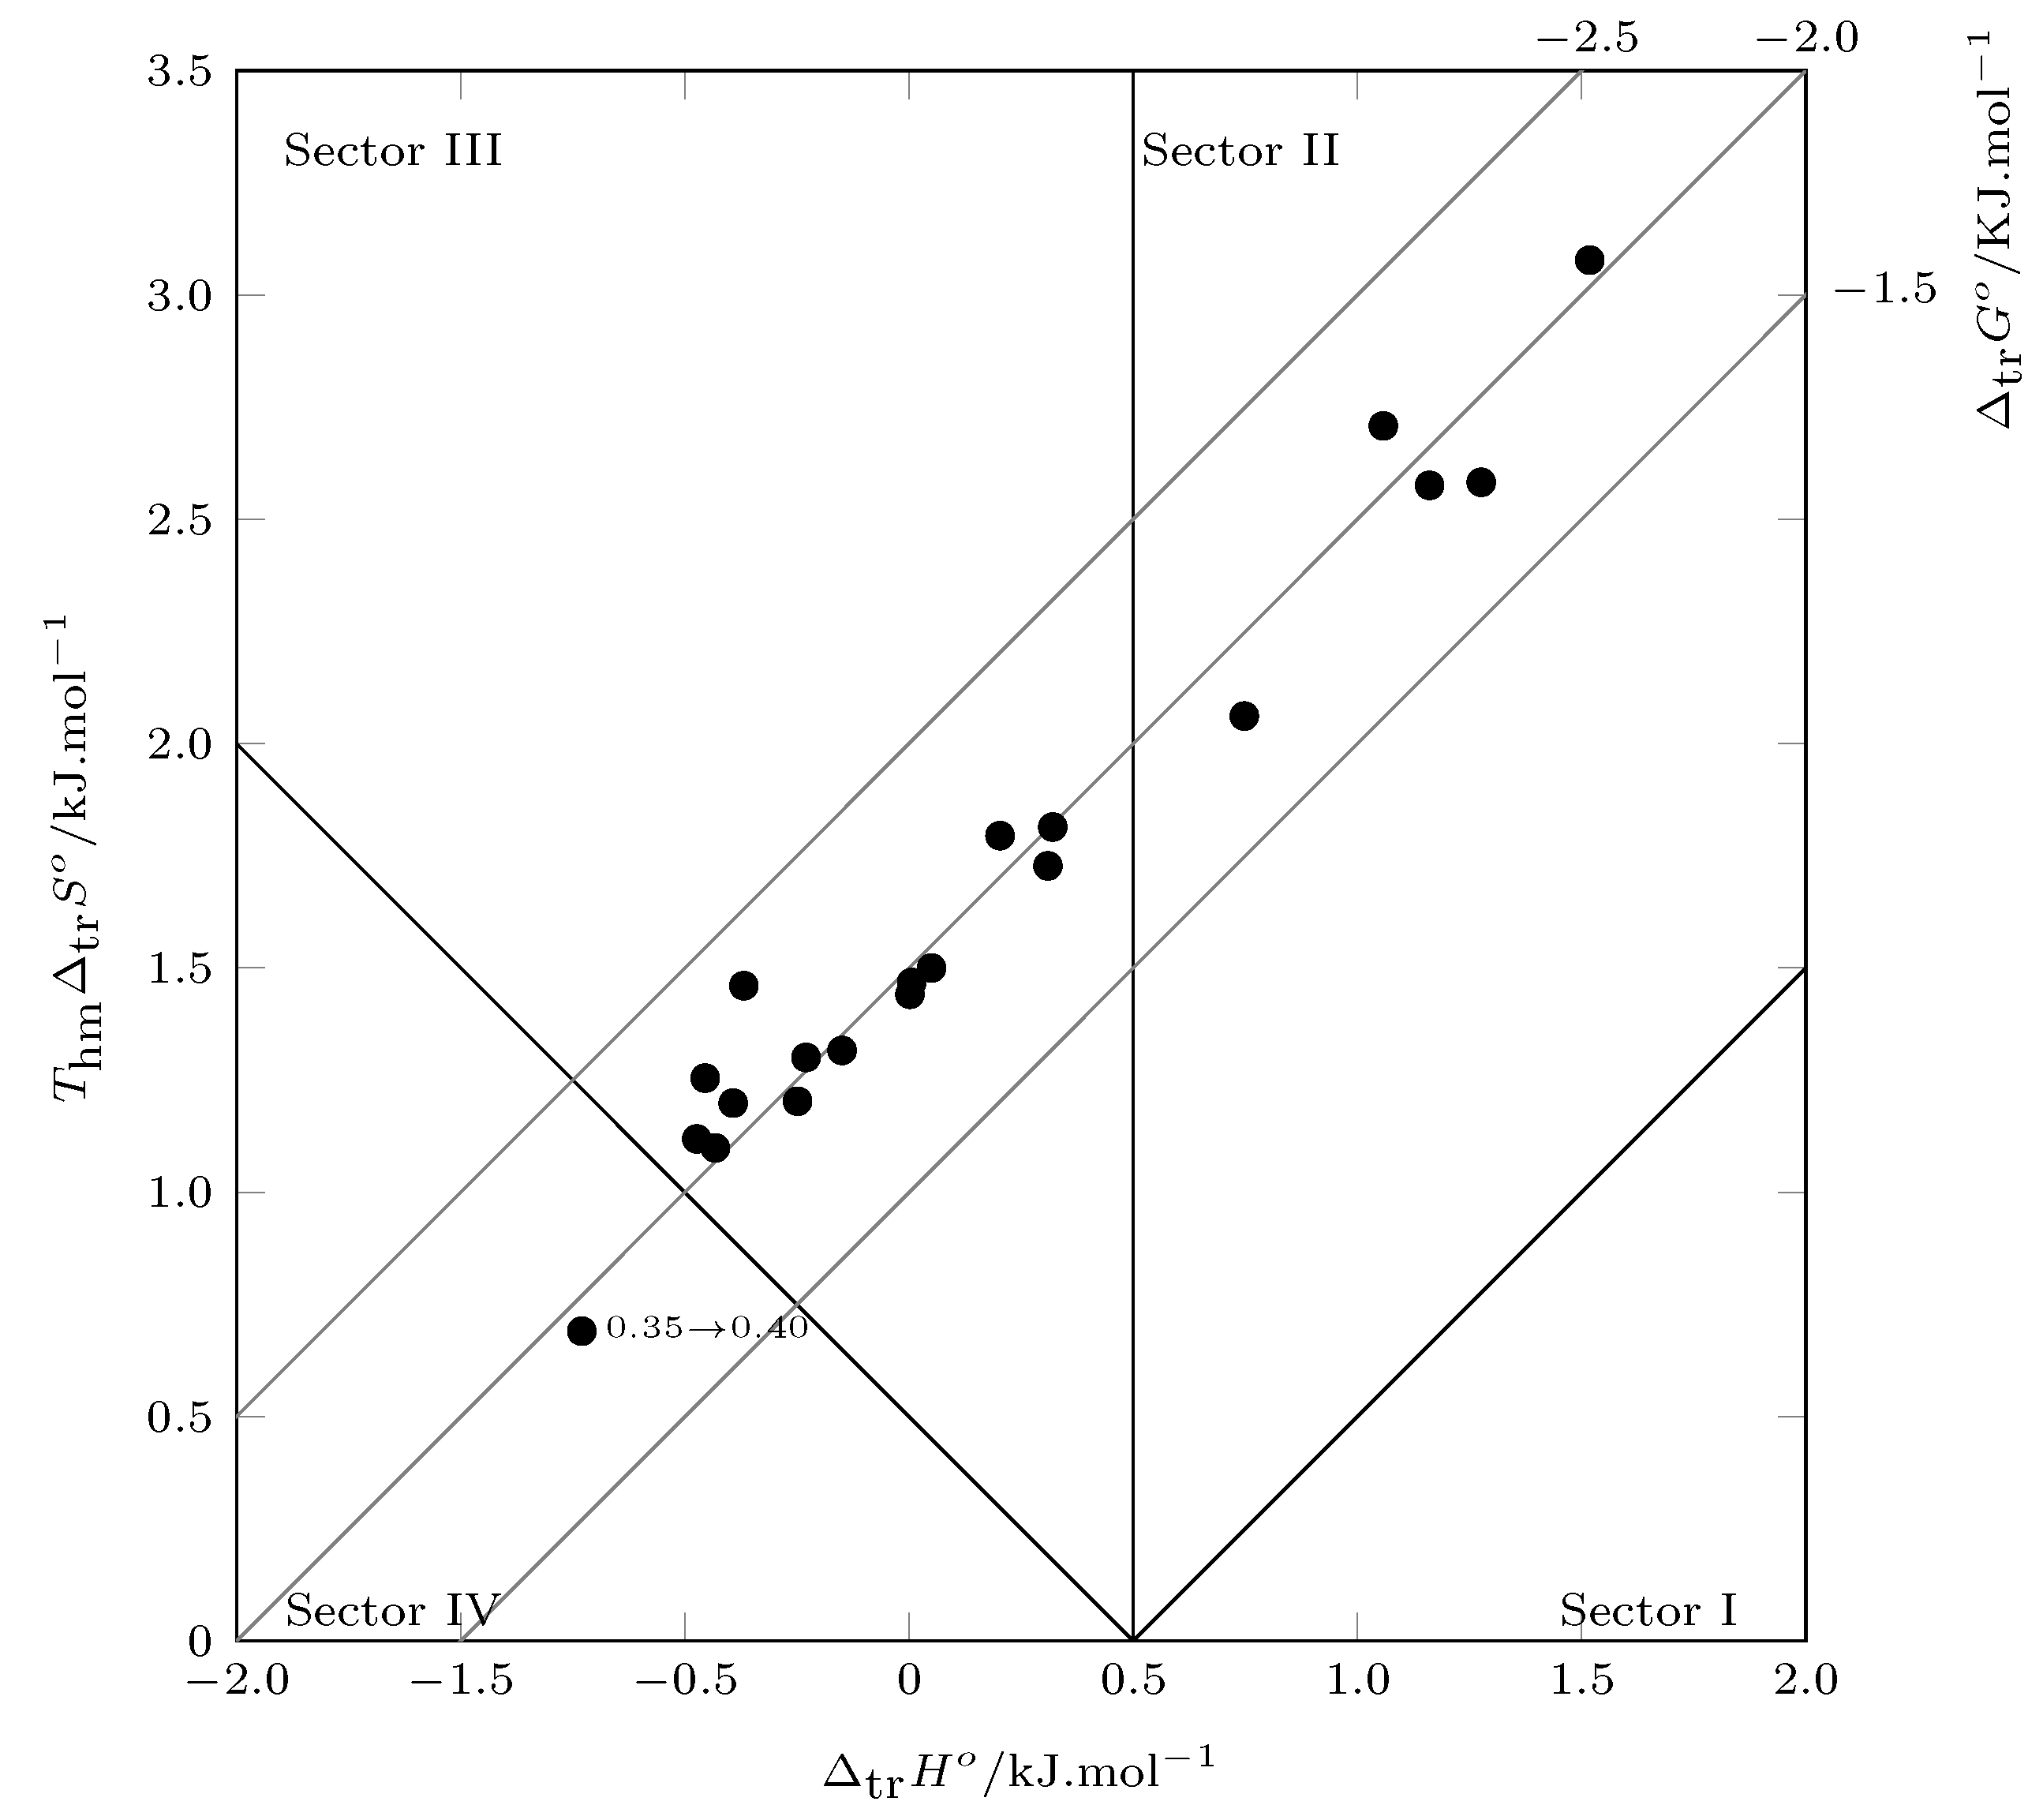
2.4. Thermodynamic Functions of Transfer
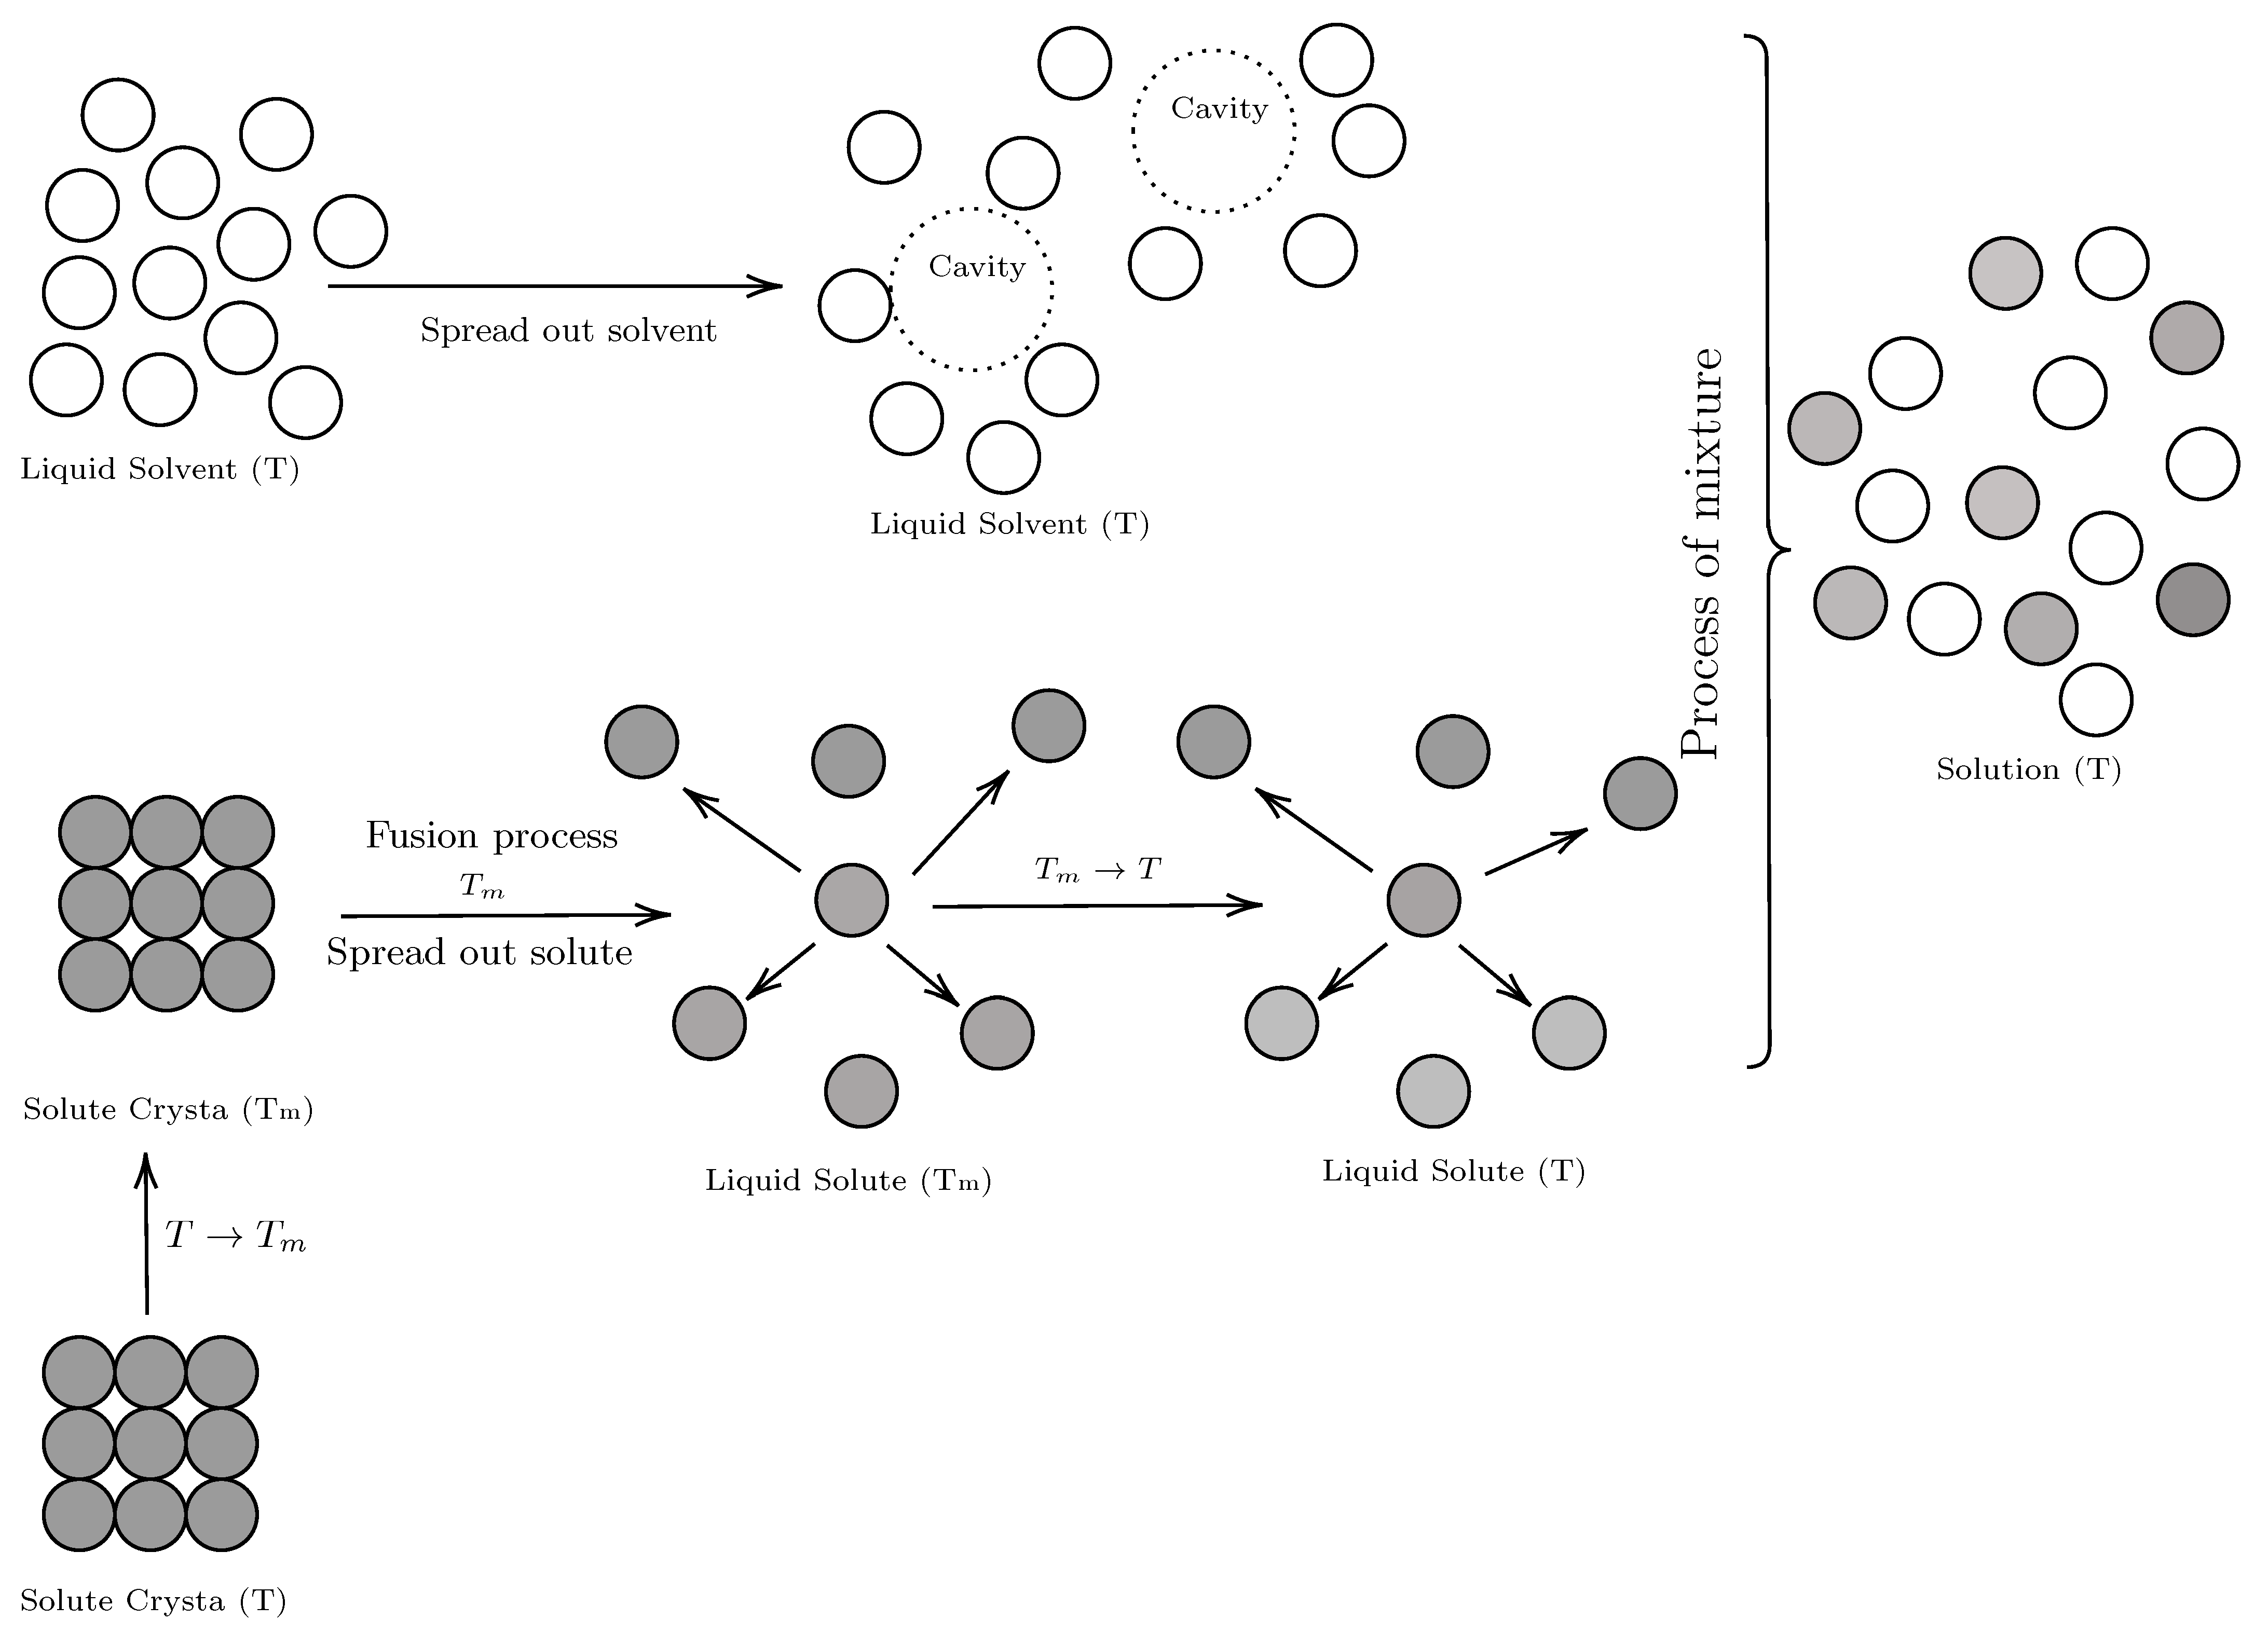
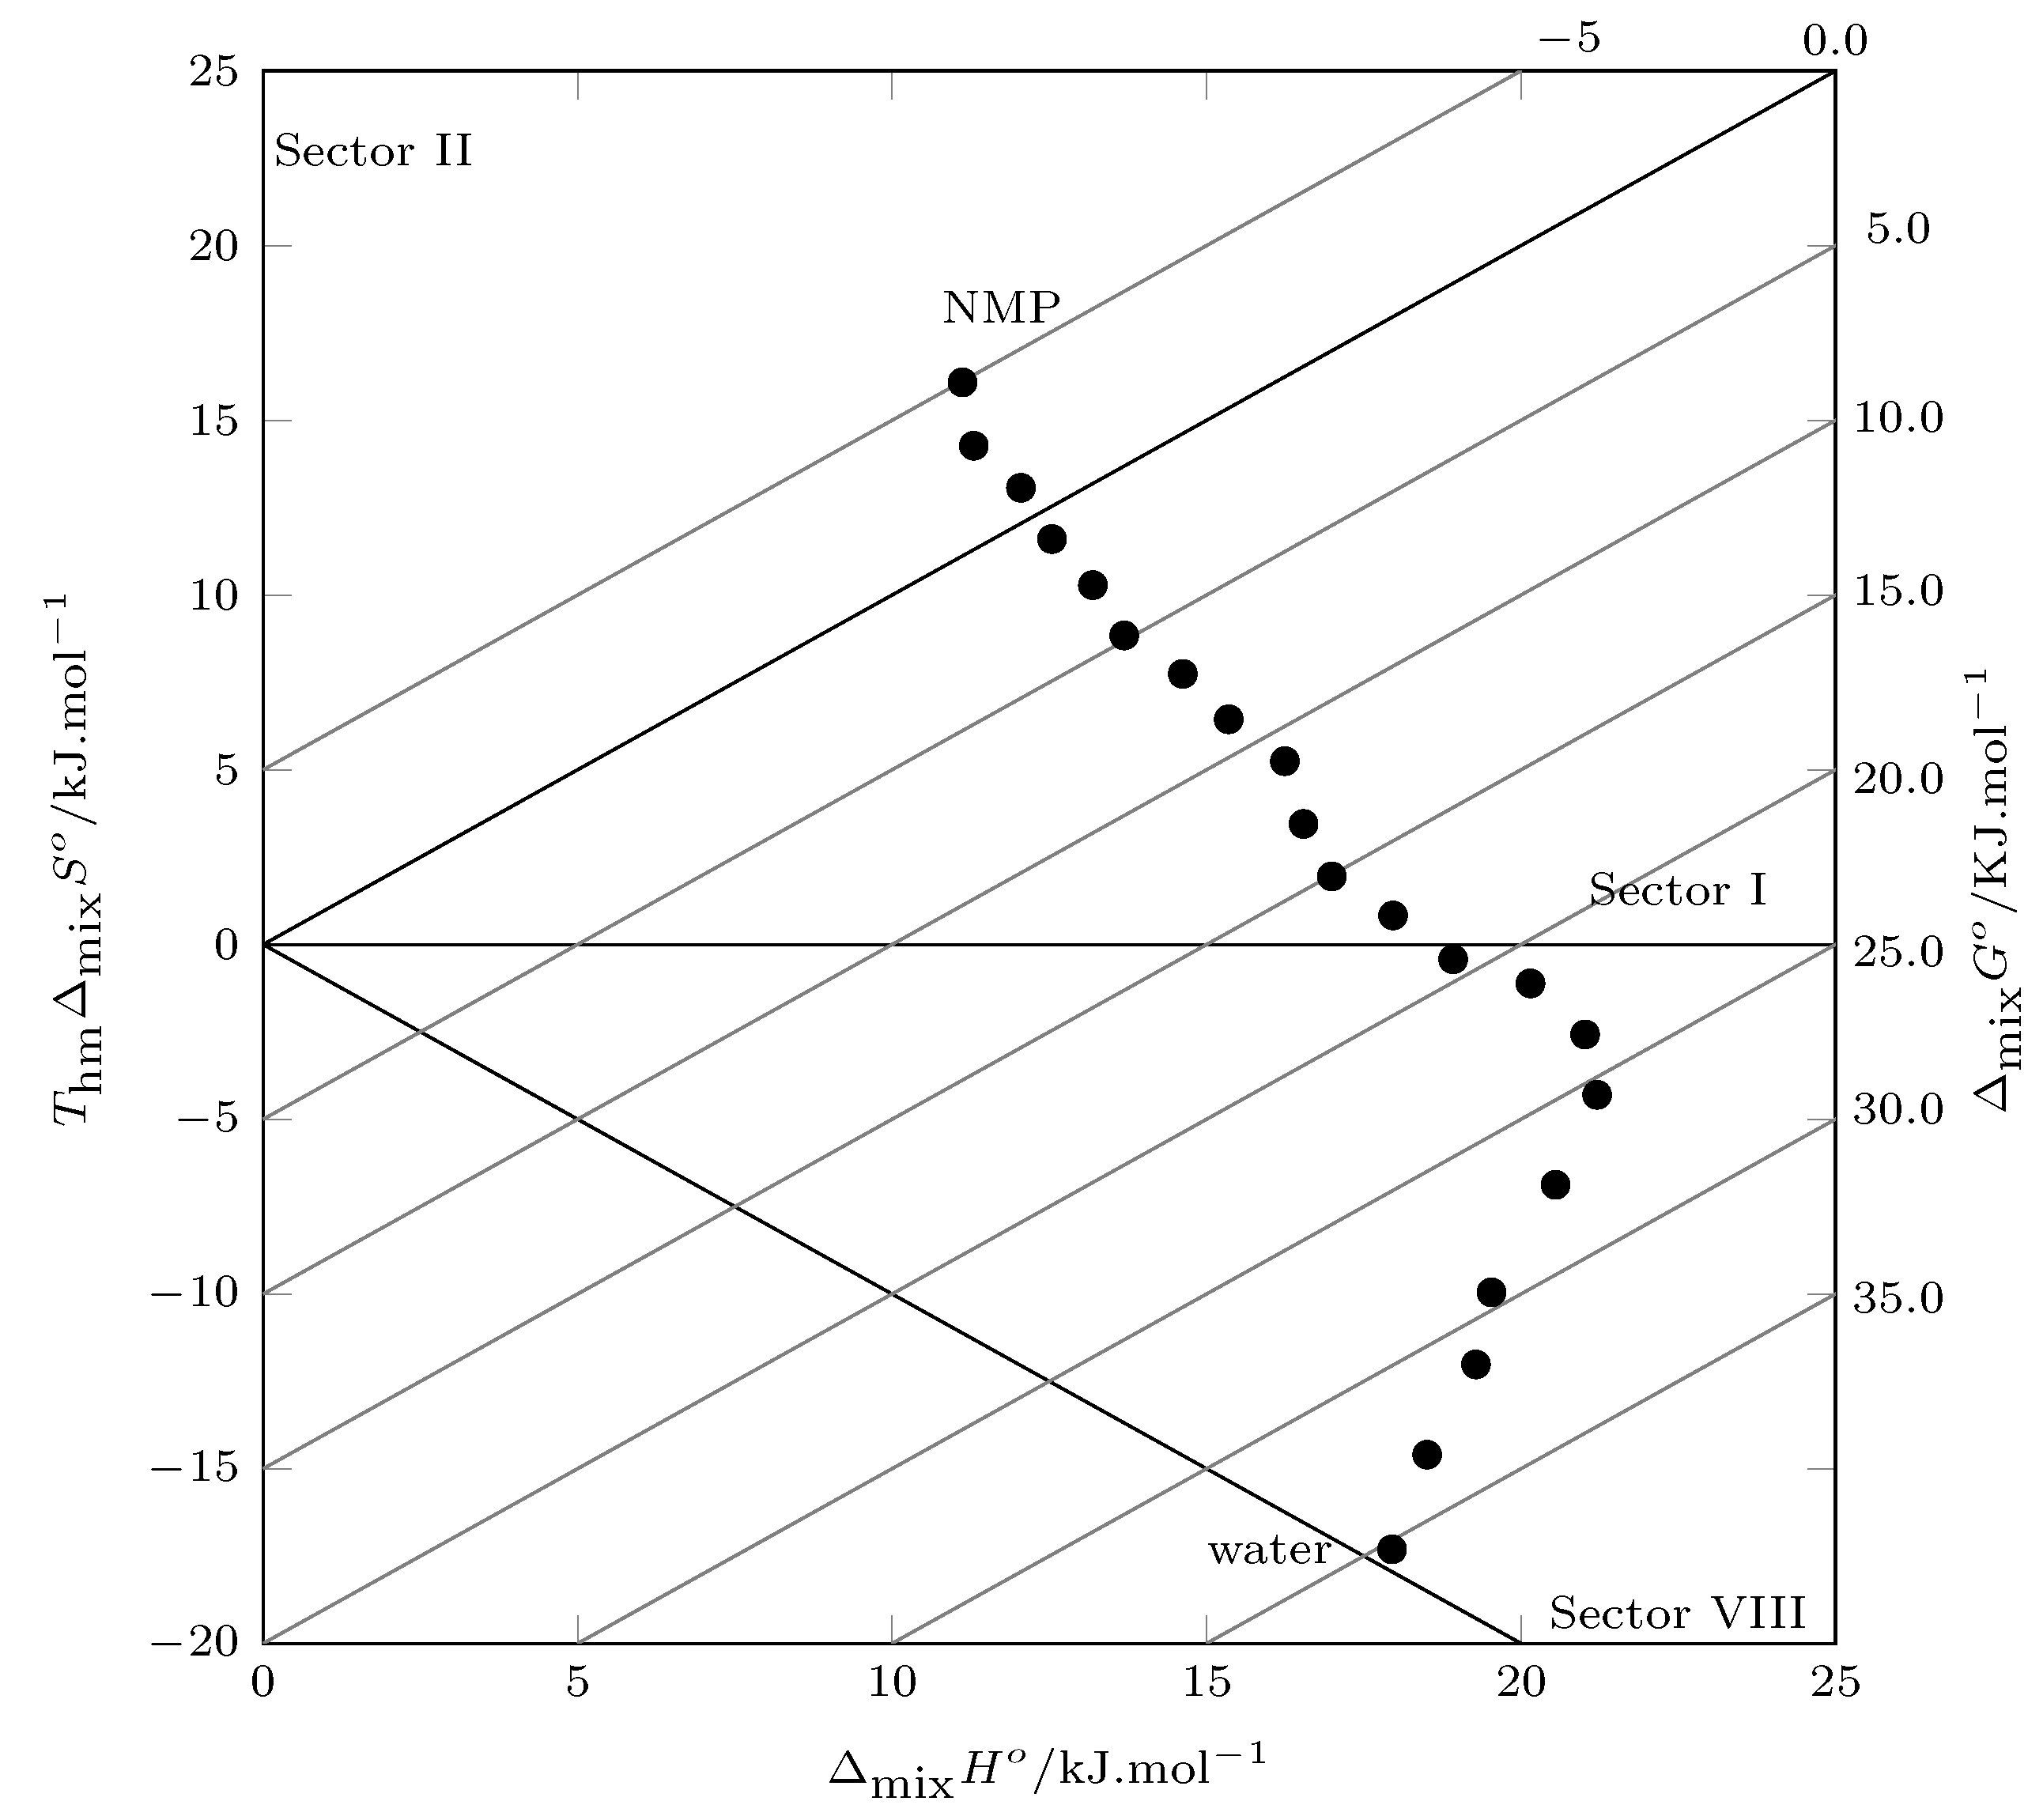
2.5. Thermodynamic Functions of Mixing
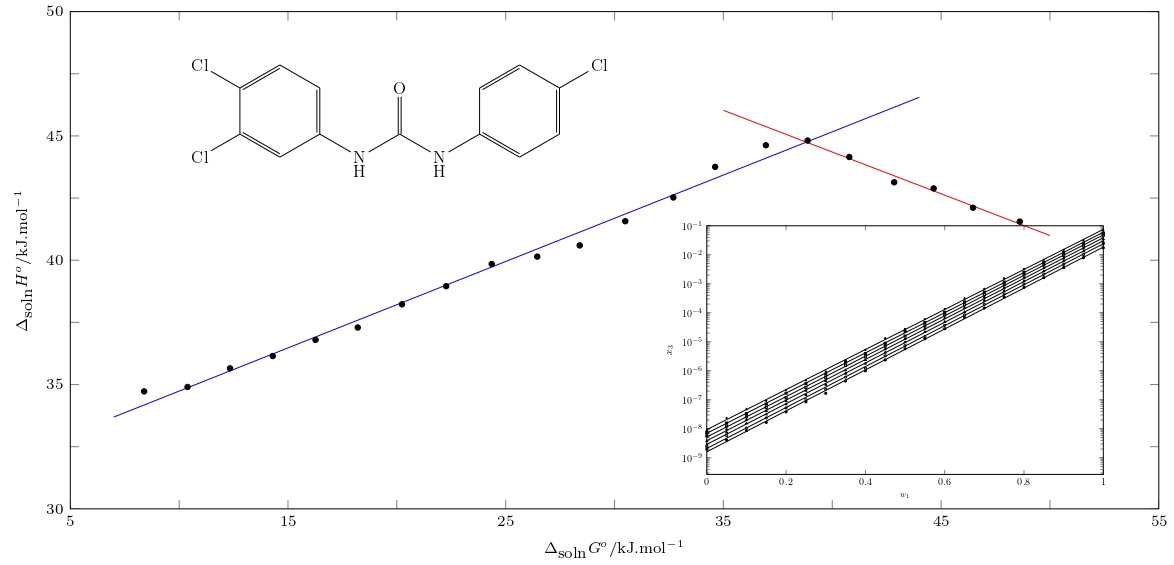
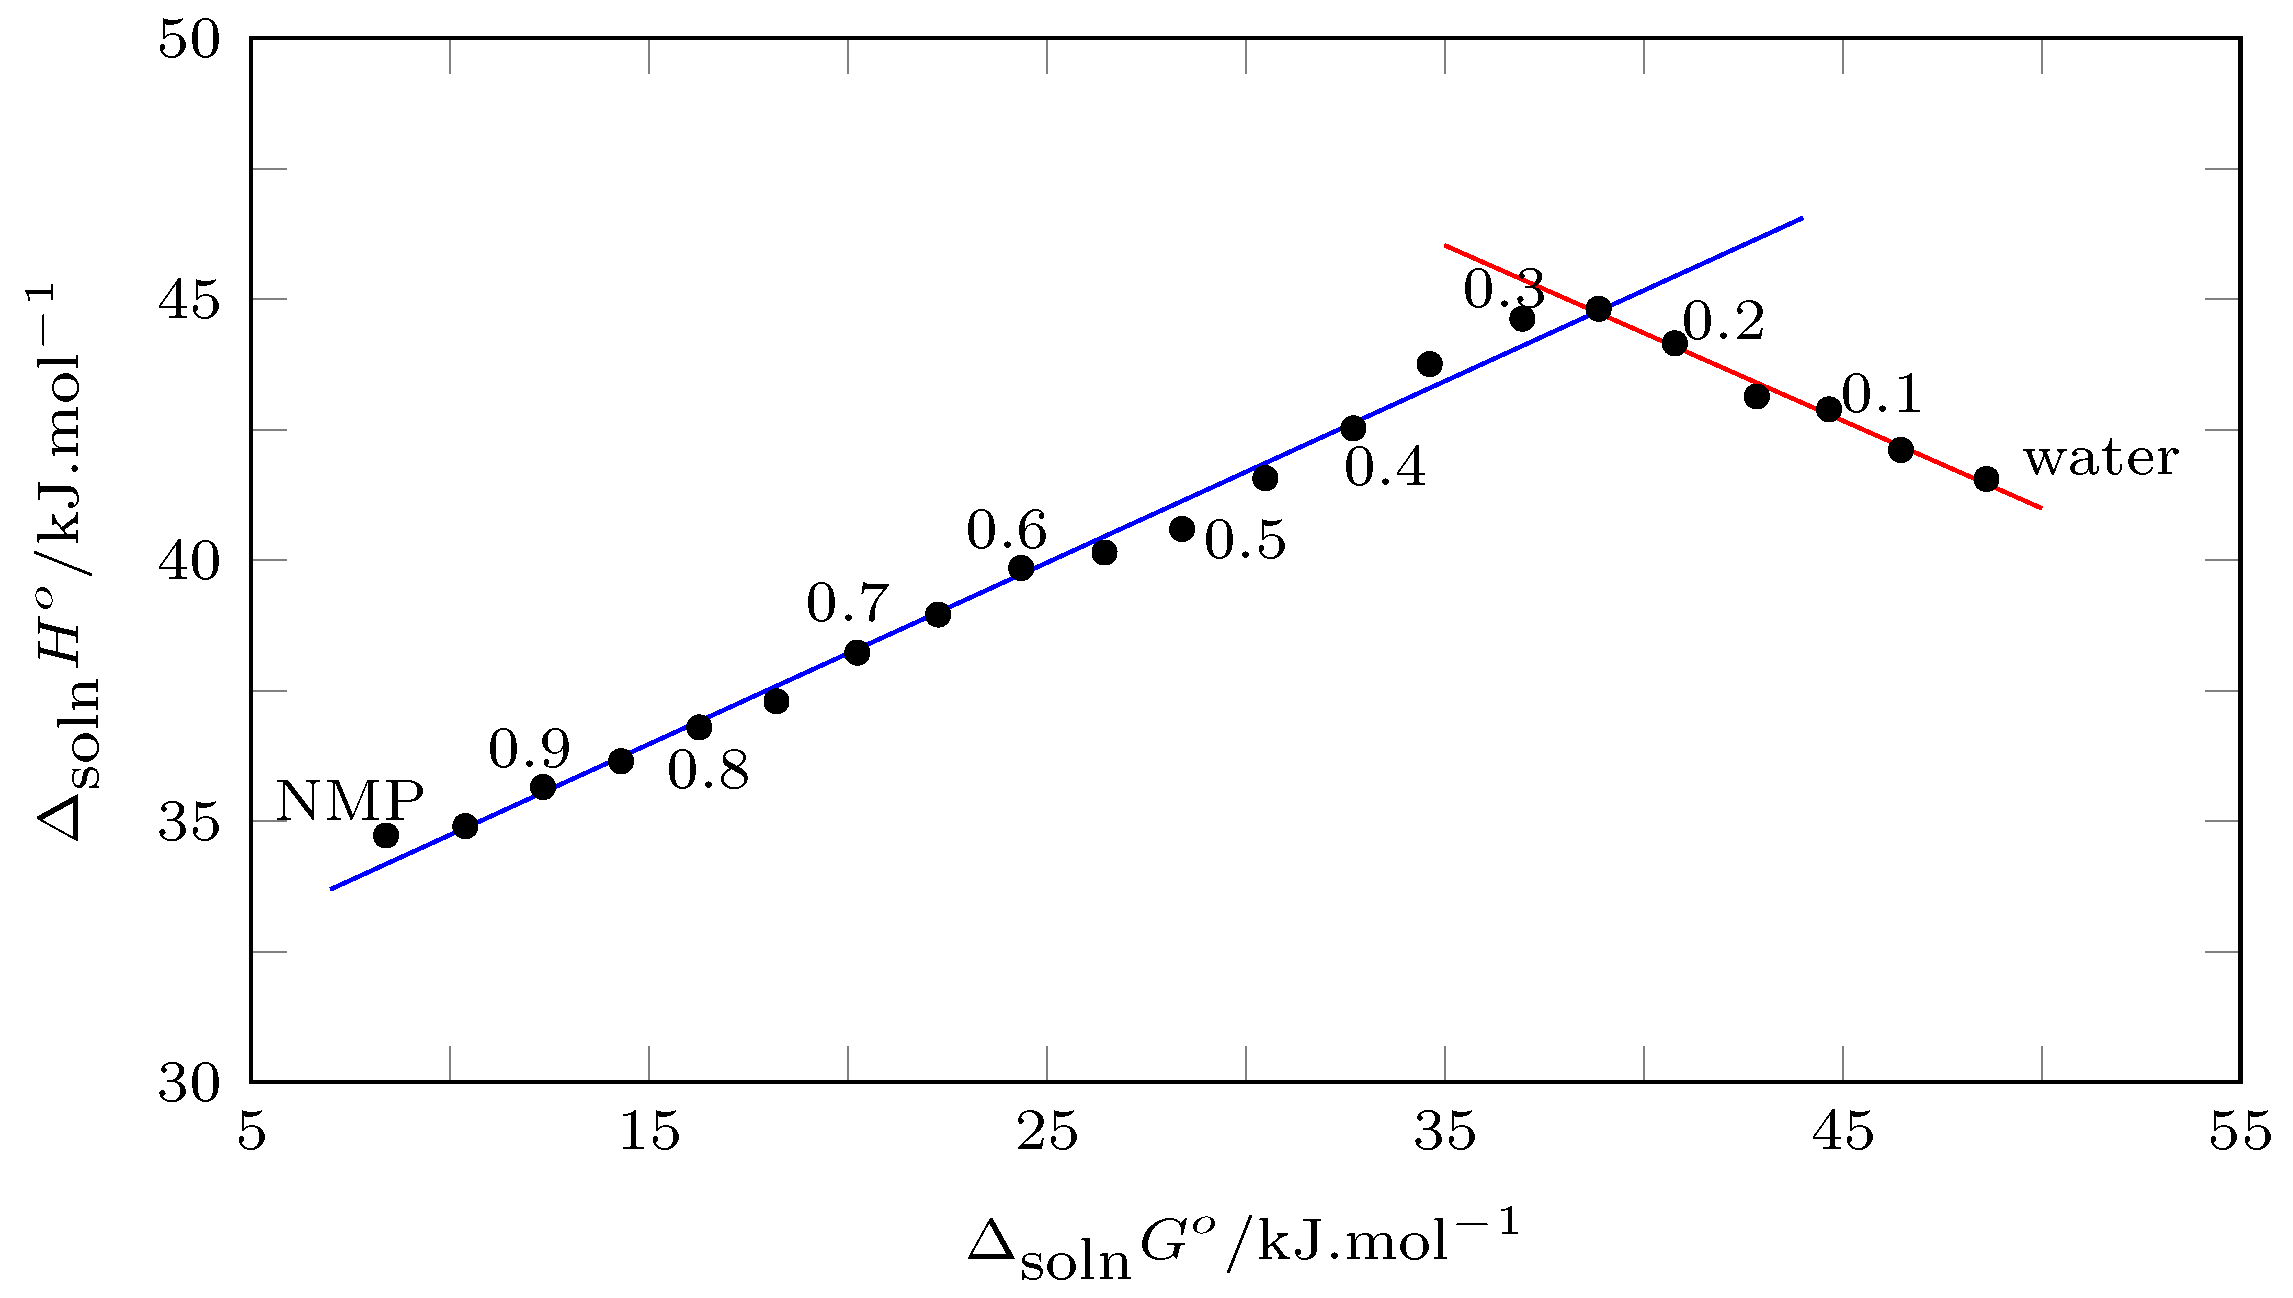
2.6. Enthalpy–Entropy Compensation Analysis
3. Materials and Methods
3.1. Reagents
3.2. Preparation of Solvent Mixtures
3.3. Solubility Determination
3.4. Calorimetric Study
4. Conclusions
Supplementary Materials
Author Contributions
Funding
Institutional Review Board Statement
Informed Consent Statement
Data Availability Statement
Acknowledgments
Conflicts of Interest
References
- Iacopetta, D.; Catalano, A.; Ceramella, J.; Saturnino, C.; Salvagno, L.; Ielo, I.; Drommi, D.; Scali, E.; Plutino, M.R.; Rosace, G.; et al. The Different facets of triclocarban: A Review. Molecules 2021, 26, 2811. [Google Scholar] [CrossRef] [PubMed]
- Zhang, Y.; He, L.; Yang, Y.; Cao, J.; Su, Z.; Zhang, B.; Guo, H.; Wang, Z.; Zhang, P.; Xie, J.; et al. Triclocarban triggers osteoarthritis via DNMT1-mediated epigenetic modification and suppression of COL2A in cartilage tissues. J. Hazard. Mater. 2023, 447, 130747. [Google Scholar] [CrossRef] [PubMed]
- Zhang, D.; Lu, S. A holistic review on triclosan and triclocarban exposure: Epidemiological outcomes, antibiotic resistance, and health risk assessment. Sci. Total Environ. 2023, 872, 162114. [Google Scholar] [CrossRef] [PubMed]
- FDA U.S. Safety and Effectiveness of Consumer Antiseptics; Topical Antimicrobial Drug Products for Over-the-Counter Human Use-Final Rule; 21 CFR Part 310 Docket No. Technical Report; FDA: Silver Spring, MD, USA, 2016. [Google Scholar]
- Commission, E. Commission Implementing decision (EU) 2016/110 of 27 January 2016 Not Approving Triclosan as an Existing Active Substance for Use in Biocidal Products for Product-Type 1; Technical Report; European Commission: Brussels, Belgium, 2016. [Google Scholar]
- NORMAN Network. Emerging Substances. 2023. Available online: https://www.norman-network.net/?q=node/19 (accessed on 15 July 2023).
- Ke, Z.; Wang, S.; Zhu, W.; Zhang, F.; Qiao, W.; Jiang, J.; Chen, K. Genetic bioaugmentation with triclocarban-catabolic plasmid effectively removes triclocarban from wastewater. Environ. Res. 2022, 214, 113921. [Google Scholar] [CrossRef]
- Sonsuphab, K.; Toomsan, W.; Supanchaiyamat, N.; Hunt, A.J.; Ngernyen, Y.; Ratpukdi, T.; Siripattanakul-Ratpukdi, S. Enhanced triclocarban remediation from groundwater using Pseudomonas fluorescens strain MC46 immobilized on agro-industrial waste-derived biochar: Optimization and kinetic analysis. J. Environ. Chem. Eng. 2022, 10, 107610. [Google Scholar] [CrossRef]
- Chen, Z.F.; Wen, H.B.; Dai, X.; Yan, S.C.; Zhang, H.; Chen, Y.Y.; Du, Z.; Liu, G.; Cai, Z. Contamination and risk profiles of triclosan and triclocarban in sediments from a less urbanized region in China. J. Hazard. Mater. 2018, 357, 376–383. [Google Scholar] [CrossRef]
- Mota, F.L.; Carneiro, A.P.; Queimada, A.J.; Pinho, S.P.; Macedo, E.A. Temperature and solvent effects in the solubility of some pharmaceutical compounds: Measurements and modeling. Eur. J. Pharm. Sci. 2009, 37, 499–507. [Google Scholar] [CrossRef]
- Yalkowsky, S.H. Solubility and Solubilization in Aqueous Media; American Chemical Society: Washington, DC, USA, 1999. [Google Scholar]
- Martin, A.; Busramante, P.; Chun, A. Physical Pharmacy and Pharmaceutical Sciences, 6th ed.; Lippincott Williams & Wilkins: Philadelphia, PA, USA, 2011. [Google Scholar]
- Rubino, J.; Yalkowsky, S. Cosolvency and cosolvent polarity. Pharm. Res. 1987, 4, 220–230. [Google Scholar] [CrossRef]
- Jouyban-Gharamaleki, A.; Valaee, L.; Barzegar-Jalali, M.; Clark, B.; Acree, W. Comparison of various cosolvency models for calculating solute solubility in water-cosolvent mixtures. Int. J. Pharm. 1999, 177, 93–101. [Google Scholar] [CrossRef]
- Bustamante, P.; Ochoa, R.; Reillo, A.; Escalera, J.B. Chameleonic effect of sulfanilamide and sulfamethazine in solvent mixtures. Solubility curves with two maxima. Chem. Pharm. Bull. 1994, 42, 1129–1133. [Google Scholar] [CrossRef]
- Rojas-Motta, M.; Rojas-Motta, J.E.; Diaz-Jimenez, J.L.; Bahos-Narváez, F.A.; Blanco-Márquez, J.H.; Ortiz, C.P.; Delgado, D.R. Thermodynamic analysis and preferential solvation of gatifloxacin in DMF + methanol cosolvent mixtures. Rev. Colomb. De Cienc. Quim. Farm. 2020, 49, 675–698. [Google Scholar] [CrossRef]
- Trujillo-Trujillo, C.F.; Angarita-Reina, F.; Herrera, M.; Ortiz, C.P.; Cardenas-Torres, R.E.; Martinez, F.; Delgado, D.R. Thermodynamic analysis of the solubility of sulfadiazine in (acetonitrile 1-propanol) cosolvent mixtures from 278.15 K to 318.15 K. Liquids 2023, 3, 7–18. [Google Scholar] [CrossRef]
- Ben-Naim, A. Theory of preferential solvation of nonelectrolytes. Cell Biophys. 1988, 12, 255–269. [Google Scholar] [CrossRef] [PubMed]
- Grunwald, E.; Steel, C. Solvent Reorganization and Thermodynamic Enthalpy-Entropy Compensation. J. Am. Chem. Soc. 1995, 117, 5687–5692. [Google Scholar] [CrossRef]
- Covington, A.K.; Newman, K.E. Approaches to the problems of solvation in pure solvents and preferential solvation in mixed solvents. Pure Appl. Chem. 1979, 51, 2041–2058. [Google Scholar] [CrossRef]
- Casassa, E.F.; Eisenberg, H. Thermodynamic Analysis of Multicomponent Solutions. In Advances in Protein Chemistry; Academic Press: Cambridge, MA, USA, 1964; Volume 19, pp. 287–395. [Google Scholar] [CrossRef]
- Marcus, Y. On the preferential solvation of drugs and PAHs in binary solvent mixtures. J. Mol. Liq. 2008, 140, 61–67. [Google Scholar] [CrossRef]
- Blanco-Márquez, J.H.; Quigua-Medina, Y.A.; García-Murillo, J.D.; Castro-Camacho, J.K.; Ortiz, C.P.; Cerquera, N.E.; Delgado, D.R. Thermodynamic analysis and applications of the Abraham solvation parameter model in the study of the solubility of some sulfonamides. Rev. Colomb. De Cienc. Quim. Farm. 2020, 49, 234–255. [Google Scholar] [CrossRef]
- Liu, X.; Abraham, M.H.; William, E.A.J. Abraham model descriptors for melatonin; prediction of Solution, biological and thermodynamic properties. J. Solut. Chem. 2022, 51, 992–999. [Google Scholar] [CrossRef]
- Shadrick, W.R.; Ndjomou, J.; Kolli, R.; Mukherjee, S.; Hanson, A.M.; Frick, D.N. Discovering new medicines targeting helicases: Challenges and recent progress. SLAS Discov. 2013, 18, 761–781. [Google Scholar] [CrossRef]
- Chiappetta, D.A.; Degrossi, J.; Teves, S.; D’Aquino, M.; Bregni, C.; Sosnik, A. Triclosan-loaded poloxamine micelles for enhanced topical antibacterial activity against biofilm. Eur. J. Pharm. Biopharm. 2008, 69, 535–545. [Google Scholar] [CrossRef]
- Uch, A.S.; Hesse, U.; Dressman, J.B. Use of 1-methyl-pyrrolidone as a solubilizing agent for determining the uptake of poorly soluble drugs. Pharm. Res. 1999, 16, 968. [Google Scholar] [CrossRef] [PubMed]
- Lee, P.J.; Langer, R.; Shastri, V. Role of N-methyl-yrrolidone in the enhancement of aqueous phase transdermal transport. J. Pharm. Sci. 2005, 94, 912–917. [Google Scholar] [CrossRef] [PubMed]
- Jouyban, A.; Fakhree, M.A.A.; Shayanfar, A. Review of pharmaceutical applications of N-methyl-2-pyrrolidone. J. Pharm. Pharm. Sci. 2010, 13, 524–535. [Google Scholar] [CrossRef] [PubMed]
- Tarrass, F.; Benjelloun, M. Health and environmental effects of the use of N-methyl-2-pyrrolidone as a solvent in the manufacture of hemodialysis membranes: A sustainable reflexion. Nefrología 2022, 42, 122–124. [Google Scholar] [CrossRef]
- Lukić, J.; Orlović, A.; Spiteller, M.; Jovanović, J.; Skala, D. Re-refining of waste mineral insulating oil by extraction with N-methyl-2-pyrrolidone. Sep. Purif. Technol. 2006, 51, 150–156. [Google Scholar] [CrossRef]
- Chow, S.T.; Ng, T.L. The biodegradation of N-methyl-2-pyrrolidone in water by sewage bacteria. Water Res. 1983, 17, 117–118. [Google Scholar] [CrossRef]
- Radhika, G.; Venkatesan, R.; Kathiroli, S. N-methylpyrrolidone: Isolation and characterization of the compound from the marine sponge Clathria frondifera (class:Demospongiae). Indian J. Mar. Sci. 2007, 63, 235–238. [Google Scholar]
- Lim, J.; Jang, S.; Kim, H.; Cho, H.K.; Shin, M.S. Solubility of triclocarban in pure alkanols at different temperatures. Korean J. Chem. Eng. 2013, 30, 181–186. [Google Scholar] [CrossRef]
- Aragón, D.M.; Sosnik, A.; Martínez, F. Solution thermodynamics of triclocarban in organic solvents of different hydrogen bonding capability. J. Solut. Chem. 2009, 38, 1493–1503. [Google Scholar] [CrossRef]
- Delgado, D.R.; Holguin, A.R.; Martinez, F. Solution thermodynamics of triclosan and triclocarban in some volatile organic solvents. Vitae 2012, 19, 79–92. [Google Scholar] [CrossRef]
- Holguín, A.R.; Delgado, D.R.; Martínez, F. Thermodynamic study of the solubility of triclocarban in ethanol+ propylene glycol mixtures. Química Nova 2012, 35, 280–285. [Google Scholar] [CrossRef]
- Agredo-Collazos, J.J.; Ortiz, C.P.; Cerquera, N.E.; Cardenas-Torres, R.E.; Delgado, D.R.; Peña, M.Á.; Martínez, F. Equilibrium solubility of triclocarban in (cyclohexane+ 1, 4-dioxane) mixtures: Determination, correlation, thermodynamics and preferential solvation. J. Solut. Chem. 2022, 51, 1603–1625. [Google Scholar] [CrossRef]
- Cruz-González, A.M.; Vargas-Santana, M.S.; Polania-Orozco, S.d.S.; Ortiz, C.P.; Cerquera, N.E.; Martínez, F.; Delgado, D.R.; Jouyban, A.; Acree, W.E. Thermodynamic analysis of the solubility of triclocarban in ethylene glycol + water mixtures. J. Mol. Liq. 2021, 325, 115222. [Google Scholar] [CrossRef]
- Ivan, G.R.; Ion, I.; Capra, L.; Ion, A.C. Effects of pH, temperature, ionic strength and organic matter on triclocarban solubility. J. Environ. Eng. Landsc. Manag. 2021, 29, 244–250. [Google Scholar] [CrossRef]
- Loftsson, T.; Össurardóttir, Í.B.; Thorsteinsson, T.; Duan, M.; Másson, M. Cyclodextrin solubilization of the antibacterial agents triclosan and triclocarban: Effect of ionization and polymers. J. Incl. Phenom. Macrocycl. Chem. 2005, 52, 109–117. [Google Scholar] [CrossRef]
- Duan, M.S.; Zhao, N.; Össurardóttir, Í.B.; Thorsteinsson, T.; Loftsson, T. Cyclodextrin solubilization of the antibacterial agents triclosan and triclocarban: Formation of aggregates and higher-order complexes. Int. J. Pharm. 2005, 297, 213–222. [Google Scholar] [CrossRef]
- Barton, A.F.M. Handbook of Solubility Parameters and Other Cohesion Parameters, 2nd ed.; CRC Press: Boca Raton, FL, USA, 1991. [Google Scholar]
- Delgado, D.R.; Mogollon-Waltero, E.M.; Ortiz, C.P.; Peña, M.Á.; Martínez, F.; Jouyban, A. Enthalpy-entropy compensation analysis of the triclocarban dissolution process in some 1,4-dioxane (1)+water (2) mixtures. J. Mol. Liq. 2018, 271, 522–529. [Google Scholar] [CrossRef]
- Delgado, D.R.; Jouyban, A.; Martínez, F. Solubility and preferential solvation of meloxicam in methanol+water mixtures at 298.15 K. J. Mol. Liq. 2014, 197, 368–373. [Google Scholar] [CrossRef]
- Sanghvi, R.; Narazaki, R.; Machatha, S.G.; Yalkowsky, S.H. Solubility improvement of drugs using N-methyl pyrrolidone. AAPS Pharmscitech 2008, 9, 366–376. [Google Scholar] [CrossRef]
- Hildebrand, J.H. Solubility. XII. Regular solutions. J. Am. Chem. Soc. 1929, 51, 66–80. [Google Scholar] [CrossRef]
- Aguiar, A.; Armstrong, W.; Desai, S. Development of oxytetracycline long-acting injectable. J. Control. Release 1987, 6, 375–385. [Google Scholar] [CrossRef]
- Bernstein, J. Polymorphism in drug design and delivery. Prog. Clin. Biol. Res. 1989, 289, 203–215. [Google Scholar] [PubMed]
- Singhal, D.; Curatolo, W. Drug polymorphism and dosage form design: A practical perspective. Adv. Drug Deliv. Rev. 2004, 56, 335–347. [Google Scholar] [CrossRef] [PubMed]
- Grunenberg, A.; Keil, B.; Henck, J.O. Polymorphism in binary mixtures, as exemplified by nimodipine. Int. J. Pharm. 1995, 118, 11–21. [Google Scholar] [CrossRef]
- Chiappetta, D.A.; Degrossi, J.; Lizarazo, R.A.; Salinas, D.L.; Martínez, F.; Sosnik, A. Molecular implications in the solubilization of the antibacterial agent triclocarban by means of branched poly (ethylene oxide)-poly (propylene oxide) polymeric micelles. In Polymer Aging, Stabilizers, and Amphiphilic Block Copolymers; Nova Science Publishers: Hauppauge, NY, USA, 2010; pp. 1–12. [Google Scholar]
- Moffat, A.; Osselton, M.; Widdop, B.; Watts, J. Clarke’s Analysis of Drugs and Poisons. In Pharmaceuticals, Body Fluids and Postmortem Material; Pharmaceutical Press: London, UK, 2011. [Google Scholar]
- Gong, Y.; Grant, D.J.; Brittain, H.G. Principles of Solubility. In Solvent Systems and Their Selection in Pharmaceutics and Biopharmaceutics; Augustijns, P., Brewster, M.E., Eds.; Springer New York: New York, NY, USA, 2007; pp. 1–27. [Google Scholar] [CrossRef]
- Hildebrand, J.H.; Wood, S.E. The Derivation of Equations for Regular Solutions. J. Chem. Phys. 2004, 1, 817–822. [Google Scholar] [CrossRef]
- Kristl, A.; Vesnaver, G. Thermodynamic investigation of the effect of octanol—Water mutual miscibility on the partitioning and solubility of some guanine derivatives. J. Chem. Soc. Faraday Trans. 1995, 91, 995–998. [Google Scholar] [CrossRef]
- Yalkowsky, S.H.; Wu, M. Estimation of the ideal solubility (crystal-liquid fugacity ratio) of organic compounds. J. Pharm. Sci. 2010, 99, 1100–1106. [Google Scholar] [CrossRef]
- Hildebrand, J.H.; Prausnitz, J.M.; Scott, R.L. Regular and Related Solution: The Solubility of Gases, Liquids, and Solids; Van Nostrand Reinhold: New York, NY, USA, 1970. [Google Scholar]
- Neau, S.H.; Flynn, G.L. Solid and liquid heat capacities of n-alkyl para-aminobenzoates near the melting point. Pharm. Res. 1990, 7, 157–1162. [Google Scholar] [CrossRef]
- Neau, S.H.; Bhandarkar, S.V.; Hellmuth, E.W. Differential molar heat capacities to test ideal solubility estimations. Pharm. Res. 1997, 14, 601–605. [Google Scholar] [CrossRef]
- Opperhuizen, A.; Gobas, F.A.P.C.; Van der Steen, J.M.D.; Hutzinger, O. Aqueous solubility of polychlorinated biphenyls related to molecular structure. Environ. Sci. Technol. 1988, 22, 638–646. [Google Scholar] [CrossRef]
- Van Ness, H.C. Classical Thermodynamics of Non-Electrolyte Solutions; Elsevier: Amsterdam, The Netherlands, 2013. [Google Scholar]
- Acree, W. Thermodynamic Properties of Nonelectrolyte Solutions; Academic Press: Cambridge, MA, USA, 2012. [Google Scholar]
- Bustamante, P.; Romero, S.; Peña, A.; Escalera, B.; Reillo, A. Enthalpy-entropy compensation for the solubility of drugs in solvent mixtures: Paracetamol, acetanilide, and nalidixic acid in dioxane–water. J. Pharm. Sci. 1998, 87, 1590–1596. [Google Scholar] [CrossRef] [PubMed]
- Peña, M.A.; Bustamante, P.; Escalera, B.; Reíllo, A.; Bosque-Sendra, J.M. Solubility and phase separation of benzocaine and salicylic acid in 1,4-dioxane-water mixtures at several temperatures. J. Pharm. Biomed. Anal. 2004, 36, 571–578. [Google Scholar] [CrossRef] [PubMed]
- Bustamante, C.; Bustamante, P. Nonlinear Enthalpy-Entropy Compensation for the Solubility of Phenacetin in Dioxane-Water Solvent Mixtures. J. Pharm. Sci. 1996, 85, 1109–1111. [Google Scholar] [CrossRef] [PubMed]
- Krug, R.R.; Hunter, W.G.; Grieger, R.A. Enthalpy-entropy compensation. 1. Some fundamental statistical problems associated with the analysis of van’t Hoff and Arrhenius data. J. Phys. Chem. 1976, 80, 2335–2341. [Google Scholar] [CrossRef]
- Krug, R.R.; Hunter, W.G.; Grieger, R.A. Enthalpy-entropy compensation. 2. Separation of the chemical from the statistical effect. J. Phys. Chem. 1976, 80, 2341–2351. [Google Scholar] [CrossRef]
- Perlovich, G.L.; Tkachev, V.V.; Strakhova, N.N.; Kazachenko, V.P.; Volkova, T.V.; Surov, O.V.; Schaper, K.; Raevsky, O.A. Thermodynamic and structural aspects of sulfonamide crystals and solutions. J. Pharm. Sci. 2009, 98, 4738–4755. [Google Scholar] [CrossRef]
- Perlovich, G.L.; Strakhova, N.N.; Kazachenko, V.P.; Volkova, T.V.; Tkachev, V.V.; Schaper, K.J.; Raevsky, O.A. Sulfonamides as a subject to study molecular interactions in crystals and solutions: Sublimation, solubility, solvation, distribution and crystal structure. Int. J. Pharm. 2008, 349, 300–313. [Google Scholar] [CrossRef]
- Ortiz, C.P.; Cardenas-Torres, R.E.; Herrera, M.; Delgado, D.R. Numerical Analysis of Sulfamerazine Solubility in Acetonitrile + 1-Propanol Cosolvent Mixtures at Different Temperatures. Sustainability 2023, 15, 6596. [Google Scholar] [CrossRef]
- Delgado, D.R.; Rodríguez, G.A.; Martínez, F. Thermodynamic study of the solubility of sulfapyridine in some ethanol + water mixtures. J. Mol. Liq. 2013, 177, 156–161. [Google Scholar] [CrossRef]
- Ryde, U. A fundamental view of enthalpy-entropy compensation. Med. Chem. Commun. 2014, 5, 1324–1336. [Google Scholar] [CrossRef]
- Sharp, K. Entropy—Enthalpy compensation: Fact or artifact? Protein Sci. 2001, 10, 661–667. [Google Scholar] [CrossRef] [PubMed]
- Chodera, J.D.; Mobley, D.L. Entropy-enthalpy compensation: Role and ramifications in biomolecular ligand recognition and design. Annu. Rev. Biophys. 2013, 42, 121–142. [Google Scholar] [CrossRef] [PubMed]
- Peña, M.; Escalera, B.; Reíllo, A.; Sánchez, A.; Bustamante, P. Thermodynamics of cosolvent action: Phenacetin, salicylic acid and probenecid. J. Pharm. Sci. 2009, 98, 1129–1135. [Google Scholar] [CrossRef]
- Dittert, L.W.; Higuchi, T.; Reese, D.R. Phase solubility technique in studying the formation of complex salts of triamterene. J. Pharm. Sci. 1964, 53, 1325–1328. [Google Scholar] [CrossRef] [PubMed]
- Higuchi, T.; Connors, K. Advances in Analytical Chemistry and Instrumentation; Interscience Publishers, Inc.: New York, NY, USA, 1965. [Google Scholar]
- Mader, W.J.; Higuchi, T. Phase solubility analysis. CRC Crit. Rev. Anal. Chem. 1970, 1, 193–215. [Google Scholar] [CrossRef]
- Ortiz, C.P.; Cardenas-Torres, R.E.; Herrera, M.; Delgado, D.R. Thermodynamic analysis of the solubility of propylparaben in acetonitrile + water cosolvent mixtures. Sustainability 2023, 15, 4795. [Google Scholar] [CrossRef]

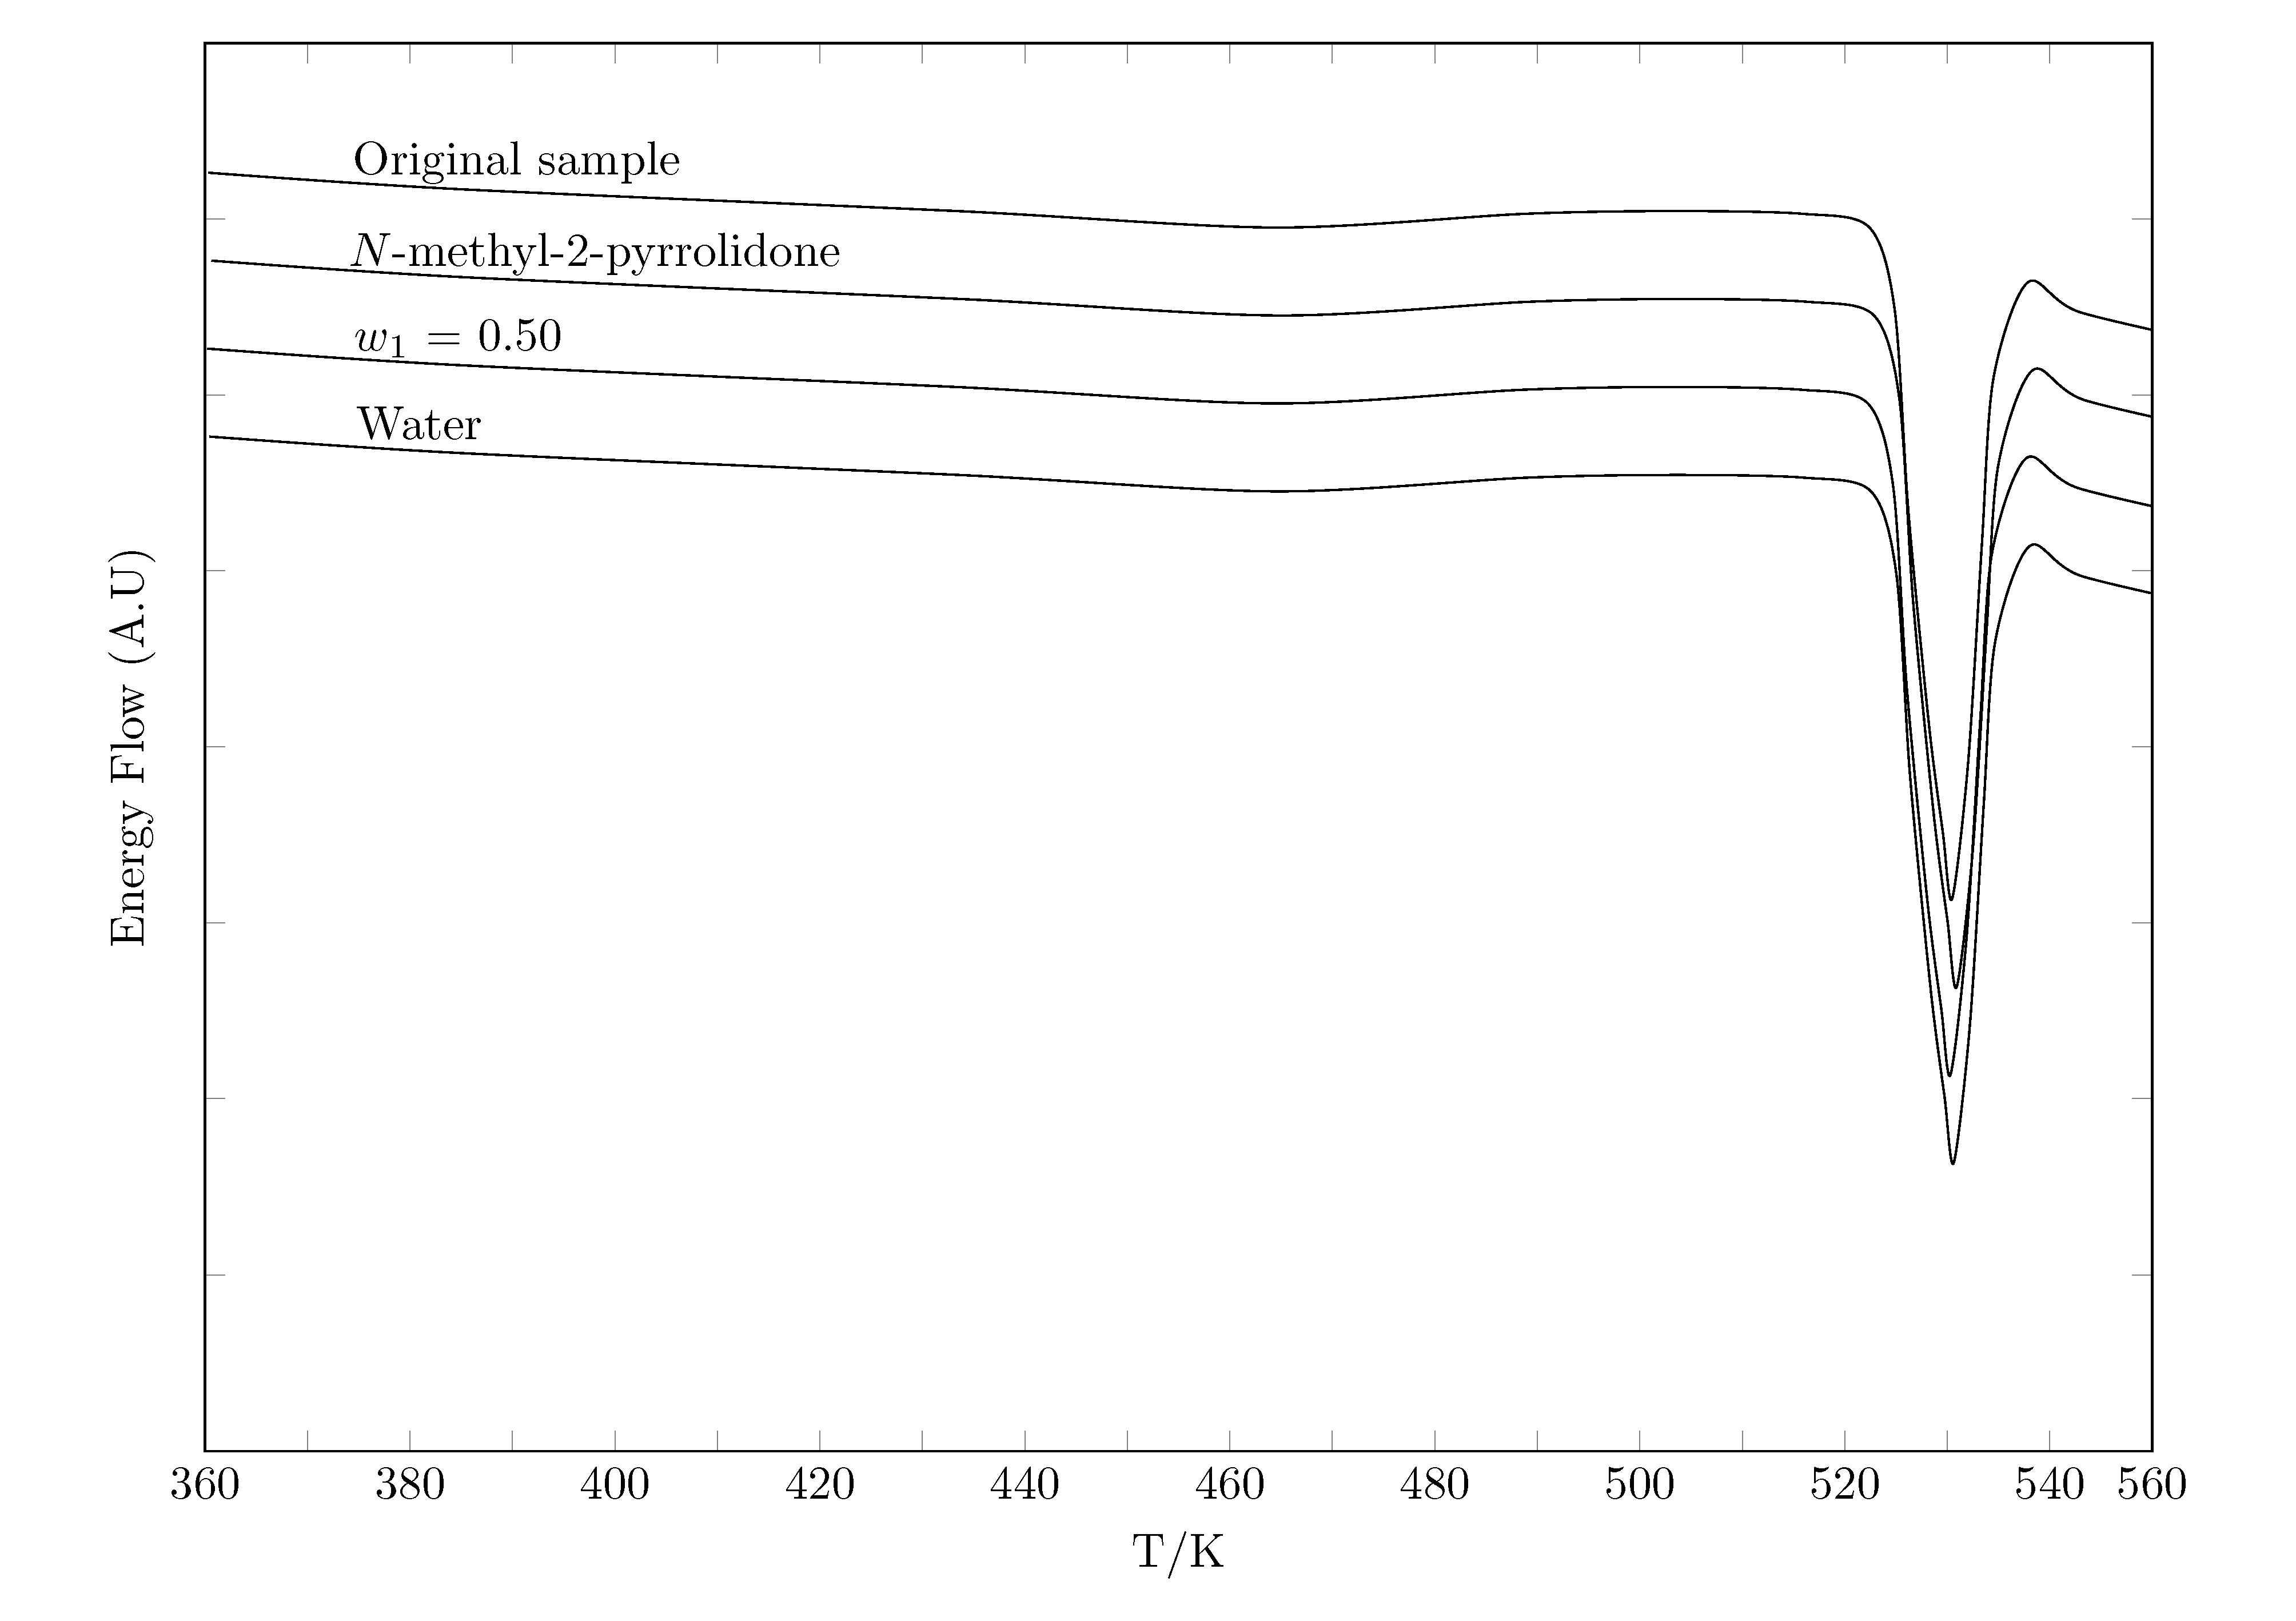
| Sample | Enthalpy of Fusion, /kJ·mol | Melting Point, /K | Ref. |
|---|---|---|---|
| Original sample | 41.3 ± 0.5 | 528.4 ± 0.5 | This work |
| 41.94 | 528.2 | [52] | |
| 527.8 | [39] | ||
| 525 | [44] | ||
| 528.15–529.15 | [53] | ||
| Water | 41.9 ± 0.5 | 527.5 ± 0.5 | This work |
| 42.2 ± 0.5 | 527.9 ± 0.5 | This work | |
| NMP | 41.2 ± 0.5 | 528.6 ± 0.5 | This work |
| Temperature/K | |||||||
|---|---|---|---|---|---|---|---|
| 288.15 | 293.15 | 298.15 | 303.15 | 308.15 | 313.15 | 318.15 | |
| 0.00 | 1.56 × 10 | 1.52 × 10 | 1.49 × 10 | 1.32 × 10 | 1.02 × 10 | 9.08 × 10 | 8.51 × 10 |
| 0.05 | 7.50 × 10 | 6.22 × 10 | 5.65 × 10 | 5.18 × 10 | 4.70 × 10 | 4.29 × 10 | 3.37 × 10 |
| 0.10 | 3.52 × 10 | 3.42 × 10 | 2.74 × 10 | 2.41 × 10 | 2.24 × 10 | 2.05 × 10 | 1.67 × 10 |
| 0.15 | 1.85 × 10 | 1.53 × 10 | 1.35 × 10 | 1.20 × 10 | 1.06 × 10 | 9.52 × 10 | 8.53 × 10 |
| 0.20 | 8.02 × 10 | 6.89 × 10 | 5.99 × 10 | 5.44 × 10 | 4.97 × 10 | 4.02 × 10 | 3.56 × 10 |
| 0.25 | 3.61 × 10 | 3.57 × 10 | 2.88 × 10 | 2.41 × 10 | 2.20 × 10 | 1.88 × 10 | 1.69 × 10 |
| 0.30 | 1.84 × 10 | 1.57 × 10 | 1.28 × 10 | 1.11 × 10 | 1.00 × 10 | 8.84 × 10 | 8.32 × 10 |
| 0.35 | 6.93 × 10 | 6.00 × 10 | 5.32 × 10 | 4.81 × 10 | 3.79 × 10 | 3.41 × 10 | 3.39 × 10 |
| 0.40 | 3.08 × 10 | 2.90 × 10 | 2.38 × 10 | 2.10 × 10 | 1.92 × 10 | 1.73 × 10 | 1.51 × 10 |
| 0.45 | 1.30 × 10 | 1.10 × 10 | 9.94 × 10 | 8.93 × 10 | 8.28 × 10 | 7.65 × 10 | 5.99 × 10 |
| 0.50 | 5.33 × 10 | 4.90 × 10 | 4.41 × 10 | 3.98 × 10 | 3.68 × 10 | 2.96 × 10 | 2.87 × 10 |
| 0.55 | 2.44 × 10 | 2.40 × 10 | 1.93 × 10 | 1.74 × 10 | 1.64 × 10 | 1.49 × 10 | 1.32 × 10 |
| 0.60 | 1.08 × 10 | 98.2 | 87.0 | 76.1 | 70.3 | 65.2 | 58.2 |
| 0.65 | 44.5 | 42.3 | 39.9 | 33.5 | 30.9 | 28.7 | 25.1 |
| 0.70 | 21.0 | 18.6 | 16.2 | 14.8 | 13.7 | 13.1 | 11.8 |
| 0.75 | 8.87 | 8.12 | 7.41 | 6.83 | 6.34 | 5.91 | 5.13 |
| 0.80 | 4.10 | 3.69 | 3.46 | 3.17 | 2.90 | 2.71 | 2.44 |
| 0.85 | 1.88 | 1.69 | 1.56 | 1.43 | 1.33 | 1.24 | 1.16 |
| 0.90 | 0.845 | 0.774 | 0.707 | 0.67 | 0.61 | 0.571 | 0.534 |
| 0.95 | 0.383 | 0.356 | 0.325 | 0.301 | 0.286 | 0.268 | 0.248 |
| 1.00 | 0.176 | 0.151 | 0.153 | 0.143 | 0.123 | 0.122 | 0.114 |
| /kJ·mol | /kJ·mol | /J·molK | /kJ/mol | |||
|---|---|---|---|---|---|---|
| 0.00 | 48.6 | 41.55 | −23.33 | −7.06 | 0.85 | 0.15 |
| 0.05 | 46.5 (0.4) | 42.1 (0.8) | −14.37 (0.30) | −4.35 (0.09) | 0.91 | 0.09 |
| 0.10 | 44.7 (0.5) | 42.9 (0.8) | −5.85 (0.13) | −1.77 (0.04) | 0.96 | 0.04 |
| 0.15 | 42.8 (0.3) | 43.1 (0.3) | 0.962 (0.010) | 0.291 (0.003) | 0.99 | 0.01 |
| 0.20 | 40.8 (0.4) | 44.2 (0.6) | 11.13 (0.18) | 3.37 (0.05) | 0.93 | 0.07 |
| 0.25 | 38.9 (0.4) | 44.8 (0.7) | 19.6 (0.4) | 5.94 (0.11) | 0.88 | 0.12 |
| 0.30 | 37.0 (0.4) | 44.6 (0.5) | 25.3 (0.4) | 7.67 (0.13) | 0.85 | 0.15 |
| 0.35 | 34.6 (0.3) | 43.8 (0.7) | 30.2 (0.6) | 9.13 (0.17) | 0.83 | 0.17 |
| 0.40 | 32.7 (0.23) | 42.5 (0.5) | 32.4 (0.4) | 9.82 (0.13) | 0.81 | 0.19 |
| 0.45 | 30.49 (0.21) | 41.6 (0.8) | 36.6 (0.7) | 11.08 (0.22) | 0.79 | 0.21 |
| 0.50 | 28.4 (0.22) | 40.6 (0.7) | 40.3 (0.7) | 12.20 (0.22) | 0.77 | 0.23 |
| 0.55 | 26.45 (0.19) | 40.1 (0.6) | 45.2 (0.8) | 13.70 (0.24) | 0.75 | 0.25 |
| 0.60 | 24.36 (0.17) | 39.85 (0.25) | 51.2 (0.5) | 15.49 (0.14) | 0.72 | 0.28 |
| 0.65 | 22.27 (0.14) | 39.0 (0.6) | 55.1 (0.9) | 16.69 (0.28) | 0.7 | 0.3 |
| 0.70 | 20.24 (0.15) | 38.2 (0.4) | 59.4 (0.7) | 17.99 (0.22) | 0.68 | 0.32 |
| 0.75 | 18.2 (0.1) | 37.3 (0.4) | 63.0 (0.7) | 19.09 (0.22) | 0.66 | 0.34 |
| 0.80 | 16.27 (0.17) | 36.8 (0.27) | 67.8 (0.9) | 20.53 (0.26) | 0.64 | 0.36 |
| 0.85 | 14.3 (0.11) | 36.1 (0.1) | 72.1 (0.6) | 21.85 (0.19) | 0.62 | 0.38 |
| 0.90 | 12.34 (0.1) | 35.7 (0.2) | 77.0 (0.8) | 23.31 (0.23) | 0.6 | 0.4 |
| 0.95 | 10.39 (0.09) | 34.9 (0.2) | 81.0 (0.9) | 24.52 (0.26) | 0.59 | 0.41 |
| 1.00 | 8.39 (0.06) | 34.7 (0.6) | 87.0 (1.6) | 26.3 (0.5) | 0.57 | 0.43 |
| Ideal | 13.36 | 24.05 | 35.27 | 10.69 | 0.692 | 0.308 |
| More Polar () → Less Polar () | /kJ·mol | /kJ·mol | /kJ·molK | /kJ·mol |
|---|---|---|---|---|
| 0.00 → 0.05 | −2.2 (0.4) | 0.6 (1.5) | 8.9 (0.8) | 2.71 (0.24) |
| 0.05 → 0.10 | −1.8 (0.7) | 0.8 (1.1) | 8.53 (0.33) | 2.58 (0.10) |
| 0.10 → 0.15 | −1.8 (0.6) | 0.2 (0.8) | 6.81 (0.13) | 2.06 (0.04) |
| 0.15 → 0.20 | −2.1 (0.5) | 1.0 (0.6) | 10.16 (0.18) | 3.08 (0.05) |
| 0.20 → 0.25 | −1.9 (0.5) | 0.7 (0.9) | 8.5 (0.4) | 2.58 (0.13) |
| 0.25 → 0.30 | −1.9 (0.6) | −0.2 (0.9) | 5.7 (0.6) | 1.73 (0.17) |
| 0.30 → 0.35 | −2.3 (0.5) | −0.9 (0.9) | 4.8 (0.7) | 1.46 (0.21) |
| 0.35 → 0.40 | −1.9 (0.4) | −1.2 (0.9) | 2.3 (0.7) | 0.69 (0.21) |
| 0.40 → 0.45 | −2.21 (0.32) | −1.0 (0.9) | 4.1 (0.8) | 1.25 (0.25) |
| 0.45 → 0.50 | −2.09 (0.31) | −1.0 (1.0) | 3.7 (1.0) | 1.12 (0.31) |
| 0.50 → 0.55 | −1.95 (0.29) | −0.5 (0.9) | 5.0 (1.1) | 1.5 (0.32) |
| 0.55 → 0.60 | −2.09 (0.25) | −0.3 (0.7) | 5.9 (0.9) | 1.79 (0.28) |
| 0.60 → 0.65 | −2.09 (0.22) | −0.9 (0.7) | 4.0 (1.0) | 1.2 (0.31) |
| 0.65 → 0.70 | −2.03 (0.20) | −0.7 (0.7) | 4.3 (1.2) | 1.3 (0.4) |
| 0.70 → 0.75 | −2.03 (0.18) | −0.9 (0.5) | 3.6 (1.0) | 1.1 (0.32) |
| 0.75 → 0.80 | −1.94 (0.20) | −0.5 (0.5) | 4.8 (1.1) | 1.4 (0.3) |
| 0.80 → 0.85 | −1.97 (0.20) | −0.65 (0.31) | 4.3 (1.1) | 1.32 (0.32) |
| 0.85 → 0.90 | −1.96 (0.15) | −0.49 (0.24) | 4.8 (1.0) | 1.47 (0.3) |
| 0.90 → 0.95 | −1.95 (0.14) | −0.75 (0.27) | 4.0 (1.2) | 1.2 (0.3) |
| 0.95 → 1.00 | −1.99 (0.11) | −0.2 (0.6) | 6.0 (1.9) | 1.8 (0.6) |
| /kJ·mol | /kJ·mol | /kJ·molK | /kJ·mol | |
|---|---|---|---|---|
| 0.00 | 35.25 | 17.52 | −58.55 | −17.73 |
| 0.05 | 33.1 (0.4) | 18.5 (0.8) | −48.2 (0.3) | −14.6 (0.1) |
| 0.10 | 31.3 (0.5) | 19.3 (0.8) | −39.68 (0.18) | −12.02 (0.06) |
| 0.15 | 29.5 (0.3) | 19.5 (0.3) | −32.87 (0.14) | −9.95 (0.04) |
| 0.20 | 27.4 (0.4) | 20.5 (0.6) | −22.71 (0.22) | −6.88 (0.07) |
| 0.25 | 25.5 (0.4) | 21.2 (0.7) | −14.2 (0.4) | −4.3 (0.12) |
| 0.30 | 23.6 (0.4) | 21 (0.5) | −8.5 (0.4) | −2.57 (0.13) |
| 0.35 | 21.26 (0.27) | 20.2 (0.7) | −3.7 (0.6) | −1.11 (0.18) |
| 0.40 | 19.34 (0.24) | 18.9 (0.5) | −1.4 (0.4) | −0.42 (0.14) |
| 0.45 | 17.13 (0.22) | 18 (0.8) | 2.7 (0.7) | 0.83 (0.22) |
| 0.50 | 15.04 (0.23) | 17.0 (0.7) | 6.4 (0.7) | 1.95 (0.22) |
| 0.55 | 13.09 (0.19) | 16.5 (0.6) | 11.4 (0.8) | 3.45 (0.24) |
| 0.60 | 11.00 (0.18) | 16.24 (0.25) | 17.3 (0.5) | 5.25 (0.15) |
| 0.65 | 8.91 (0.15) | 15.4 (0.6) | 21.3 (0.9) | 6.44 (0.28) |
| 0.70 | 6.88 (0.16) | 14.6 (0.4) | 25.6 (0.8) | 7.74 (0.23) |
| 0.75 | 4.85 (0.12) | 13.7 (0.4) | 29.2 (0.7) | 8.84 (0.23) |
| 0.80 | 2.91 (0.18) | 13.19 (0.27) | 34.0 (0.9) | 10.28 (0.26) |
| 0.85 | 0.94 (0.12) | 12.54 (0.15) | 38.3 (0.7) | 11.6 (0.2) |
| 0.90 | −1.02 (0.12) | 12.05 (0.19) | 43.2 (0.8) | 13.07 (0.24) |
| 0.95 | −2.97 (0.11) | 11.3 (0.19) | 47.1 (0.9) | 14.27 (0.26) |
| 1.00 | −4.97 (0.08) | 11.1 (0.6) | 53.1 (1.6) | 16.1 (0.5) |
| Chemical Name | CAS | Source | Purity in Mass Fraction | Analytic Technique |
|---|---|---|---|---|
| Triclocarban | 101-20-2 | Sigma-Aldrich | >0.990 | HPLC |
| N-methyl-2-pyrrolidone | 872-50-4 | Sigma-Aldrich | 0.998 | GC |
| Water | 25322-68-3 | |||
| Ethanol | 64-17-5 | Sigma-Aldrich | 0.998 | GC |
Disclaimer/Publisher’s Note: The statements, opinions and data contained in all publications are solely those of the individual author(s) and contributor(s) and not of MDPI and/or the editor(s). MDPI and/or the editor(s) disclaim responsibility for any injury to people or property resulting from any ideas, methods, instructions or products referred to in the content. |
© 2023 by the authors. Licensee MDPI, Basel, Switzerland. This article is an open access article distributed under the terms and conditions of the Creative Commons Attribution (CC BY) license (https://creativecommons.org/licenses/by/4.0/).
Share and Cite
Caviedes-Rubio, D.I.; Ortiz, C.P.; Martinez, F.; Delgado, D.R. Thermodynamic Assessment of Triclocarban Dissolution Process in N-Methyl-2-pyrrolidone + Water Cosolvent Mixtures. Molecules 2023, 28, 7216. https://doi.org/10.3390/molecules28207216
Caviedes-Rubio DI, Ortiz CP, Martinez F, Delgado DR. Thermodynamic Assessment of Triclocarban Dissolution Process in N-Methyl-2-pyrrolidone + Water Cosolvent Mixtures. Molecules. 2023; 28(20):7216. https://doi.org/10.3390/molecules28207216
Chicago/Turabian StyleCaviedes-Rubio, Diego Ivan, Claudia Patricia Ortiz, Fleming Martinez, and Daniel Ricardo Delgado. 2023. "Thermodynamic Assessment of Triclocarban Dissolution Process in N-Methyl-2-pyrrolidone + Water Cosolvent Mixtures" Molecules 28, no. 20: 7216. https://doi.org/10.3390/molecules28207216
APA StyleCaviedes-Rubio, D. I., Ortiz, C. P., Martinez, F., & Delgado, D. R. (2023). Thermodynamic Assessment of Triclocarban Dissolution Process in N-Methyl-2-pyrrolidone + Water Cosolvent Mixtures. Molecules, 28(20), 7216. https://doi.org/10.3390/molecules28207216