Article

Inhibitory Mechanisms of Lekethromycin in Dog Liver Cytochrome P450 Enzymes Based on UPLC-MS/MS Cocktail Method

1
Department of Veterinary Pharmacology and Toxicology, College of Veterinary Medicine, China Agricultural University, Beijing 100193, China
2
Laboratory of Quality & Safety Risk Assessment for Animal Products on Chemical Hazards (Beijing), Ministry of Agriculture and Rural Affairs of the People’s Republic of China, Beijing 100193, China
3
Key Laboratory of Detection for Veterinary Drug Residues and Illegal Additives, Ministry of Agriculture and Rural Affairs of the People’s Republic of China, Beijing 100193, China
*
Author to whom correspondence should be addressed.
Molecules 2023, 28(20), 7193; https://doi.org/10.3390/molecules28207193
Submission received: 7 September 2023 / Revised: 11 October 2023 / Accepted: 17 October 2023 / Published: 20 October 2023

Abstract

:
Lekethromycin (LKMS) is a synthetic macrolide compound derivative intended for use as a veterinary medicine. Since there have been no in vitro studies evaluating its potential for drug–drug interactions related to cytochrome P450 (CYP450) enzymes, the effect of the inhibitory mechanisms of LKMS on CYP450 enzymes is still unclear. Thus, this study aimed to evaluate the inhibitory effects of LKMS on dog CYP450 enzymes. A cocktail approach using ultra-performance liquid chromatography–tandem mass spectrometry was conducted to investigate the inhibitory effect of LKMS on canine CYP450 enzymes. Typical probe substrates of phenacetin, coumarin, bupropion, tolbutamide, dextromethorphan, chlorzoxazone, and testosterone were used for CYP1A2, CYP2A6, CYP2B6, CYP2C9, CYP2D6, CYP2E1, and CYP3A4, respectively. This study showed that LKMS might not be a time-dependent inhibitor. LKMS inhibited CYP2A6, CYP2B6, and CYP2D6 via mixed inhibition. LKMS exhibited mixed-type inhibition against the activity of CYP2A6 with an inhibition constant (Ki) value of 135.6 μΜ. LKMS inhibited CYP2B6 in a mixed way, with Ki values of 59.44 μM. A phenotyping study based on an inhibition assay indicated that CYP2D6 contributes to the biotransformation of LKMS. A mixed inhibition of CYP2D6 with Ki values of 64.87 μM was also observed. Given that this study was performed in vitro, further in vivo studies should be conducted to identify the interaction between LKMS and canine CYP450 enzymes to provide data support for the clinical application of LKMS and the avoidance of adverse interactions between other drugs.

Graphical Abstract

1. Introduction

Given the high research and development costs, long development process, and high failure rate of new drugs, the related problems of drug–drug interactions (DDIs) should be solved. Lekethromycin (LKMS), a derivative synthetic novel macrolide compound, has been used in veterinary medicine to treat respiratory disease. Pharmacokinetic and distribution studies have been completed on healthy and infected rats with different administration methods and doses, respectively [1,2,3], suggesting that LKMS exhibits widely distributed effects and has a high plasma protein binding rate and low clearance. A high plasma protein binding rate typically means that there is less drug in the free state in plasma, and a DDI should be considered when co-administrating [4]. Absorption, distribution, metabolism, and excretion (ADME) analysis is necessary to evaluate safety and risks when exposing dogs to drugs. Given the complexity of diseases and drug resistance, combining chemical drugs is widely used to treat infectious diseases. Adverse drug interactions occur in combination therapies because of the large number and variety of drugs. DDI studies can evaluate pre-selected medication regimens and develop the safest and quality-controlled dosing regimens in clinical treatments. Pharmacokinetic interactions assess the effect of DDIs by comparing the ADME value of the test drug with and without a perpetrator. In January 2020, The United States Food and Drug Administration (FDA) issued two guidance standards entitled “Clinical Drug Interaction Studies-Guidance for Industry on Cytochrome P450 Enzyme and Transporter-Mediated Drug Interactions” and “In vitro Drug Interaction Studies-Cytochrome P450 Enzyme and Transporter-Mediated Drug Interactions”, which guide studies on drug interactions based on metabolic enzymes and transporters [5,6,7,8]. DDI methods include probe drug cocktail methods, liver microsome and hepatocyte models, static models, physiologically based pharmacokinetic models, machine learning models, in vivo comparative efficacy studies, and in vitro static and dynamic tests [8].
Our study focused on the in vitro interactions of hepatic microsomal methods. Cytochrome P450 enzyme (CYP450) is a metabolic enzyme that participates in more than 90% of reported enzymatic reactions [9]. CYP450 plays an important role in drug detoxification, cell metabolism, and balance and influences a medicine’s effect and safety. The liver, intestine, lung, kidney, brain, heart, adrenal, gonads, and most other organs have the capability for biotransformation through the CYP450 enzyme [10,11,12,13]. Among these, the liver is the major organ involved in CYP450-mediated metabolism. Specifically, CYP450 is involved in the phase I reactions of drug degradation in the liver [14]. Isomers of the CYP1-3 family are responsible for approximately 80% of the metabolism of clinical drugs [15]. In total, 37% of medicines were metabolized by CYP3A4/5, 15% by CYP2D6, and 27% by CYP2C9 and CYP2C19 [16,17]. Notably, CYP450 can be inhibited or induced by xenobiotics, resulting in DDIs that might cause unexpected adverse effects or treatment failure [18]. Numerous in vitro cocktails have been developed for detecting direct DDIs and screening time-dependent inhibition. Therefore, the metabolic interactions between drugs should be paid more attention to regarding the effect of medicine on the activity of CYP450.
Macrolide antibiotics have been widely used on livestock. The effect of macrolides on CYP450 can contribute to DDIs, such as erythromycin and its precursor drugs, which have been shown to inhibit the CYP3A4 enzyme, reducing the clearance of other drugs catalyzed by the CYP3A4 enzyme [19,20,21,22,23]. Clarithromycin has been found to inhibit the CYP3A5 enzyme when exposed to high concentrations but has no obvious inhibition at low concentrations [24]. Intriguingly, azithromycin exhibits a weak inhibitory effect on CYP3A4 compared with other macrolide drugs [25]. Telithromycin has been shown to decrease the activity of CYP1A2 and CYP3A2 [26,27,28]. However, rokitamycin does not affect CYP1A2 or CYP2C9. The metabolic processing of drugs metabolized by CYP450 can increase or decrease the blood concentration, which can induce adverse reactions; hence, medicine combinations should be given special attention.
In the early stage of drug development, when measuring the in vitro half-maximal inhibitory concentration (IC50) to study the inhibitory effect of a drug on the CYP450 enzyme, the possibility of drug interaction with other drugs can be calculated theoretically, which can be predicted by creating a simple in vitro model [29,30]. The preliminary constructed in vitro cocktail provides data support for the subsequent in vivo cocktail establishment. Simulations using well-established in vitro models and actual in vivo situations sometimes have some differences, and cocktails can assess the interactions between metabolic enzymes in vivo, improving the accuracy of in vitro prediction [31,32]. It is important to understand the metabolic process both in vitro and in vivo and to obtain pharmacokinetic parameters for preclinical research and clinical applications [33]. In vitro, CYP450-related metabolic studies are considered cost-effective in predicting potential drug interactions and are one of the main ways of predicting drug interactions in drug development, but it is important to recommend a reliable and durable liver microsomal incubation system for the reliability of experimental results. Thus, it is critical to select enzyme substrates and rationally optimize incubation system conditions [34]. In this study, a cocktail method based on ultra-performance liquid chromatography–tandem mass spectrometry (UPLC-MS/MS) was used to detect the in vitro effect of LKMS on CYP450 enzymes and the mechanism of drug interaction [35,36] to provide data support for the clinical application of LKMS and the avoidance of adverse interactions between other drugs.

2. Results

2.1. Methods Validation

A rapid and highly sensitive method was validated for the quantification of probe substrates in dog liver microsomes (DLMs) following the guidelines for bioanalytical method validation [37]. The acetonitrile protein precipitation method was applied to develop a sensitive UPLC-MS/MS method for determining the specific metabolites of each CYP450 probe substrate [38,39,40,41]. As shown in Figure 1, there were no interfering peaks detected in the blank sample at the retention time of the target compounds and internal standard. The limit of detection and the limit of quantification of the metabolites of the CYP450 probe substrates were 5 ng/mL and 10 ng/mL, respectively. Calibration curves were constructed for each compound and showed good linearity (R2 > 0.99). The accuracy and precision are shown in Table 1. The results of intra-day and inter-day precision were within 12.14% and an accuracy of 95.53–109.42%.

2.2. Enzyme Kinetic Study

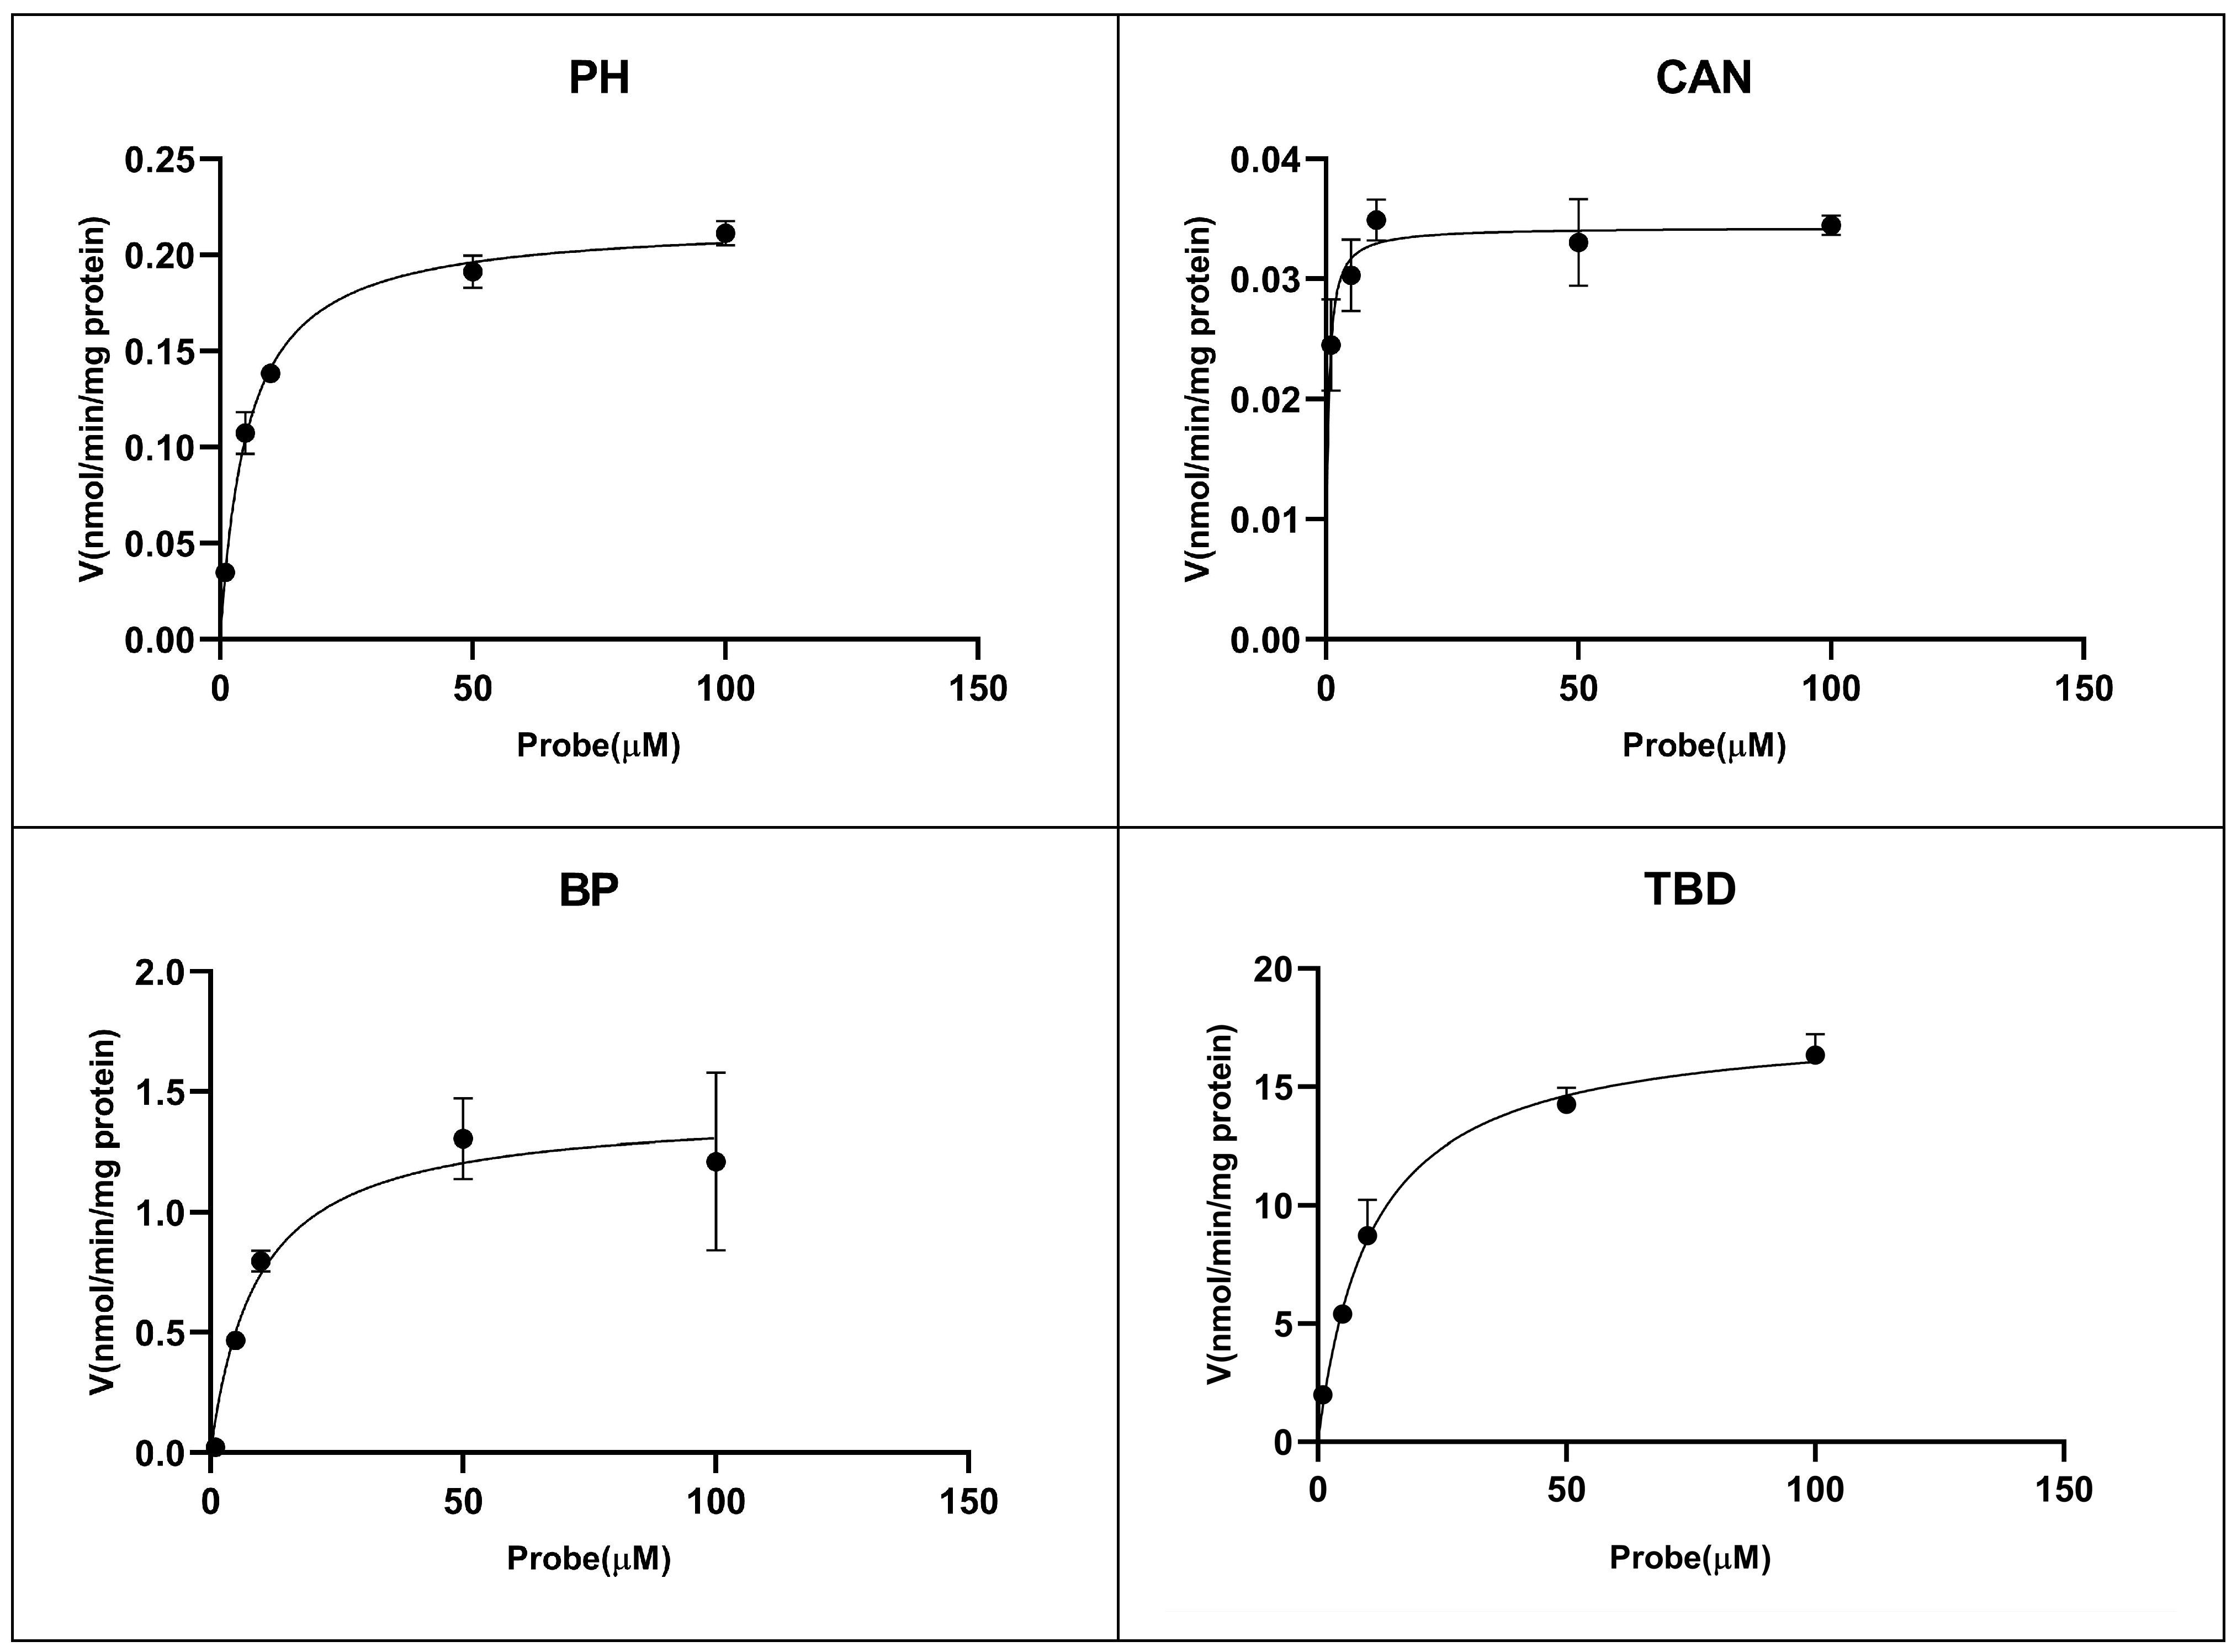
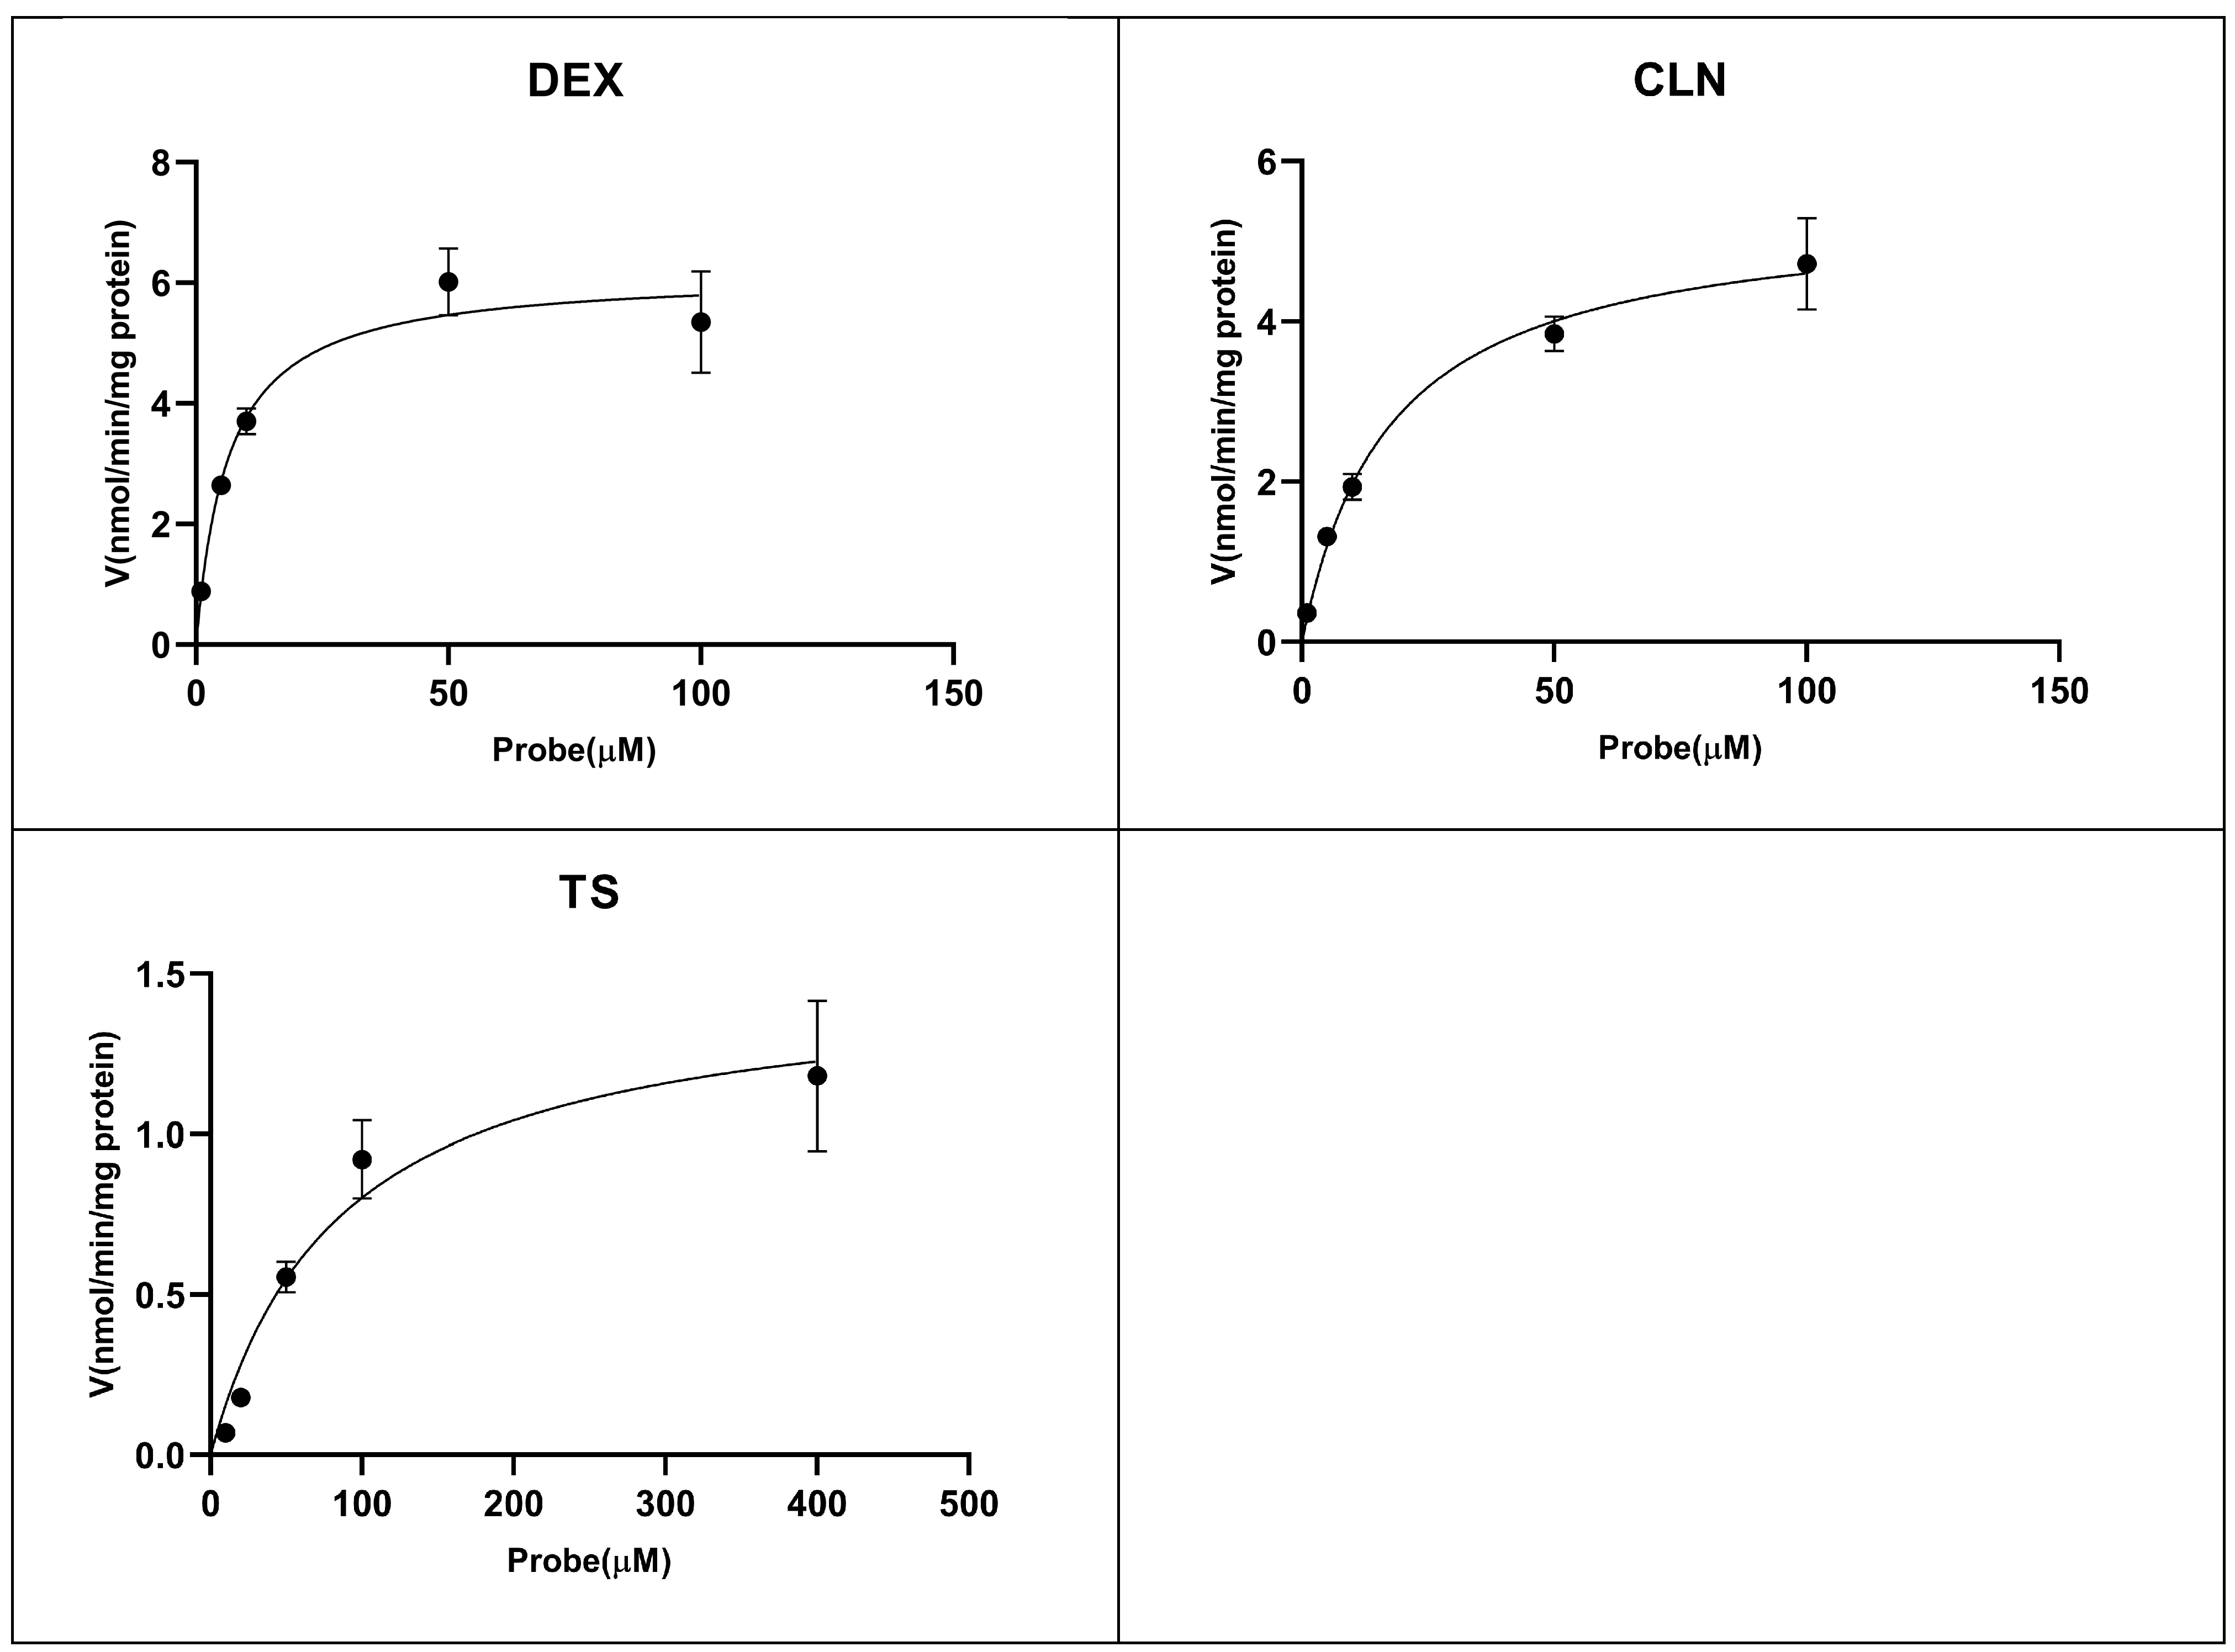
It is important to use the right probe substrates, and the most common in vitro probes include phenacetin (PH) for CYP1A2, coumarin (CAN) for CYP2A6, bupropion (BP) for CYP2B6, tolbutamide (TBD) for CYP2C9, dextromethorphan (DEX) for CYP2D6, chlorzoxazone (CLN) for CYP2E1, and testosterone (TS) for CYP3A4 [42,43,44,45,46,47]. The activity of CYP450 isoforms was evaluated via correspondence based on the developed UPLC-MS/MS method. The results are presented in Table 2. The suitable incubation time and protein concentration for PH, CAN, BP, TBD, DEX, CLN, and TS were 15 min and 0.2 mg/mL, respectively. Also, the optimized probe concentration was 20 μM for PH, TBD, and TS and 10 μM for CAN, BP, DEX, and CLN. The Km (Michaelis–Menten constant) values were 5.39 μM for PH, 0.41 μM for CAN, 9.15 μM for BP, 10.76 μM for TBD, 6.33 μM for DEX, 17.42 μM for CLN, and 85.21 μM for TS. For CAN, the Km was 2.0–4.3 μM in dog liver microsomes, and the value was 0.41 μM in this study [48]. The Km for CLN was 17.42 μM, which was smaller compared with 42–82 μM in dog liver microsomes, but it was similar to the 25–37 μM in mini-pig liver microsomes [48]. The Km for TS was 192 μM in dog liver microsomes, but the value was similar to the rat and mini-pig values of 84 μM and 79 μM, respectively [48]. Our findings indicated that the Vmax (maximum rate of an enzyme-catalyzed reaction) values were 0.22 nmol/min/mg protein for PH, 0.034 nmol/min/mg protein for CAN, 1.43 nmol/min/mg protein for BP, 293.1 nmol/min/mg protein for TBD, 6.16 nmol/min/mg protein for DEX, 5.4 nmol/min/mg protein for CLN, and 1.49 nmol/min/mg protein for TS. In contrast, the Vmax values for CAN, CLN, and TS were 1488–1656 pmol/min/mg/microsomal protein, 573–1129 pmol/min/mg/microsomal protein, and 68–180 pmol/min/mg/microsomal protein in dog liver microsomes [48]. The Km for PH, TBD, and DEX ranged from 10–50 μM, 100–200 μM, and 2–10 μM in in vitro drug metabolism studies [17]. The enzymatic kinetic results of probe substrates are presented in Figure 2. The incubation time and protein concentration are shown in Figures S1 and S2 (these are shown in the Supplementary Materials).

2.3. CYP450 Inhibition and Enzymatic Kinetic Study

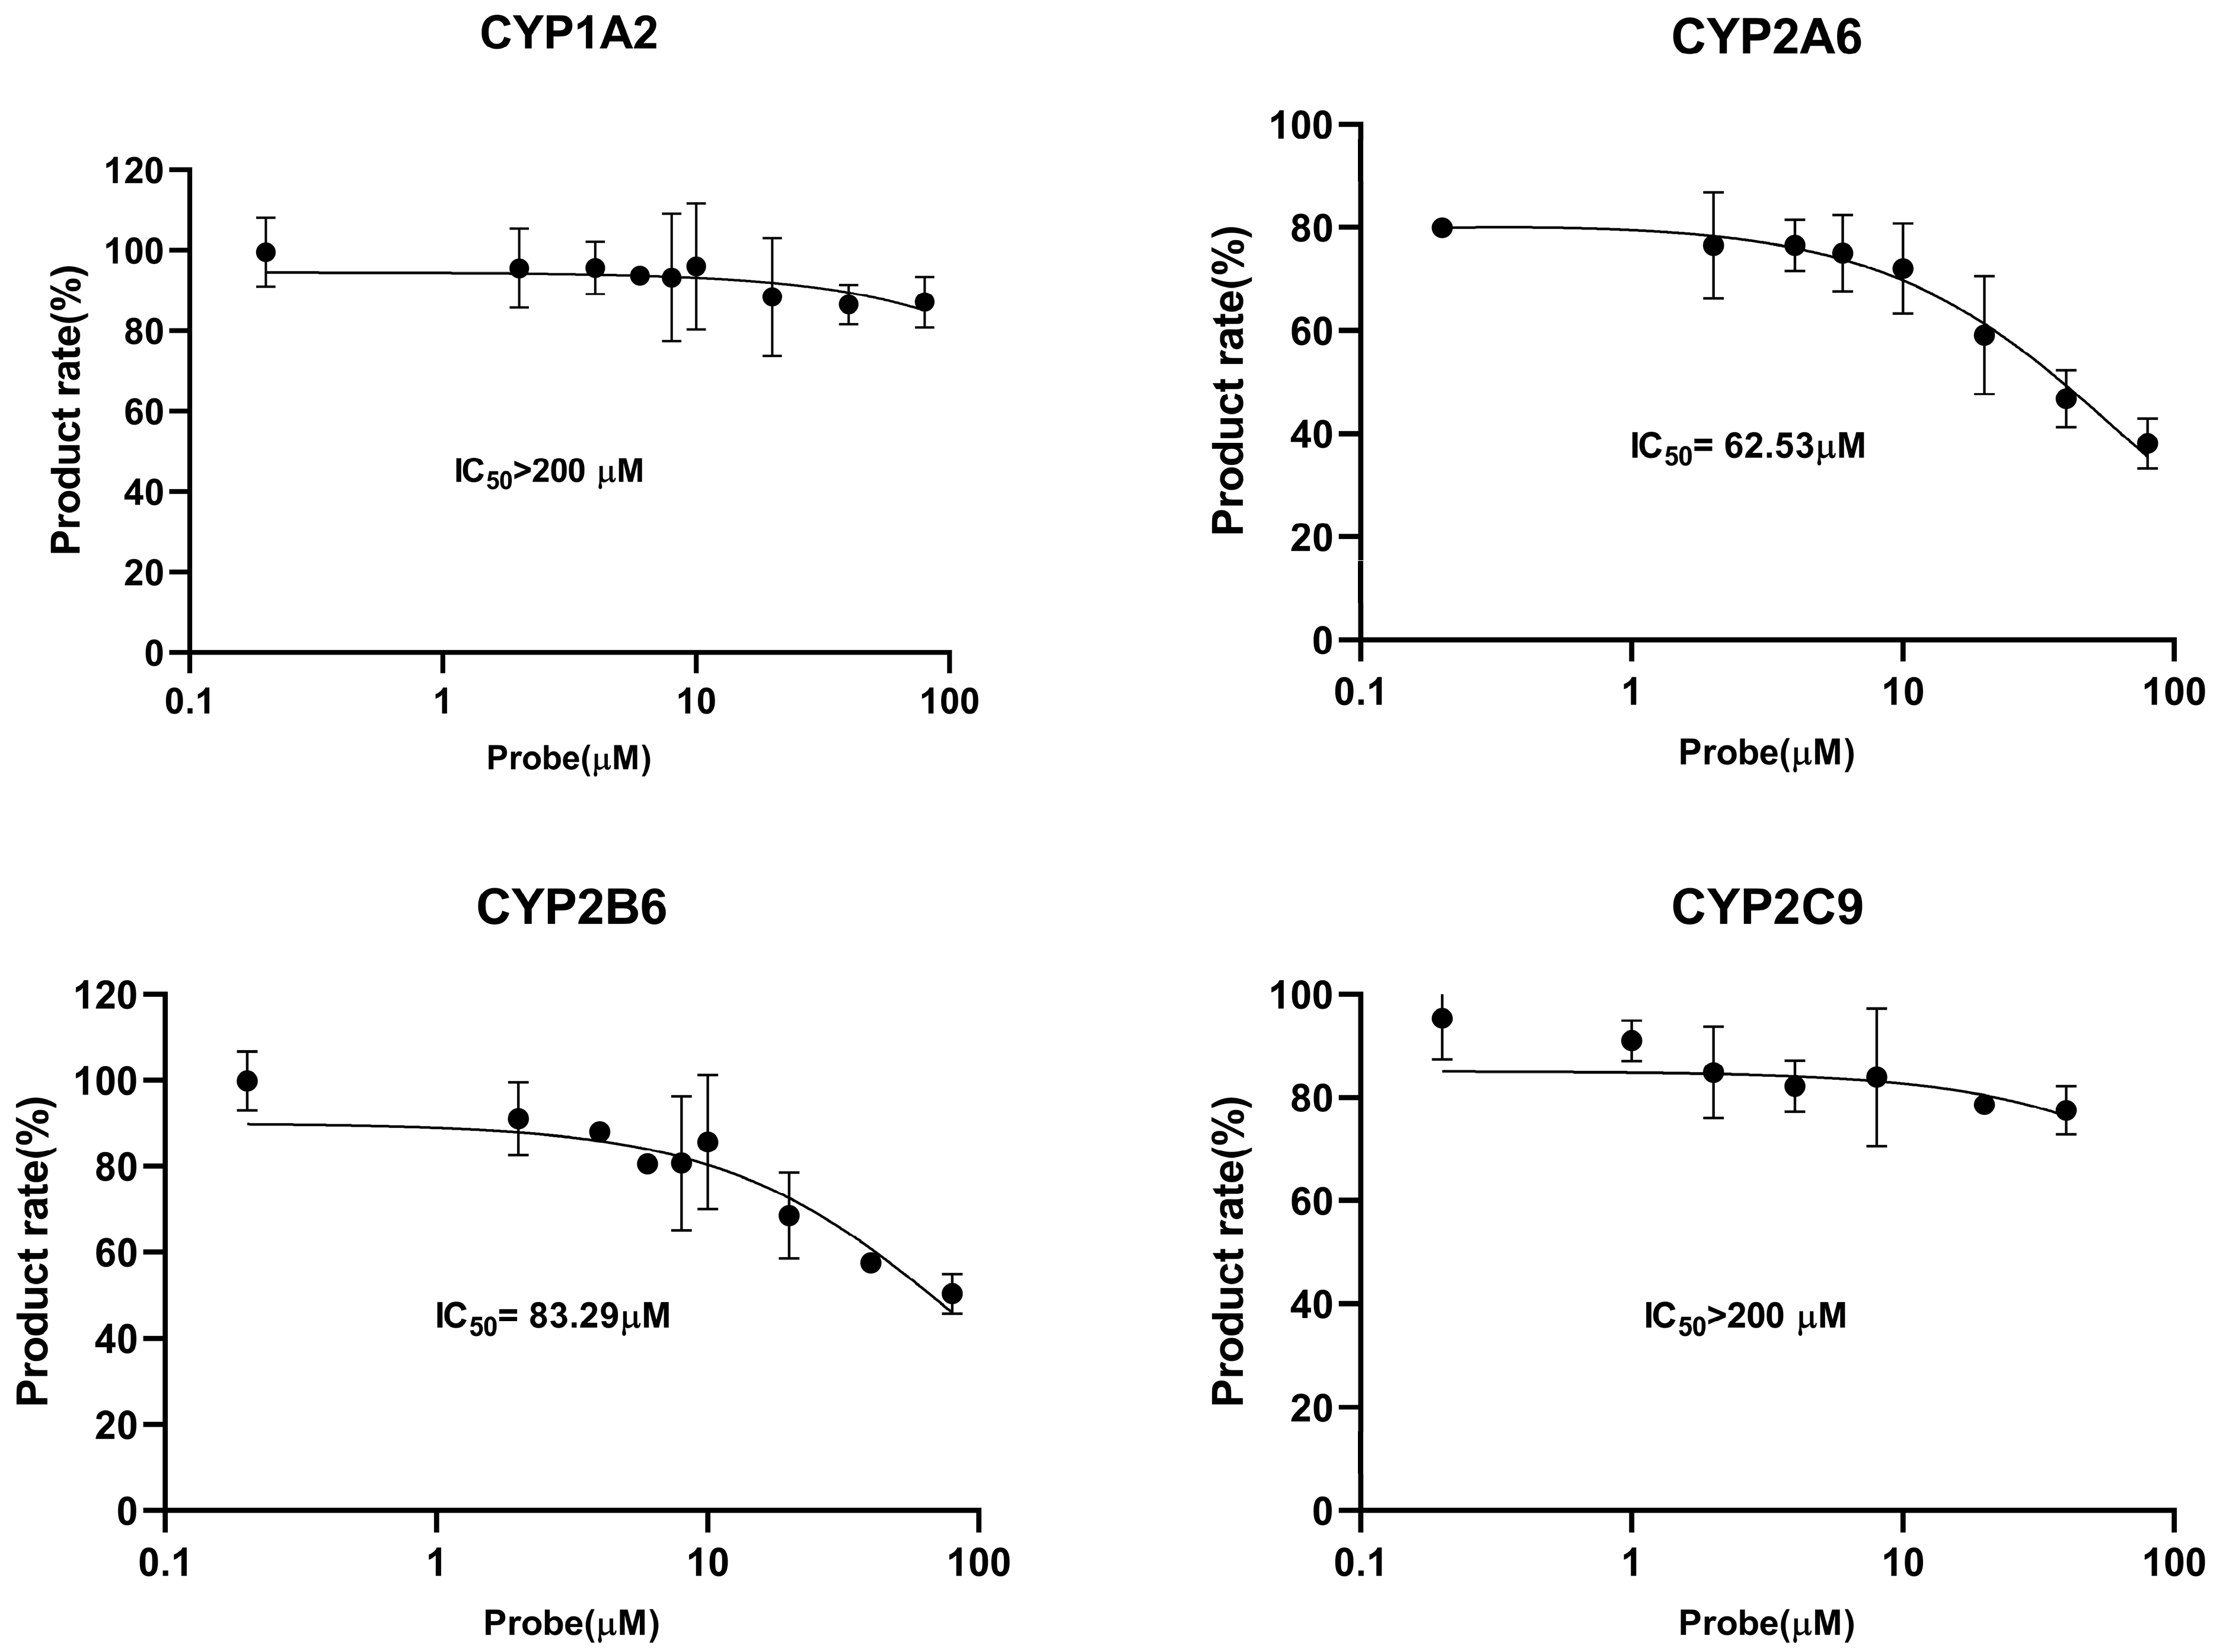
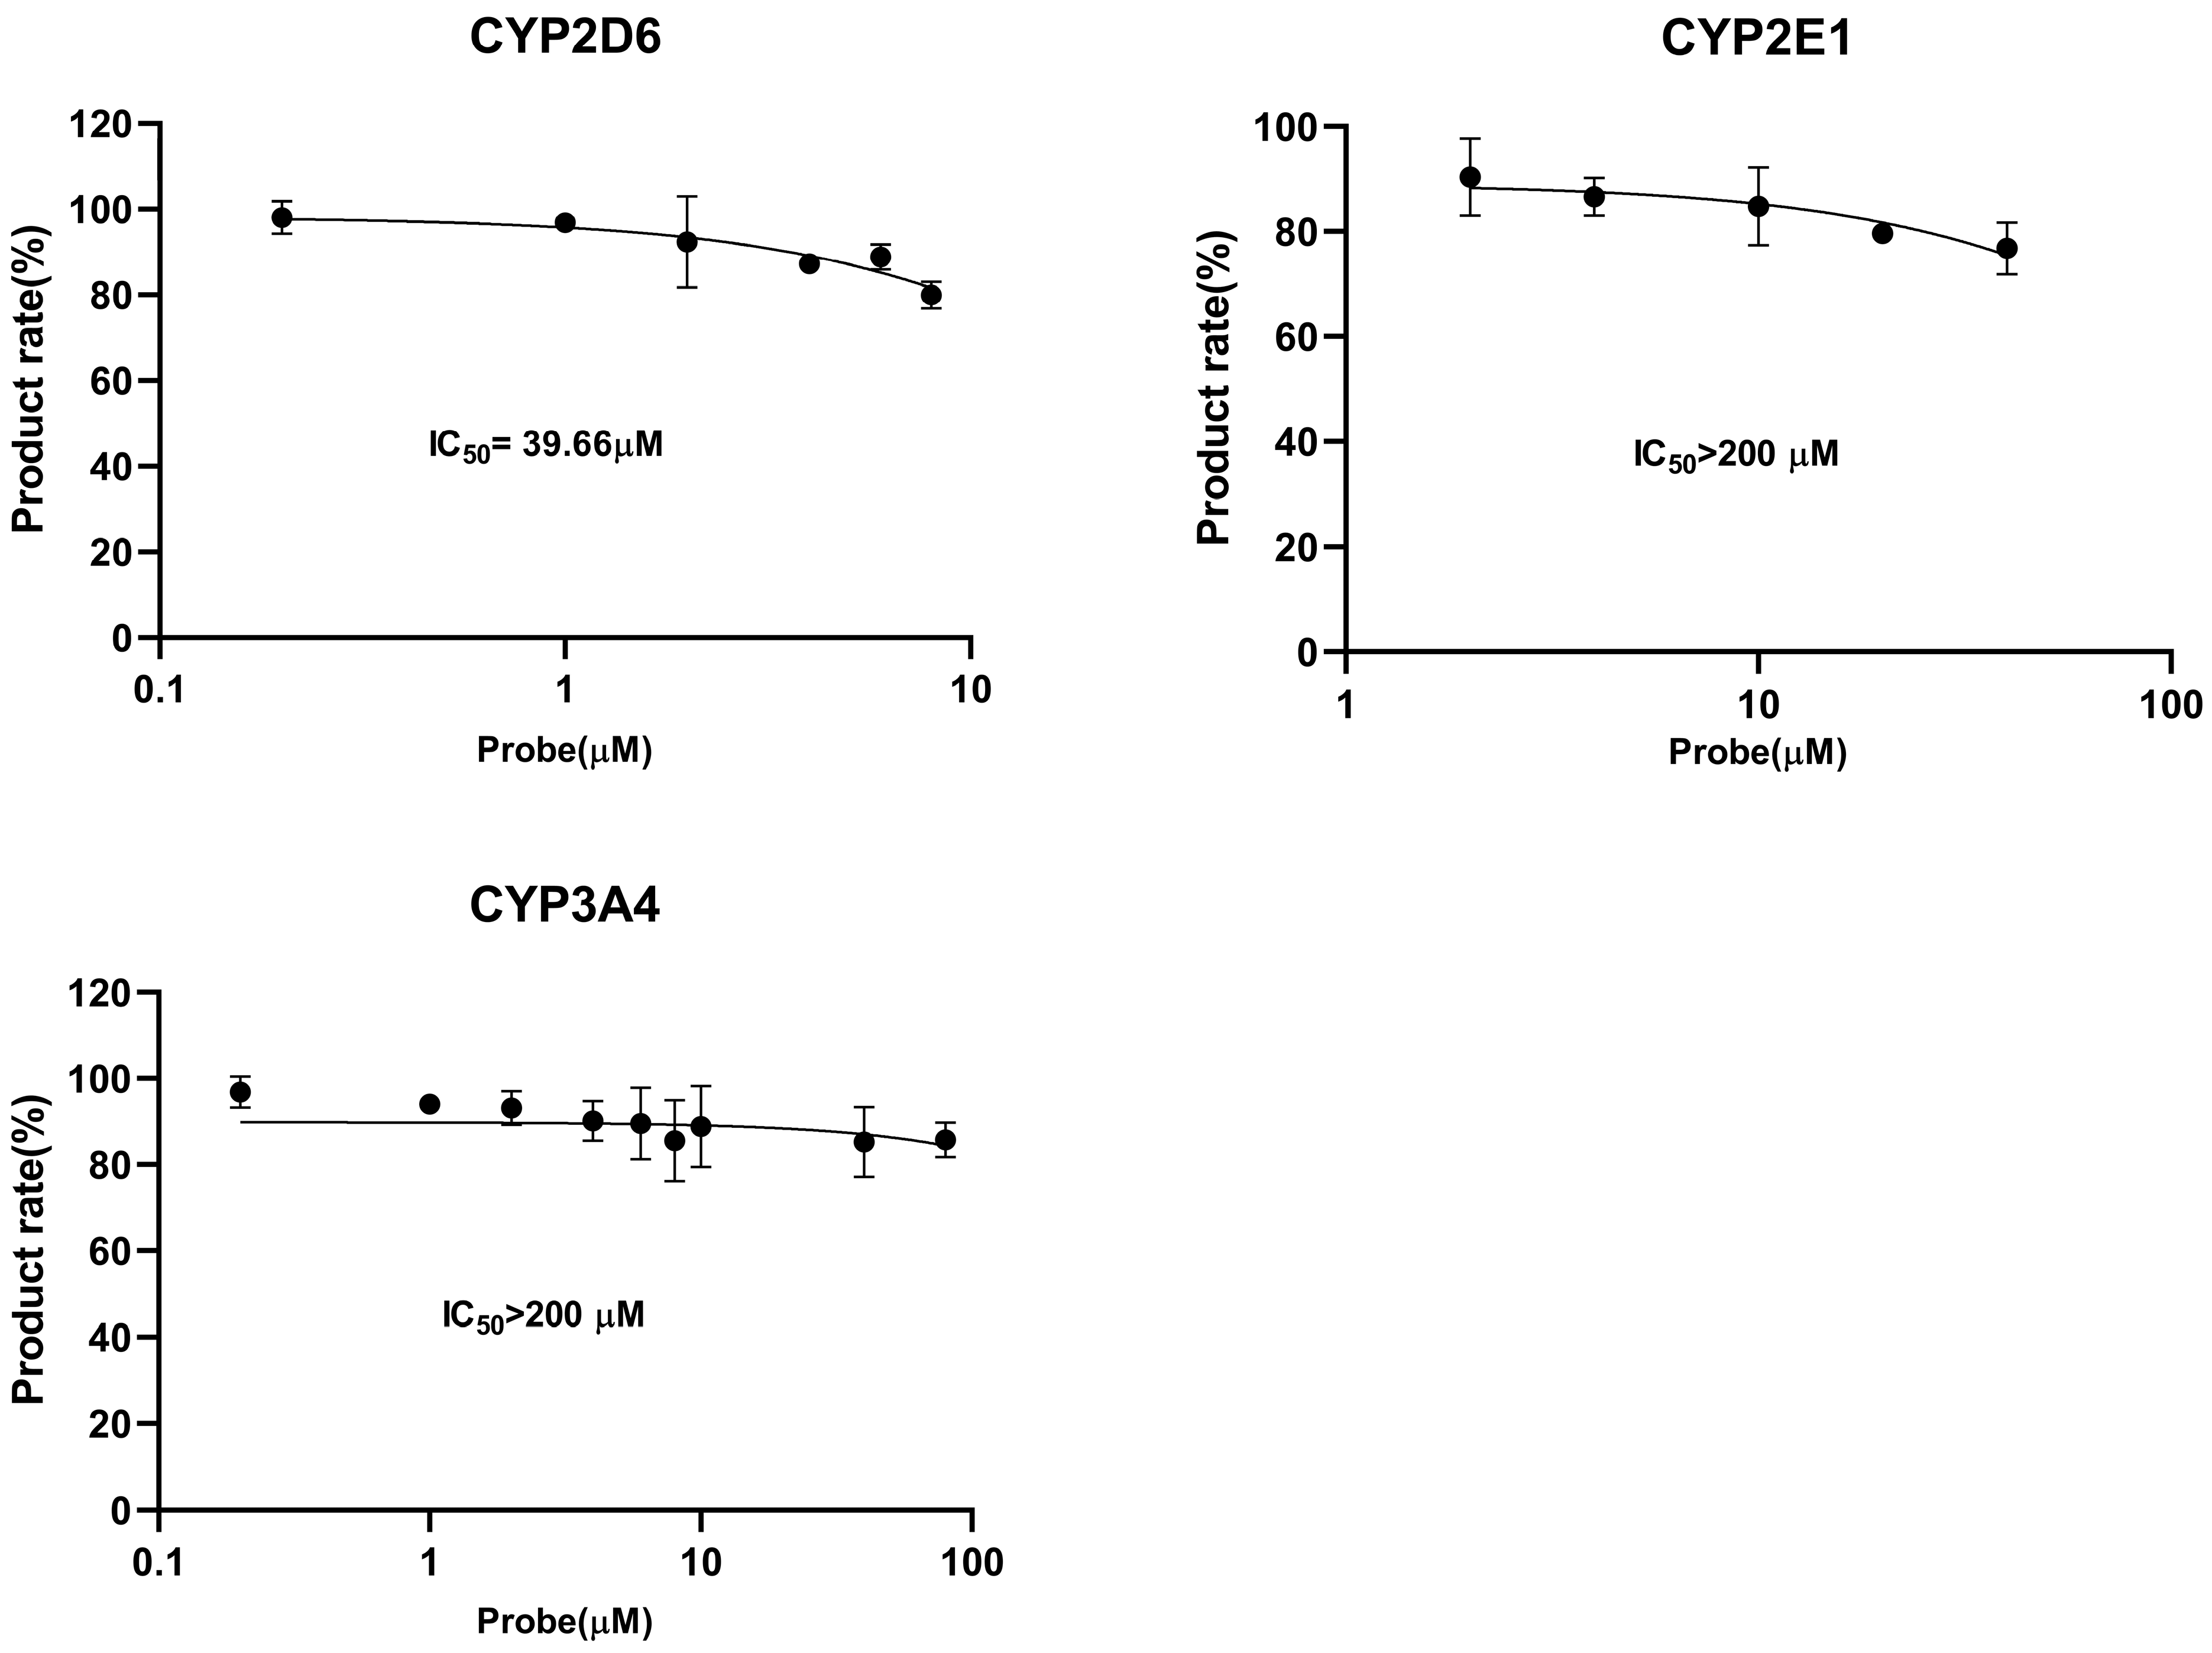
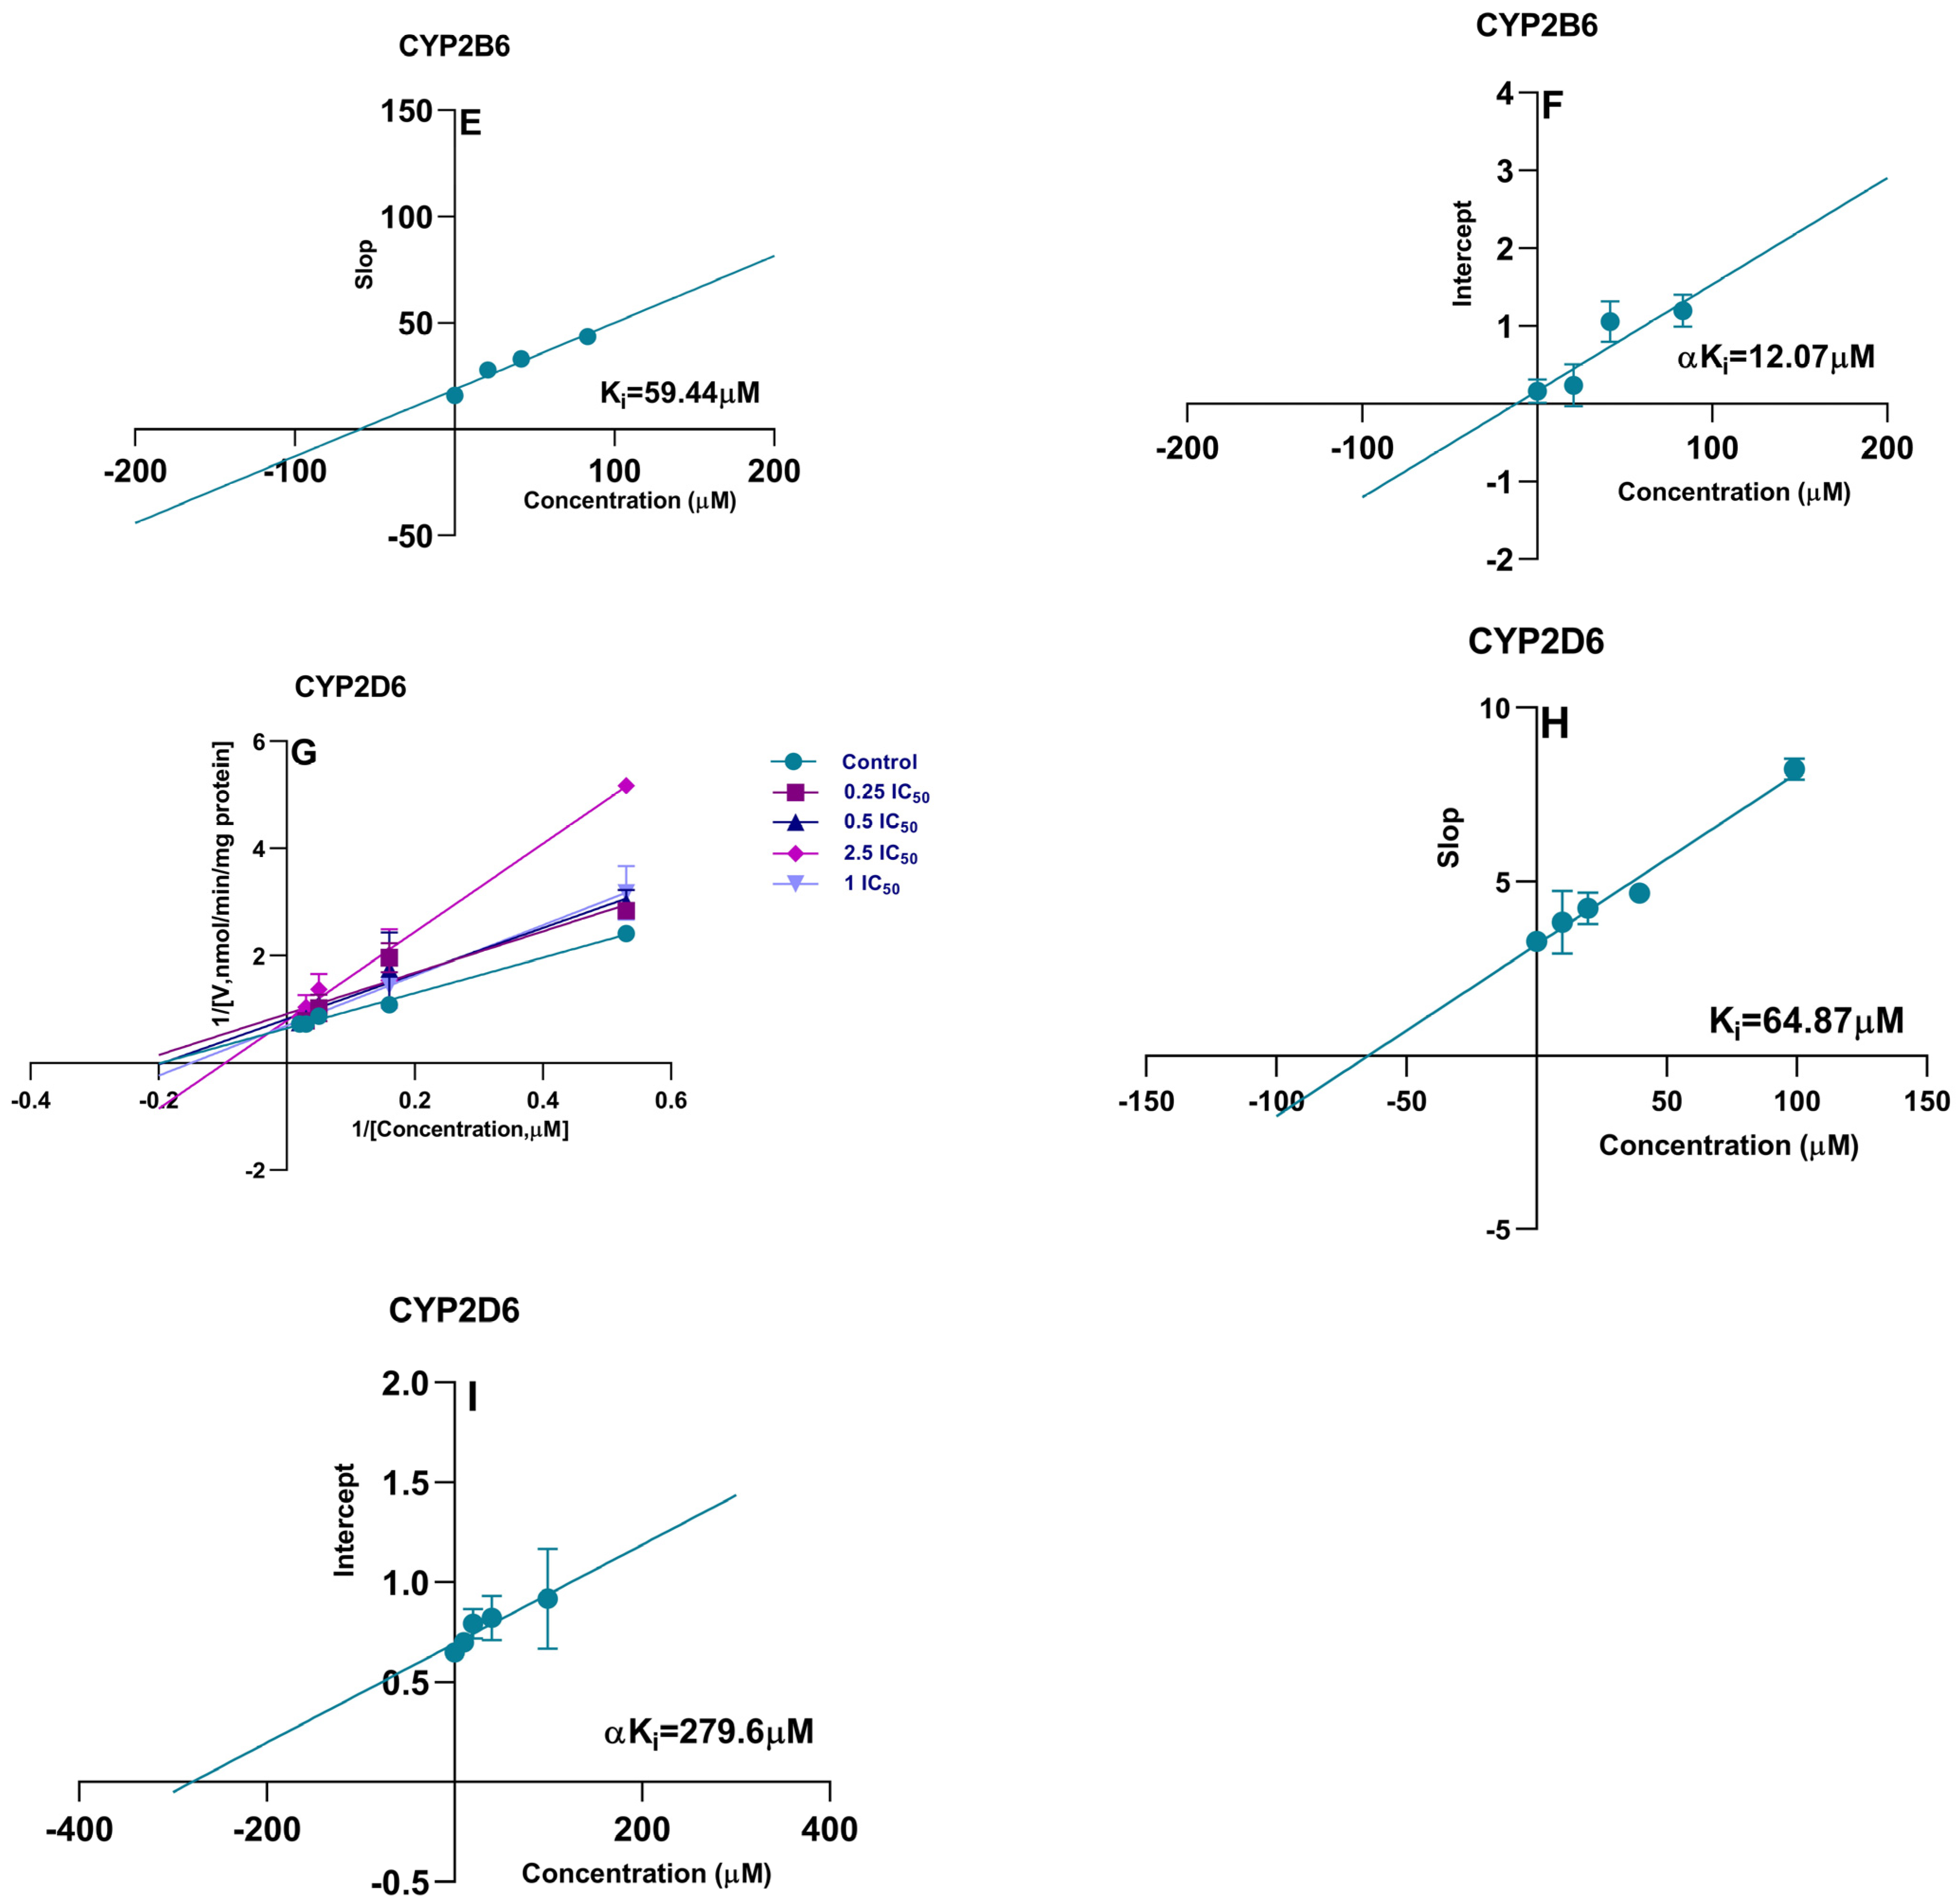
Direct IC50 values only preliminarily indicate the CYP450 enzyme inhibitory potential in the xenobiotics. In the presence of LKMS, as shown in Figure 3 and Table 2, the activity of CYP2D6 was inhibited with an IC50 value of 39.66 μM. A similar inhibitory effect and concentration-dependent effect was observed in the activities of CYP2A6 (IC50 = 62.53 μM) and CYP2B6 (IC50 = 83.29 μM), while the IC50 values of CYP1A2, CYP2C9, CYP2E1, and CYP3A4 were >200 μM. LKMS slightly inhibited the activities of CYP2A6, CYP2B6, and CYP2D6, whereas it had no effect on the biotransformation activity of CYP1A2, CYP2C9, CYP2E1, or CYP3A4 in DLM. DDI-involved macrolides are attributed to mechanism-based CYP3A4, where macrolides inactivated HTS in liver microsomes [49]. Macrolides, such as troleandomycin, erythromycin, clarithromycin, roxithromycin, and azithromycin, are poor inhibitors of CYP1A2 when PH is used to measure its activity [50]. In line with this, our results indicated that the LKMS did not affect the activity of CYP1A2, and the LKMS showed no inhibition of CYP3A4 activity. Investigating the mechanism of inhibition of LKMS in CYP450 isoforms is useful to clarify the irreversible and reversible inhibition type involved in interactions between inhibitors and enzymes [51]. In addition, the inhibition mechanism was evaluated for CYP450 isoforms that presented IC50 values lower than 100 μM [52]. The enzyme’s kinetic analysis via Lineweaver–Burk plots and secondary plots was applied to fit the inhibition models of CYP2A6, CYP2B6, and CYP2D6. As shown in Figure 4 and Table 3, LKMS exhibited mixed-type inhibition against the activity of CYP2A6 with a Ki of 135.6 μΜ. LKMS inhibited CYP2B6 and CYP2D6 in a mixed way with Ki values of 59.44 μM and 64.87 μM, respectively. The mixed inhibition was evident such that the alpha inhibition constants (αKi) for CYP2A6, CYP2D6, and CYP2B6 were 227.6, 279.6, and 12.07 μM (Ki ≠ αKi), respectively [53]. In our study on inhibition mechanisms, we utilized duplicated samples owing to their good reproducibility and cost-effectiveness. However, to ensure the utmost accuracy of the results, we recommend employing triplicate samples. These data indicate that LKMS inhibits the activities of three major CYP450 enzymes through mixed inhibition, namely, CYP2A6, CYP2B6, and CYP2D6.

2.4. Irreversible Inhibition (IC50 Shift)

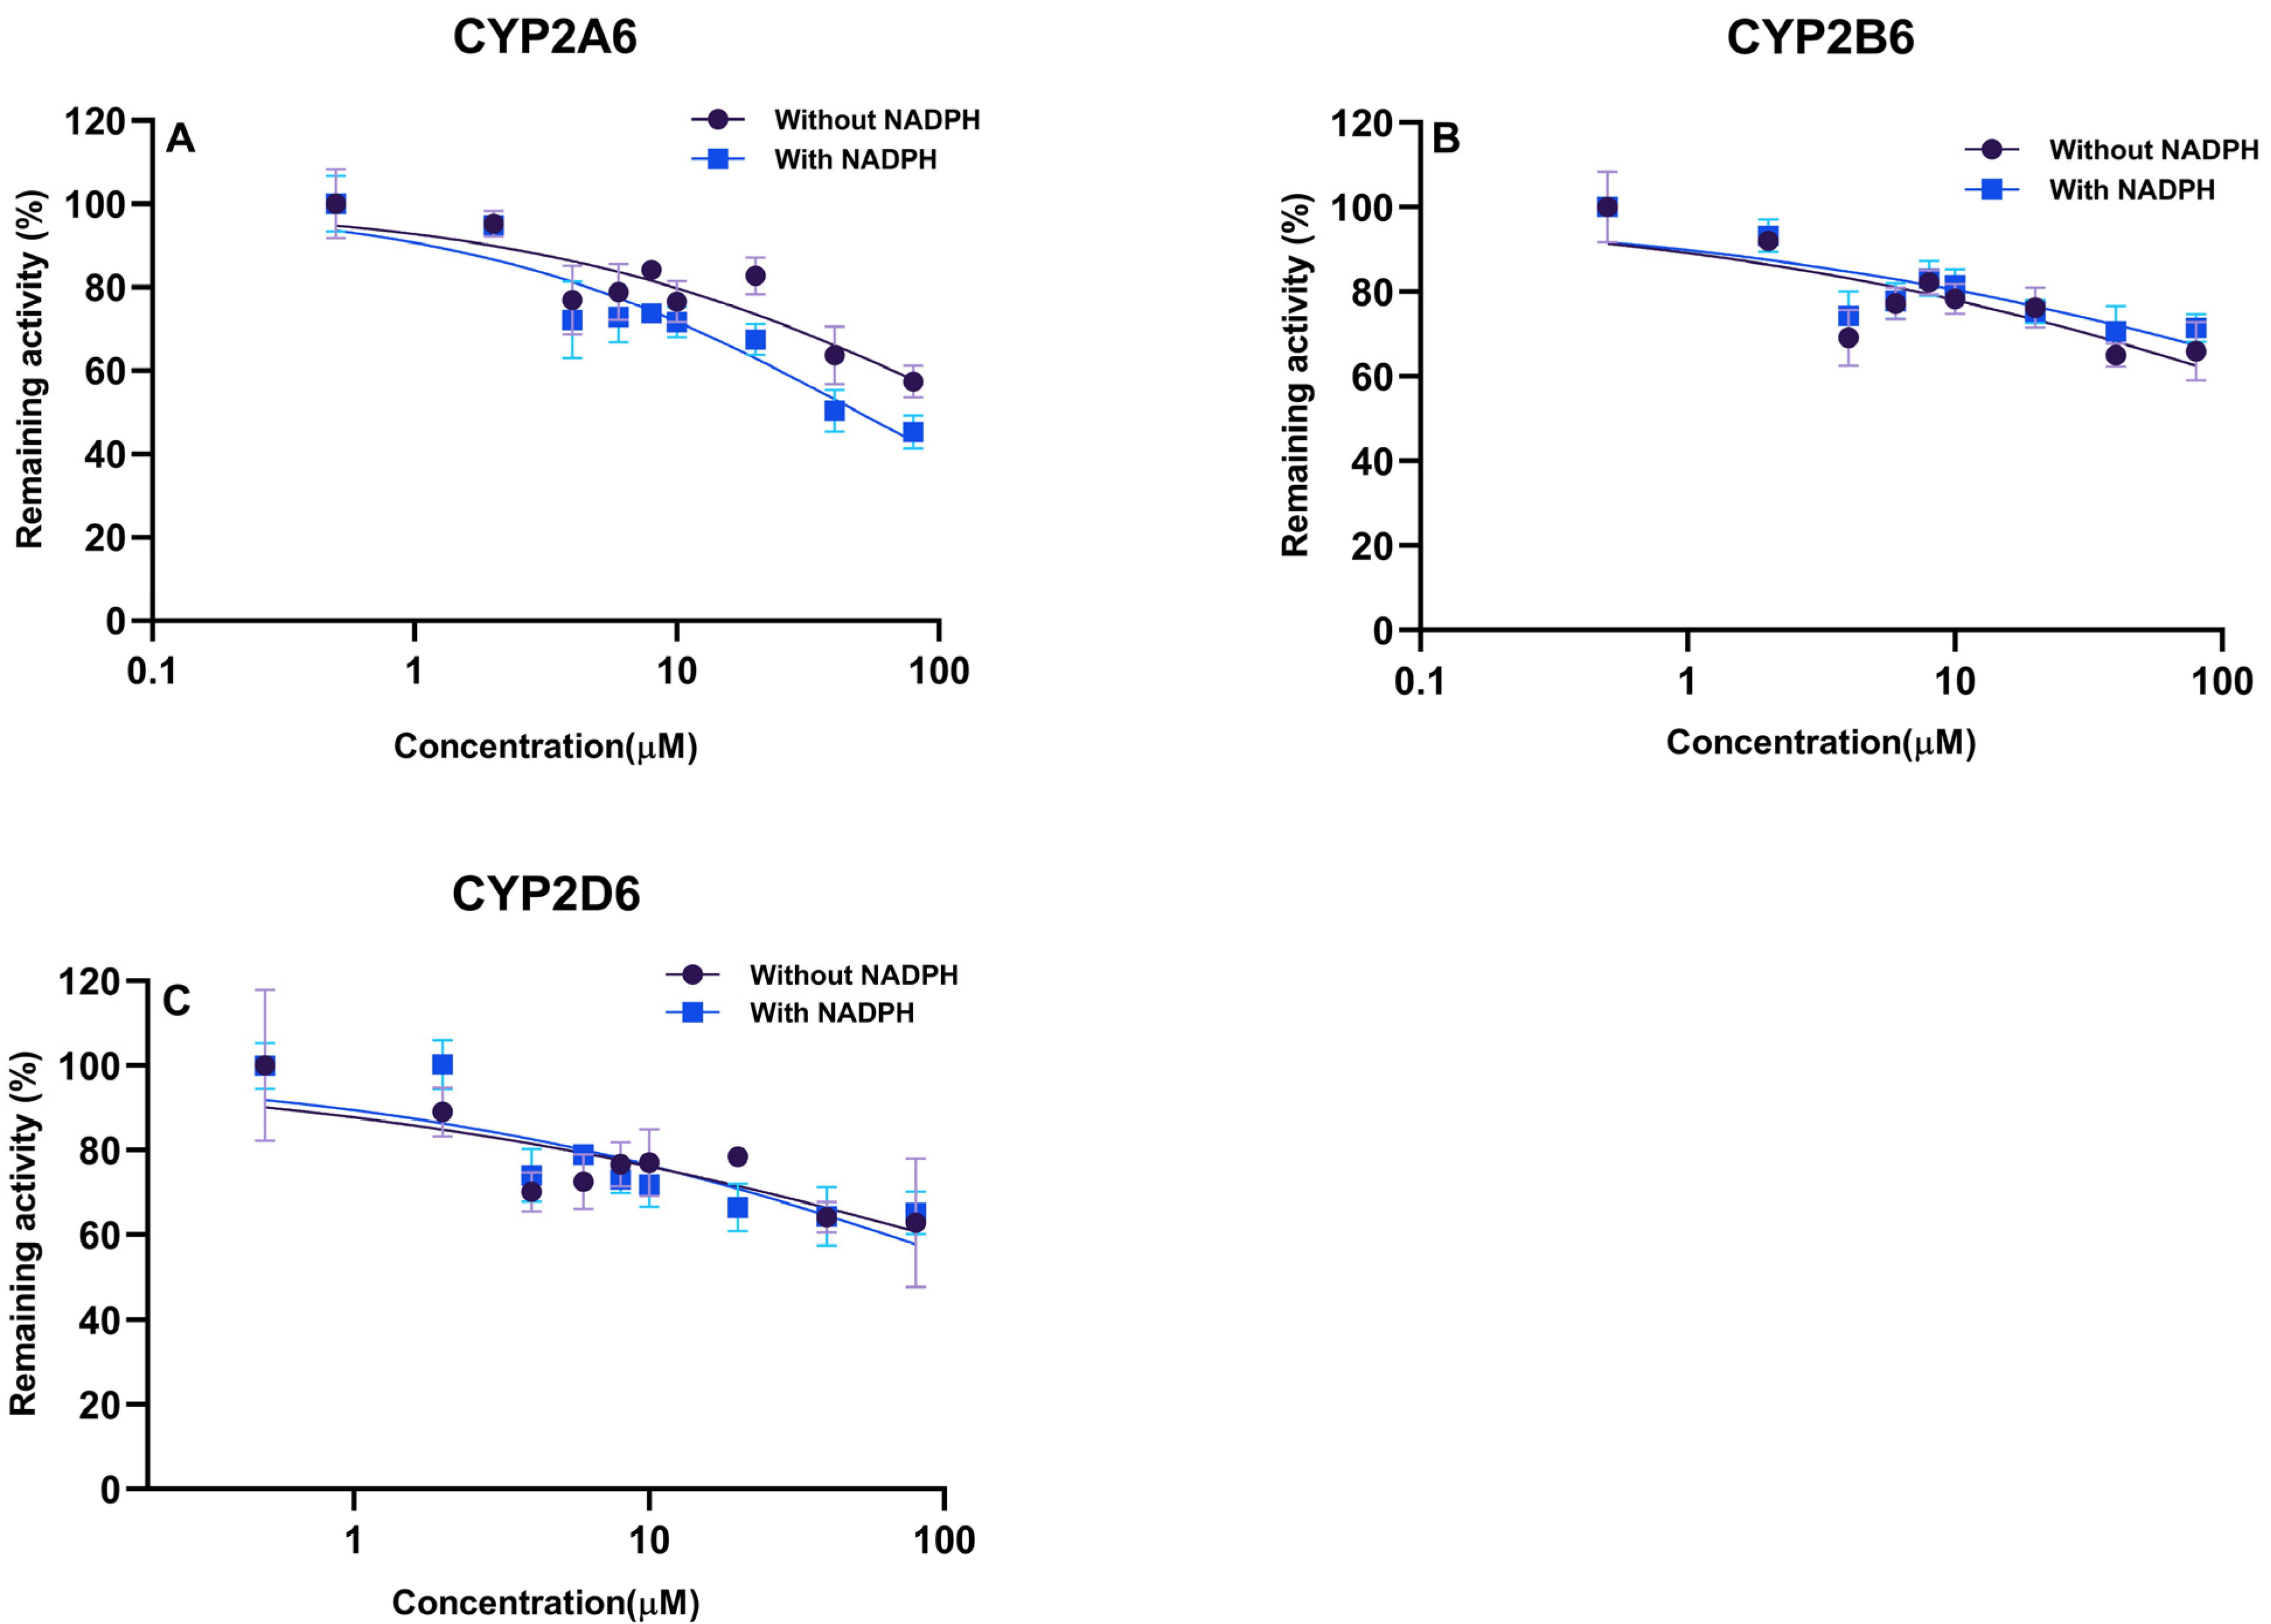
The IC50 shift value is widely used to determine time-dependent inhibitions (irreversible inhibition) [54]. According to our inhibition assay results, LKMS was a potent inhibitor of CYP450, which showed that LKMS relatively inhibited CYP2A6, CYP2B6, and CYP2D6 activities. Studying the inhibitory mechanism of the above three CYP450 isoforms was meaningful. As shown in Table 3 and Figure 5, the IC50 fold-shift (the ratio of the IC50 absence of NADPH divided by the IC50 presence of NADPH) of CYP2B6 was <1, indicating a right shift, while that of CYP2A6 and CYP2D6 was a left shift [55]. The IC50 fold-shift values were <1.5 [35], which indicated that LKMS might not be a time-dependent inhibitor of CYP2A6, CYP2B6, and CYP2D6.

2.5. Chemical Inhibition Experiments

An inhibition assay was performed on DLMs to confirm the contribution of the identified CYP450 enzymes in the metabolism of LKMS. The inhibitors used included α-Naphthoflavone (CYP1A2), pilocarpine (CYP2A6), thiotepa (CYP2B6), sulfaphenazole (CYP2C9), quinidine (CYP2D6), sodium diethyldithiocarbamate (CYP2E1), and ketoconazole (CYP3A4). The percentage inhibition of the LKMS disappearance rate in DLMs is presented in Figure 6. The co-incubation of LKMS with the CYP2D6 inhibitor decreased LKMS by 4.4%, while ketoconazole, a CYP3A4 inhibitor, inhibited LKMS metabolism by 17.4%. When incubated with inhibitors of the CYP1A2, CYP2C9, CYP2E1, CYP2B6, and CYP2A6 enzymes, the biotransformation rate of LKMS decreased by about 50%.

3. Discussion

Given the wide involvement of CYP450 in the metabolism processes of various drugs, the changes in the activity of hepatic metabolic enzymes may cause DDIs [56]. Accurately assessing the contribution of CYP450 isoforms is important for predicting clinical DDIs. The CYP450 enzymes involved in metabolism mainly include CYP3A4, CYP1A2, CYP2C9, CYP2C19, and CYP2D6, accounting for almost 78% of CYP450 enzymes [16,17]. The FDA and the European Medicines Agency have recommended assaying the DDI potential of an investigational drug candidate toward the key hepatic CYP450 enzymes involved in drug metabolism [19,57]. PH, CAN, BP, TBD, DEX, CLN, and TS are commonly employed as probe substrates to assess the activity of CYP1A2, CYP2A6, CYP2B6, CYP2C9, CYP2D6, CYP2E1, and CYP3A4 isoforms [58,59,60,61]. In this study, a cocktail approach was used to evaluate the influence of LKMS on the activity of CYP450 enzymes [36]. This is the first comprehensive report on the in vitro drug interaction potential of LKMS studied against seven CYP450 isoforms in DLMs.
Furthermore, the inhibitory effects of LKMS on CYP1A2, CYP2A6, CYP2B6, CYP2C9, CYP2D6, CYP2E1, and CYP3A4, herein the IC50 values of LKMS regarding CYP450 isoforms, were determined. The results indicated that LKMS is a potent inhibitor of CYP2A6, CYP2B6, and CYP2D6 with IC50 values of 62.53 μΜ, 83.29 μΜ, and 39.66 μΜ, respectively, but it did not exhibit the inhibition of CYP1A2, CYP2C9, CYP2E1, or CYP3A4 activities, as indicated by IC50 values exceeding 200 μΜ. Moreover, LKMS exhibited the mixed inhibition of CYP2A6, CYP2B6, and CYP2D6 activities. Of these CYP450 isoforms, LKMS showed the most potent inhibition of CYP2D6. As reported, the variation in CYP2D enzyme activity can increase the risk of adverse drug reactions [62]. The IC50 shift assay is one of the effective means of assessing the time-dependent inhibition of CYP450 enzymes [55]. IC50 fold-shifts of CYP2A6 and CYP2D6 were >1, while that of CYP2B6 was <1. Some drugs can be metabolized during preincubation to recover enzyme activity, resulting in an increased IC50 value [63,64]. Berry et al. mentioned that shifted IC50 values depend on the choice of inhibitor concentrations to the extent of reversible inhibition and incubation time [65]. Thus, the inhibition parameters of Ki are more important, particularly in applying extrapolation to in vivo DDIs [65]. In our study, LKMS demonstrated mixed-type inhibition against the activity CYP2A6 with a Ki value of 135.6 μΜ. Additionally, LKMS inhibited CYP2D6 and CYP2B6 in a mixed manner, with Ki values of 64.87 μM and 59.44 μM, respectively. Macrolide veterinary medicines are composed of lactone rings, which differ in their abilities to bind to and inhibit CYP3A4 [66]. Furthermore, most drug interactions regarding macrolides can inhibit CYP3A4-mediated catalytic activity [67,68]. Azithromycin has a weak effect on CYP3A4 and is less prone to drug interactions when combined with CYP3A4 enzyme-induced drugs [25,69]. Togami et al. used the probe drug midazolam to determine the activity of CYP3A4, which illustrates how azithromycin has a weak inhibitory effect on CYP3A4 [25]. Given that LKMS has a similar lactone ring structure to azithromycin, the preservation of this lactone ring structure in LKMS during metabolism might result in a mild inhibitory effect [25]. In addition, telithromycin can decrease the activities of hepatic CYP1A2 and CYP3A2 [10]. Similar to our results, the IC50 of erythromycin in CYP1A2, CYP2C9, CYP2C19, and CYP2D6 was greater than 300 μM, which indicates a weak inhibitory effect on CYP450 [70]. The phenotyping results indicated the main hepatic enzyme isoform was CYP2D6. The CYP2D6 isoform corresponds to only 2% of the CYP450 enzymes expressed in the liver, which are responsible for the metabolism of approximately 25% of medicines [71,72]. Therefore, considering that this study was conducted in vitro, it is advisable to undertake further in vivo investigations to elucidate the interaction between LKMS and canine CYP450 enzymes. Such preclinical biological screening plays a pivotal role in establishing the therapeutic effectiveness of new medicines and minimizing the potential for drug interactions.

4. Materials and Methods

4.1. Chemicals and Reagents

LKMS was provided by Henan Pulike Biological Engineering Co., Ltd. (Luoyang, China). LC-MS-grade methanol (MeOH), acetonitrile (ACN), and formic acid (FA) were purchased from Fisher Scientific (Pittsburgh, PA, USA). Ultrapure water was purified using a Milli-Q system (Millipore Corporation, Billerica, MA, USA). The following compounds were purchased from Sigma-Aldrich (St. Louis, MO, USA): PH, CAN, BP, TBD, DEX, CLN, and TS. ACE, HCAN, HBP, HTBD, HDEX, HCLN, and HTS were purchased from Beijing Huizhi Taikang Biological Technology (Beijing, China). α-Naphthoflavone, Pilocarpine, Ticlopidine, Sulfaphenazole, Quinidine, sodium diethyldithiocarbamate, and Ketoconazole were purchased from Sigma (St. Louis, MO, USA). Phosphate buffer (PBS) tablets were purchased from Beijing Solarbio Technology (Beijing, China). β-nicotinamide adenine dinucleotide phosphate was purchased from Fisher Scientific (Pittsburgh, PA, USA).
PH, CAN, BP, TBD, DEX, CLN, and TS stock solutions were prepared in ACN at 10 mg/mL. Stock solutions of ACE, HCAN, HBP, HTBD, HDEX, HCLN, and HTS were prepared in MeOH at a concentration of 10 μg/mL. The internal standard of aflatoxin B1 was prepared at 200 ng/mL in ACN. The specific probe substrates, metabolites, and inhibitors are presented in Table 4.

4.2. Instruments and Chromatographic Conditions

Quantitative analysis was carried out using UPLC coupled with TSQ Quantis™ (Thermo Fisher, Waltham, MA, USA). A HSS T3 column (100 mm × 2.1 mm, 1.7 μm) (Waters, USA) was used at 35 °C. Both positive and negative electrospray ionization (ESI+ and ESI-) modes were used in this study. The other parameters were as follows: capillary voltage, 3.5 kV (ESI+) and 2.7kV (ESI−); ion source temperature, 320 °C; vaporizer temperature, 350 °C; sheath gas flow rate, 50 arb; and collision gas flow rate, 12 arb. An injection volume of 5 µL was applied. Analytes were eluted using a mobile phase of 0.1% FA·H2O (A): ACN (B) (90:10, v/v) at a flow rate of 0.2 mL/min. The gradient was as follows: 0–1.0 min (10%, B), 1.0–3.0 min (10–90%, B), 3.0–4.0 min (90%, B), 4.0–4.5 min (90–10%, B), 4.6–6.0 min (10%, B). The mass spectrometry parameters are provided in Table 5.

4.3. Microsomal Incubation and Enzymatic Kinetic Study

The CYP450 enzymatic activities were characterized by their probe substrate reactions. Incubation mixtures were prepared in a total volume of 200 μL, which consisted of PBS (pH = 7.4), NADPH, probe substrates, and various concentrations of tested compounds. NADPH was added to initiate the reaction after a 5 min preincubation period at 37 °C in a thermos shaker. Of note, the volume of the final organic solvent in the incubation system should be below <1% (v/v) [21]. All experiments were performed in triplicate.
The probe substrate concentrations were as follows: PH, BP, CLN, and CAN, 1–200 μM; TBD, 10–400 μM; DEX, 1–100 μM; and TS, 5–400 μM. The Vmax and Km were calculated using GraphPad Prism v.8.0.2 (GraphPad software Inc., San Diego, CA, USA) via the Michaelis–Menten kinetic model. In addition, incubation times of 0–60 min were examined for mixed probe substrates. Various DLM protein concentrations (0.05–1 mg/mL) in the incubation mixture were carried out.
Then, 400 μL of cool ACN containing the 20 μL internal standard was added to terminate the reaction. Samples were vortexed for 2 min and centrifuged at 14,000 rpm for 10 min (4 °C). Next, the supernatant was steamed under nitrogen (40 °C) until dry. Then, it was dissolved with 200 µL of ACN: H2O = 80:20 (v/v). Finally, after filtering with a 0.22 μm membrane, an aliquot of 5 µL was injected into the UPLC-MS/MS for analysis.

4.4. CYP450 Inhibition Study

Inhibition assessment of CYP450 isoforms in DLM was performed with a fixed concentration of model probe substrates and a series of concentrations of LKMS ranging from 0 to 80 μM. The concentration of probe substrates was at a concentration of Km in this study. Meanwhile, the Ki values were measured with various concentrations of probe substrates (0.3 Km, 1 Km, 3 Km, 6 Km, and 10 Km) and LKMS (0, 0.25 IC50, 0.5 IC50, 1 IC50, and 2.5 IC50). Ki values of LKMS were determined if their IC50 values were lower than 100 μM [52,73]. The IC50 was calculated using the GraphPad Prism v.8.0.2 (GraphPad Software Inc., San Diego, CA, USA). Mode inhibition was examined based on a primary Lineweaver–Burk plot and a secondary plot.

4.5. Irreversible Inhibition (IC50 Shift)

To characterize the reversible or irreversible mechanism of CYP450 inhibition via LKMS, the shifted IC50 values were used to determine whether the inhibition of LKMS on CYP450 was time-dependent. The IC50 shift experiment was performed via the preincubation of LKMS in DLMs for 30 min at 37 °C with and without NADPH. The above mixture was then incubated for another 30 min in the presence of NADPH. The concentrations of LKMS were designated as 0.2, 2, 4, 6, 8, 10, 20, 40, and 80 μM, and the concentration of each probe substrate was based on each Km value. The concentrations of the probe substrates of CYP2A6, CYP2B6, and CYP2D6 were at single concentrations approximating their Km values [55].

4.6. Chemical Inhibition Experiments

The effect of selective inhibitors on the rate of LKMS disappearance was investigated to identify the metabolizing enzymes of LKMS. The total volume of the incubation system was 200 μL, which contained the tested compound, inhibitors, PBS (pH = 7.4), LKMS, and NADPH. The study was performed via incubation with different inhibitors of CYP450 as follows: α-naphthoflavone (CYP1A2, 2 μM), pilocarpine (CYP2A6, 8 μM), Thio-TEPA (CYP2B6, 6 μM), sulfaphenazole (CYP2C9, 6 μM), quinidine (CYP2D6, 8 μM), sodium diethyldithiocarbamate (CYP2E1, 20 μM), and ketoconazole (CYP3A4, 2 μM). The sample incubated without inhibitors was used as a negative control. The sample was incubated with dimethyl sulfoxide (DMSO) (25%) as a positive control in this study. Following this pilot, confirmatory experiments were conducted by incubating with DLM in the presence of specific CYP450 inhibitors.

4.7. Statistical Analysis

The IC50 values and enzyme kinetic parameters were determined by plotting relative activities over the logarithm of the concentration of LKMS using GraphPad (v.8.0.2, CA, USA). The mode of the inhibitor was analyzed using a Lineweaver–Burk plot and a secondary plot for inhibition constant (Ki and αKi) values. All experimental data are shown as mean ± standard deviation (SD).

5. Conclusions

In the current study, a UPLC-MS/MS method was established to simultaneously determine the metabolites of CYP450 probe substrates and to explore the effect of LKMS on the activities of dog CYP450 enzymes, both in vitro and in vivo. Importantly, the mechanisms of the inhibition of CYP450 caused by LKMS were investigated for the first time. Accordingly, our data suggest that LKMS can act as a mixed inhibitor, inhibiting CYP2A6, CYP2B6, and CYP2D6. Moreover, this inhibition via LKMS did not exhibit time-dependent behavior. All these results indicated the potential for DDIs between LKMS and drugs metabolized by CYP2A6, CYP2B6, or CYP2D6. However, further in vivo studies are needed to verify these potential effects.

Supplementary Materials

The following supporting information can be downloaded at: https://www.mdpi.com/article/10.3390/molecules28207193/s1. Figure S1: Optimized incubation time of bupropion (BP), coumarin (CAN), chlorzoxazone (CLN), dextromethorphan (DEXM), phenacetin (PH), tolbutamide (TBD), and testosterone (TS) in dog liver microsomes. Data are presented as mean ± SD (n = 3). Figure S2: Optimized protein concentration of bupropion (BP), coumarin (CAN), chlorzoxazone (CLN), dextromethorphan (DEXM), phenacetin (PH), tolbutamide (TBD), and testosterone (TS) in dog liver microsomes. Data are presented as mean ± SD (n = 3). Figure S3: The structure of lekethromycin with a molecule weight of 804.5 (C41H77N3O12).

Author Contributions

P.S. and Y.C. contributed equally to this work and should be considered co-first authors. Conceptualization, Y.C. and P.S.; data curation, P.S., Y.C., J.Q. and J.K.; formal analysis, P.S. and Y.C.; funding acquisition, X.C.; investigation, Y.C., J.Q. and J.K.; methodology, Y.C. and P.S.; project administration, X.C.; resources, X.C.; software, P.S. and Y.C.; supervision, S.Z. and X.C.; writing original draft, Y.C. and P.S.; writing review and editing, J.Q. and J.K. All authors have read and agreed to the published version of the manuscript.

Funding

This research received no external funding.

Institutional Review Board Statement

The experiment was approved by the Animal Care and Use Committee of China Agricultural University (11204-17-023).

Informed Consent Statement

Informed consent was obtained from all subjects involved in the study.

Data Availability Statement

Not applicable.

Acknowledgments

We would like to thank Degang Zhou (Henan Pulike Biological Engineering Co., Ltd., Luo Yang 471000, Henan, China) for his assistance during the experiment.

Conflicts of Interest

The authors have no conflicts of interest in relation to this paper.

Sample Availability

Not applicable.

References

  1. Cao, Y.; Sun, P.; Qiu, J.; Kong, J.; Yang, Y.; Liu, Y.; Zhou, D.; Wang, J.; Cao, X. Determination of lekethromycin in plasma and tissues of pneumonia-infected rats by ultra-high performance liquid chromatography-tandem mass spectrometry. J. Chromatogr. B 2023, 1227, 123811. [Google Scholar] [CrossRef]
  2. Sun, P.; Xiao, H.; Qiu, J.; Cao, Y.; Kong, J.; Zhang, S.; Cao, X. Plasma Protein Binding Rate and Pharmacokinetics of Lekethromycin in Rats. Antibiotics 2022, 11, 1241. [Google Scholar] [CrossRef]
  3. Xiao, H.; Sun, P.; Qiu, J.; Wang, J.; Yan, L.; Zhang, S.; Cao, X. Determination of lekethromycin, a novel macrolide lactone, in rat plasma by UPLC-MS/MS and its application to a pharmacokinetic study. Molecules 2020, 25, 4676. [Google Scholar] [CrossRef]
  4. Tang, D.-Q.; Li, Y.-J.; Li, Z.; Bian, T.-T.; Chen, K.; Zheng, X.-X.; Yu, Y.-Y.; Jiang, S.-S. Study on the interaction of plasma protein binding rate between edaravone and taurine in human plasma based on HPLC analysis coupled with ultrafiltration technique. Biomed. Chromatogr. 2015, 29, 1137–1145. [Google Scholar] [CrossRef] [PubMed]
  5. Holbeck, S.L.; Camalier, R.; Crowell, J.A.; Govindharajulu, J.P.; Hollingshead, M.; Anderson, L.W.; Polley, E.; Rubinstein, L.; Srivastava, A.; Wilsker, D.; et al. The National Cancer Institute ALMANAC: A Comprehensive Screening Resource for the Detection of Anticancer Drug Pairs with Enhanced Therapeutic Activity. Cancer Res. 2017, 77, 3564–3576. [Google Scholar] [CrossRef] [PubMed]
  6. Food and Drug Administration. Clinical Drug Interaction Studies-Cytochrome P450 Enzyme-and Transporter-Mediated Drug Interactions Guidance for Industry. 2020. Available online: https://www.fda.gov/drugs/guidances-drugs/guidance-recap-podcast-clinical-drug-interaction-studies-cytochrome-p450-enzyme-and-transporter. (accessed on 11 July 2023).
  7. Food and Drug Administration. In Vitro Drug Interaction Studies-Cytochrome P450 Enzyme-and Transporter-Mediated Drug Interactions. 2020. Available online: https://www.fda.gov/regulatory-information/search-fda-guidance-documents/in-vitro-drug-interaction-studies-cytochrome-p450-enzyme-and-transporter-mediated-drug-interactions (accessed on 12 July 2023).
  8. Sun, L.; Mi, K.; Hou, Y.; Hui, T.; Zhang, L.; Tao, Y.; Liu, Z.; Huang, L. Pharmacokinetic and Pharmacodynamic Drug–Drug Interactions: Research Methods and Applications. Metabolites 2023, 13, 897. [Google Scholar] [CrossRef]
  9. Rendic, S.; Guengerich, F.P. Survey of Human Oxidoreductases and Cytochrome P450 Enzymes Involved in the Metabolism of Xenobiotic and Natural Chemicals. Chem. Res. Toxicol. 2015, 28, 38–42. [Google Scholar] [CrossRef]
  10. Ravindranath, V.; Strobel, H.W. Cytochrome P450-mediated metabolism in brain: Functional roles and their implications. Expert Opin. Drug Metab. Toxicol. 2013, 9, 551–558. [Google Scholar] [CrossRef]
  11. Seliskar, M.; Rozman, D. Mammalian cytochromes P450—Importance of tissue specificity. Biochim. Biophys. Acta (BBA)-Gen. Subj. 2007, 1770, 458–466. [Google Scholar] [CrossRef] [PubMed]
  12. Almazroo, O.A.; Miah, M.K.; Venkataramanan, R. Drug Metabolism in the Liver. Clin. Liver Dis. 2017, 21, 1–20. [Google Scholar] [CrossRef]
  13. Danielson, P.B. The Cytochrome P450 Superfamily: Biochemistry, Evolution and Drug Metabolism in Humans. Curr. Drug Metab. 2002, 3, 561–597. [Google Scholar] [CrossRef]
  14. Venkatakrishnan, K.; von Moltke, L.L.; Greenblatt, D.J. Human Drug Metabolism and the Cytochromes P450: Application and Relevance of In Vitro Models. J. Clin. Pharmacol. 2001, 41, 1149–1179. [Google Scholar] [CrossRef]
  15. Ingelman-Sundberg, M. Human drug metabolising cytochrome P450 enzymes: Properties and polymorphisms. Naunyn Schmiedebergs Arch. Pharmacol. 2004, 369, 89–104. [Google Scholar] [CrossRef] [PubMed]
  16. Zanger, U.M.; Turpeinen, M.; Klein, K.; Schwab, M. Functional pharmacogenetics/genomics of human cytochromes P450 involved in drug biotransformation. Anal. Bioanal. Chem. 2008, 392, 1093–1108. [Google Scholar] [CrossRef] [PubMed]
  17. Yuan, R.; Madani, S.; Wei, X.-X.; Reynolds, K.; Huang, S.-M. Evaluation of Cytochrome P450 Probe Substrates Commonly Used by the Pharmaceutical Industry to Study in Vitro Drug Interactions. Drug Metab. Dispos. 2002, 30, 1311–1319. [Google Scholar] [CrossRef] [PubMed]
  18. Zhao, M.; Ma, J.; Li, M.; Zhang, Y.; Jiang, B.; Zhao, X.; Huai, C.; Shen, L.; Zhang, N.; He, L.; et al. Cytochrome P450 Enzymes and Drug Metabolism in Humans. Int. J. Mol. Sci. 2021, 22, 12808. [Google Scholar] [CrossRef]
  19. Zhang, L.; Xu, X.; Badawy, S.; Ihsan, A.; Liu, Z.; Xie, C.; Wang, X.; Tao, Y. A Review: Effects of Macrolides on CYP450 Enzymes. Curr. Drug Metab. 2020, 21, 928–937. [Google Scholar] [CrossRef]
  20. Shah, S.S.; Sasaki, K.; Hayashi, Y.; Motoyama, S.; Helmi, A.R.; Khalil, W.F.; Shimoda, M. Inhibitory effects of ketoconazole, cimetidine and erythromycin on hepatic CYP3A activities in cats. J. Vet. Med. Sci. 2009, 71, 1151–1159. [Google Scholar] [CrossRef]
  21. Wong, S.L.; Cao, G.; Mack, R.J.; Witt; Granneman, G.R. The Effect of Erythromycin on the CYP3A Component of Sertindole Clearance in Healthy Volunteers. J. Clin. Pharmacol. 1997, 37, 1056–1061. [Google Scholar] [CrossRef]
  22. Ostrowski, M.; Wilkowska, E.; Bączek, T. Impact of pharmaceutical dosage form on stability and dissolution of roxithromycin. Open Med. 2010, 5, 83–90. [Google Scholar] [CrossRef]
  23. Qin, Y.; Xu, W.; Mo, L.; Li, X.; Ge, B.; Xiong, J.; Gao, L.; Xu, P.; Xue, M. Comparison of Pharmacokinetics and Tissue Distribution Kinetics of Roxithromycin and Expression of CYP 3A1 between Pregnant Mice and Foetuses. Basic Clin. Pharmacol. Toxicol. 2017, 120, 146–151. [Google Scholar] [CrossRef]
  24. Bruce, M.A.; Hall, S.D.; Haehner-Daniels, B.D.; Gorski, J.C. In Vivo effect of clarithromycin on multiple cytochrome P450s. Drug Metab. Dispos. 2001, 29, 1023–1028. [Google Scholar]
  25. Togami, K.; Hayashi, Y.; Chono, S.; Morimoto, K. Involvement of intestinal permeability in the oral absorption of clarithromycin and telithromycin. Biopharm. Drug Dispos. 2014, 35, 321–329. [Google Scholar] [CrossRef]
  26. Grönlund, J.; Saari, T.; Hagelberg, N.; Martikainen, I.K.; Neuvonen, P.J.; Olkkola, K.T.; Laine, K. Effect of Telithromycin on the Pharmacokinetics and Pharmacodynamics of Oral Oxycodone. J. Clin. Pharmacol. 2010, 50, 101–108. [Google Scholar] [CrossRef]
  27. Nosaka, H.; Nadai, M.; Kato, M.; Yasui, K.; Yoshizumi, H.; Miyoshi, M.; Zhao, Y.L.; Baba, K.; Takagi, K.; Hasegawa, T. Effect of a newly developed ketolide antibiotic, telithromycin, on metabolism of theophylline and expression of cytochrome P450 in rats. Life Sci. 2006, 79, 50–56. [Google Scholar] [CrossRef]
  28. Lee, J.H.; Kang, H.E.; Lee, M.G. Pharmacokinetic interaction between telithromycin and metformin in diabetes mellitus rats. Xenobiotica 2010, 40, 217–224. [Google Scholar] [CrossRef]
  29. Guengerich, F.P. Inhibition of Cytochrome P450 Enzymes by Drugs-Molecular Basis and Practical Applications. Biomol. Ther. 2022, 30, 1–18. [Google Scholar] [CrossRef] [PubMed]
  30. Wang, J.; Chen, F.; Jiang, H.; Xu, J.; Meng, D.; Geng, P.; Dai, D.; Hu, J.; Zhou, Y.; Zhou, Q.; et al. Inhibition and Induction by Poziotinib of Different Rat Cytochrome P450 Enzymes In Vivo and in an In Vitro Cocktail Method. Front. Pharmacol. 2021, 11, 593518. [Google Scholar] [CrossRef] [PubMed]
  31. Sane, R.S.; Ramsden, D.; Sabo, J.P.; Cooper, C.; Rowland, L.; Ting, N.; Whitcher-Johnstone, A.; Tweedie, D.J. Contribution of Major Metabolites toward Complex Drug-Drug Interactions of Deleobuvir: In Vitro Predictions and In Vivo Outcomes. Drug Metab. Dispos. 2016, 44, 466–475. [Google Scholar] [CrossRef]
  32. Wang, Y.; Wang, C.; Wang, S.; Zhou, Q.; Dai, D.; Shi, J.; Xu, X.; Luo, Q. Cytochrome P450-Based Drug-Drug Interactions of Vonoprazan In Vitro and In Vivo. Front. Pharmacol. 2020, 11, 53. [Google Scholar] [CrossRef] [PubMed]
  33. Hisaka, A.; Ohno, Y.; Yamamoto, T.; Suzuki, H. Prediction of pharmacokinetic drug–drug interaction caused by changes in cytochrome P450 activity using in vivo information. Pharmacol. Ther. 2010, 125, 230–248. [Google Scholar] [CrossRef]
  34. Zhang, Z.-Y.; Wong, Y. Enzyme Kinetics for Clinically Relevant CYP Inhibition. Curr. Drug Metab. 2005, 6, 241–257. [Google Scholar] [CrossRef] [PubMed]
  35. Kozakai, K.; Yamada, Y.; Oshikata, M.; Kawase, T.; Suzuki, E.; Haramaki, Y.; Taniguchi, H. Cocktail-substrate Approach-based High-throughput Assay for Evaluation of Direct and Time-dependent Inhibition of Multiple Cytochrome P450 Isoforms. Drug Metab. Pharmacokinet. 2014, 29, 198–207. [Google Scholar] [CrossRef] [PubMed]
  36. Miura, M.; Uchida, S.; Tanaka, S.; Kamiya, C.; Katayama, N.; Hakamata, A.; Odagiri, K.; Inui, N.; Kawakami, J.; Watanabe, H.; et al. Verification of a cocktail approach for quantitative drug–drug interaction assessment: A comparative analysis between the results of a single drug and a cocktail drug. Xenobiotica 2021, 51, 404–412. [Google Scholar] [CrossRef]
  37. Adiraju, S.K.S.; Shekar, K.; Fraser, J.F.; Smith, M.T.; Ghassabian, S. An improved LC–MS/MS method for simultaneous evaluation of CYP2C9, CYP2C19, CYP2D6 and CYP3A4 activity. Bioanalysis 2018, 10, 1577–1590. [Google Scholar] [CrossRef]
  38. Showande, S.J.; Fakeye, T.O.; Kajula, M.; Hokkanen, J.; Tolonen, A. Potential inhibition of major human cytochrome P450 isoenzymes by selected tropical medicinal herbs-Implication for herb-drug interactions. Food Sci. Nutr. 2019, 7, 44–55. [Google Scholar] [CrossRef] [PubMed]
  39. Fliszár-Nyúl, E.; Ungvári, O.; Dombi, Á.; Özvegy-Laczka, C.; Poór, M. Interactions of Mycotoxin Alternariol with Cytochrome P450 Enzymes and OATP Transporters. Metabolites 2022, 13, 45. [Google Scholar] [CrossRef] [PubMed]
  40. Kamble, S.H.; Sharma, A.; King, T.I.; Berthold, E.C.; León, F.; Meyer, P.K.L.; Kanumuri, S.R.R.; McMahon, L.R.; McCurdy, C.R.; Avery, B.A. Exploration of cytochrome P450 inhibition mediated drug-drug interaction potential of kratom alkaloids. Toxicol. Lett. 2020, 319, 148–154. [Google Scholar] [CrossRef]
  41. Amaeze, O.; Eng, H.; Horlbogen, L.; Varma, M.V.S.; Slitt, A. Cytochrome P450 Enzyme Inhibition and Herb-Drug Interaction Potential of Medicinal Plant Extracts Used for Management of Diabetes in Nigeria. Eur. J. Drug Metab. Pharmacokinet. 2021, 46, 437–450. [Google Scholar] [CrossRef]
  42. Or, P.M.; Lam, F.F.; Kwan, Y.; Cho, C.; Yu, H.; Lin, G.; Lau, C.B.; Fung, K.; Leung, P.; Yeung, J.H. Effects of Radix Astragali and Radix Rehmanniae, the components of an anti-diabetic foot ulcer herbal formula, on metabolism of model CYP1A2, CYP2C9, CYP2D6, CYP2E1 and CYP3A4 probe substrates in pooled human liver microsomes and specific CYP isoforms. Phytomedicine 2012, 19, 535–544. [Google Scholar] [CrossRef]
  43. Witt, L.; Suzuki, Y.; Hohmann, N.; Mikus, G.; Haefeli, W.E.; Burhenne, J. Ultrasensitive quantification of the CYP2E1 probe chlorzoxazone and its main metabolite 6-hydroxychlorzoxazone in human plasma using ultra performance liquid chromatography coupled to tandem mass spectrometry after chlorzoxazone microdosing. J. Chromatogr. B 2016, 1027, 207–213. [Google Scholar] [CrossRef] [PubMed]
  44. Wang, J.; Zhang, Z.-Y.; Lu, S.; Powers, D.; Kansra, V.; Wang, X. Effects of rolapitant administered orally on the pharmacokinetics of dextromethorphan (CYP2D6), tolbutamide (CYP2C9), omeprazole (CYP2C19), efavirenz (CYP2B6), and repaglinide (CYP2C8) in healthy subjects. Support. Care Cancer 2019, 27, 819–827. [Google Scholar] [CrossRef] [PubMed]
  45. Khayyat, M.H.; Mashhadian, N.V.; Eghbal, S.; Jalali, N. Inter-individual Variability of Coumarin 7-hydroxylation (CYP2A6 activity) in an Iranian Population. Iran J. Basic Med. Sci. 2013, 16, 610–614. [Google Scholar]
  46. Gao, N.; Qi, B.; Liu, F.-J.; Fang, Y.; Zhou, J.; Jia, L.-J.; Qiao, H.-L. Inhibition of Baicalin on Metabolism of Phenacetin, a Probe of CYP1A2, in Human Liver Microsomes and in Rats. PLoS ONE 2014, 9, e89752. [Google Scholar] [CrossRef]
  47. Nirogi, R.; Palacharla, R.C.; Mohammed, A.R.; Manoharan, A.; Ponnamaneni, R.K.; Bhyrapuneni, G. Evaluation of metabolism dependent inhibition of CYP2B6 mediated bupropion hydroxylation in human liver microsomes by monoamine oxidase inhibitors and prediction of potential as perpetrators of drug interaction. Chem. Biol. Interact. 2015, 230, 9–20. [Google Scholar] [CrossRef]
  48. Bogaards, J.J.P.; Bertrand, M.; Jackson, P.; Oudshoorn, M.J.; Weaver, R.J.; Van Bladeren, P.J.; Walther, B. Determining the best animal model for human cytochrome P450 activities: A comparison of mouse, rat, rabbit, dog, micropig, monkey and man. Xenobiotica 2000, 30, 1131–1152. [Google Scholar] [CrossRef]
  49. Polasek, T.M.; Miners, J.O. Quantitative prediction of macrolide drug-drug interaction potential from in vitro studies using testosterone as the human cytochrome P4503A substrate. Eur. J. Clin. Pharmacol. 2006, 62, 203–208. [Google Scholar] [CrossRef]
  50. Polasek, T.M.; Miners, J.O. Macrolide-theophylline interactions: No role for the inhibition of cytochrome P4501A2. Br. J. Clin. Pharmacol. 2008, 66, 898–900. [Google Scholar] [CrossRef]
  51. Ring, B.; Wrighton, S.A.; Mohutsky, M. Reversible Mechanisms of Enzyme Inhibition and Resulting Clinical Significance. Methods Mol. Biol. 2014, 1113, 37–56. [Google Scholar] [CrossRef]
  52. Carrão, D.B.; Habenchus, M.D.; de Albuquerque, N.C.P.; da Silva, R.M.; Lopes, N.P.; de Oliveira, A.R.M. In Vitro inhibition of human CYP2D6 by the chiral pesticide fipronil and its metabolite fipronil sulfone: Prediction of pesticide-drug interactions. Toxicol. Lett. 2019, 313, 196–204. [Google Scholar] [CrossRef]
  53. Shou, M.; Lin, Y.; Lu, P.; Tang, C.; Mei, Q.; Cui, D.; Tang, W.; Ngui, J.S.; Lin, C.C.; Singh, R.; et al. Enzyme Kinetics of Cytochrome P450-Mediated Reactions. Curr. Drug Metab. 2012, 2, 17–36. [Google Scholar] [CrossRef] [PubMed]
  54. Stresser, D.M.; Mao, J.; Kenny, J.R.; Jones, B.C.; Grime, K. Exploring concepts of in vitro time-dependent CYP inhibition assays. Expert Opin. Drug Metab. Toxicol. 2014, 10, 157–174. [Google Scholar] [CrossRef] [PubMed]
  55. Lou, D.; Bao, S.; Li, Y.; Lin, Q.; Yang, S.; He, J. Inhibitory Mechanisms of Myricetin on Human and Rat Liver Cytochrome P450 Enzymes. Eur. J. Drug Metab. Pharmacokinet. 2019, 44, 611–618. [Google Scholar] [CrossRef] [PubMed]
  56. McDonnell, A.M.; Dang, C.H. Basic Review of the Cytochrome P450 System. J. Adv. Pract. Oncol. 2013, 4, 263–268. [Google Scholar] [CrossRef] [PubMed]
  57. Leone, R.; Magro, L.; Moretti, U.; Cutroneo, P.; Moschini, M.; Motola, D.; Tuccori, M.; Conforti, A. Identifying Adverse Drug Reactions Associated with Drug-Drug Interactions. Drug Saf. 2010, 33, 667–675. [Google Scholar] [CrossRef]
  58. Wu, J.; Guan, X.; Dai, Z.; He, R.; Ding, X.; Yang, L.; Ge, G. Molecular probes for human cytochrome P450 enzymes: Recent progress and future perspectives. Coord. Chem. Rev. 2021, 427, 213600. [Google Scholar] [CrossRef]
  59. Mo, S.-L.; Liu, Y.-H.; Duan, W.; Wei, M.; Kanwar, J.; Zhou, S.-F. Substrate Specificity, Regulation, and Polymorphism of Human Cytochrome P450 2B6. Curr. Drug Metab. 2009, 10, 730–753. [Google Scholar] [CrossRef]
  60. Patki, K.C.; von Moltke, L.L.; Greenblatt, D.J. In Vitro Metabolism of Midazolam, Triazolam, Nifedipine, and Testosterone by Human Liver Microsomes and Recombinant Cytochromes P450: Role of CYP3A4 and CYP3A5. Drug Metab. Dispos. 2003, 31, 938–944. [Google Scholar] [CrossRef]
  61. VandenBrink, B.M.; Foti, R.S.; Rock, D.A.; Wienkers, L.C.; Wahlstrom, J.L. Prediction of CYP2D6 Drug Interactions from In Vitro Data: Evidence for Substrate-Dependent Inhibition. Drug Metab. Dispos. 2012, 40, 47–53. [Google Scholar] [CrossRef]
  62. Tang, L.; Ye, L.; Lv, C.; Zheng, Z.; Gong, Y.; Liu, Z. Involvement of CYP3A4/5 and CYP2D6 in the metabolism of aconitine using human liver microsomes and recombinant CYP450 enzymes. Toxicol. Lett. 2011, 202, 47–54. [Google Scholar] [CrossRef]
  63. Perloff, E.S.; Mason, A.K.; Dehal, S.S.; Blanchard, A.P.; Morgan, L.; Ho, T.; Dandeneau, A.; Crocker, R.M.; Chandler, C.M.; Boily, N.; et al. Validation of cytochrome P450 time-dependent inhibition assays: A two-time point IC50 shift approach facilitates kinact assay design. Xenobiotica 2009, 39, 99–112. [Google Scholar] [CrossRef] [PubMed]
  64. Berry, L.; Zhao, Z. An Examination of IC50 and IC50-Shift Experiments in Assessing Time-Dependent Inhibition of CYP3A4, CYP2D6 and CYP2C9 in Human Liver Microsomes. Drug Metab. Lett. 2008, 2, 51–59. [Google Scholar] [CrossRef]
  65. Berry, L.M.; Zhao, Z.; Lin, M.-H.J. Dynamic Modeling of Cytochrome P450 Inhibition In Vitro: Impact of Inhibitor Depletion on IC50 Shift. Drug Metab. Dispos. 2013, 41, 1433–1441. [Google Scholar] [CrossRef] [PubMed]
  66. Lu, T.; Su, L.; Ji, D.; Gu, W.; Mao, C. Interaction between CYP450 enzymes and metabolism of traditional Chinese medicine as well as enzyme activity assay. Zhongguo Zhong Yao Za Zhi 2015, 40, 3524–3529. [Google Scholar] [PubMed]
  67. Periti, P.; Mazzei, T.; Mini, E.; Novelli, A. Pharmacokinetic Drug Interactions of Macrolides. Clin. Pharmacokinet. 1992, 23, 106–131. [Google Scholar] [CrossRef]
  68. Pessayre, D.; Larrey, D.; Funck-Brentano, C.; Benhamou, J.P. Drug interactions and hepatitis produced by some macrolide antibiotics. J. Antimicrob. Chemother. 1985, 16 (Suppl. A), 181–194. [Google Scholar] [CrossRef]
  69. Golikova, M.V.; Strukova, E.N.; Portnoy, Y.A.; Dovzhenko, S.A.; Kobrin, M.B.; Zinner, S.H.; Firsov, A.A. Resistance studies with Streptococcus pneumoniae using an in vitro dynamic model: Amoxicillin versus azithromycin at clinical exposures. J. Chemother. 2019, 31, 252–260. [Google Scholar] [CrossRef]
  70. Obach, R.S.; Walsky, R.L.; Venkatakrishnan, K.; Gaman, E.A.; Houston, J.B.; Tremaine, L.M. The Utility of in Vitro Cytochrome P450 Inhibition Data in the Prediction of Drug-Drug Interactions. J. Pharmacol. Exp. Ther. 2006, 316, 336–348. [Google Scholar] [CrossRef]
  71. Kapelyukh, Y.; Wolf, R. CYP2D6 substrates and drug metabolism. In CYP2D6: Genetics, Pharmacology and Clinical Relevance; Future Medicine Ltd.: London, UK, 2014; pp. 80–100. [Google Scholar] [CrossRef]
  72. de Groot, M.J.; Wakenhut, F.; Whitlock, G.; Hyland, R. Understanding CYP2D6 interactions. Drug Discov. Today 2009, 14, 964–972. [Google Scholar] [CrossRef]
  73. Qiu, F.; Zhang, R.; Sun, J.; A, J.; Hao, H.; Peng, Y.; Ai, H.; Wang, G. Inhibitory Effects of Seven Components of Danshen Extract on Catalytic Activity of Cytochrome P450 Enzyme in Human Liver Microsomes. Drug Metab. Dispos. 2008, 36, 1308–1314. [Google Scholar] [CrossRef]
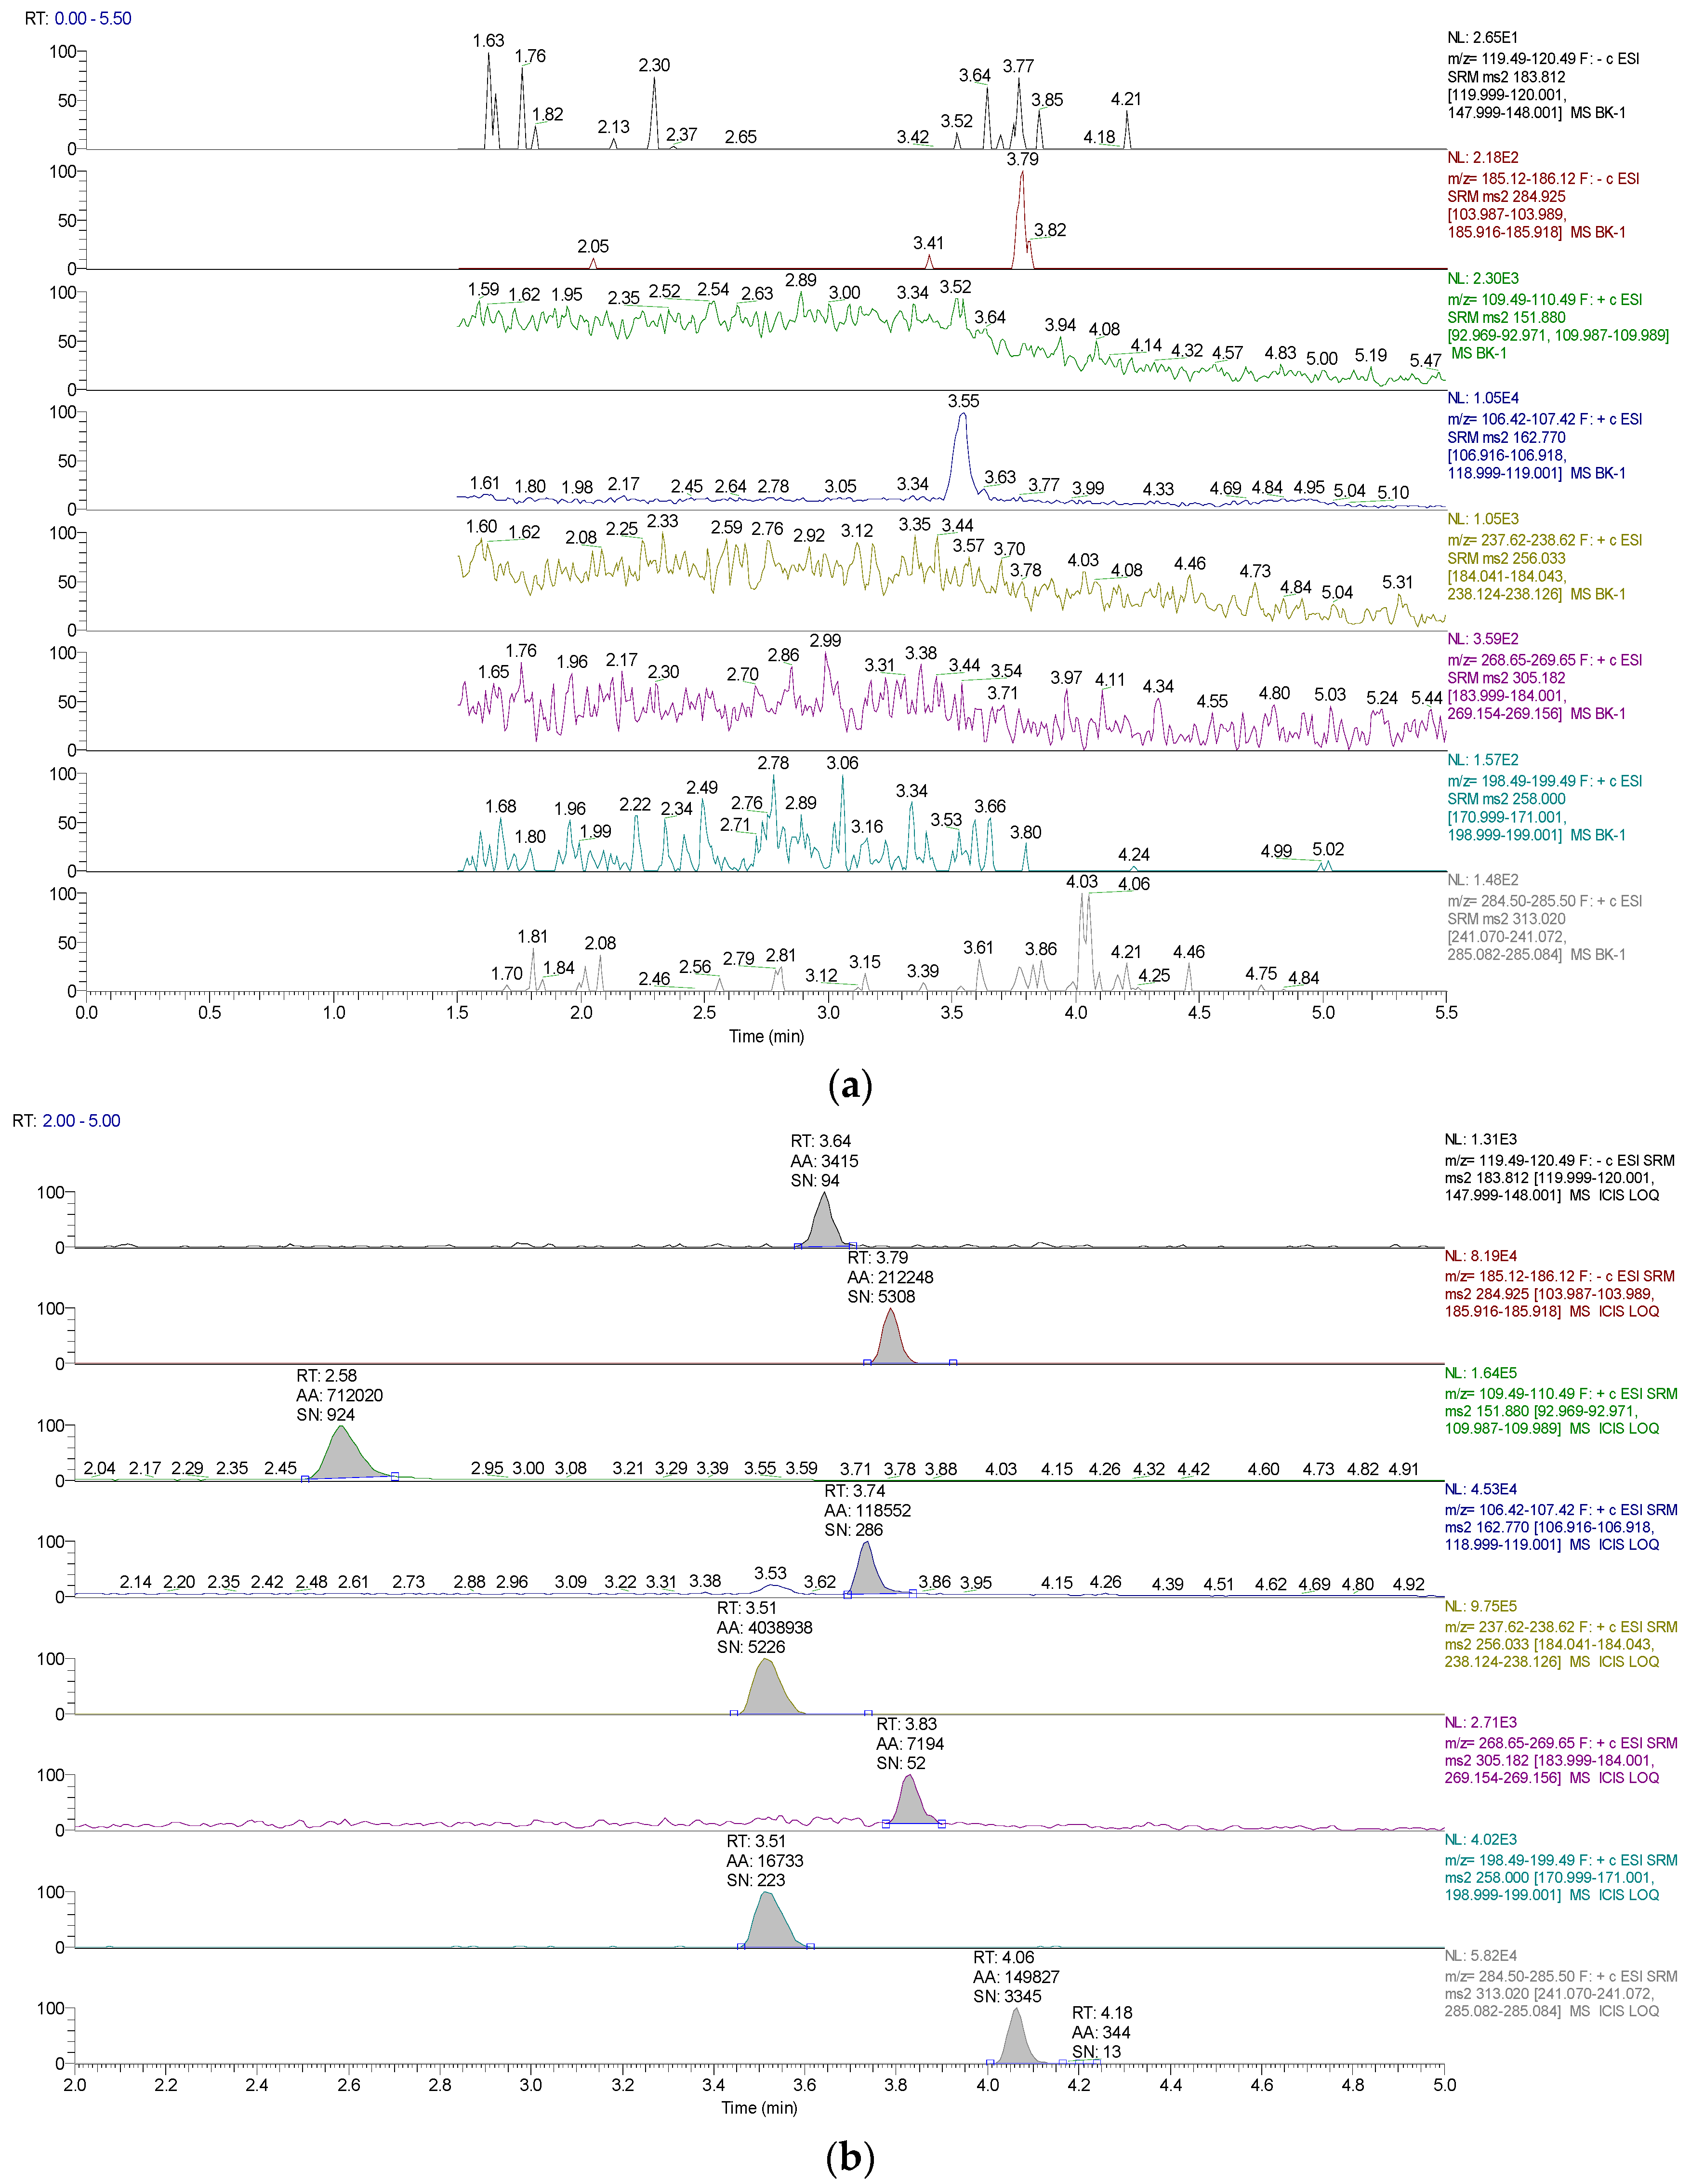
Figure 1. Typical chromatograms of blank (a) and spiked metabolites of probe substrates of CYP450 enzymes (b) in dog liver microsomes.
Molecules 28 07193 g001
Figure 2. Enzymatic kinetics of phenacetin (PH) for CYP1A2, coumarin (CAN) for CYP2A6, bupropion (BP) for CYP2B6, tolbutamide (TBD) for CYP2C9, dextromethorphan (DEX) for CYP2D6, chlorzoxazone (CLN) for CYP2E1, and testosterone (TS) for CYP3A4 in dog liver microsomes. Data are presented as mean ± standard deviation (SD) (n = 3).
Molecules 28 07193 g002aMolecules 28 07193 g002b
Figure 3. Inhibition curves of lekethromycin for canine CYP450 activities using probe substrates in dog liver microsomes, phenacetin-O-deethylation for CYP1A2, 5-hydroxylation coumarin for CYP2A6, 1-hydroxylation bupropion for CYP2B6, 4-hydroxylation tolbutamide for CYP2C9, dextromethorphan O-demethylation for CYP2D6, 1-hydroxylation chlorzoxazone for CYP2E1, and 6β-hydroxylation testosterone for CYP3A4. The data are plotted as the mean ± standard deviation (SD) (n = 3).
Molecules 28 07193 g003aMolecules 28 07193 g003b
Figure 4. Primary Lineweaver−Burk plot, the secondary plot for Ki and αKi in dog liver mi-crosomes, Lineweaver−Burk plot for CYP2A6 (A), Slop plot for CYP2A6 (B), intercept plot for CYP2A6 (C), Lineweaver−Burk plot for CYP2B6 (D), Slop plot for CYP2B6 (E), intercept plot for CYP2B6 (F), Lineweaver−Burk plot for CYP2D6 (G), Slop plot for CYP2D6 (H), intercept plot for CYP2D6 (I). Each point is represented as mean ± standard deviation (SD) (n = 2).
Molecules 28 07193 g004aMolecules 28 07193 g004b
Figure 5. The IC50 shift curve of lekethromycin in dog liver microsomes, 5-hydroxylation coumarin for CYP2A6 (A), 1-hydroxylation bupropion for CYP2B6 (B), dextromethorphan O-demethylation for CYP2D6 (C). Each point represents the mean ± standard deviation (SD) (n = 3).
Molecules 28 07193 g005
Figure 6. The contribution of dog CYP450 to the metabolism of lekethromycin. Each point represents the mean ± standard deviation (SD) (n = 3).
Molecules 28 07193 g006
Table 1. The accuracy and precision of specific metabolites of CYP450 in dog liver microsomes.
AnalyteConcentration
(ng/mL)
Recovery
(%)
Intra-Day
RSD (%)
Inter-Day
RSD (%)
ACE10104.80 ± 6.366.075.73
50101.66 ± 2.001.964.19
200101.92 ± 1.441.412.69
HCAN1099.86 ± 8.068.077.29
5099.39 ± 7.047.097.24
20099.90 ± 6.476.484.93
HBP10104.86 ± 8.558.167.84
50103.64 ± 3.433.315.56
200101.29 ± 3.183.143.82
HTBD10105.04 ± 11.7211.1510.04
50102.01 ± 9.839.648.48
20095.53 ± 1.301.362.04
HDEX10109.42 ± 1.812.1410.84
50106.93 ± 4.051.686.67
20097.79 ± 3.713.796.34
HCLN1097.35 ± 8.658.889.31
50101.99 ± 11.4111.189.81
20097.63 ± 1.481.527.14
HTS1095.63 ± 6.897.209.08
5097.40 ± 1.761.804.59
200101.89 ± 2.452.403.96
RSD: relative standard deviation; acetaminophen (ACE); 7-OH-coumarine (HCAN); OH-bupropion (HBP); 4-OH-tolbutamide (HTBD); dextrorphan (HDEX); 6-OH-chlorzoxazone (HCLN); 6β-OH-testosterone (HTS).
Table 2. CYP450 isoforms, reactions, incubation conditions, and inhibition parameters in dog liver microsomes (n = 3).
IsoformsReactionsTime
(min)
Protein Concentration
(mg/mL)
Km
(μM)
Vmax
(nmol/min/mg protein)
IC50
(μM)
CYP1A2Phenacetin-
O-deethylation
150.25.390.22>200
CYP2A6Coumarin
5-hydroxylation
150.20.410.03462.53
CYP2B6Bupropion
1-hydroxylation
150.29.151.4383.29
CYP2C9Tolbutamide 4-hydroxylation150.210.7617.78>200
CYP2D6Dextromethorphan O-demethylation150.26.336.1639.66
CYP2E1Chlorzoxazone 1-hydroxylation150.217.425.4>200
CYP3A4Testosterone 6β-hydroxylation150.285.211.49>200
Vmax: maximum rate of an enzyme-catalyzed reaction; Km: Michaelis–Menten constant; IC50: half-maximal inhibitory concentration.
Table 3. The IC50 fold-shift and inhibition parameters in CYP450 enzymes in dog liver microsomes.
CYP450 IsoformShift Ratio
(−NADPH/+NADPH)
Ki (μM)αKi (μM)
CYP2A61.29135.6227.6
CYP2D61.1064.87279.6
CYP2B60.8859.4412.07
Ki: inhibition constant; αKi: alpha inhibition constant.
Table 4. List of specific CYP450 probe substrates, metabolites, and inhibitors.
CYP450 IsoformSubstratesMetabolitesInhibitors
CYP1A2PHACEα-Naphthoflavone
CYP2A6CANHCANPilocarpine
CYP2B6BPHBPThio-TEPA
CYP2C9TBDHTBDSulfaphenazole
CYP2D6DEXHDEXQuinidine
CYP2E1CLNHCLNSodium diethyldithiocarbamate
CYP3A4TSHTSKetoconazole
Phenacetin (PH); coumarin (CAN); bupropion (BP); Tolbutamide (TBD); dextromethorphan (DEX); chlorzoxazone (CLN); and testosterone (TS). Acetaminophen (ACE); 7-OH-coumarine (HCAN); OH-bupropion (HBP); 4-OH-tolbutamide (HTBD); dextrorphan (HDEX); 6-OH-chlorzoxazone (HCLN); and 6β-OH-testosterone (HTS).
Table 5. Mass spectrometry parameters for all analytes.
SubstratesQuantitative Ion Collision Energy (eV)Ion Source
PH180 > 11020ESI+
CAN147 > 11019ESI+
BP240 > 18418ESI+
TBD271 > 9131ESI+
DEX272 > 21523.5ESI+
CLN168 > 13220ESI−
TS289 > 9722ESI+
ACE152 > 11016ESI+
HCAN163 > 11934ESI+
HBP256 > 18415ESI+
HTBD285 > 18617ESI−
HDEX258 > 17130ESI+
HCLN184 > 12015ESI−
HTS305 > 18410ESI+
Phenacetin (PH); coumarin (CAN); bupropion (BP); Tolbutamide (TBD); dextromethorphan (DEX); chlorzoxazone (CLN); and testosterone (TS). Acetaminophen (ACE); 7-OH-coumarine (HCAN); OH-bupropion (HBP); 4-OH-tolbutamide (HTBD); dextrorphan (HDEX); 6-OH-chlorzoxazone (HCLN); and 6β-OH-testosterone (HTS).
Disclaimer/Publisher’s Note: The statements, opinions and data contained in all publications are solely those of the individual author(s) and contributor(s) and not of MDPI and/or the editor(s). MDPI and/or the editor(s) disclaim responsibility for any injury to people or property resulting from any ideas, methods, instructions or products referred to in the content.