1. Introduction
The increasing global interest in high-performance energy storage devices has spurred the exploration of various electrochemical storage solutions, including electrostatic, redox, and hybrid storage systems. Among these, electrostatic energy storage devices, commonly known as ultracapacitors (or supercapacitors), stand out as the most environmentally friendly option with the longest cycle life. These devices comprise large-surface carbon electrodes that can endure thousands of charge and discharge cycles. Their exceptionally low internal resistance contributes to their outstanding power characteristics, giving them a significant advantage over redox storage devices like secondary batteries. However, a major challenge faced by ultracapacitor developers is the relatively low energy density, which remains over 20 times lower than that of advanced lithium batteries.
The energy storage mechanism in ultracapacitors involves ion electrosorption on the surface of porous carbon electrodes. In general, a fundamental principle dictates that the larger the surface area accessible to the electrolyte, the greater the device’s capacity [
1]. Nanoporous carbon stands out as the most appealing electrode material, primarily due to its high surface-area-to-volume ratio. The impact of pore sizes on the capacitance of carbon materials has garnered significant attention. Research has established that a higher capacitance results from optimal matching between electrolyte ions and carbon pore sizes [
1,
2,
3,
4]. Carbide-derived carbon (CDC), a well-recognized representative of nanoporous carbons, has consistently demonstrated its suitability for ultracapacitor applications [
5,
6]. The structure and porosity of CDC can be meticulously controlled by adjusting the structure and composition of the precursor carbide and the synthesis conditions [
2]. Moreover, the textural properties of CDC can be finely adjusted during post-treatment using either chemical methods [
7,
8,
9] or physical activation techniques [
10,
11,
12,
13].
In accordance with the general definition of capacitance, a larger specific surface area corresponds to a higher capacitance. However, it is crucial to consider that this relationship is typically non-linear for materials with larger specific surface areas [
14,
15]. Therefore, it is essential to account for the pore sizes of the material as well [
2,
3,
16,
17]. In recent years, several studies [
2,
3,
18,
19] have introduced combined models for micro- and mesoporous carbon materials to illustrate the relationship between capacitance and pore size. These studies have demonstrated that both gravimetric [
2,
18] and volumetric [
2,
3] capacitance can be effectively simulated using data obtained from CO
2 and N
2 adsorption experiments.
The primary requirements for ultracapacitor electrolytes include high ionic conductivity, chemical and electrochemical stability, a wide operating temperature range, low resistance, and environmental compatibility [
20]. Liquid electrolytes can be broadly categorized into non-aqueous, aqueous, and ionic liquid electrolytes [
20,
21].
Finding an electrolyte that fulfills all requirements can be quite challenging. Aqueous electrolytes offer high conductivity and capacitance but suffer from low energy density due to a narrow applicable voltage window (approximately 1 V). In contrast, organic (non-aqueous) electrolytes and ionic liquids (ILs) can operate at higher voltages but generally exhibit lower ionic conductivity [
20,
22]. One drawback of organic electrolytes is the larger size of their ions, which increases the specific resistance compared to water-based electrolytes and necessitates electrodes with larger pore sizes, thus reducing the electrode density [
22]. Nevertheless, owing to their broader applicable voltage window (2.6–2.9 V), organic electrolytes, primarily based on quaternary ammonium salts in propylene carbonate (PC) or acetonitrile (ACN), currently dominate the field of commercial storage devices [
1,
22,
23].
Ionic liquids, which consist of asymmetric organic cations and anions, offer several advantages over organic electrolytes. They exhibit high chemical, thermal, and electrochemical stability, are non-flammable, and permit the use of a higher electrochemical stability window (ESW), typically exceeding 3 V. In accordance with the characteristics commonly observed in organic electrolytes, it is noteworthy that the reduction in ionic size within ionic liquids (ILs) corresponds to decreased electrical resistance and an increase in specific capacitance. This principle has been explored in previous studies, such as those referenced in [
24,
25], in which the influence of cation size in IL electrolytes was investigated, and in [
26], which delves into the electrochemical performance of various anions. Furthermore, an investigation was conducted employing three distinct ionic liquids (EMIm-TFSI, EMIm-BF
4, and BMIm-PF
6) in conjunction with porous carbon electrodes characterized by an average pore size of approximately 1.2 nm. This study revealed that smaller ions are more involved in the charging mechanism near the potential of zero charge (pzc), whereas at higher potential values, the mechanism shifts toward preferred counterion adsorption [
27].
A notable drawback of IL-based electrolytes is their high viscosity, especially at lower temperatures [
1,
20,
23,
28,
29]. In order to address the viscosity challenge, ionic liquids can be blended with low-viscosity organic solvents like PC or ACN [
30]. Using a mixture of 1-ethyl-3-methylimidazolium bis(trifluoromethylsulfonyl)imide (EMIm-TFSI) and ACN, mesopores were shown to facilitate fast ion transport in carbon electrodes, achieving a specific capacitance of up to 130 F g
−1 [
31].
Largeot et al. investigated the relationship between carbon pore size and ion size while employing EMIm-TFSI as an electrolyte. In this context, EMIm
+ and TFSI
− ions are roughly comparable in size (0.7 and 0.79 nm in their longest dimensions). Their study revealed that the maximum capacitance of 160 F g
−1 (calculated from a galvanostatic experiment conducted at 5 mA cm
−2 in a neat EMIm-TFSI electrolyte at 60 °C using a voltage window of 0–3 V) was attained with carbon possessing an average pore width of 0.72 nm. This dimension closely matches the size of the EMIm
+ and TFSI
− ions, resulting in optimal ion adsorption efficiency [
4]. A separate study [
32], employing TiC-derived CDC as the electrode and a 2 M EMIm-TFSI/ACN mixture as the electrolyte in a three-electrode configuration, also concluded that the maximum capacitance is achieved when the pore size of the carbon closely aligns with the ion size. In smaller nanopores, ion adsorption, especially of larger TFSI anions, was diffusion-controlled due to hindered accessibility caused by size effects. A similar observation was reported regarding ion sizes and sub-nanopore matching for EMIm-TFSI and EMIm-BF
4, where secondary carbon nanopores of 0.50 nm were exclusively accessible to small BF
4− anions (0.48 nm) but not to larger TFSI
− ions (0.79 nm) [
33].
The interaction between ionic liquid structures and various carbon materials and their consequential effects have been the subject of prior investigations [
34]. These studies emphasized that the selection of a carbon electrode should not solely be based on pore size and surface area; it should also consider the interaction between the surface chemistry of the electrode and the electrolyte. While materials with high specific surface areas, such as mesoporous and activated carbon, exhibited respectable specific capacitance and energy density, materials resembling graphene and carbon nanotubes with open surfaces demonstrated superior power density.
Härmas et al. have reported that ultramicroporous materials are unsuitable for high-power and high-energy-density supercapacitors due to the slow establishment of adsorption equilibrium in viscous ionic liquids [
35]. However, when the viscosity of the ionic liquid is reduced by introducing an additional solvent like ACN, ultramicroporous materials become exceedingly attractive due to the increased density at the corresponding electrodes, resulting in enhanced volumetric energy and power density [
36].
Previously, the interconnectedness of porosity parameters in carbon materials and their utility in quantitatively predicting EDLC across various organic electrolytes were demonstrated [
2,
3]. In the present study, a preliminary investigation of three CDC materials, originating from TiC, NbC, and Mo
2C, characterized by unimodal, bimodal, and trimodal pore size distributions, respectively, is undertaken. This investigation encompasses energy storage within both undiluted and diluted ILs. The primary objective is to assess whether the energy storage properties of ultramicroporous carbon materials, akin to the majority of CDCs, are enhanced in IL environments due to the presence of larger transport pores within the carbon material structure.
2. Results and Discussion
The three carbon materials (CDCs) with variable pore size distributions used in this study were made by the chlorination of different metal carbides: TiC at a temperature of 500 °C [
10], Mo
2C at a temperature of 800 °C [
37], and NbC at a temperature of 1000 °C [
2]. The CDCs are distinguished as CDC-TiC, CDC-NbC, and CDC-Mo
2C, respectively.
As previously shown [
2,
38], the structural order and porosity of CDCs are related to the structure of the precursor carbide and the temperature of chlorination; the higher the temperature, the higher the degree of graphitization and the larger the average pore size. The microstructure has also been studied in CDCs derived from TiC [
10,
39], NbC [
39], and Mo
2C [
37,
40]. In
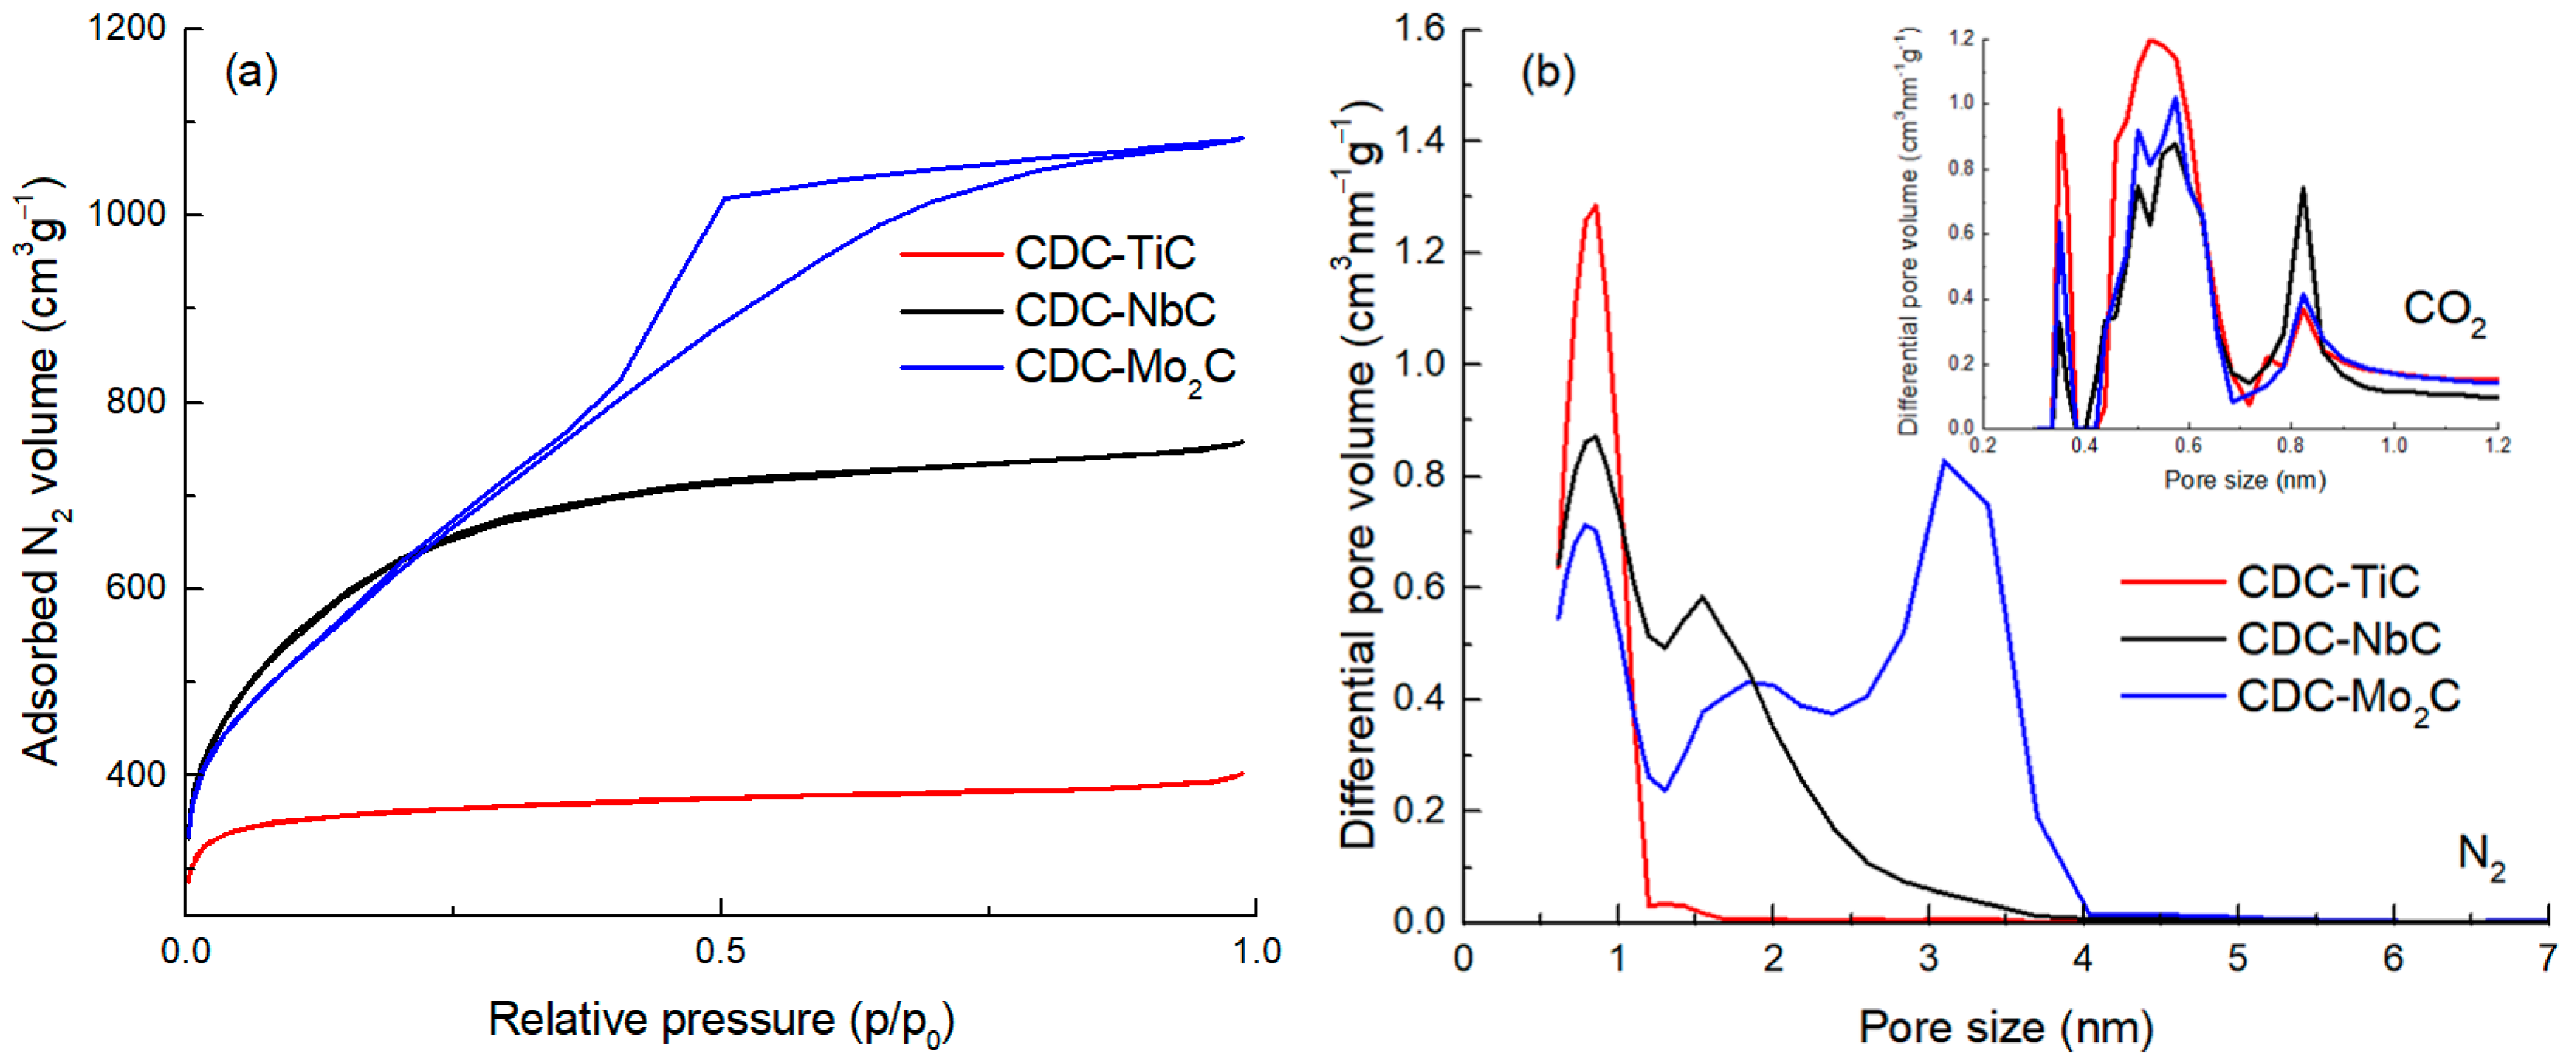
Figure 1a, one can observe that the N
2 adsorption isotherm for CDC-TiC corresponds to Type I (a) by IUPAC [
41], characteristic of microporous materials with a narrow pore size distribution. The CDC-NbC exhibits a Type I (b) isotherm, which shows a broader pore size distribution in the micropore region. The CDC synthesized from Mo
2C (i.e., CDC-Mo
2C) corresponds to Type IV (a), with a noticeable hysteresis loop indicating the presence of mesopores.
The pore size distributions (PSDs) were calculated from the N
2 isotherms and are presented in
Figure 1b. The PSD of all three CDCs contains a peak with pore sizes around 0.8 nm. CDC-NbC contains additional pores at 1.6 nm. CDC-Mo
2C represents micromesoporous carbon, whose PSD contains, in addition to micropores at 0.8 and 1.9 nm, a considerable amount of mesopores at 3 nm.
The texture characteristics of the CDCs are collected in
Table 1. Mo
2C-CDC reveals the largest specific surface area as well as total porosity (2204 m
2g
−1 and 1.67 cm
3g
−1, respectively), whereas CDC-NbC has the most significant amount of micropores (0.90 cm
3g
−1). Among all three CDCs, CDC-TiC has a majority of pores smaller than 1 nm. Also, the PSD calculated from CO
2 adsorption (inset on
Figure 1b) confirms that the carbon made of TiC has the highest proportion of sub-nanometer-sized pores.
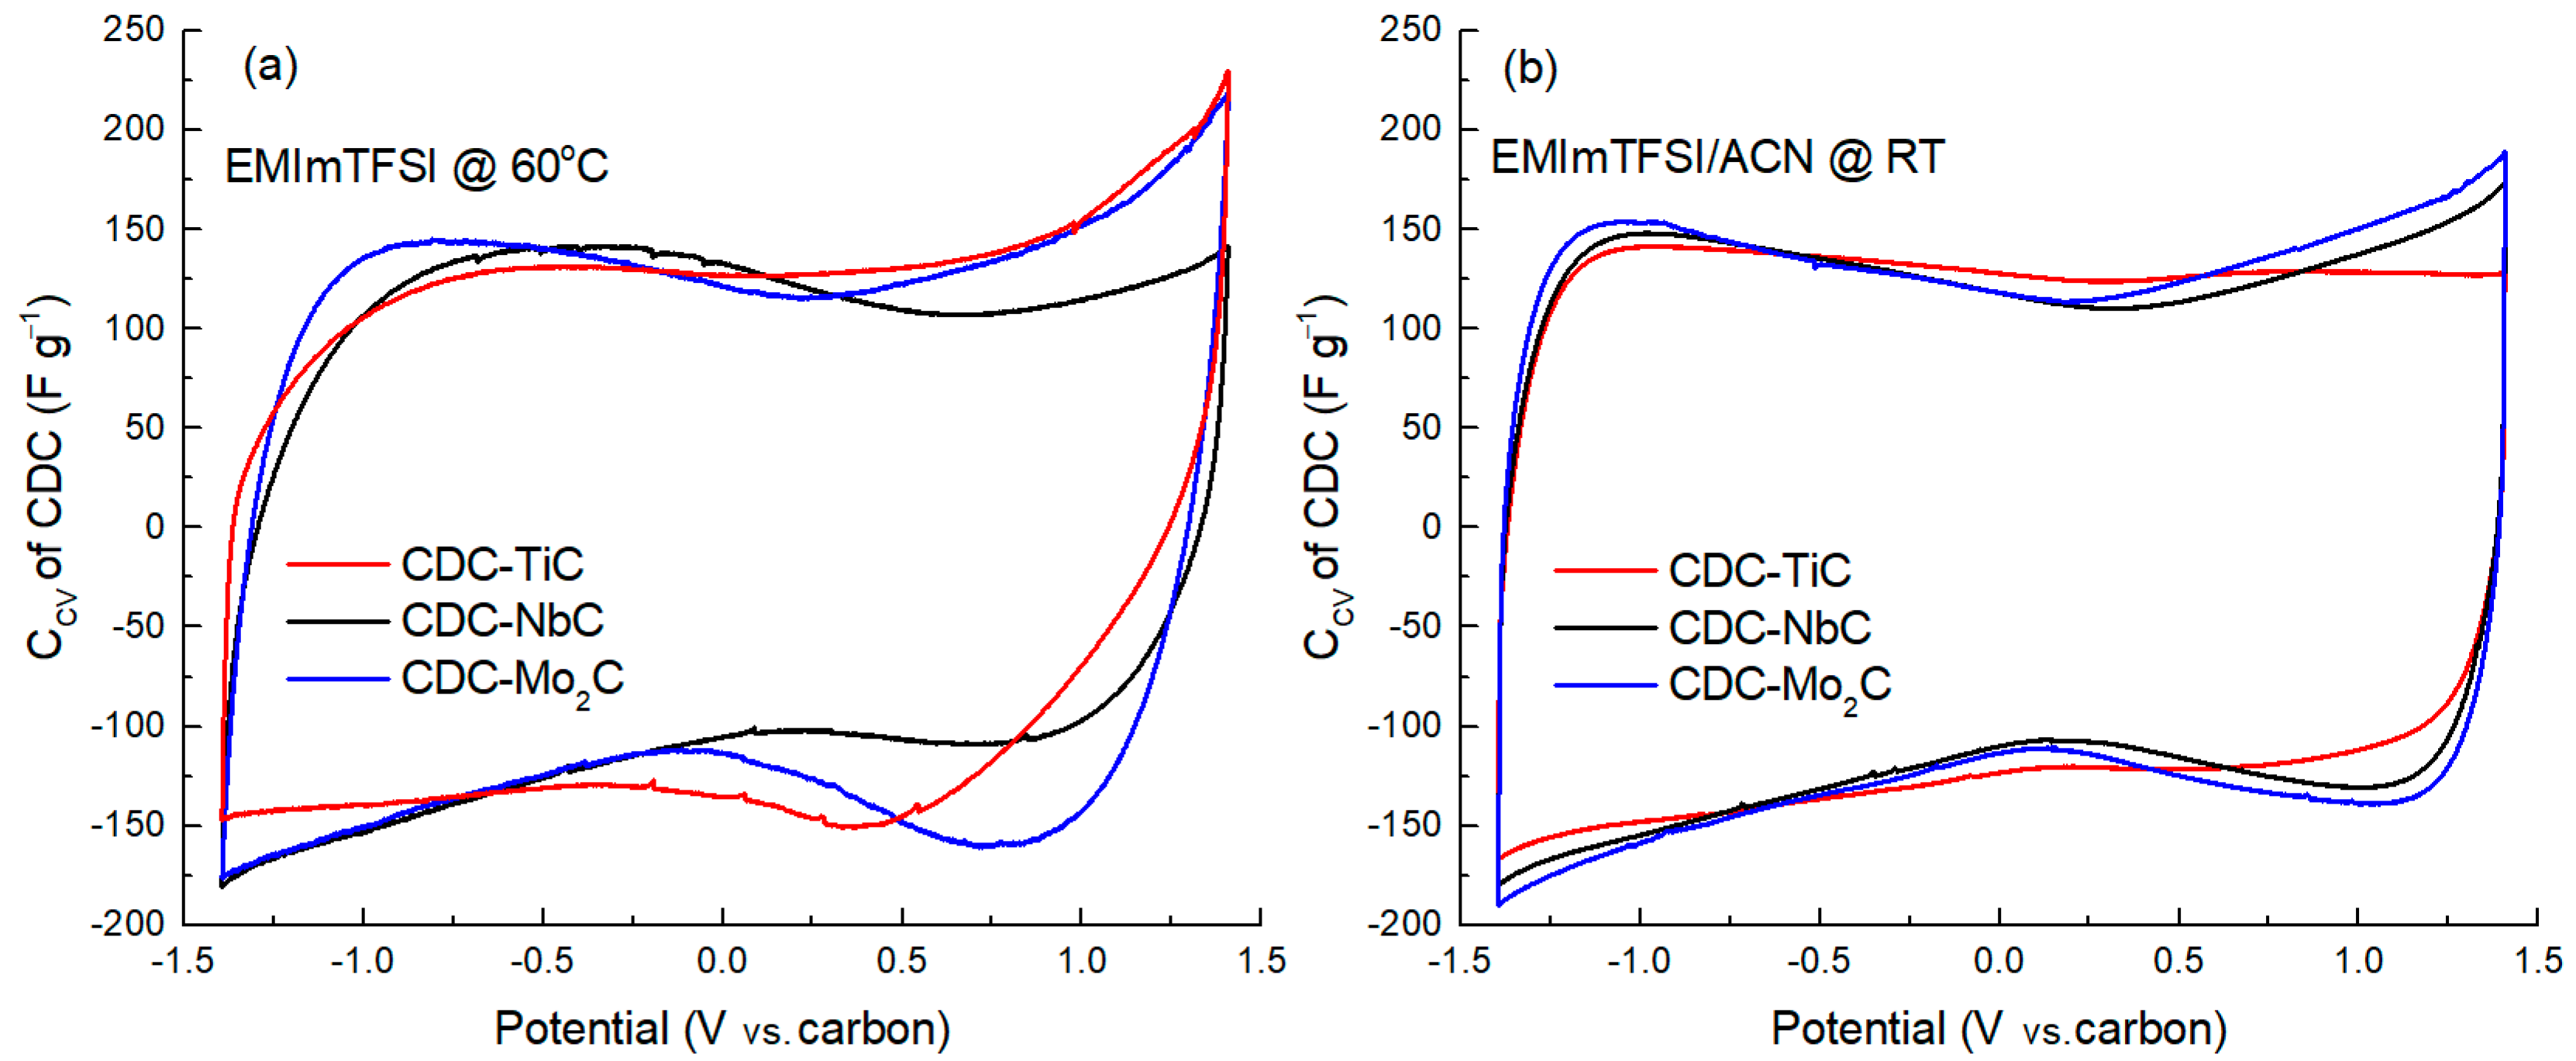
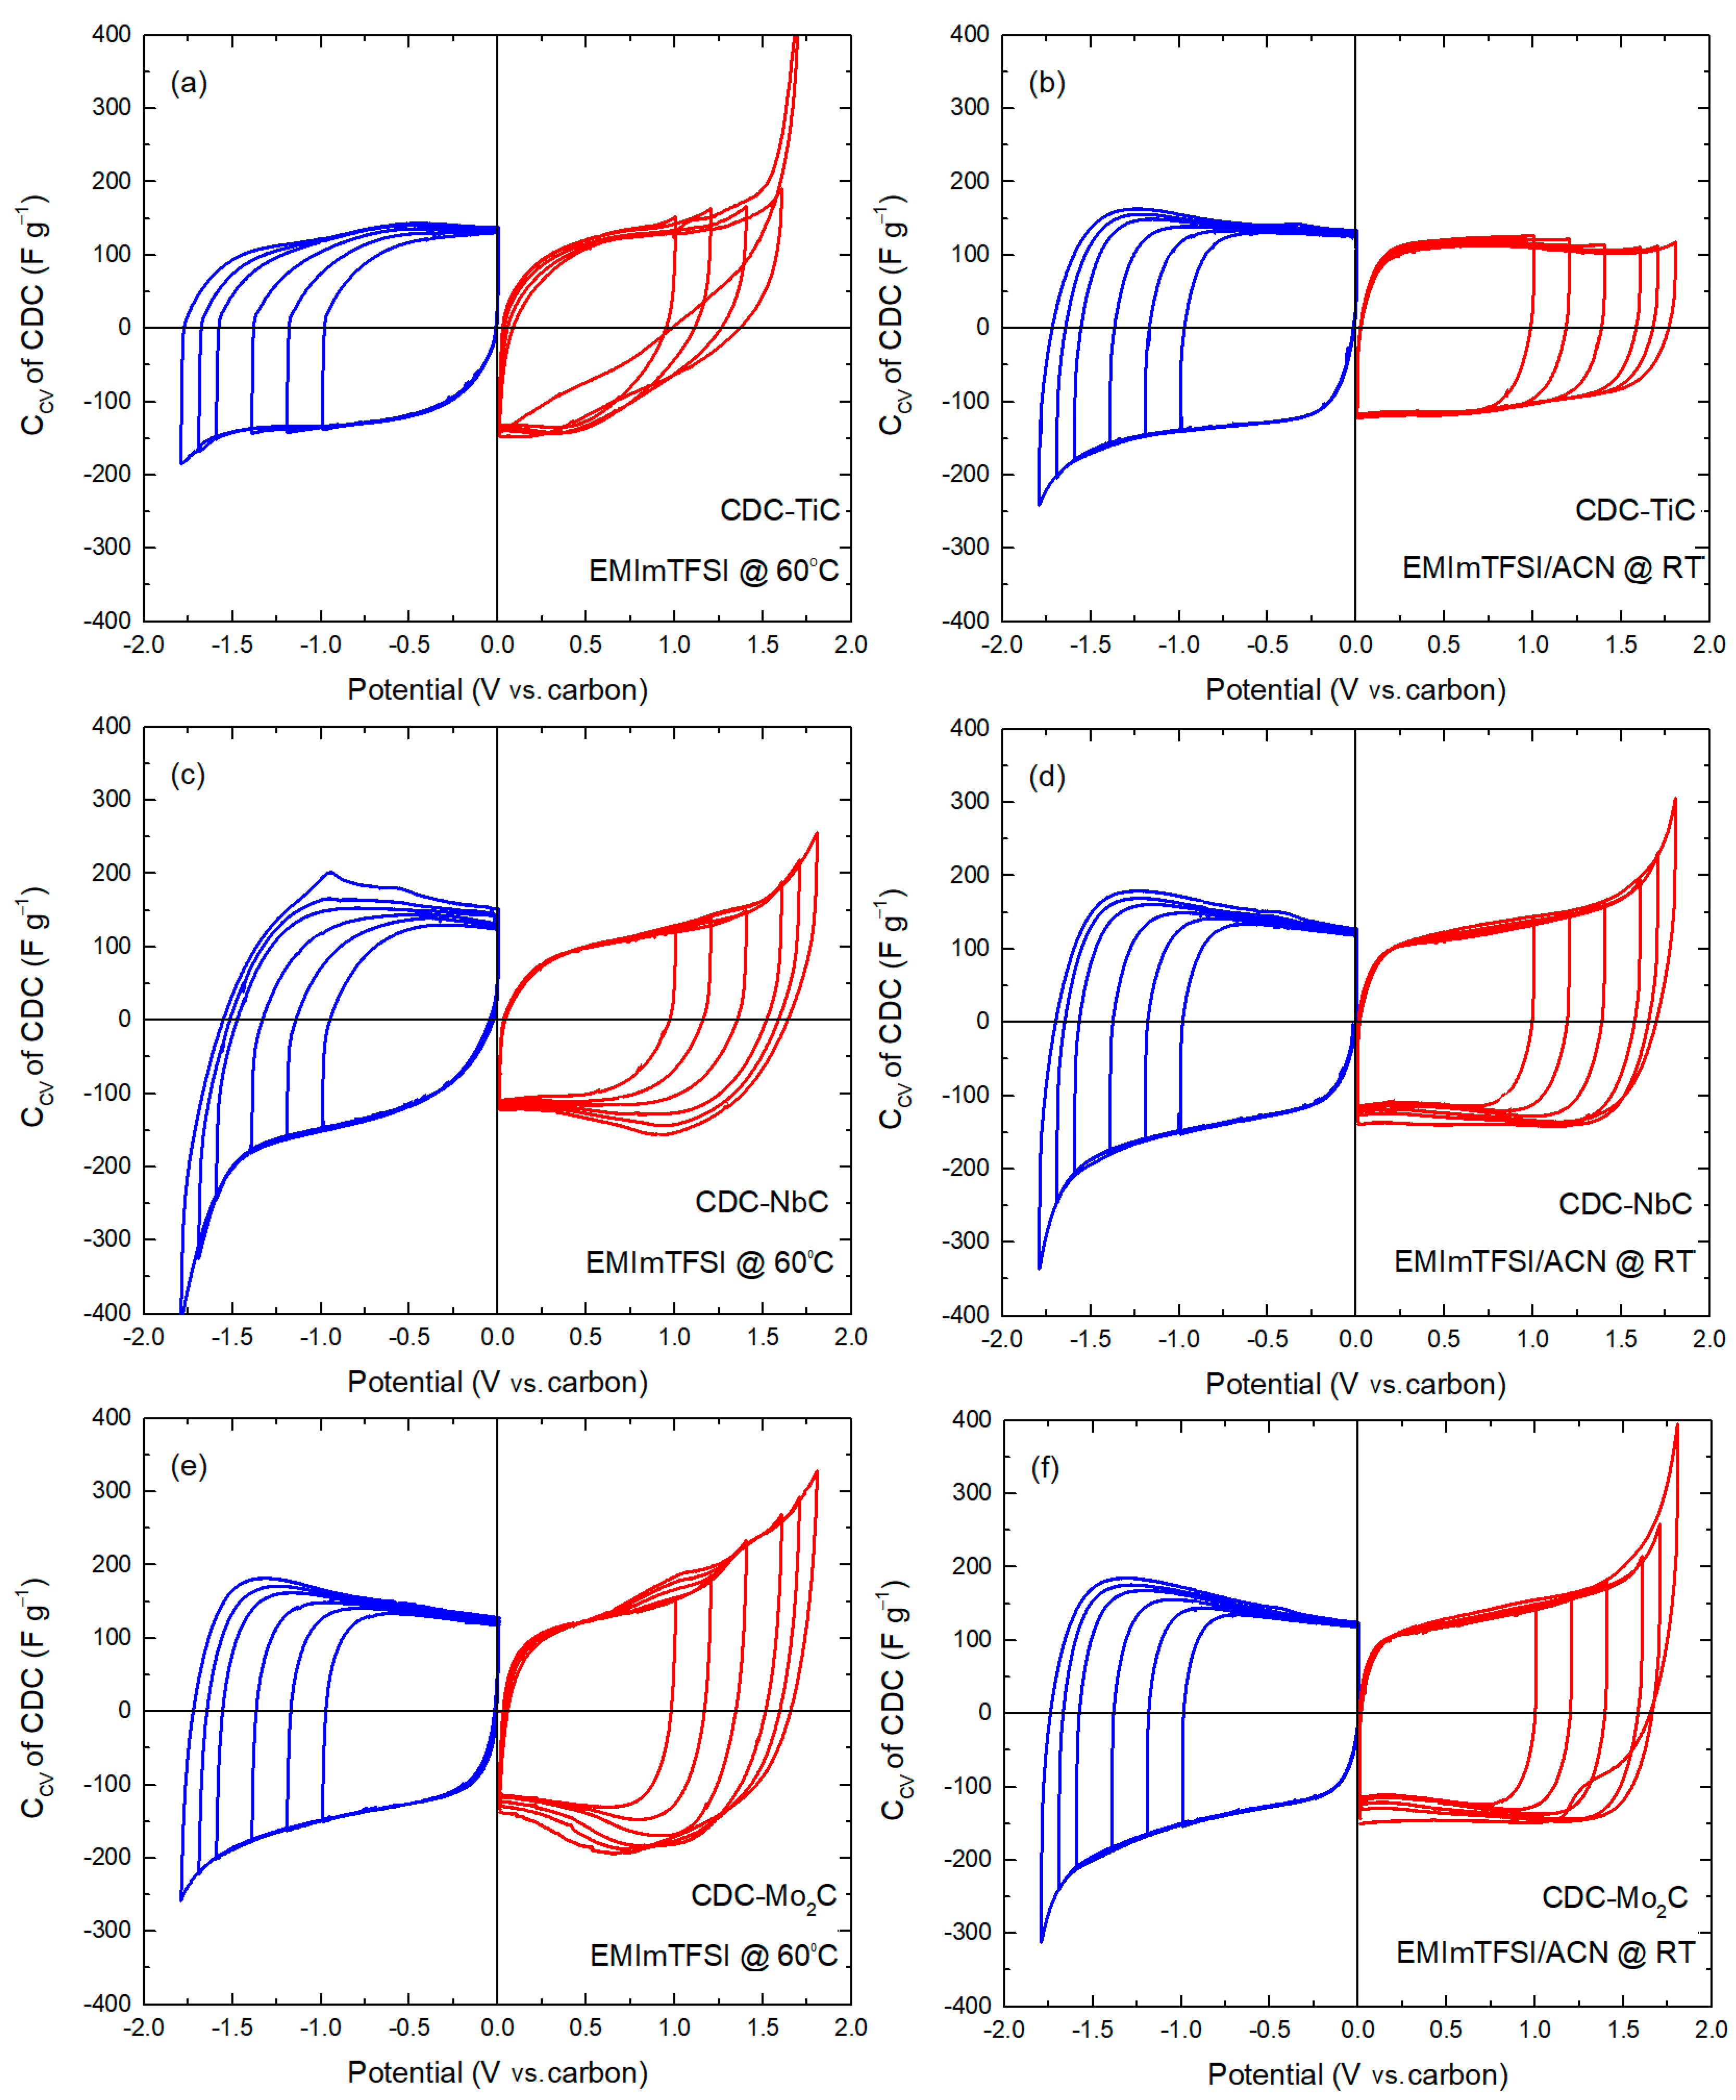
An electrochemical evaluation of the CDC electrodes was performed in a three-electrode test cell using the neat ionic liquid EMIm-TFSI as the electrolyte at 60 °C and a 1.9 M EMIm-TFSI/ACN mixture at room temperature. A cyclic voltammetry (CV) study was performed over a potential range of −1.4 V to +1.4 V vs. a carbon electrode.
Figure 2 presents the cyclic voltammetry curves of the CDC materials measured at a voltage scan rate of 1 mV s
−1 in a potential window of −1.4 V to +1.4 V. A visual examination of these graphs (
Figure 2a,b) reveals a characteristic flat minimum in the central region of the curve, near 0 V, corresponding to the zero-charge potential of carbon. This is caused by the fact that, as the electrode potential increases, the number of electrosorbed ions on the surface increases too, which leads to an increase in the density of the electric charge on the electrode surface, resulting in an increase in the capacitance of the electric double layer. This minimum is located somewhat differently on various CDC materials, with the flatness of the minimum increasing as the carbon material becomes more microporous. For example, in the case of CDC-TiC in the EMIm-TFSI/ACN electrolyte, no zero-charge minimum is observed at all. The flatness of this minimum is influenced by the electrolyte viscosity, ion dimensions, and the micromesoporous nature of the carbon (cf.
Table 1).
In addition to the minimum, the curves can be characterized by the current response upon potential reversal, specifically the “backswing.” For example, it is evident that after the potential reversal (after +1.4 V or −1.4 V) in the neat EMIm-TFSI (
Figure 2a), the curves exhibit a flatter curvature compared to dilute electrolyte solutions (
Figure 2b). This is again due to the significantly higher viscosity of the neat ionic liquid. Additionally, there is an observable dependence of the slope on the carbon material, where a smaller average pore size (1.23 nm) of CDC-NbC compared to 1.74 nm of CDC-Mo
2C leads to a shallower slope. For instance, a distinctive change in the slope (after potential reversal at +1.4 V) is observed in cells with the neat IL electrolyte, where the slope increases in the sequence CDC-TiC, CDC-NbC, and CDC-Mo
2C. However, in the cathodic (negative potential) region, CDC-TiC stands out due to its very high impedance at negative potentials, which is “amplified” by the high viscosity of the IL and its low conductivity. Therefore, a change in potential causes a sharp current drop to 0 and distorts the CV curve shape. In dilute electrolytes, the slope after potential reversal is steeper, primarily due to the lower electrolyte viscosity and higher conductivity mentioned earlier.
In the mixed IL/ACN electrolyte, when comparing the CV curves of CDC-NbC and CDC-Mo
2C (
Figure 2b), they are quite similar, with CDC-TiC, the most microporous, showing some differences. This may be attributed to the ion solvation effects and slightly larger ion dimensions in the EMIm-TFSI/ACN electrolyte compared to the neat IL. Furthermore, the lower anodic capacitance of the CDC-TiC material supports this hypothesis, influenced by the larger dimensions of TFSI
− anions compared to EMIm
+ cations (0.6 × 0.9 nm vs. 0.5 × 0.8 nm [
42]).
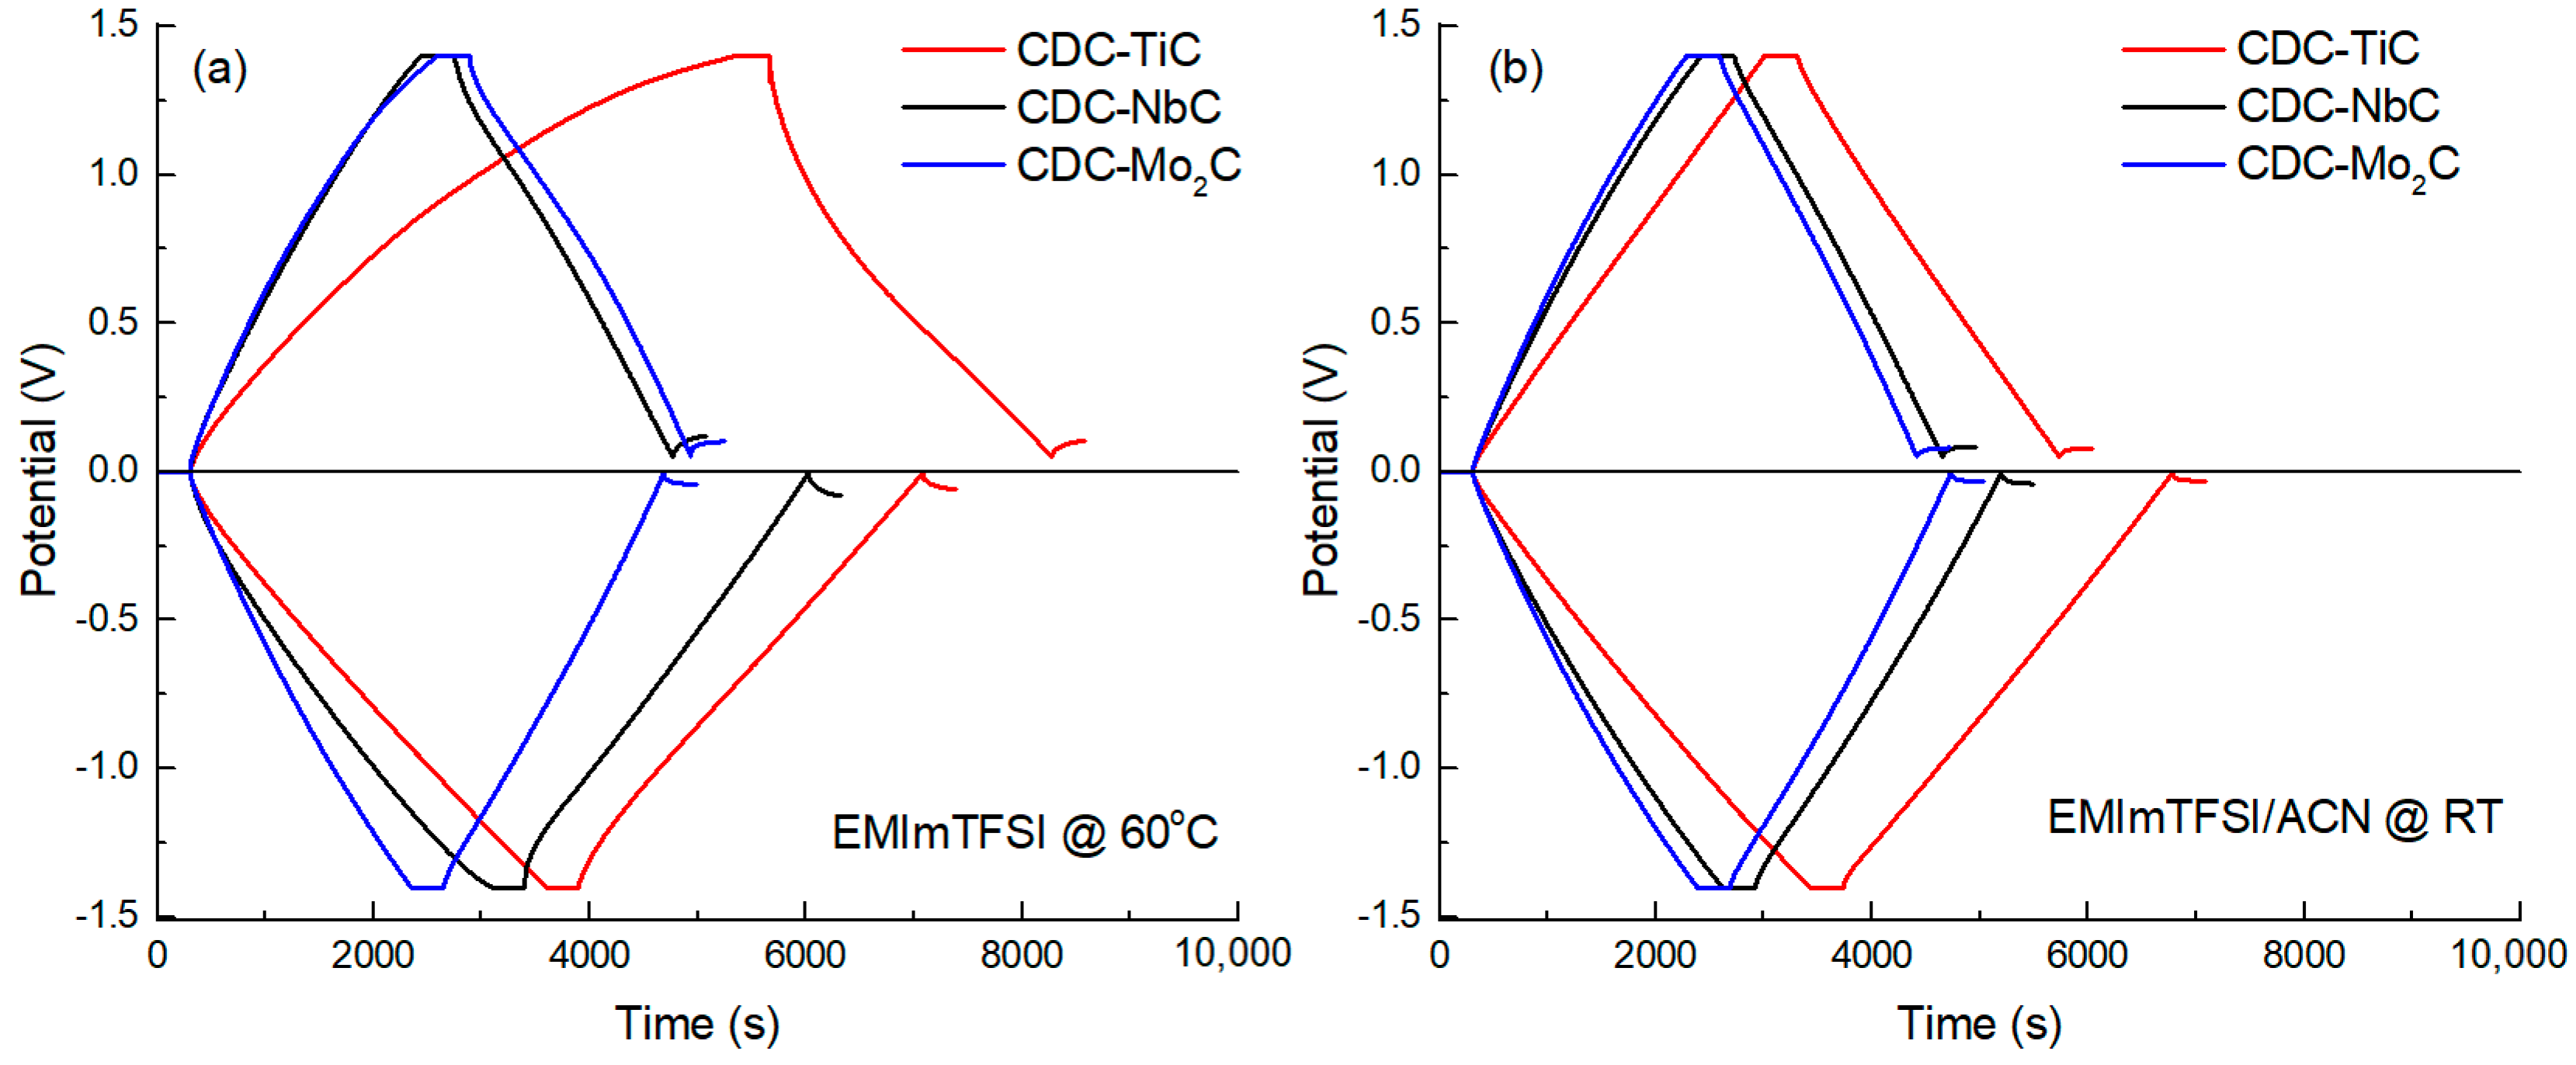
To evaluate the EDL capacitance of CDCs at different current densities (0.5 to 5 mA cm
−2), constant current (CC) charge–discharge measurements were conducted in the anodic and cathodic potential ranges. A 5 min holding at the operating potential was applied in order to achieve electrosorption equilibrium (i.e., maximum charging) at the given potential, consequently leading to better reproducibility of the capacitance values. Characteristic CC curves are shown in
Figure 3, at a current density of 0.5 mA cm
−2 and potential ranges of 0 to +1.4 V and 0 to −1.4 V. In
Figure 3, CDC-TiC, the most microporous material, stands out somewhat at anodic potentials, manifesting as non-linear charge–discharge curves in the neat IL electrolyte. This behavior is due to the high viscosity of the neat IL (14.2 cP [
43]) and the interaction between somewhat larger electrolyte anions and the sub-nanometer-sized pores. After diluting the IL with ACN, the viscosity of the electrolyte significantly decreases (by ~10-fold [
43]), and the non-linearity of the charge–discharge curves of CDC-TiC disappears.
Table 2 provides the specific capacitance values of all three CDCs in this study, calculated using the constant current method and measured in a neat ionic liquid electrolyte at 60 °C. Comparing these values to the gravimetric capacitances, it can be observed that CDC-Mo
2C, with the largest pore dimensions, has nearly equal cathodic and anodic capacitances of 140 vs. 146 F g
−1. A similar level of 145 F g
−1 is achieved by CDC-NbC in the cathodic direction. This uniform level is a result of these materials’ pore size and ion dimensions having an almost “ideal” fit in the IL. Moreover, even the high viscosity of the electrolyte does not impose limitations on achieving this capacitance level.
The lower capacitance of the most microporous material (CDC-TiC) is due to its lower specific surface area and significantly lower porosity. The anodic capacitance of CDC-TiC is lower because the pore dimensions of its carbon are very close to the size of the electrolyte anions, and not all micropores are accessible to the electrolyte ions. However, the limited access to the micropores is compensated by the very high carbon packing density in the case of CDC-TiC, which therefore reveals the highest volumetric capacitance values, ranging from 89 to 100 F cm−3 for the anodic and cathodic capacitance, respectively. In contrast, CDC-NbC, which has significantly higher overall porosity and surface area than CDC-TiC, exhibits lower density and, therefore, lower volumetric capacitance compared to CDC-TiC. As a rule, the larger the pore volume, the lower the material density (as more pores result in a decrease in material density).
When comparing the capacitance values in the neat IL (
Table 2) and the diluted electrolyte (
Table 3), it is evident that ion solvation by ACN shifts the capacitance values in both directions, sometimes increasing and sometimes decreasing. For example, the cathodic capacitance is increased in CDC-TiC (in the dilute electrolyte compared to the neat IL), most probably due to a decrease in electrolyte viscosity, which improves ion diffusion in the micropores, while the dilution of IL has a negligible effect on the anodic capacitance, which is practically the same in both electrolytes (113 F g
−1).
CDC-NbC behaves differently from TiC in terms of capacitance. In the dilute IL, CDC-NbC cathodic capacitance is lower (138 vs. 145 F g−1) compared to the solvent-free environment. However, in the case of anodic capacitance, the situation is reversed, with ~120 F g−1 vs. 110 F g−1 for the IL/ACN and neat IL, respectively. This shows that carbon materials with sufficiently large micropores are suitable for achieving high capacitance in ionic liquids, but in a solvent-diluted environment, the solvation of ions begins to limit the capacitance, which is particularly pronounced in NbC at the anodic potential.
When comparing the capacitances of CDC-Mo
2C in two different electrolytes (see
Table 2 and
Table 3), it appears that its large pores are not limiting and are suitable for cathodic potential, but a capacitance decrease occurs at the anodic potential in the solvent-diluted environment (i.e., capacitance decreases from 146 F g
−1 to 128 F g
−1). However, CDC-Mo
2C provides valuable information due to its very large pore dimensions when fitting with the solvent effects and pore dimensions in the electrolyte. Nevertheless, CDC-Mo
2C has significantly lower volumetric capacitance (60–66 F cm
−3) in comparison to the other materials studied, making it less practical for EDL devices due to its low energy density.
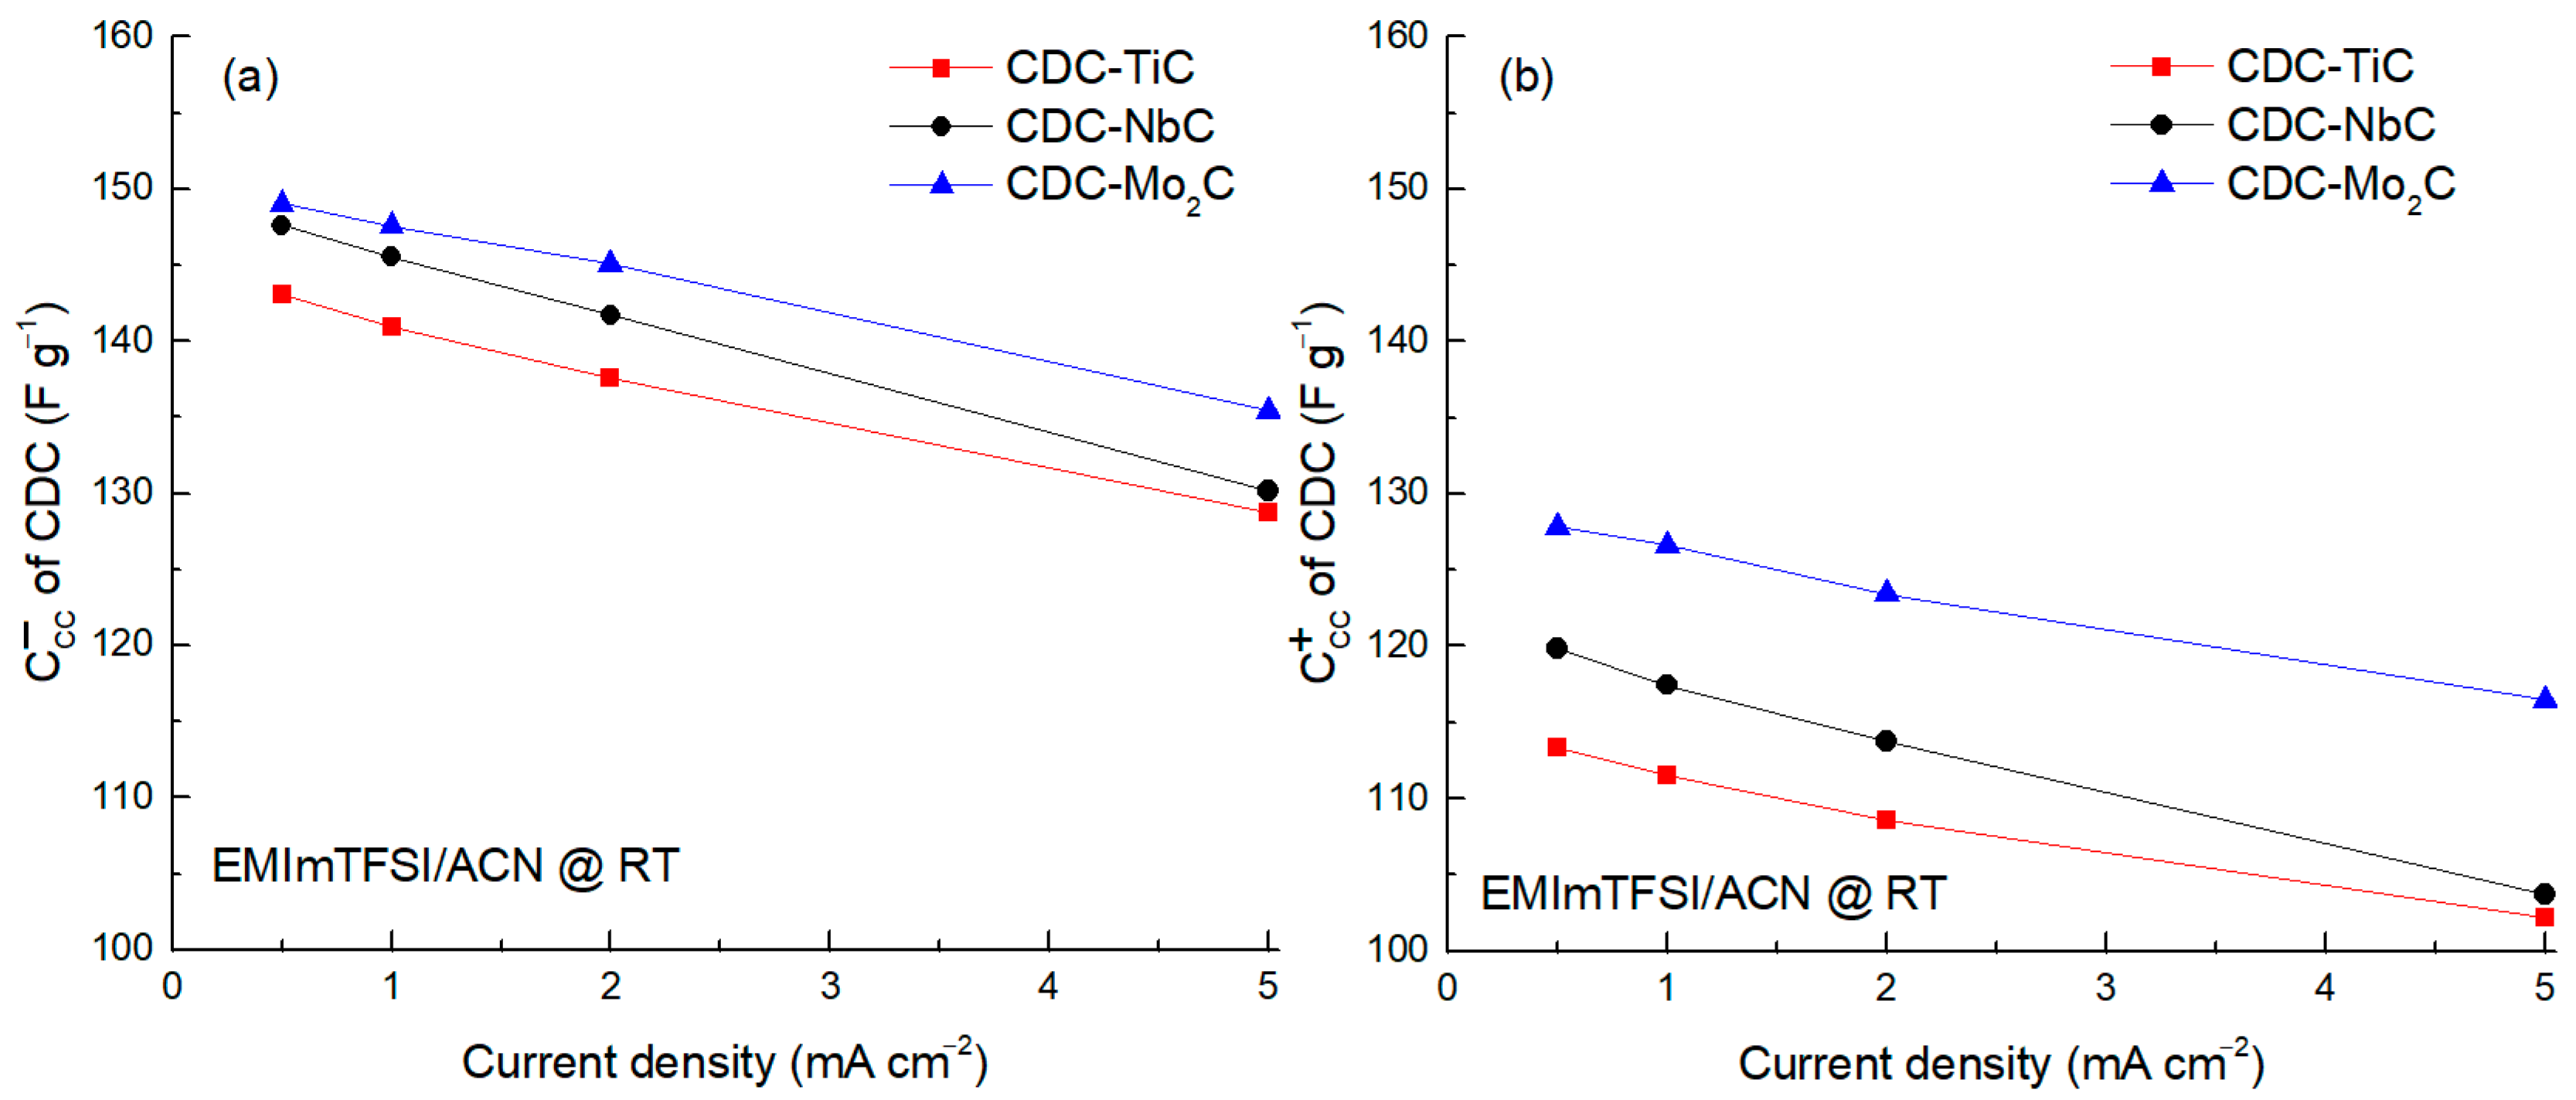
The analysis of the CC capacitance vs. current density in the range 0.5–5.0 mA cm
−2 was performed using ACN-diluted IL (cf.
Figure 4). The findings from this study confirm that the cathodic capacitance, attributed to the electrosorption of EMIm
+ ions, surpasses the anodic capacitance by approximately 20 F g
−1. This phenomenon is particularly notable due to the larger dimensions of the TFSI
− anions. Furthermore, the influence of the ion size becomes evident in the substantial discrepancy in capacitance observed between the CDCs at the anode. This discrepancy suggests restricted accessibility to micropores when the dimensions of the ions closely approach those of the micropores themselves.
Cyclic voltammetry was utilized to investigate the behavior of electrode materials at positive and negative electrode potentials. To ascertain electrochemical stability, measurements were conducted over a wide electrochemical window, i.e., +1.8 V to 0 V and −1.8 V to 0 V vs. a carbon reference electrode. The CV diagrams for the materials studied are presented in
Figure 5.
Evaluating the electrochemical stability of materials is essential to determining the voltage limits. As these limits are not the same for different carbons, electrochemical window studies were conducted separately at positive and negative electrode potentials. In this process, the electrode potential was incrementally increased, starting from 1.0 V with a 200 mV step and gradually reaching 1.6 V, followed by smaller 100 mV increments up to 1.8 V.
For the CDC-TiC material, its cathodic curves in the neat ionic liquid are relatively similar, and starting from −1.6 V, there is a gradual increase in current during charging (i.e., an increase in capacitance). Such an increase in current results in a flat peak in the reverse scan of the CV cycle in the −0.8 V to −0.6 V range, which slightly grows with an expanding CV potential window, indicating a partially reversible process.
In the positive potential region for the CDC-TiC material, the CV curves up to +1.4 V are relatively similar. With further potential increases beyond +1.6 V, the polarization current increases rapidly, indicating electrolyte decomposition and potential partial surface blocking by system degradation products. This process becomes especially evident in the curve of +1.7 V. Therefore, the shape of the discharge at +1.7 V polarizations is significantly different from lower potentials.
In the case of the EMIm-TSI/ACN electrolyte solution, the anodic end of the CV curve of CDC-TiC is very stable and almost rectangular in shape. The complete absence of peaks in the presence of ACN (
Figure 5b) suggests that adding a solvent significantly improves the stability of the carbon/electrolyte interface. In the cathodic CV polarization curves in the dilute IL electrolyte, there is a similar trend as seen in the full-scan curves; achieving capacitance during the reverse scan is faster (see
Figure 2a,b), and the numerical value of the specific capacitance is also higher in the dilute electrolyte compared to the neat IL.
The CDC-NbC curves appear relatively similar regardless of the neat or dilute electrolyte used (
Figure 5c,d). In both electrolytes, the increase in cathodic current at critical potentials is lower compared to CDC-TiC and CDC-Mo
2C. However, in the neat IL, there is an inexplicable peak (−1.0 V) during the reverse scan of the cathodic region (also observed in the −1.7 V curve), which is not present in the dilute IL electrolyte. Additionally, in both electrolytes, there is a lower cathodic current peak during the reverse scan, around −0.5 V, which is characteristic of all studied carbons. The anodic curves for CDC-NbC show differences compared to the neat and dilute ILs. In the first one, after +1.7 and +1.8 V, there is also a flat peak around +0.8 V, which could be attributed to the desorption of TFSI
− anions after passing higher potentials due to their specific adsorption in CDCs with multi-modal pores (i.e., CDC-NbC and CDC-Mo
2C), though this is not confirmed. In the diluted electrolyte, with a lower ion concentration, such a distinct peak does not seem to form with either material.
In the case of CDC-Mo
2C (
Figure 5e,f), the cathodic curve in the neat IL resembles the shape of the CDC-TiC dependence on the CV curves obtained in the EMIm-TFSI/ACN electrolyte. Despite the differences in porosities, it appears that solvated cations in CDC-TiC and CDC-Mo
2C exhibit similar electrosorption properties. The anodic curves of CDC-Mo
2C are clearly different depending on the electrolyte. For instance, in the neat IL, a flat peak forms around +1.0 V during the anodic charging of the material after passing a wider potential window > −1.6 V. However, a similar, albeit very small, peak also forms for CDC-NbC after −1.8 V. However, the cathodic CV curves in CDC-Mo
2C are very similar in both electrolytes, except for a slight difference in the sharper increase in current at −1.8 V during cathodic charging in the neat IL compared to the dilute IL. For CDC-Mo
2C, the anodic CV curves are similar to the anodic curves of CDC-NbC in the diluted electrolyte. However, there is a significant difference after +1.8 V potential, similar to the cathodic potential, indicating that this material has a somewhat smaller electrochemical window in the ACN-containing electrolyte.
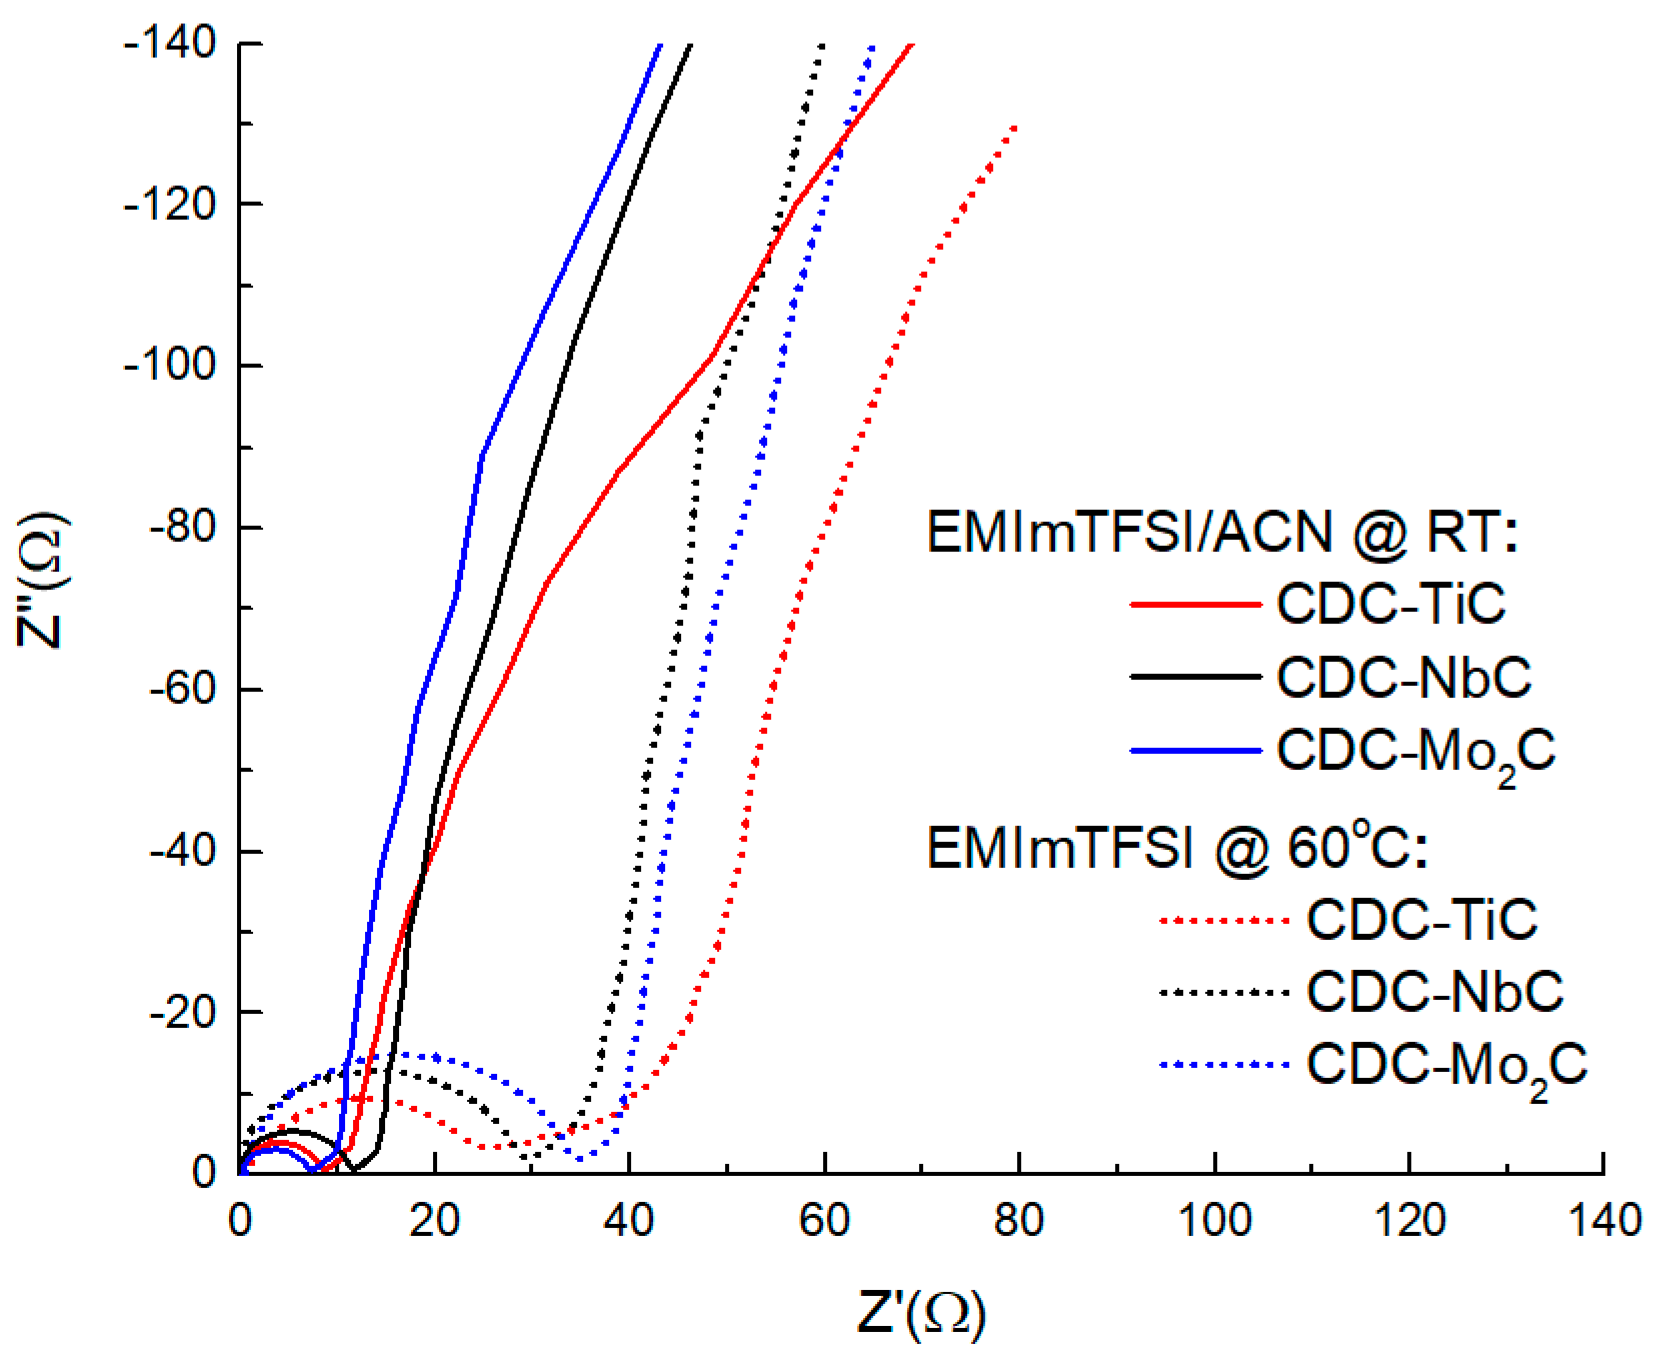
The Nyquist plot in different electrolytes (
Figure 6) shows a clear differentiation of the curves into two groups (in the neat IL electrolyte characterized by larger semicircles and in the diluted solvent with smaller semicircles). The larger radius of the semicircle is clearly due to the IL electrolyte having nearly 3× higher viscosity and about 2× lower electrical conductivity compared to the ACN electrolyte. In the neat IL, the plot also reveals material-related differences; for instance, the size of the semicircle (related to the charge transfer resistance) is clearly correlated with the material’s porosity and the size of the material’s particles, which, in the present case, both increase in the order CDC-TiC (Ø < 4 μm), CDC-NbC (Ø < 10 μm), and CDC-Mo
2C (Ø < 20 μm). In addition to the semicircle, the most microporous material also has the largest area of so-called pore resistance, with an angle measuring less than 45°. This lower angle characterizes the simultaneous occurrence of mixed kinetic processes (partially impeded ion diffusion processes and adsorption processes). The other two materials exhibit a noticeable 45° rise. In both electrolytes, the vertical section of the CDC-TiC material does not reach a height of 90° due to steric hindrance to the electrosorption of electrolyte ions in the nanoporous material.
The
Rs values calculated for the uncharged material at a frequency of 1 kHz reveal that the ultramicroporous CDC-TiC has very high electrical resistance (11.4 ohms) in the neat IL electrolyte. This is due to hindered diffusion as observed in the section of the “45-degree slope” (so-called pore resistance), on the Z′,Z″ curve in
Figure 6, which also causes heat to be released during electrochemical cycling. However, in general, the capacitance of all three CDCs is similar, manifesting in the range of 3.1–5.6 ohms, and it does not matter if they are in solution or not.
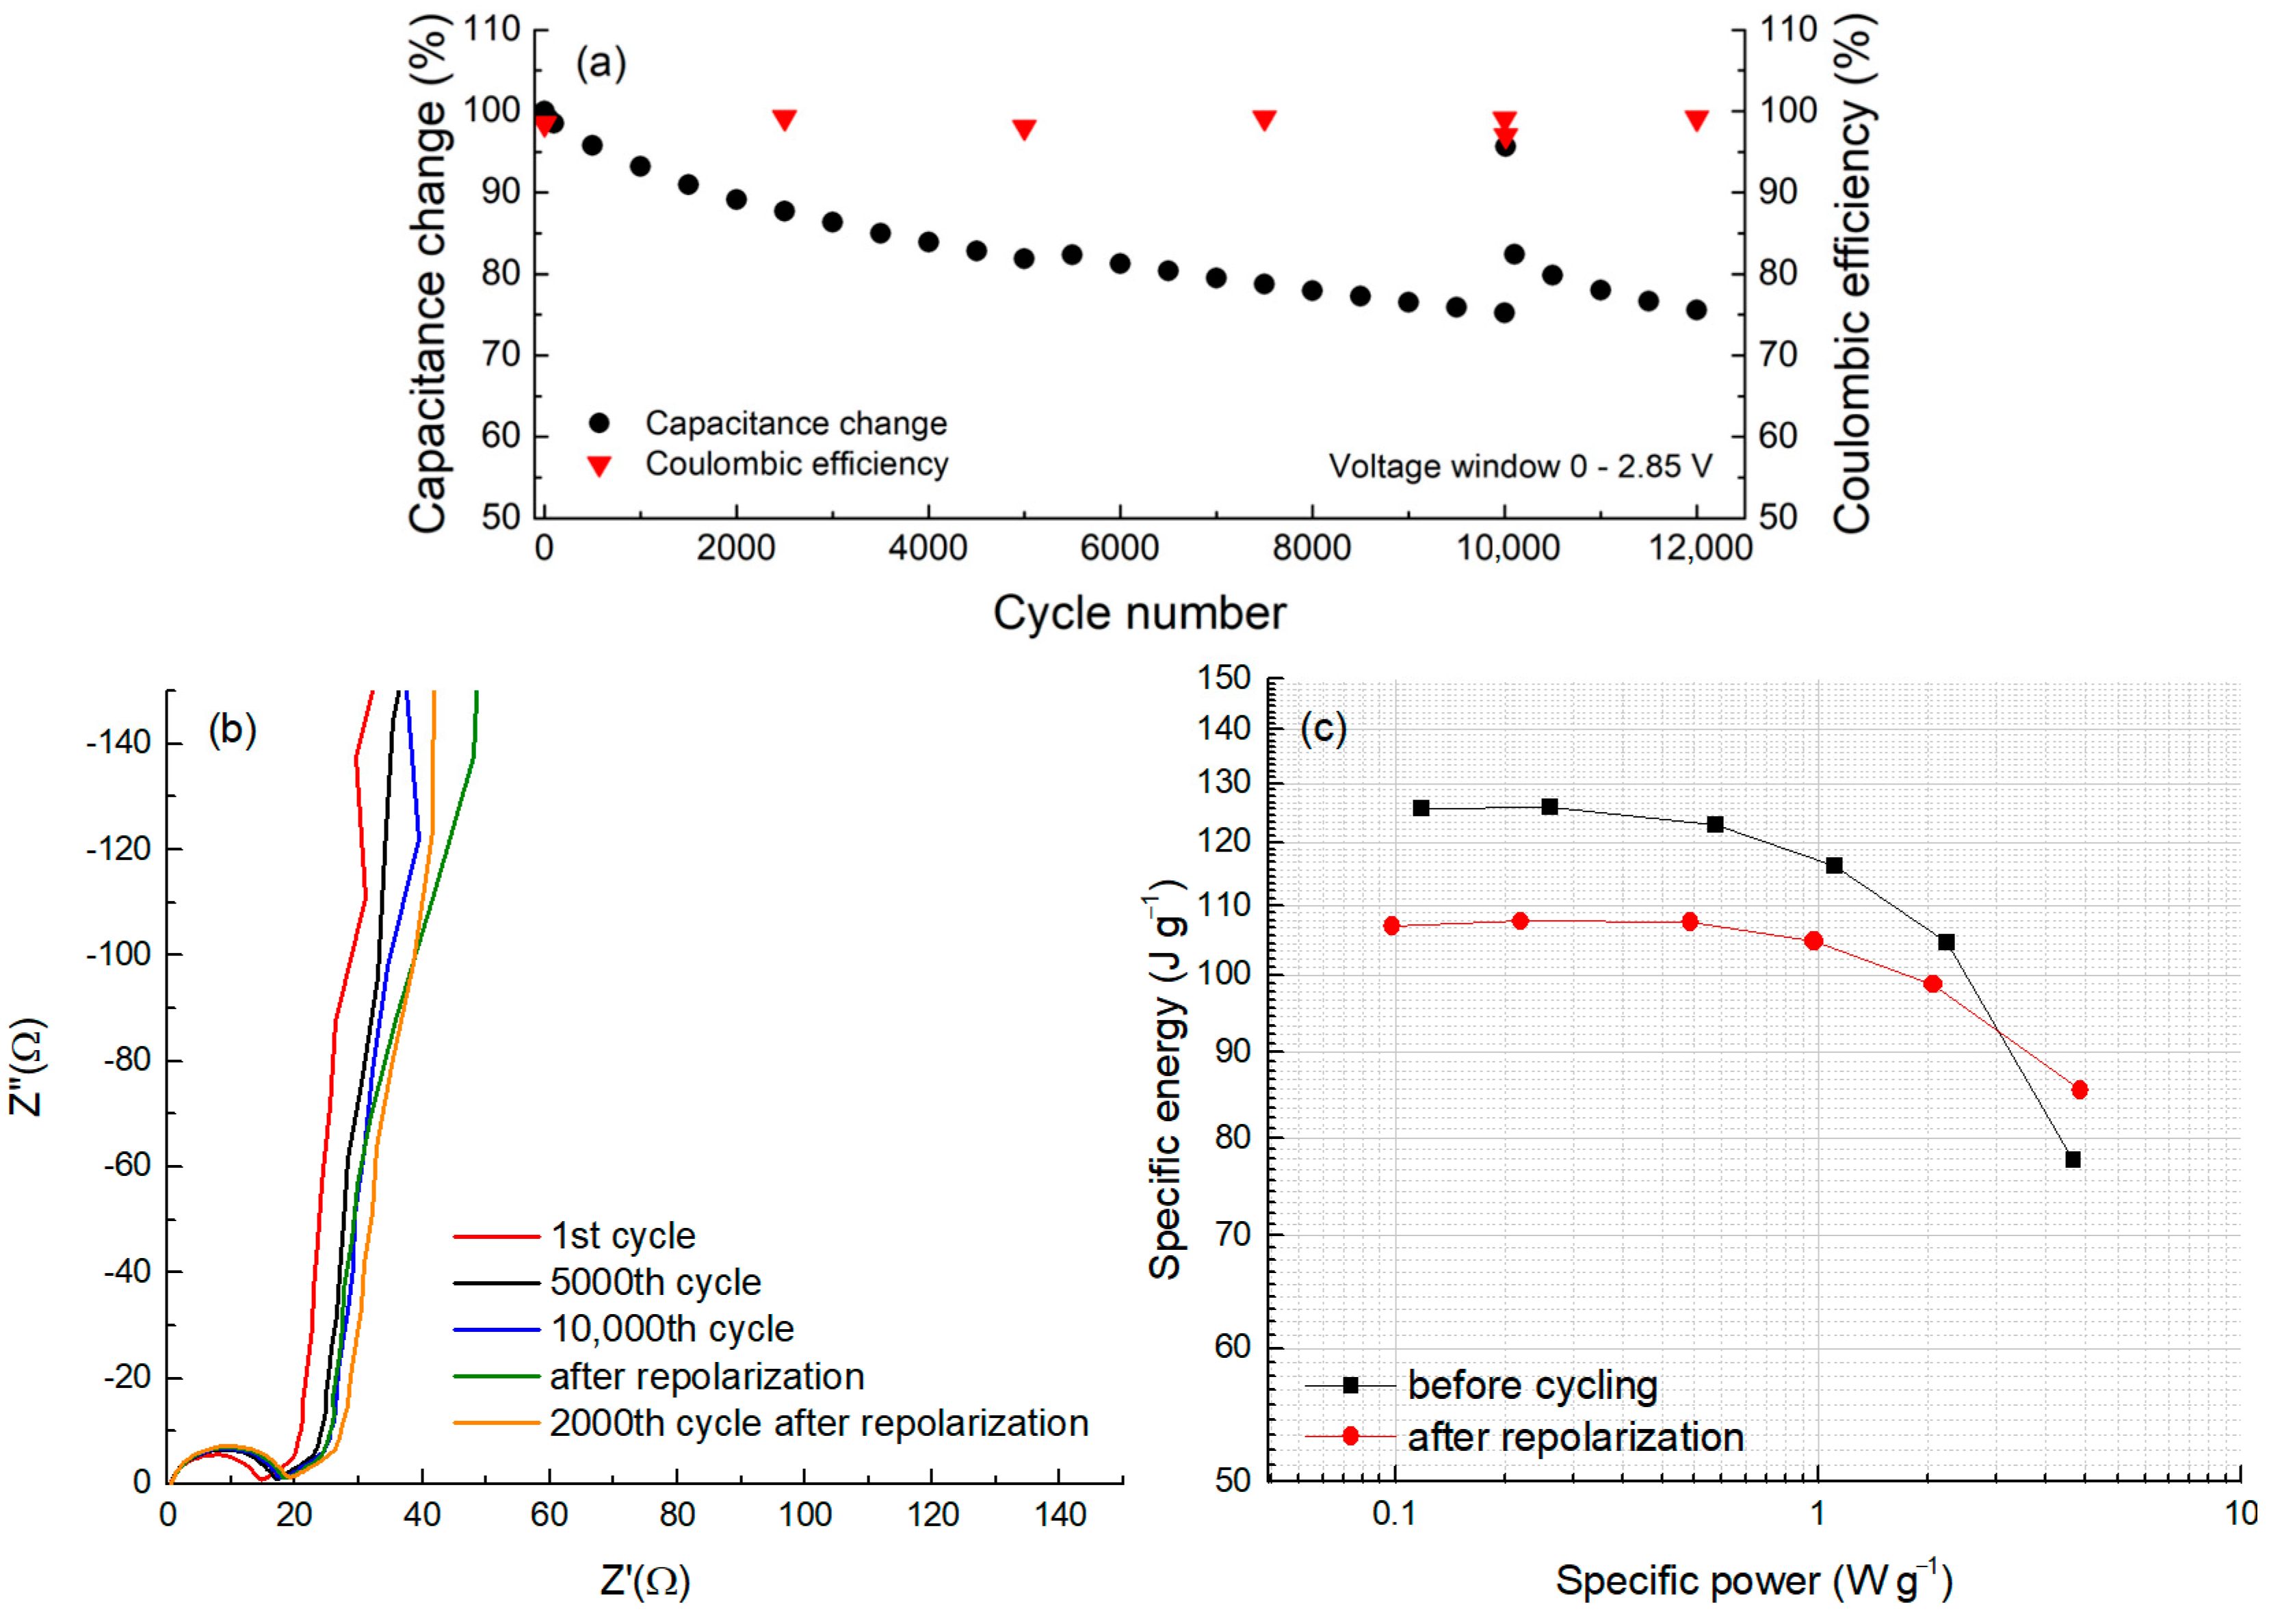
For cycle life testing, a symmetric two-electrode cell assembled from CDC-NbC electrode discs was subjected to cycling between 0 and 2.85 V using CV. The evolution of capacitance over the cycles is depicted in
Figure 7a. After completing 10,000 cycles, we reversed the cell’s terminal polarities, followed by 10 cyclic voltammetry (CV) cycles from 0 to 2 V, referred to as ‘repolarization.’ Subsequently, we restored the original polarities, and cycling continued within the voltage range of 0 to 2.85 V. During the 10,000 cycles, the capacitance exhibited a reduction of approximately 22% from the initial value of 122 F g
−1. This gradual reduction in capacitance over time is a hallmark of most electric double-layer (EDL) capacitors.
Immediately after repolarization, the capacitance recorded in the first cycle exhibited a remarkable surge, almost returning to the initial capacitance level (98%). However, this increase was transient, as subsequent cycling resulted in a rapid decline. This “overshoot” phenomenon can be attributed to the “cleaning” of the electrode surfaces from adsorbed compounds following the polarity reversal [
44]. The freshly exposed surface momentarily regains its capacity for readsorbing electrolyte ions. Nevertheless, the redeposition of additives occurs quite swiftly, and the attained capacitance level proves to be temporally unstable.
In addition to the capacitance data obtained via the CV method, this test cell was subjected to electrochemical impedance spectroscopy after varying numbers of cycles (
Figure 7b).
In
Figure 7b, a Nyquist plot is presented, obtained before and after a certain number of full charge–discharge cycles. In this plot, the semicircles start from a single point, indicating a very stable system and a constant resistance at the metal/carbon electrode interface. Thus, changes in the carbon/aluminum resistance during the cycle life test can be ruled out. The semicircle slightly grows after around 5000 cycles, suggesting some alterations occurring on the carbon surface. However, the pore resistance (45° rise and its length) remains relatively stable, indicating that any potential changes over time are likely taking place on the external surface of the carbon particles. Furthermore, when observing the vertical “tail”, it becomes less vertical just after repolarization (
Figure 6b, green curve) compared to the others, suggesting that this process might induce some parallel reaction in the system. Nevertheless, these processes (reactions) ceased to manifest after 2000 cycles of post-repolarization. It is possible that during cycling, surface oxides may attach to cations through anodic hydrogen-bonding-like interactions, hindering anion electrosorption. However, during the repolarization process, the breaking of these hydrogen bonds occurs, resulting in the observed changes.
The values of the series resistance (Rs) measured at 1 kHz are 12.8, 14.2, and 14.5 ohms after the 1st, 5000th, and 10,000th cycles, respectively. Immediately after repolarization, an Rs of 14.9 ohms was measured, with 15.2 ohms after the next 2000 cycles. Therefore, the overall change in cell resistance after completing 12,000 cycles is approximately 19%; this represents only one-fifth of the allowable change in the Rs value, as stipulated by conventional lifetime-testing agreements. In contrast, the decrease in capacitance over the same number of cycles is approximately 20%.
Figure 7c represents the dependence of energy density on the applied power density, also known as the Ragone plot, at the beginning of the cycle life test and immediately after repolarization. The data on the Ragone plot were derived from the dependencies on different cycling rates using the CV method. It was shown that the maximum usable energy of CDC-NbC in a symmetric two-electrode cell at low power is 125 J g
−1, which decreases to nearly 108 J g
−1 after 10,000 cycles (includingrepolarization) at an operating voltage of 2.85 V. The observed increase in power density after 10,000 cycles, particularly at high currents, might be associated with repolarization and the rapid surge in capacitance.

