Abstract
We report the use of a carboxylated pyrrolidine-fused chlorin (TCPC) as a fluorescent probe for the determination of glutathione (GSH) in 7.4 pH phosphate buffer. TCPC is a very stable, highly emissive molecule that has been easily obtained from meso-tetrakis(4-methoxycarbonylphenyl) porphyrin (TCPP) through a 1,3-dipolar cycloaddition approach. First, we describe the coordination of TCPC with Hg(II) ions and the corresponding spectral changes, mainly characterized by a strong quenching of the chlorin emission band. Then, the TCPC-Hg2+ complex exhibits a significant fluorescence turn-on in the presence of low concentrations of the target analyte GSH. The efficacy of the sensing molecule was tested by using different TCPC:Hg2+ concentration ratios (1:2, 1:5 and 1:10) that gave rise to sigmoidal response curves in all cases with modulating detection limits, being the lowest 40 nM. The experiments were carried out under physiological conditions and the selectivity of the system was demonstrated against a number of potential interferents, including cysteine. Furthermore, the TCPC macrocycle did not showed a significant fluorescent quenching in the presence of other metal ions.
1. Introduction
Chlorins are an important class of reduced porphyrins (dihydroporphyrins) which, when in the form of Mg2+ complexes, can be found as the green photosynthetic pigments (chlorophylls) in plants, microalgae and cyanobacteria [1]. As natural chlorins are often unstable and difficult to handle, the preparation of synthetic analogues has been explored as a very attractive approach to obtain more robust derivatives with functional groups suitable for the desired applications [2]. Due to its structural features, chlorin derivatives show unique spectral properties including: (1) an intense absorption band at ca. 650 nm; (2) high emission quantum yield and (3) upon coordination with metal ions, several metallochlorins can be obtained with more valuable physicochemical properties that enable a broader range of applications, such as in theranostics of cancer [3,4,5,6], nonlinear optics [7,8,9], photoacoustic imaging [10,11,12] and for dye sensitised solar cells [13,14,15].
Considering the potential use of chlorin derivatives in biomedical applications, it is important to study their effects in vitro and in vivo systems, including their toxicity, biocompatibility and cellular uptake [16]. Nowadays the great majority of in vitro and in vivo studies are still performed using porphyrin derivatives, nevertheless similar elations can be taken towards chlorin derivatives. For sensing applications in living systems, it is crucial to study and decrease the potential toxicity of the sensors, while maintaining their photophysical properties, like high emission intensity, singlet oxygen (O) quantum yields, brightness and luminescence lifetime. In the case of porphyrin and chlorin derivatives, two related factors are extremely important for attaining a sensor with low toxicity, namely the phototoxicity and singlet oxygen generation. A method to decrease the derivatives toxicity is to disable their capacity to penetrate the cellular membranes. For example, in 2011 a dendritic benzoporphyrin was prepared to be used as in vivo oxygen probes and revealed low phototoxicity, this was associated with the bulky structure inability to penetrate the cellular membranes [17]. Another reported method, is the preparation of dyads using dyes that promote the quenching of the triplet state of tetrapyrrolic compounds by energy transfer, disabling the production of singlet oxygen [18]. Another strategy is the preparation of nanoscale structures. Recently, a chlorin-nanoscale-Metal-Organic Framework (TCPCUiO) was reported and revealed applicability both in photodynamic therapy (PDT) and photothermal therapy (PTT). TCPCUiO presented good anticancer activity against H22 tumor-bearing mice in vivo and possessed negligible systematic toxicity—with favorable non thrombogenic and biocompatible properties on blood cells, low systemic toxicities to the function of the liver and kidney and no tissue damage or inflammatory lesions were observed in all major organs [19].
Chlorins can be obtained from porphyrins by a variety of synthetic approches, including through hydrogenation [14], annulation [20] and cycloaddition [21] with diverse entities. Using 1,3-dipolar cycloaddition (1,3-DC) reaction of porphyrins with azomethine ylides [22], we recently reported the synthesis of carboxylated pyrrolidine-fused chlorin (TCPC) and its application in the successful detection of the explosive triacetone triperoxide (TATP) in the gas phase [23].
Glutathione (GSH) is the most abundant thiol in animal cells. It is a tripeptide with a peptide linkage between cysteine (Cys), glycine (Gly) and glutamate (Glu). Cellular GSH exist in the 1–10 mM concentration range whereas it is reduced to 150–200 in serum [24] and 1–6 in plasma [25,26,27]. The most important role of GSH in the organism is as an antioxidant agent, preventing damage caused by free radicals or reactive oxygen species (ROS). Moreover, GSH is involved in a vast regulatory process, and an abnormal concentration of GSH is directly related to severe diseases [28]. For instance, some tumours have an extraordinarily high level of GSH [29,30,31]. Furthermore, a GSH or GSH synthetase deficiency involves massive urinary excretion, metabolic acidosis, and/or a tendency to hemolysis in humans [28]. It has been also associated with mitocondrial disorders [32], Alzheimer’s and Parkinson’s diseases, among others [33,34,35,36].
For these reasons, it is essential to detect GSH to prevent or downplay the effects of the low or high levels of the tripeptide. For the determination of thiols and specifically GSH, some traditional techniques have been applied, such as high-performance liquid chromatography (HPLC) [37,38,39], surface enhanced Raman scattering (SERS) [39,40] mass spectroscopy (MS) [41] or electrophoresis [42,43]. Although these techniques provide high resolution for low levels of GSH, the cost of equipment, the complexity of sample preparation and extended analysis time means that these analysis methods are not practical for clinical or research purposes.
Electroanalytical methods have also been used to detect GSH [44,45,46]. However, these techniques are based on reducing the thiol group; the detection mechanism is not specific for GSH, and they require sample pre-treatment to isolate the analyte of interest.
On the other hand, colorimetric and fluorescent probes have become an excellent alternative for GSH detection due to their simple mechanisms, easy sample preparation, and colour changes with the naked eye when the analyte is present [32,47,48,49,50,51,52,53]. However, taking advantage of these properties requires selective, sensitive and robust methods. In this work, a highly emissive porphyrin analogue, a carboxylated pyrrolidine-fused chlorin (hereafter TCPC, Figure 1), has been synthesised and used as a fluorescent probe for the turn-on-based sensing of GSH fulfilling all the above requirements.
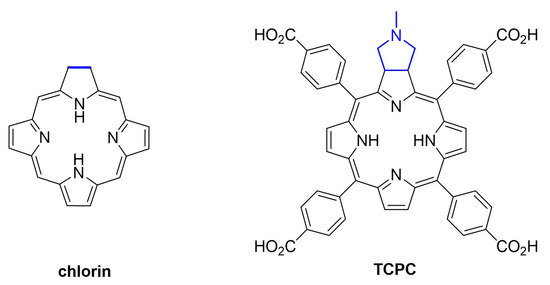
Figure 1.
Structure of core chlorin and TCPC.
2. Results and Discussion
2.1. Absorption and Emission Features of TCPC
Chlorins are porphyrin derivatives that suffer a single ,′-double bond reduction, and their spectral features are consequently similar to those of the porphyrin precursor. Here, we used the carboxylated pyrrolidine-fused chlorin (TCPC) as a fluorescent probe, which was prepared as previously reported [23]. Briefly, its synthesis involved the 1,3-dipolar cycloaddition (1,3-DC) of the porphyrin precursor meso-tetrakis(4-methoxycarbonylphenyl)porphyrin TCPP with azomethine ylide, obtained from sarcosine and paraformaldehyde, followed by methyl ester hydrolysis under alkaline conditions. The absorbance and fluorescence spectra of TCPC in ethanolic solution at different concentrations are depicted in Figure 2. The absorbance spectra show the Soret band with a main peak centred at 418 nm and a shoulder at 404 nm. This splitting of the Soret band is attributed to orbital symmetry breaking after alteration of the macrocycle structure that induced a non-degenerate electronic transition [54,55,56,57,58,59,60,61,62]. An enhanced intensity of the Q bands at longer wavelengths is also appreciable [63], in contrast to free-base porphyrins [64]. On the other hand, the emission spectra exhibit the characteristic 0-0 peak at 651 nm and the corresponding 0-1 vibronic band at 715 nm typical of porphyrins. However, the emission intensity of the chlorin shows a six-fold increase as compared to its porphyrinic counterpart TCPP in solutions with the same absorbance (Figures S1 and S2). Regarding the concentration effect, the inset in Figure 2 clearly shows that the linearly increase in the absorbance is accompanied by a decrease in the emission intensity for increasing concentrations of TCPC, which is due to an efficient reabsorption of the photoluminescence at 650 nm where the intense Q band is centered.

Figure 2.
Absorbance (solid lines) and fluorescence ( nm, dashed lines) spectra of TCPC solutions in ethanol at different concentrations. Inset: Absorbance and FL intensity vs. TCPC concentration. The error bars were calculated from the standard deviation of three independent measurements.
2.2. TCPC-Hg2+ Complex
Prior to GSH determination experiments, we formed the TCPC-Hg2+ complex by adding an increasing amount of HgCl2 to the chlorin solution, whose colour gradually turned green as the Hg(II) concentration increased from 0 M to 61.4 M (solutions a–g in Figure S3). These colour changes are produced by a red shift of the Soret band and the disappearance of the original Q bands, exhibiting a unique absorption at 620 nm, as shown in Figure 3a. Those spectral changes, typical of protonation of the porphyrin ring, are promoted by the Hg2+ coordination to the pyrrolic ring nitrogens, adopting a non-planar conformation [65,66,67]. Moreover, a fluorescence decrease is observed with the formation of the complex, as shown in Figure 3b. The non-planar conformation induced by the mercury ion coordination breaks the -electrons conjugation of the macrocycle, promoting the excited states of the molecule to relax by non-radiative phenomena, implying a significant quenching of fluorescence emission [68]. The fluorescence quenching follows a linear relationship according to the Stern-Volmer Equation (Figure S4):
where is the initial FL intensity at 650 nm, I is the FL intensity at the same wavelength in the presence of the quencher, is the Stern-Volmer constant and [Q] is the quencher concentration. The results are well-fitted to the Stern-Volmer model indicating that the stoichiometry of the complex remains constant in the working concentration range.

Figure 3.
Absorbance (a) and fluorescence (ex = 415 nm) (b) spectra of TCPC aqueous solutions at pH 7.4 with different concentrations of Hg2+.
2.3. GSH Determination
Due to the excellent luminescent properties of TCPC, it was used as a fluorescent probe for GSH determination. For this approach, three different molar ratios of TCPC-Hg2+ were fixed, i.e., 1:2, 1:5 and 1:10. After the TCPC-Hg2+ complex formation ( estimated from the absorbance data at 650 nm in Figure 2 and Figure 3, for TCPC:Hg2+ = 1:2), increasing amounts of GSH were gradually added to the complex solution. Subsequently, the Hg2+ ions are bonded to the thiol groups of two different GSH molecules, forming a [Hg(GSH)2]4− complex [69,70,71] ( [72]) (Figure S5). Firstly, the free Hg2+ ions coordinate to GSH, causing almost no change in the absorption and fluorescence spectra. Once the mercury ions in excess have been coordinated, the remaining GSH, breaks the TCPC-Hg2+ complex due to the higher binding constant of the [Hg(GSH)2]4− complex. This reaction liberates the TCPC molecules triggering the fluorescence turn on, as shown in Figure 4 for a TCPC-Hg2+ 1:10 molar ratio. In particular, Figure 4a shows that the absorption spectrum is progressively recovered to its initial state as the analyte is added to the sensing solution, confirming the proposed mechanism. At the same time, the corresponding fluorescence spectra (Figure 4b) show an increase of the emission intensity that is used as the response signal. These changes are also visually observed in Figure S6. Once the reaction is completed and the TCPC molecules are quantitatively in their free form, no additional spectral changes are produced for further addition of GSH. A similar behaviour is found when the experiment is performed using the TCPC:Hg2+ ratios of 1:2 and 1:5 (Figures S7 and S8, respectively), with the main difference being the minimum amount of GSH needed to obtain the required spectral changes. Therefore, the TCPC-Hg2+ ratio determines the minimum amount of analyte to be detected as explained below.

Figure 4.
Absorbance (a) and fluorescence ( nm) (b) spectra of TCPC-Hg2+ complex aqueous solutions (ratio 1:10) at pH 7.4 with different concentrations of GSH.
Figure 5 depicts the normalized fluorescence at the maximum emission wavelength (650 nm, nm) of the TCPC molecule vs. the GSH concentration added to the solution for the three-selected TCPC:Hg2+ concentration ratios.

Figure 5.
Fluorescence intensity changes when a different amount of GSH is added to (red) 1:2, (blue) 1:5, and (green) 1:10 molar ratio of TCPC-Hg2+ complex aqueous solutions at pH 7.4. The error bars were calculated from the standard deviation of three independent measurements.
As can be seen, the intensity of the signal follows a sigmoidal trend in all cases. Deeper inspection reveals that the position of the curves and the length of the corresponding tails before the intensity takes off are given by the excess amount of Hg2+ ions in the media. In this sense, as the TCPC:Hg2+ concentration ratio decreases (lower amount of free Hg2+ ions in the media) the minimum and maximum concentrations of GSH that can be detected decreases. In all cases, the experimental data can be fitted to the followed equation for calibration purposes:
where c is the GSH concentration, , , and k are empirical parameters, and is the residual fluorescence from non-coordinated TCPC in the absence of GSH. As can be seen in Figure 5, excellent values for the regression coefficient were obtained in all cases. Additionally, the corresponding values for (0.372, 0.179 and 0.108 for TCPC:Hg2+ 1:2, 1:5 and 1:10, respectively) increase as the TCPC:Hg2+ ratio decreases. This effect is expected for sufficiently low TCPC:Hg2+ ratios due to the presence of non-coordinated insensitive TCPC molecules in the media and reduces the GSH concentration range that can be detected, although it corresponds to low concentration regimes that can be more interesting for certain applications.
These considerations are better understood if we focus on an essential feature of any analytical method like the limit of detection (LOD). Traditionally, in the context of simple measurements where the signal varies linearly with the amount of analyte, the linear regression method is used and the LOD is defined as 3/slope, where is the standard deviation of the intercept. However, the complexity of the data that analytical systems can provide for incoming samples leads to situations where the LOD cannot be calculated as reliably as before. In this way, different strategies to calculate the LOD could be considered for optical sensors with a sigmoidal response. In this case, the LOD can be defined as a quarter of the maximum slope of the curve [73], giving rise to two different values of LOD. The first one is the lower quantity of analyte that can be detected, namely the lower limit of detection (LOD). The second one is the upper limit of detection, LOD, and represents the maximum amount of analyte that can be detected being the analyte concentration at which the sensor signal is saturated. The LOD and LOD of the different TCPC:Hg2+ molar ratios tested in this study are shown in Figure 6. The green shadowed area represents the [GSH] determination region corresponding to the different concentrations of GSH that the sensor can determine reliably. As can be seen, the TCPC:Hg2+ ratio to be employed determines both the LOD and LOD values and the [GSH] range lying between them. Although these values could be extended to lower and higher GSH concentration regimes by using more extreme TCPC:Hg2+ ratios (see Figure S9 for a TCPC:Hg2+ 1:100 molar ratio), those used here allow the GSH determination in plasma [24] and serum [25,26,27] samples. Additionally, Figure S9 demonstrates the effective recovery of the TCPC emission after addition of 10 mM GSH. Moreover, applications where sub-micromolar GSH concentrations need to be determined can be covered by this chlorin-based fluorescent probe, with a LOD for TCPC:Hg2+ 1:2 as low as 40 nM. This value, susceptible to further reduction by reducing the TCPC:Hg2+ ratio, is significantly lower than those found in most of the existing literature using fluorescent probes [32,74,75,76,77,78,79,80,81] and very similar to those reporting the lowest values [53,67,75]. These results are summarized in Table S1.

Figure 6.
Variation of the LOD and LOD again the molar ratio of Hg2+-TCPC. The green region represents the determination range. Inset: Table of values of LOD and LOD in M for the different ratios.
Finally, we carried out the selectivity study selecting two families of potential interferents: metal ions that could compete with Hg2+ to quench the chlorin emission, and competing thiols and other common anions (ligands) present in biological samples. Figure 7a shows the response of TCPC against ten equivalents of different metal ions. As can be seen, only Hg2+ is able to quench the fluorescence of the TCPC by the mechanism discussed above, even with ten-fold concentrations of the potential interferents. Those results reveal the high selectivity of the TCPC towards mercury ions. On the other hand, Figure 7b shows the results for cysteine (cys), Cl−, acetate and phosphate dibasic (HPO42−). In this experiment, GSH is ten times more concentrated than cys in order to simulate physiological concentrations, while the other ions are in 1 equivalent to the GSH. As can be seen, only cys can produce an important interference in the proposed mechanism. In fact, cys is the most plausible interferent in an intracellular or extracellular medium. As discussed above, this amino acid is part of the structure of glutathione, and the thiol group could coordinate with mercury ions in the media, giving rise to a false positive. However, in the human organism, the concentration of cys is between 30 and 50 times lower than that of GSH [25,82] and therefore, it does not represent real interferent in detecting GSH.

Figure 7.
(a) Fluorescence quenching of TCPC in the presence of different metal ions. The experimental conditions are shown in the figure. (b) Recovery of the TCPC fluorescence when GSH, cys and other ions were added. The experimental conditions are shown in the figure. GSH and cys are in physiological concentration. Other ions are in 1 equivalent to the GSH.
3. Materials and Methods
3.1. Chlorin, Reagents and Instrumentals
The synthetic procedure and characterization (including H NMR, C NMR, and HRMS) for TCPC is described elsewhere [23]. Glutathione and mercury(II) chloride (HgCl2 > 99.5%) were purchased from Sigma-Aldrich. Other reagents and solvents were purchased as reagent-grade and used without further purification. UV-visible absorbance spectra were recorded using a Cary 100 UV-Vis spectrophotometer (Agilent Technologies, Santa Clara, CA, USA). In addition, fluorescence (FL) emission and excitation spectra were recorded with a Hitachi F-7000 Fluorescence Spectrophotometer (Hitachi, Tokyo, Japan).
3.2. Sensing Experiments
GSH fluorescence determination was carried out by increasing the GSH concentration in a TCPC-Hg2+ complex aqueous solution to obtain a calibration curve. To ensure the maximum formation of TCPC-Hg2+, the experiments were performed with different TCPC-Hg2+ molar ratios (1:2, 1:5 and 1:10). All experiments were carried out by fixing the pH to 7.4 using a phosphate buffer (H2PO4−/HPO42−) 0.01 M. All determination assays were carried out at nm, close to the absorption peak of TCPC.
4. Conclusions
The chlorin TCPC exhibits appealing emissive features that prompted us to use it in chemical sensing. In particular, we employed the TCPC molecule as a fluorescent probe to detect different concentrations of GSH with high reliability and sensitivity, being able to detect even 40 nM of GSH in physiological conditions. For this approach, a controlled amount of HgCl2 is added to the solution to form the non-emissive Hg2+ complex which, in turn, is broken in the presence of GSH by the formation of the [Hg(GSH)2]4− complex, releasing free TCPC molecules and triggering the fluorescence turn on. This increase in the fluorescence intensity accurately fits a sigmoidal curve as a function of the GSH concentration, which enables the proposed method to perform quantitative analysis. Furthermore, the specificity of TCPC for the Hg2+ coordination and the selectivity of the TCPC-Hg2+ complex against GSH was demonstrated.
Supplementary Materials
The following supporting information can be downloaded at: https://www.mdpi.com/article/10.3390/molecules28020568/s1, Figure S1: Absorption spectra of a methanol solution of meso-tetrakis(4-carboxyphenyl)porphyrin (TCPP) at different concentrations. Inset: linear fitting of the maximum absorbance vs. [TCPP].; Figure S2: Fluorescence emission spectra ( nm) of a methanol solution of meso-tetrakis(4-carboxyphenyl)porphyrin (TCPP) at different concentrations. Inset: FL emission intensity vs. [TCPP].; Figure S3: TCPC ethanolic solutions with different concentrations of Hg2+ (from A to G: 0, 6.11, 12.23, 24.43, 36.69, 48.91, 61.14 M). See the main text for further details.; Figure S4: TCPC ([TCPC] = 6.15 M) fluorescence dependence with Hg2+ concentration (black dots) and its Stern-Volmer equation linear fitting (red line), nm, nm; Figure S5: Schematic representation of the complex [Hg(GSH)2]4− (see [69] in main article).; Figure S6: Photographs of cuvettes containing a TCPC aqueous solution (left), its corresponding TCPC−Hg2+ complex (center) and after addition of an excess of GSH (right) under visible (a) and UV (b) light.; Figure S7: Absorbance (left) and fluorescence ( nm) (right) spectra of TCPC−Hg2+ complex aqueous solutions (ratio 1:2) at pH 7.4 with different concentrations of GSH.; Figure S8: Absorbance (left) and fluorescence ( nm) (right) spectra of TCPC−Hg2+ complex aqueous solutions (ratio 1:5) at pH 7.4 with different concentrations of GSH.; Table S1: Limit of detection and response rates of various fluorescent sensors toward GSH.
Author Contributions
Writting—original draft: F.G.M. and C.Q.; Investigation: P.G., F.G.M. and C.Q.; Supervision: J.M.P., T.L.-C. and A.M.G.S.; Formal analysis: F.G.M.; Funding acquisition: A.M.G.S. and J.M.P.; Conceptualization: J.M.P., T.L.-C. and A.M.G.S.; Resources: A.M.G.S. and J.M.P. All authors have read and agreed to the published version of the manuscript.
Funding
This research has been funded by the Spanish AEI/MCIN/10.13039/501100011033 within the NextGenerationEU/PRTR funds through the projects PCI2020-112241 (M-ERA.NET 2019 project7106, SALMOS) and PID2019-110430 GB-C22 (ADLIGHT). ERDF (80%) and Andalusian CTEICU/JA in the framework of the Operative Programme FEDERAndalucia 2014–2020 through projects P20 01258 (objective 01) and UPO-1381028 (objective 1.2.3.) also contributed to the present research. This work received support from PT national funds (FCT/MCTES, Fundação para a Ciência e Tecnologia and Ministério da Ciência, Tecnologia e Ensino Superior) through the projects UIDB/50006/2020, UIDP/50006/2020 and EXPL/QUI-OUT/1554/ 2021. A. M. G. Silva thanks FCT (Fundação para a Ciência e Tecnologia) for funding through program DL 57/2016–Norma Transitória.
Institutional Review Board Statement
Not applicable.
Informed Consent Statement
Not applicable.
Data Availability Statement
Not applicable.
Conflicts of Interest
The authors declare no conflict of interest.
References
- Senge, M.O.; Sergeeva, N.N.; Hale, K.J. Classic highlights in porphyrin and porphyrinoid total synthesis and biosynthesis. Chem. Soc. Rev. 2021, 50, 4730–4789. [Google Scholar] [CrossRef] [PubMed]
- Taniguchi, M.; Lindsey, J.S. Synthetic Chlorins, Possible Surrogates for Chlorophylls, Prepared by Derivatization of Porphyrins. Chem. Rev. 2017, 117, 344–535. [Google Scholar] [CrossRef] [PubMed]
- Laranjo, M.; Aguiar, M.C.; Pereira, N.A.; Brites, G.; Nascimento, B.F.; Brito, A.F.; Casalta-Lopes, J.; Gonçalves, A.C.; Sarmento-Ribeiro, A.B.; Pineiro, M.; et al. Platinum(II) ring-fused chlorins as efficient theranostic agents: Dyes for tumor-imaging and photodynamic therapy of cancer. Eur. J. Med. Chem. 2020, 200, 112468. [Google Scholar] [CrossRef]
- Singh, S.; Aggarwal, A.; Bhupathiraju, N.D.K.; Jovanovic, I.R.; Landress, M.; Tuz, M.P.; Gao, R.; Drain, C.M. Comparing a thioglycosylated chlorin and phthalocyanine as potential theranostic agents. Bioorg. Med. Chem. 2020, 28, 115259. [Google Scholar] [CrossRef]
- Srivatsan, A.; Wang, Y.; Joshi, P.; Sajjad, M.; Chen, Y.; Liu, C.; Thankppan, K.; Missert, J.R.; Tracy, E.; Morgan, J.; et al. In Vitro Cellular Uptake and Dimerization of Signal Transducer and Activator of Transcription-3 (STAT3) Identify the Photosensitizing and Imaging-Potential of Isomeric Photosensitizers Derived from Chlorophyll-a and Bacteriochlorophyll-a. J. Med. Chem. 2011, 54, 6859–6873. [Google Scholar] [CrossRef] [PubMed][Green Version]
- De Annunzio, S.R.; Costa, N.C.S.; Graminha, M.A.; Fontana, C.R.; Mezzina, R.D. Chlorin, phthalocyanine, and porphyrin types derivatives in phototreatment of cutaneous manifestations: A review. Int. J. Mol. Sci. 2019, 20, 3861. [Google Scholar] [CrossRef] [PubMed]
- Zhou, X.; Chen, Y.; Su, J.; Tian, X.; Luo, Y.; Luo, L. In situ second-harmonic generation mediated photodynamic therapy by micelles co-encapsulating coordination nanoparticle and photosensitizer. RSC Adv. 2017, 7, 52125–52132. [Google Scholar] [CrossRef]
- Khadria, A.; de Coene, Y.; Gawel, P.; Roche, C.; Clays, K.; Anderson, H.L. Push–pull pyropheophorbides for nonlinear optical imaging. Org. Biomol. Chem. 2017, 15, 947–956. [Google Scholar] [CrossRef]
- Mrinalini, M.; Naresh, M.; Prasanthkumar, S.; Giribabu, L. Porphyrin-based supramolecular assemblies and their applications in NLO and PDT. J. Porphyr. Phthalocyanines 2021, 25, 382–395. [Google Scholar] [CrossRef]
- Jiao, X.; Zhang, W.; Zhang, L.; Cao, Y.; Xu, Z.; Kang, Y.; Xue, P. Rational design of oxygen deficient TiO2−x nanoparticles conjugated with chlorin e6 (Ce6) for photoacoustic imaging-guided photothermal/photodynamic dual therapy of cancer. Nanoscale 2020, 12, 1707–1718. [Google Scholar] [CrossRef]
- Zhu, Q.H.; Zhang, G.H.; Yuan, W.L.; Wang, S.L.; He, L.; Yong, F.; Tao, G.H. Handy fluorescent paper device based on a curcumin derivative for ultrafast detection of peroxide-based explosives. Chem. Commun. 2019, 55, 13661–13664. [Google Scholar] [CrossRef] [PubMed]
- Zheng, X.; Wang, L.; Liu, S.; Zhang, W.; Liu, F.; Xie, Z. Nanoparticles of Chlorin Dimer with Enhanced Absorbance for Photoacoustic Imaging and Phototherapy. Adv. Funct. Mater. 2018, 28, 1706507. [Google Scholar] [CrossRef]
- Tamiaki, H.; Hagio, N.; Tsuzuki, S.; Cui, Y.; Zouta, T.; Wang, X.F.; Kinoshita, Y. Synthesis of carboxylated chlorophyll derivatives and their activities in dye-sensitized solar cells. Tetrahedron 2018, 74, 4078–4085. [Google Scholar] [CrossRef]
- Pineiro, M.; Gomes, C.; Peixoto, M. Mechanochemical in situ generated gas reactant for the solvent-free hydrogenation of porphyrins. Green Chem. Lett. Rev. 2021, 14, 339–344. [Google Scholar] [CrossRef]
- Wang, X.F.; Kitao, O. Natural Chlorophyll-Related Porphyrins and Chlorins for Dye-Sensitized Solar Cells. Molecules 2012, 17, 4484–4497. [Google Scholar] [CrossRef] [PubMed]
- Ptaszek, M. Rational Design of Fluorophores for In Vivo Applications. Prog. Mol. Biol. Transl. Sci. 2013, 113, 59–108. [Google Scholar] [CrossRef] [PubMed]
- Ceroni, P.; Lebedev, A.Y.; Marchi, E.; Yuan, M.; Esipova, T.V.; Bergamini, G.; Wilson, D.F.; Busch, T.M.; Vinogradov, S.A. Evaluation of phototoxicity of dendritic porphyrin-based phosphorescent oxygen probes: An in vitro study. Photochem. Photobiol. Sci. 2011, 10, 1056–1065. [Google Scholar] [CrossRef] [PubMed]
- Tatman, D.; Liddell, P.A.; Moore, T.A.; Gust, D.; Moore, A.L. Carotenohematoporphyrins as Tumor-Imaging Dyes. Synthesis and In Vitro Photophysical Characterization. Photochem. Photobiol. 1998, 68, 459–466. [Google Scholar] [CrossRef]
- Zheng, X.; Wang, L.; Liu, M.; Lei, P.; Liu, F.; Xie, Z. Nanoscale Mixed-Component Metal–Organic Frameworks with Photosensitizer Spatial-Arrangement-Dependent Photochemistry for Multimodal-Imaging-Guided Photothermal Therapy. Chem. Mater. 2018, 30, 6867–6876. [Google Scholar] [CrossRef]
- Banerjee, S.; Phadte, A.A. β-meso-Annulated meso-Tetraarylchlorins: A Study of the Effect of Ring Fusion on Chlorin Conformation and Optical Spectra. ChemistrySelect 2020, 5, 11127–11144. [Google Scholar] [CrossRef]
- Moura, N.M.M.; Monteiro, C.J.P.; Tomé, A.C.; Neves, M.G.P.; Cavaleiro, J.A. Synthesis of chlorins and bacteriochlorins from cycloaddition reactions with porphyrins. Arkivoc 2022, 2022, 54–98. [Google Scholar] [CrossRef]
- Silva, A.M.G.; Tomé, A.C.; Neves, M.G.P.M.S.; Silva, A.M.S.; Cavaleiro, J.A.S. 1,3-Dipolar Cycloaddition Reactions of Porphyrins with Azomethine Ylides. J. Org. Chem. 2005, 70, 2306–2314. [Google Scholar] [CrossRef]
- Vargas, A.P.; Almeida, J.; Gámez, F.; Roales, J.; Queirós, C.; Rangel, M.; Lopes-Costa, T.; Silva, A.M.; Pedrosa, J.M. Synthesis of a highly emissive carboxylated pyrrolidine-fused chlorin for optical sensing of TATP vapours. Dye. Pigment. 2021, 195, 109721. [Google Scholar] [CrossRef]
- Vidyasagar, M.S.; Kodali, M.; Prakash Saxena, P.; Upadhya, D.; Murali Krishna, C.; Vadhiraja, B.M.; Fernandes, D.J.; Bola Sadashiva, S.R. Predictive and Prognostic Significance of Glutathione Levels and DNA Damage in Cervix Cancer Patients Undergoing Radiotherapy. Int. J. Radiat. Oncol. Biol. Phys. 2010, 78, 343–349. [Google Scholar] [CrossRef] [PubMed]
- Forman, H.J.; Zhang, H.; Rinna, A. Glutathione: Overview of its protective roles, measurement, and biosynthesis. Mol. Asp. Med. 2009, 30, 1–12. [Google Scholar] [CrossRef] [PubMed]
- Meister, A. Glutathione metabolism and its selective modification. J. Biol. Chem. 1988, 263, 17205–17208. [Google Scholar] [CrossRef]
- Camera, E.; Picardo, M. Analytical methods to investigate glutathione and related compounds in biological and pathological processes. J. Chromatogr. B 2002, 781, 181–206. [Google Scholar] [CrossRef]
- Townsend, D.M.; Tew, K.D.; Tapiero, H. The importance of glutathione in human disease. Biomed. Pharmacother. 2003, 57, 145–155. [Google Scholar] [CrossRef]
- Meister, A.; Anderson, M.E. Glutathione. Annu. Rev. Biochem. 1983, 52, 711–760. [Google Scholar] [CrossRef]
- Kennedy, L.; Sandhu, J.K.; Harper, M.E.; Cuperlovic-Culf, M. Role of Glutathione in Cancer: From Mechanisms to Therapies. Biomolecules 2020, 10, 1429. [Google Scholar] [CrossRef]
- Estrela, J.M.; Ortega, A.; Obrador, E. Glutathione in Cancer Biology and Therapy. Crit. Rev. Clin. Lab. Sci. 2006, 43, 143–181. [Google Scholar] [CrossRef] [PubMed]
- Hakuna, L.; Doughan, B.; Escobedo, J.O.; Strongin, R.M. A simple assay for glutathione in whole blood. Analyst 2015, 140, 3339–3342. [Google Scholar] [CrossRef] [PubMed]
- Zeevalk, G.D.; Razmpour, R.; Bernard, L.P. Glutathione and Parkinson’s disease: Is this the elephant in the room? Biomed. Pharmacother. 2008, 62, 236–249. [Google Scholar] [CrossRef] [PubMed]
- Pinnen, F.; Sozio, P.; Cacciatore, I.; Cornacchia, C.; Mollica, A.; Iannitelli, A.; DAurizio, E.; Cataldi, A.; Zara, S.; Nasuti, C.; et al. Ibuprofen and Glutathione Conjugate as a Potential Therapeutic Agent for Treating Alzheimer’s Disease. Arch. Pharm. 2011, 344, 139–148. [Google Scholar] [CrossRef] [PubMed]
- Dauer, W.; Przedborski, S. Parkinson’s Disease. Neuron 2003, 39, 889–909. [Google Scholar] [CrossRef]
- Liu, H.; Wang, H.; Shenvi, S.; Hagen, T.M.; Liu, R.M. Glutathione Metabolism during Aging and in Alzheimer Disease. Ann. N. Y. Acad. Sci. 2004, 1019, 346–349. [Google Scholar] [CrossRef]
- McDermott, G.P.; Francis, P.S.; Holt, K.J.; Scott, K.L.; Martin, S.D.; Stupka, N.; Barnett, N.W.; Conlan, X.A. Determination of intracellular glutathione and glutathione disulfide using high performance liquid chromatography with acidic potassium permanganate chemiluminescence detection. Analyst 2011, 136, 2578. [Google Scholar] [CrossRef]
- Reed, D.; Babson, J.; Beatty, P.; Brodie, A.; Ellis, W.; Potter, D. High-performance liquid chromatography analysis of nanomole levels of glutathione, glutathione disulfide, and related thiols and disulfides. Anal. Biochem. 1980, 106, 55–62. [Google Scholar] [CrossRef]
- Wei, L.; Song, Y.; Liu, P.; Kang, X. Polystyrene nanofibers capped with copper nanoparticles for selective extraction of glutathione prior to its determination by HPLC. Microchim. Acta 2018, 185, 321. [Google Scholar] [CrossRef]
- Huang, G.G.; Hossain, M.K.; Han, X.X.; Ozaki, Y. A novel reversed reporting agent method for surface-enhanced Raman scattering; highly sensitive detection of glutathione in aqueous solutions. Analyst 2009, 134, 2468. [Google Scholar] [CrossRef]
- Ahire, D.S.; Basit, A.; Karasu, M.; Prasad, B. Ultrasensitive Quantification of Drug-metabolizing Enzymes and Transporters in Small Sample Volume by Microflow LC-MS/MS. J. Pharm. Sci. 2021, 110, 2833–2840. [Google Scholar] [CrossRef] [PubMed]
- Zhang, L.Y.; Sun, M.X. Fast determination of glutathione by capillary electrophoresis with fluorescence detection using β-cyclodextrin as modifier. J. Chromatogr. B 2009, 877, 4051–4054. [Google Scholar] [CrossRef] [PubMed]
- Chang, C.W.; Tseng, W.L. Gold Nanoparticle Extraction Followed by Capillary Electrophoresis to Determine the Total, Free, and Protein-Bound Aminothiols in Plasma. Anal. Chem. 2010, 82, 2696–2702. [Google Scholar] [CrossRef] [PubMed]
- Lee, P.T.; Goncalves, L.M.; Compton, R.G. Electrochemical determination of free and total glutathione in human saliva samples. Sens. Actuators B Chem. 2015, 221, 962–968. [Google Scholar] [CrossRef]
- Harfield, J.C.; Batchelor-McAuley, C.; Compton, R.G. Electrochemical determination of glutathione: A review. Analyst 2012, 137, 2285. [Google Scholar] [CrossRef] [PubMed]
- Liu, T.; Zhou, M.; Pu, Y.; Liu, L.; Li, F.; Li, M.; Zhang, M. Silver nanoparticle-functionalized 3D flower-like copper (II)-porphyrin framework nanocomposites as signal enhancers for fabricating a sensitive glutathione electrochemical sensor. Sens. Actuators B Chem. 2021, 342, 130047. [Google Scholar] [CrossRef]
- Chen, X.; Zhou, Y.; Peng, X.; Yoon, J. Fluorescent and colorimetric probes for detection of thiols. Chem. Soc. Rev. 2010, 39, 2120. [Google Scholar] [CrossRef]
- Sun, J.; Chen, N.; Chen, X.; Zhang, Q.; Gao, F. Two-Photon Fluorescent Nanoprobe for Glutathione Sensing and Imaging in Living Cells and Zebrafish Using a Semiconducting Polymer Dots Hybrid with Dopamine and β-Cyclodextrin. Anal. Chem. 2019, 91, 12414–12421. [Google Scholar] [CrossRef]
- Ma, H.; Li, X.; Liu, X.; Deng, M.; Wang, X.; Iqbal, A.; Liu, W.; Qin, W. Fluorescent glutathione probe based on MnO2–Si quantum dots nanocomposite directly used for intracellular glutathione imaging. Sens. Actuators B Chem. 2018, 255, 1687–1693. [Google Scholar] [CrossRef]
- Jin, P.; Niu, X.; Zhang, F.; Dong, K.; Dai, H.; Zhang, H.; Wang, W.; Chen, H.; Chen, X. Stable and Reusable Light-Responsive Reduced Covalent Organic Framework (COF-300-AR) as a Oxidase-Mimicking Catalyst for GSH Detection in Cell Lysate. ACS Appl. Mater. Interfaces 2020, 12, 20414–20422. [Google Scholar] [CrossRef]
- Huang, M.; Wang, H.; He, D.; Jiang, P.; Zhang, Y. Ultrafine and monodispersed iridium nanoparticles supported on nitrogen-functionalized carbon: An efficient oxidase mimic for glutathione colorimetric detection. Chem. Commun. 2019, 55, 3634–3637. [Google Scholar] [CrossRef] [PubMed]
- Zhang, X.; Zhang, Q.; Yue, D.; Zhang, J.; Wang, J.; Li, B.; Yang, Y.; Cui, Y.; Qian, G. Flexible Metal-Organic Framework-Based Mixed-Matrix Membranes: A New Platform for H2S Sensors. Small 2018, 14, 1801563. [Google Scholar] [CrossRef] [PubMed]
- Zhang, H.; Wu, S.; Sun, M.; Wang, J.; Gao, M.; Wang, H.B.; Fang, L. In-situ formation of MnO2 nanoparticles on Ru@SiO2 nanospheres as a fluorescent probe for sensitive and rapid detection of glutathione. Spectrochim. Acta Part A Mol. Biomol. Spectrosc. 2022, 283, 121724. [Google Scholar] [CrossRef] [PubMed]
- Gouterman, M. Study of the Effects of Substitution on the Absorption Spectra of Porphin. J. Chem. Phys. 1959, 30, 1139–1161. [Google Scholar] [CrossRef]
- Harvey, P.; Stern, C.; Gros, C.; Guilard, R. The photophysics and photochemistry of cofacial free base and metallated bisporphyrins held together by covalent architectures. Coord. Chem. Rev. 2007, 251, 401–428. [Google Scholar] [CrossRef]
- Satake, A.; Kobuke, Y. Artificial photosynthetic systems: Assemblies of slipped cofacial porphyrins and phthalocyanines showing strong electronic coupling. Org. Biomol. Chem. 2007, 5, 1679–1691. [Google Scholar] [CrossRef]
- Durot, S.; Flamigni, L.; Taesch, J.; Dang, T.; Heitz, V.; Ventura, B. Synthesis and solution studies of silver(I)-assembled porphyrin coordination cages. Chem.-Eur. J. 2014, 20, 9979–9990. [Google Scholar] [CrossRef]
- Telfer, S.; McLean, T.; Waterland, M. Exciton coupling in coordination compounds. Dalton Trans. 2011, 40, 3097–3108. [Google Scholar] [CrossRef]
- Yamada, Y.; Nawate, K.; Maeno, T.; Tanaka, K. Intramolecular strong electronic coupling in a discretely H-aggregated phthalocyanine dimer connected with a rigid linker. Chem. Commun. 2018, 54, 8226–8228. [Google Scholar] [CrossRef]
- Ribó, J.; Bofill, J.; Crusats, J.; Rubires, R. Point-dipole approximation of the exciton coupling model versus type of bonding and of excitons in porphyrin supramolecular structures. Chem.-Eur. J. 2001, 7, 2733–2737. [Google Scholar] [CrossRef]
- Hunter, C.; Sanders, J.; Stone, A. Exciton coupling in porphyrin dimers. Chem. Phys. 1989, 133, 395–404. [Google Scholar] [CrossRef]
- Tran-Thi, T.; Lipskier, J.; Maillard, P.; Momenteau, M.; Lopez-Castillo, J.M.; Jay-Gerin, J.P. Effect of the exciton coupling on the optical and photophysical properties of face-to-face porphyrin dimer and trimer. A treatment including the solvent stabilization effect. J. Phys. Chem. 1992, 96, 1073–1082. [Google Scholar] [CrossRef]
- Meehan, E.V. Synthesis of Pyrrole-Modified Porphyrins: Oxachlorins, and the Beckmann Rearrangement of Octaethyl-2-oxa-chlorin Oxime. Master’s Thesis, The University of Connecticut, Storrs, CT, USA, 2014; p. 90. [Google Scholar]
- Kim, B.F.; Bohandy, J. Spectroscopy of Porphyrins. Johns Hopkins APL Tech. Dig. 1981, 2, 153–163. [Google Scholar]
- Rayati, S.; Zakavi, S.; Ghaemi, A.; Carroll, P.J. Core protonation of meso-tetraphenylporphyrin with tetrafluoroboric acid: Unusual water-mediated hydrogen bonding of H4tpp2+ to the counterion. Tetrahedron Lett. 2008, 49, 664–667. [Google Scholar] [CrossRef]
- Zakavi, S.; Omidyan, R.; Ebrahimi, L.; Heidarizadi, F. Substitution effects on the UV–vis and 1H NMR spectra of the dications of meso and/or β substituted porphyrins with trifluoroacetic acid: Electron-deficient porphyrins compared to the electron-rich ones. Inorg. Chem. Commun. 2011, 14, 1827–1832. [Google Scholar] [CrossRef]
- Zhao, Y.; Cai, X.; Zhang, Y.; Chen, C.; Wang, J.; Pei, R. Porphyrin-based metal–organic frameworks: Protonation induced Q band absorption. Nanoscale 2019, 11, 12250–12258. [Google Scholar] [CrossRef] [PubMed]
- Shaikh, S.M.; Chakraborty, A.; Alatis, J.; Cai, M.; Danilov, E.; Morris, A.J. Light harvesting and energy transfer in a porphyrin-based metal organic framework. Faraday Discuss. 2019, 216, 174–190. [Google Scholar] [CrossRef]
- McAuliffe, C.; Murray, S. Metal complexes of sulphur-containing amino acids. Inorg. Chim. Acta Rev. 1972, 6, 103–121. [Google Scholar] [CrossRef]
- Mah, V.; Jalilehvand, F. Mercury(II) complex formation with glutathione in alkaline aqueous solution. JBIC J. Biol. Inorg. Chem. 2008, 13, 541–553. [Google Scholar] [CrossRef]
- Fuhr, B.J.; Rabenstein, D.L. Nuclear magnetic resonance studies of the solution chemistry of metal complexes. IX. Binding of cadmium, zinc, lead, and mercury by glutathione. J. Am. Chem. Soc. 1973, 95, 6944–6950. [Google Scholar] [CrossRef]
- Oram, P.D.; Fang, X.; Fernando, Q.; Letkeman, P.; Letkeman, D. The Formation Constants of Mercury(II)−Glutathione Complexes. Chem. Res. Toxicol. 1996, 9, 709–712. [Google Scholar] [CrossRef] [PubMed]
- Fernández-Ramos, M.D.; Cuadros-Rodríguez, L.; Arroyo-Guerrero, E.; Capitán-Vallvey, L.F. An IUPAC-based approach to estimate the detection limit in co-extraction-based optical sensors for anions with sigmoidal response calibration curves. Anal. Bioanal. Chem. 2011, 401, 2881–2889. [Google Scholar] [CrossRef] [PubMed]
- Jia, P.; Hou, J.; Yang, K.; Wang, L. On-off-on fluorescent sensor for glutathione based on bifunctional vanadium oxide quantum dots induced spontaneous formation of MnO2 nanosheets. Microchim. Acta 2021, 188, 299. [Google Scholar] [CrossRef] [PubMed]
- Qiu, Y.; Huang, J.; Jia, L. A Turn-On Fluorescent Sensor for Glutathione Based on Bovine Serum Albumin-Stabilized Gold Nanoclusters. Int. J. Anal. Chem. 2018, 2018, 1–5. [Google Scholar] [CrossRef]
- Li, X.-Y.; Zhang, Q.; Wang, N.; Liu, J.-J.; Wang, J. Cu2+ mediated Fluorescence Switching of Graphene Quantum Dots for Highly Selective Detection of Glutathione. Chin. J. Anal. Chem. 2020, 43, 339–346. [Google Scholar] [CrossRef]
- Cai, L.; Fu, Z.; Cui, F. Synthesis of Carbon Dots and their Application as Turn Off–On Fluorescent Sensor for Mercury (II) and Glutathione. J. Fluoresc. 2020, 30, 11–20. [Google Scholar] [CrossRef]
- Yang, R.; Tang, Y.; Zhu, W. Ratiometric Fluorescent Probe for the Detection of Glutathione in Living Cells. Chem. J. Chin. Univ. 2016, 37, 643. [Google Scholar] [CrossRef]
- Gu, J.; Hu, D.; Wang, W.; Zhang, Q.; Meng, Z.; Jia, X.; Xi, K. Carbon dot cluster as an efficient “off–on” fluorescent probe to detect Au(III) and glutathione. Biosens. Bioelectron. 2015, 68, 27–33. [Google Scholar] [CrossRef]
- Wang, X.; Zhang, Y.; Jin, Y.; Wang, S.; Zhang, Z.; Zhou, T.; Zhang, G.; Wang, F. An Off-Off fluorescence sensor based on ZnS quantum dots for detection of glutathione. J. Photochem. Photobiol. A Chem. 2023, 435, 114264. [Google Scholar] [CrossRef]
- Meng, Y.; Guo, Q.; Jiao, Y.; Lei, P.; Shuang, S.; Dong, C. Smartphone-based label-free ratiometric fluorescence detection of sertraline and glutathione based on the use of orange-emission carbon dots. Mater. Today Chem. 2022, 26, 101170. [Google Scholar] [CrossRef]
- Tian, M.; Guo, F.; Sun, Y.; Zhang, W.; Miao, F.; Liu, Y.; Song, G.; Ho, C.L.; Yu, X.; Sun, J.Z.; et al. A fluorescent probe for intracellular cysteine overcoming the interference by glutathione. Org. Biomol. Chem. 2014, 12, 6128. [Google Scholar] [CrossRef] [PubMed]


Disclaimer/Publisher’s Note: The statements, opinions and data contained in all publications are solely those of the individual author(s) and contributor(s) and not of MDPI and/or the editor(s). MDPI and/or the editor(s) disclaim responsibility for any injury to people or property resulting from any ideas, methods, instructions or products referred to in the content. |
© 2023 by the authors. Licensee MDPI, Basel, Switzerland. This article is an open access article distributed under the terms and conditions of the Creative Commons Attribution (CC BY) license (https://creativecommons.org/licenses/by/4.0/).