
Optimization of Ultrasound- and Microwave-Assisted Extraction for the Determination of Phenolic Compounds in Peach Byproducts Using Experimental Design and Liquid Chromatography–Tandem Mass Spectrometry


 ,
, 
 and
and 
Abstract
:1. Introduction
2. Results and Discussion
2.1. Optimization of UAE and MAE by Implementing Design of Experiments (DOE) Models
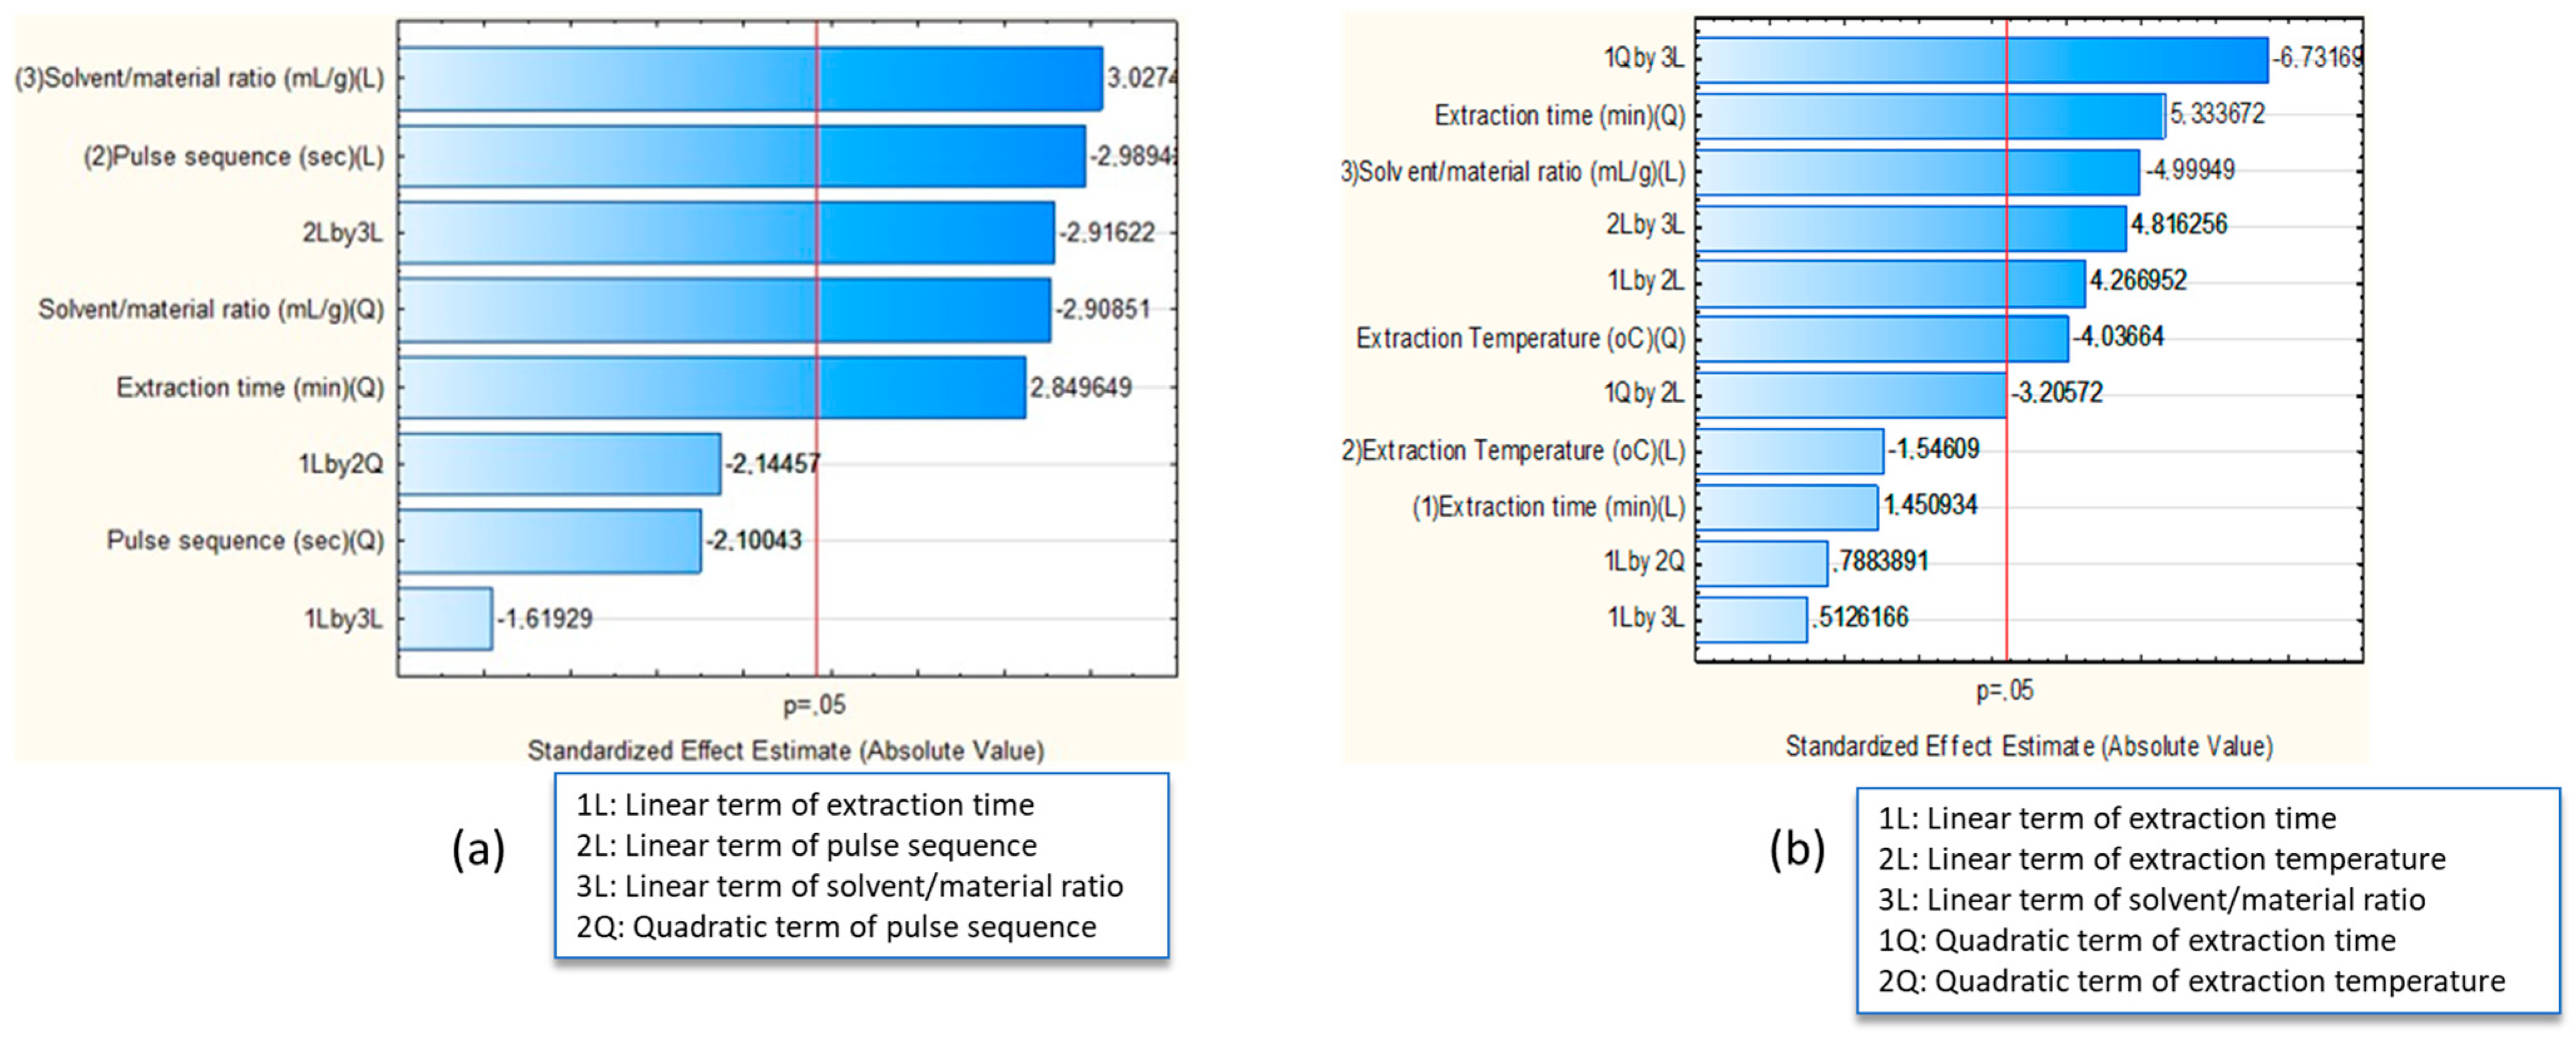
2.1.1. Screening Design (23 Full Factorial Design)
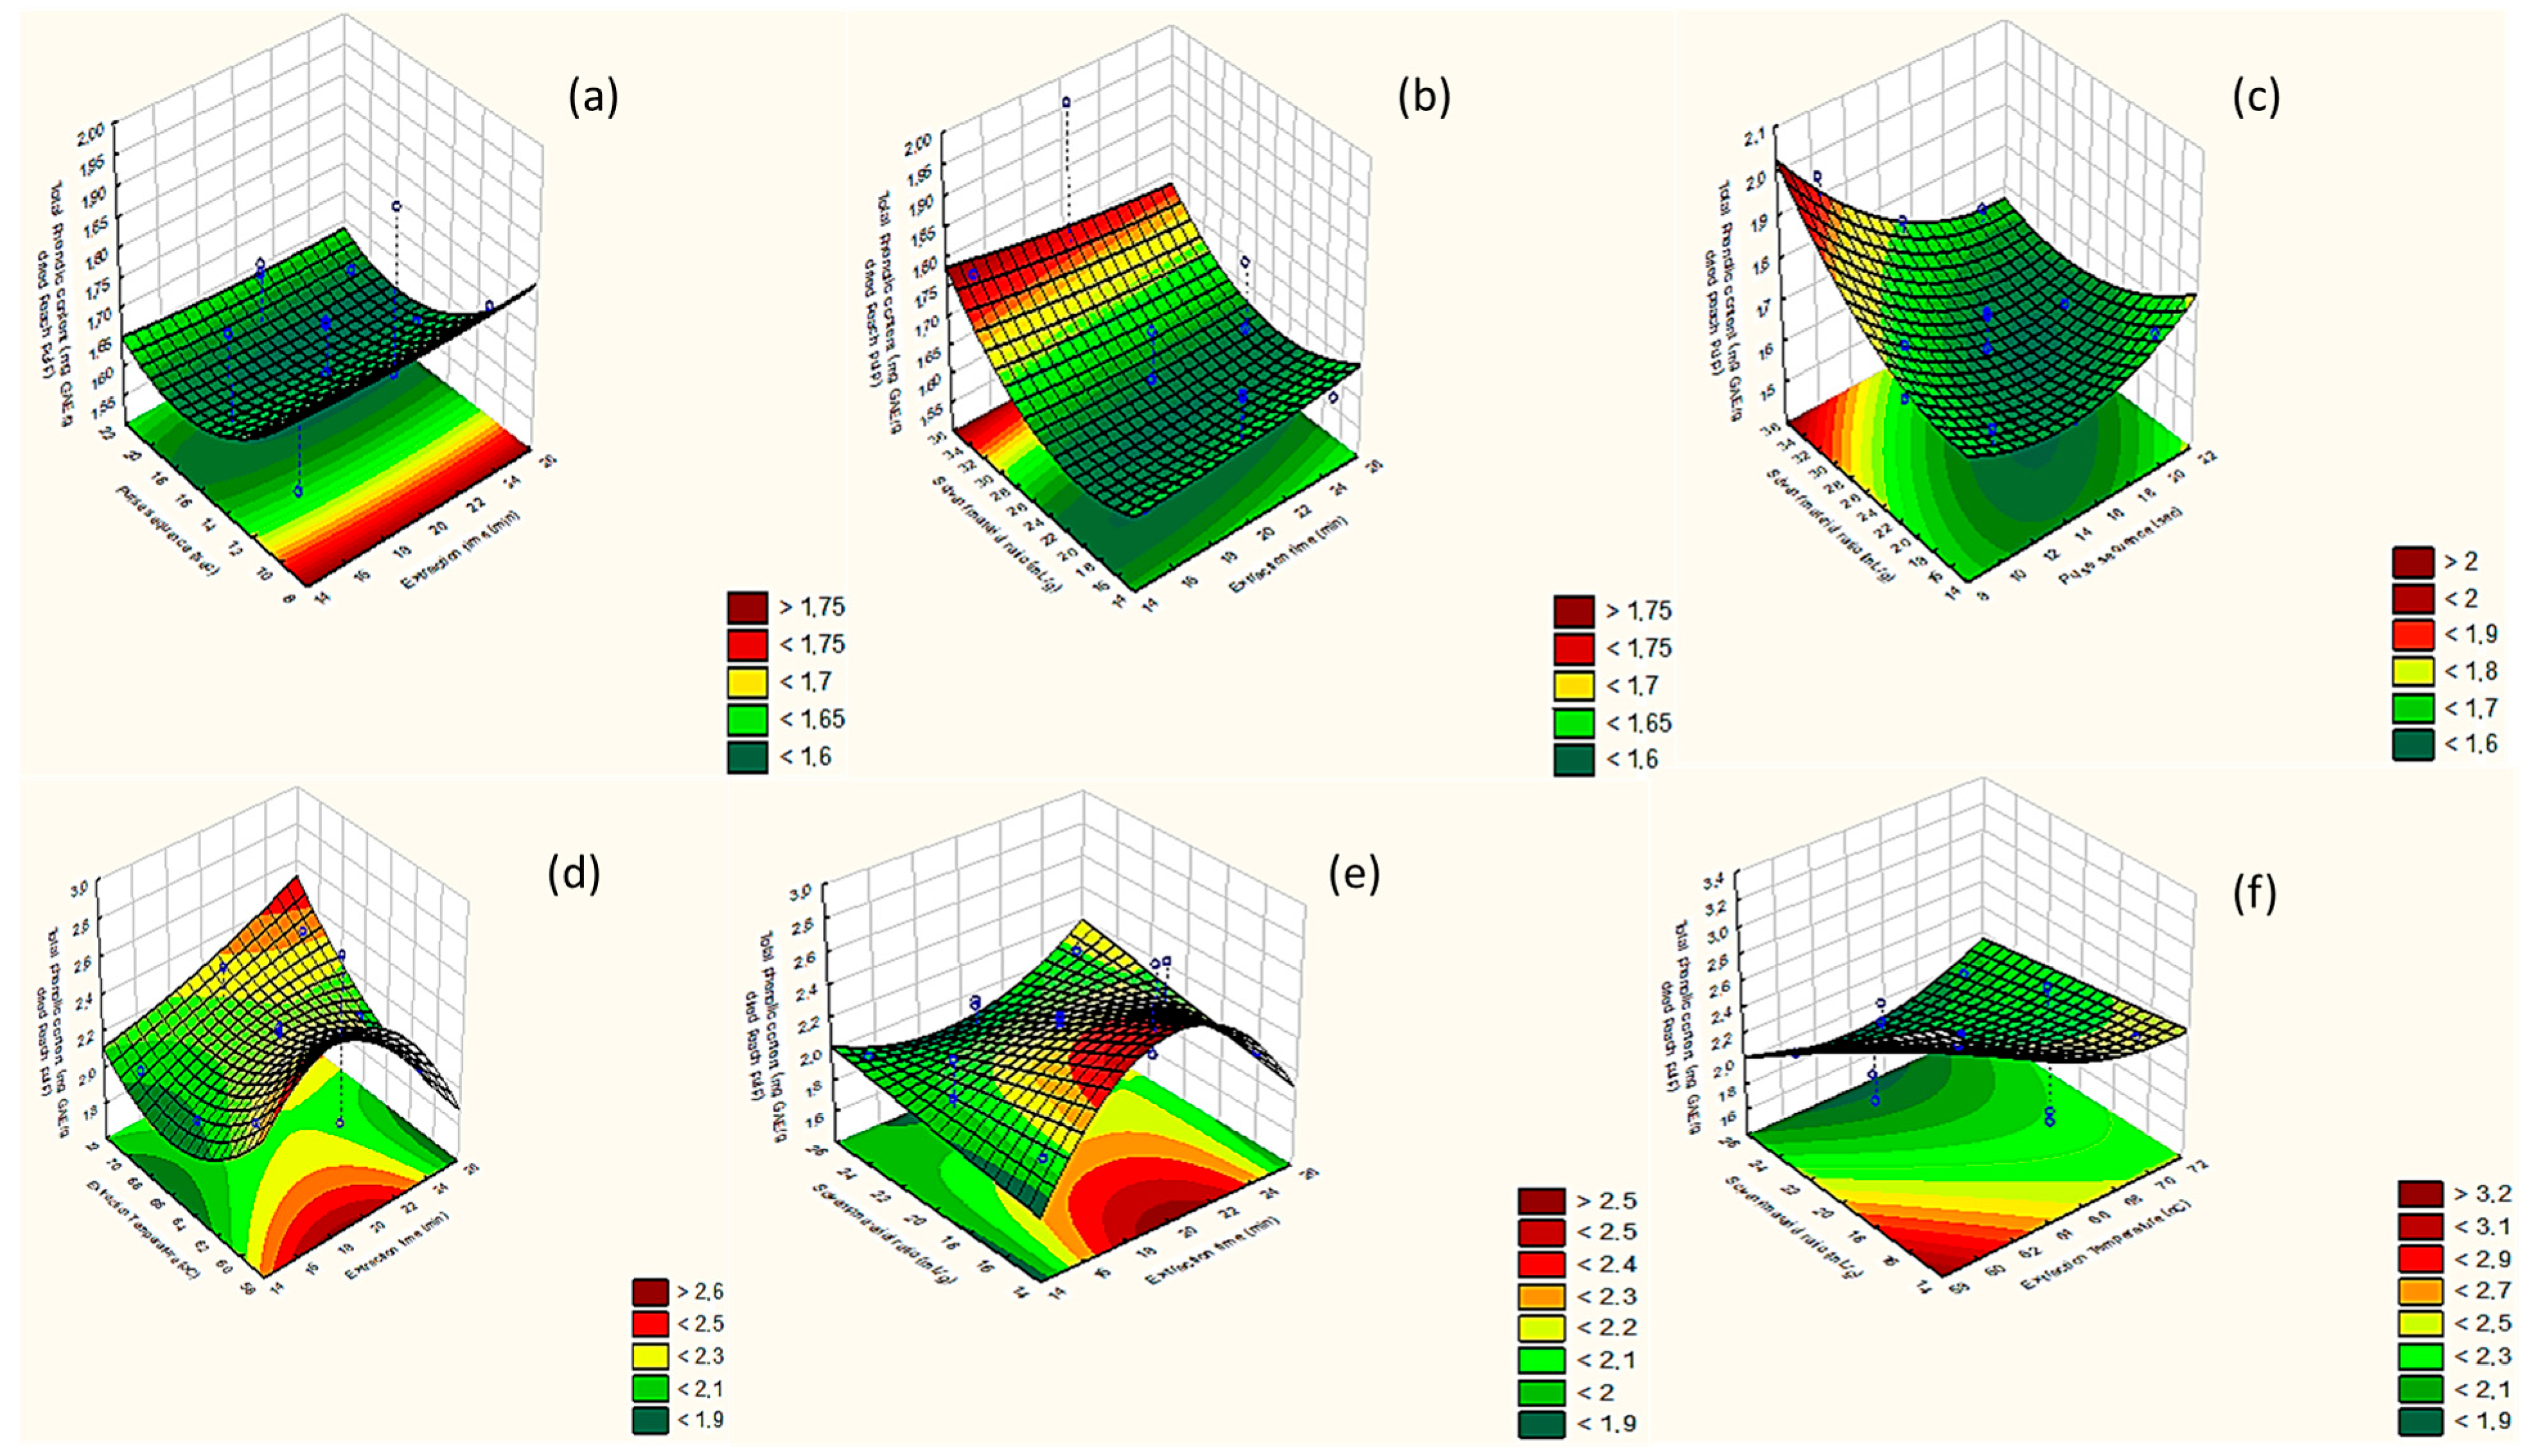
2.1.2. Response Surface Methodology (RSM) for the Optimization of UAE and MAE: Box–Behnken Designs
0.000002 x1x22 − 0.00032 x1x3 − 0.0014 x2x3
0.0036 x1x2 − 0.00027 x1x22 + 0.0011 x12x2 − 0.0908 x1x3 + 0.0023 x12x3 + 0.0058 x2x3
2.1.3. Effect of UAE and MAE Extraction Factors on TPC of Peach Byproducts
Extraction Time
US Pulse Sequence ON Mode
Extraction Temperature of MAE
Solvent/Material Ratio
2.1.4. Optimal Conditions of UAE and MAE
2.2. Antiradical and Antioxidant Activity
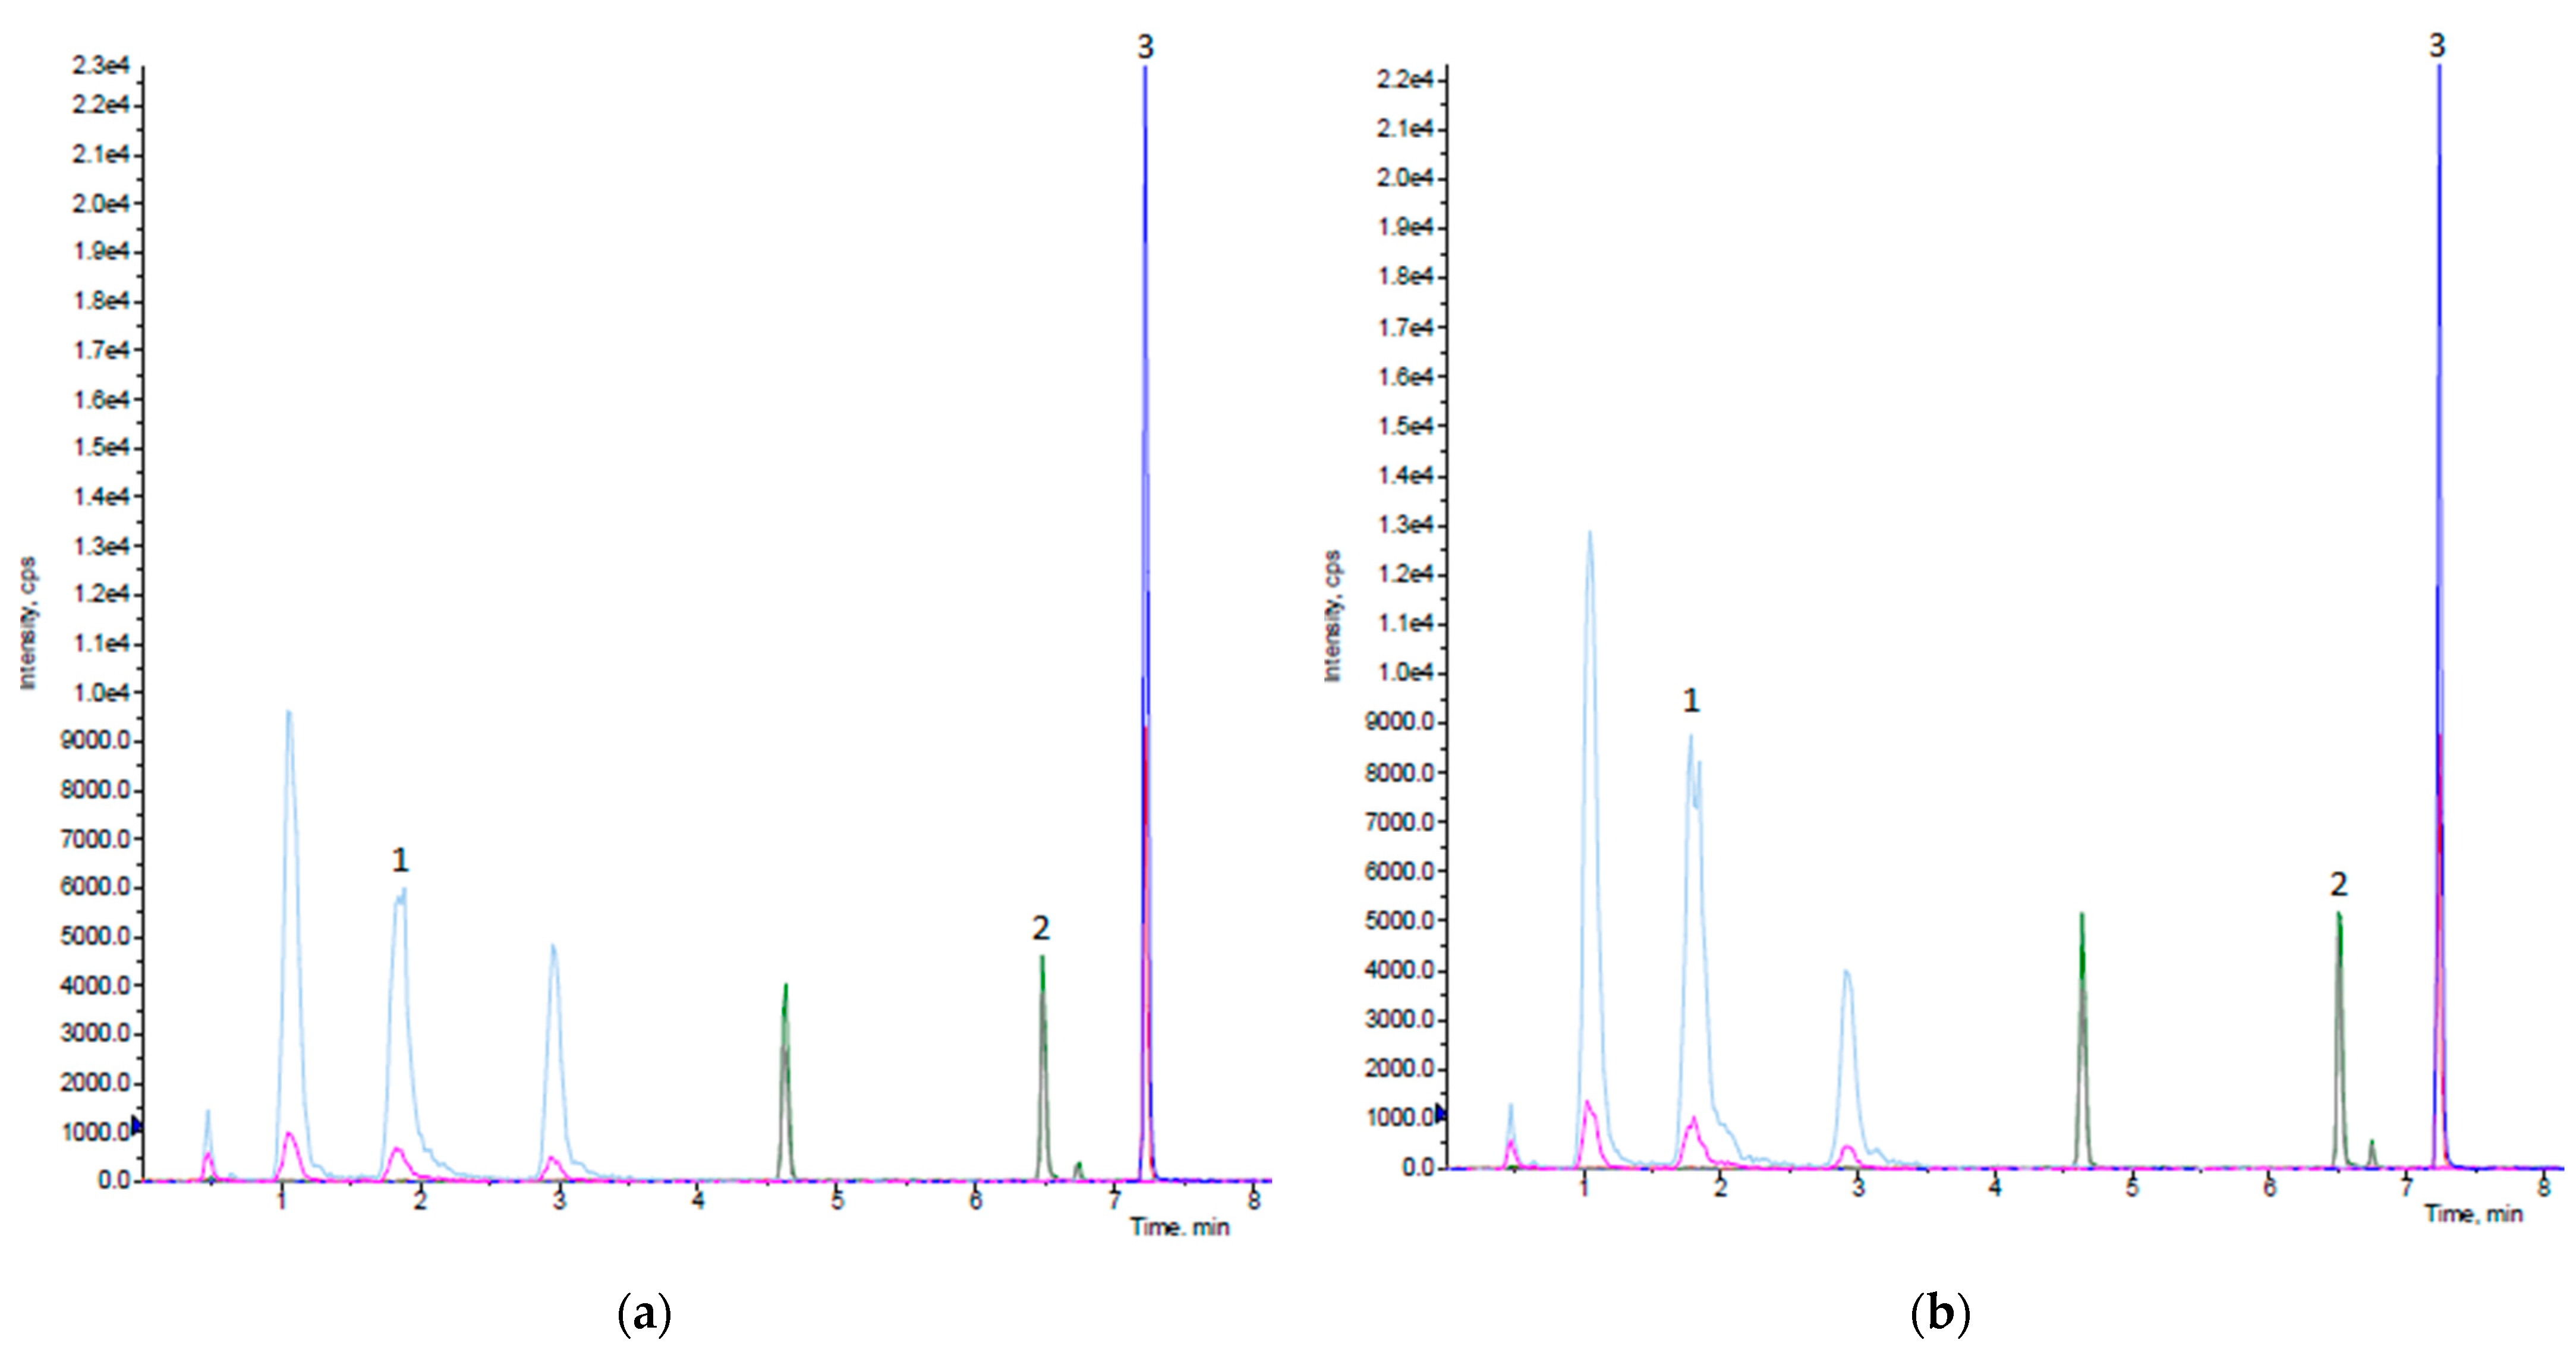
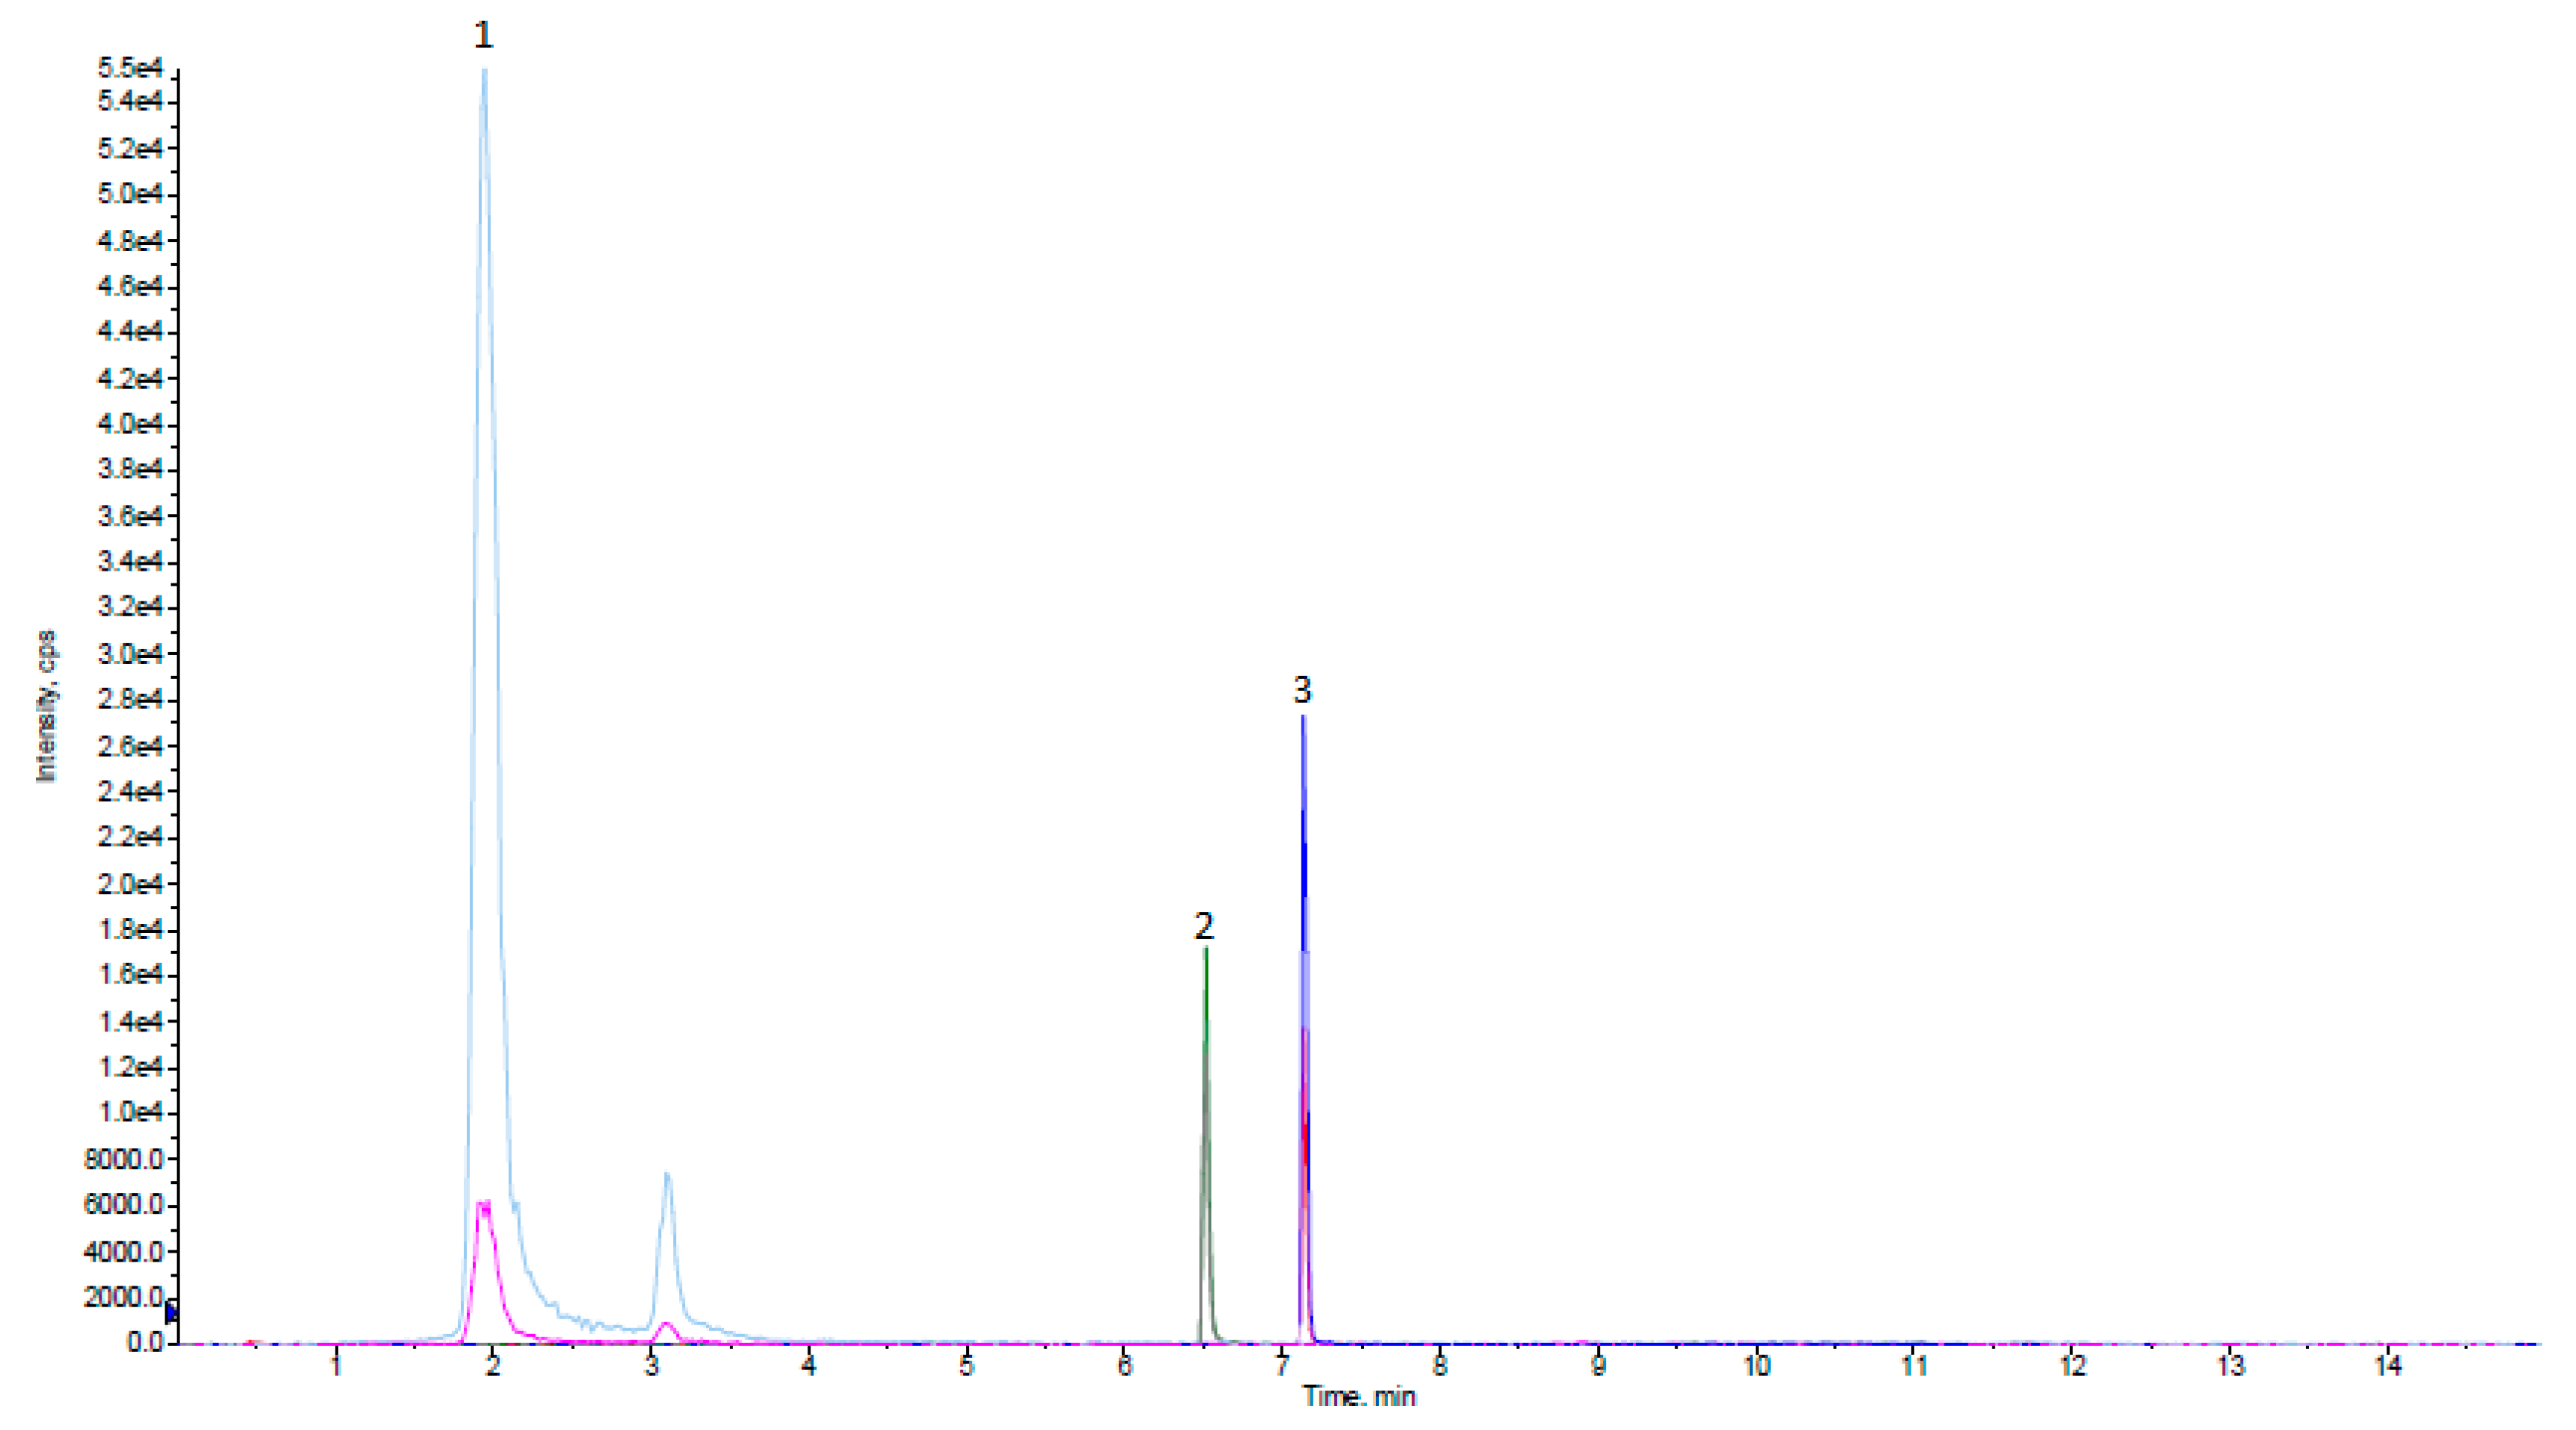
2.3. LC-MS/MS Determination of Targeted Phenolic Compounds
3. Materials and Methods
3.1. Chemicals and Standards
3.2. Peaches Byproducts and Sample Preparation
3.3. Ultrasound-Assisted Extraction (UAE) and Microwave-Assisted Extraction (MAE)
3.4. Experimental Design (DOE) Models
3.5. Determination of Total Phenolic Content
3.6. Antiradical Activity against ABTS●+ Radical
3.7. Ferric Reducing/Antioxidant Power (FRAP) Assay
3.8. LC-MS/MS Quantitative Analysis of Targeted Phenolic Compounds
3.8.1. Preparation of Samples and Standards
3.8.2. HPLC Method
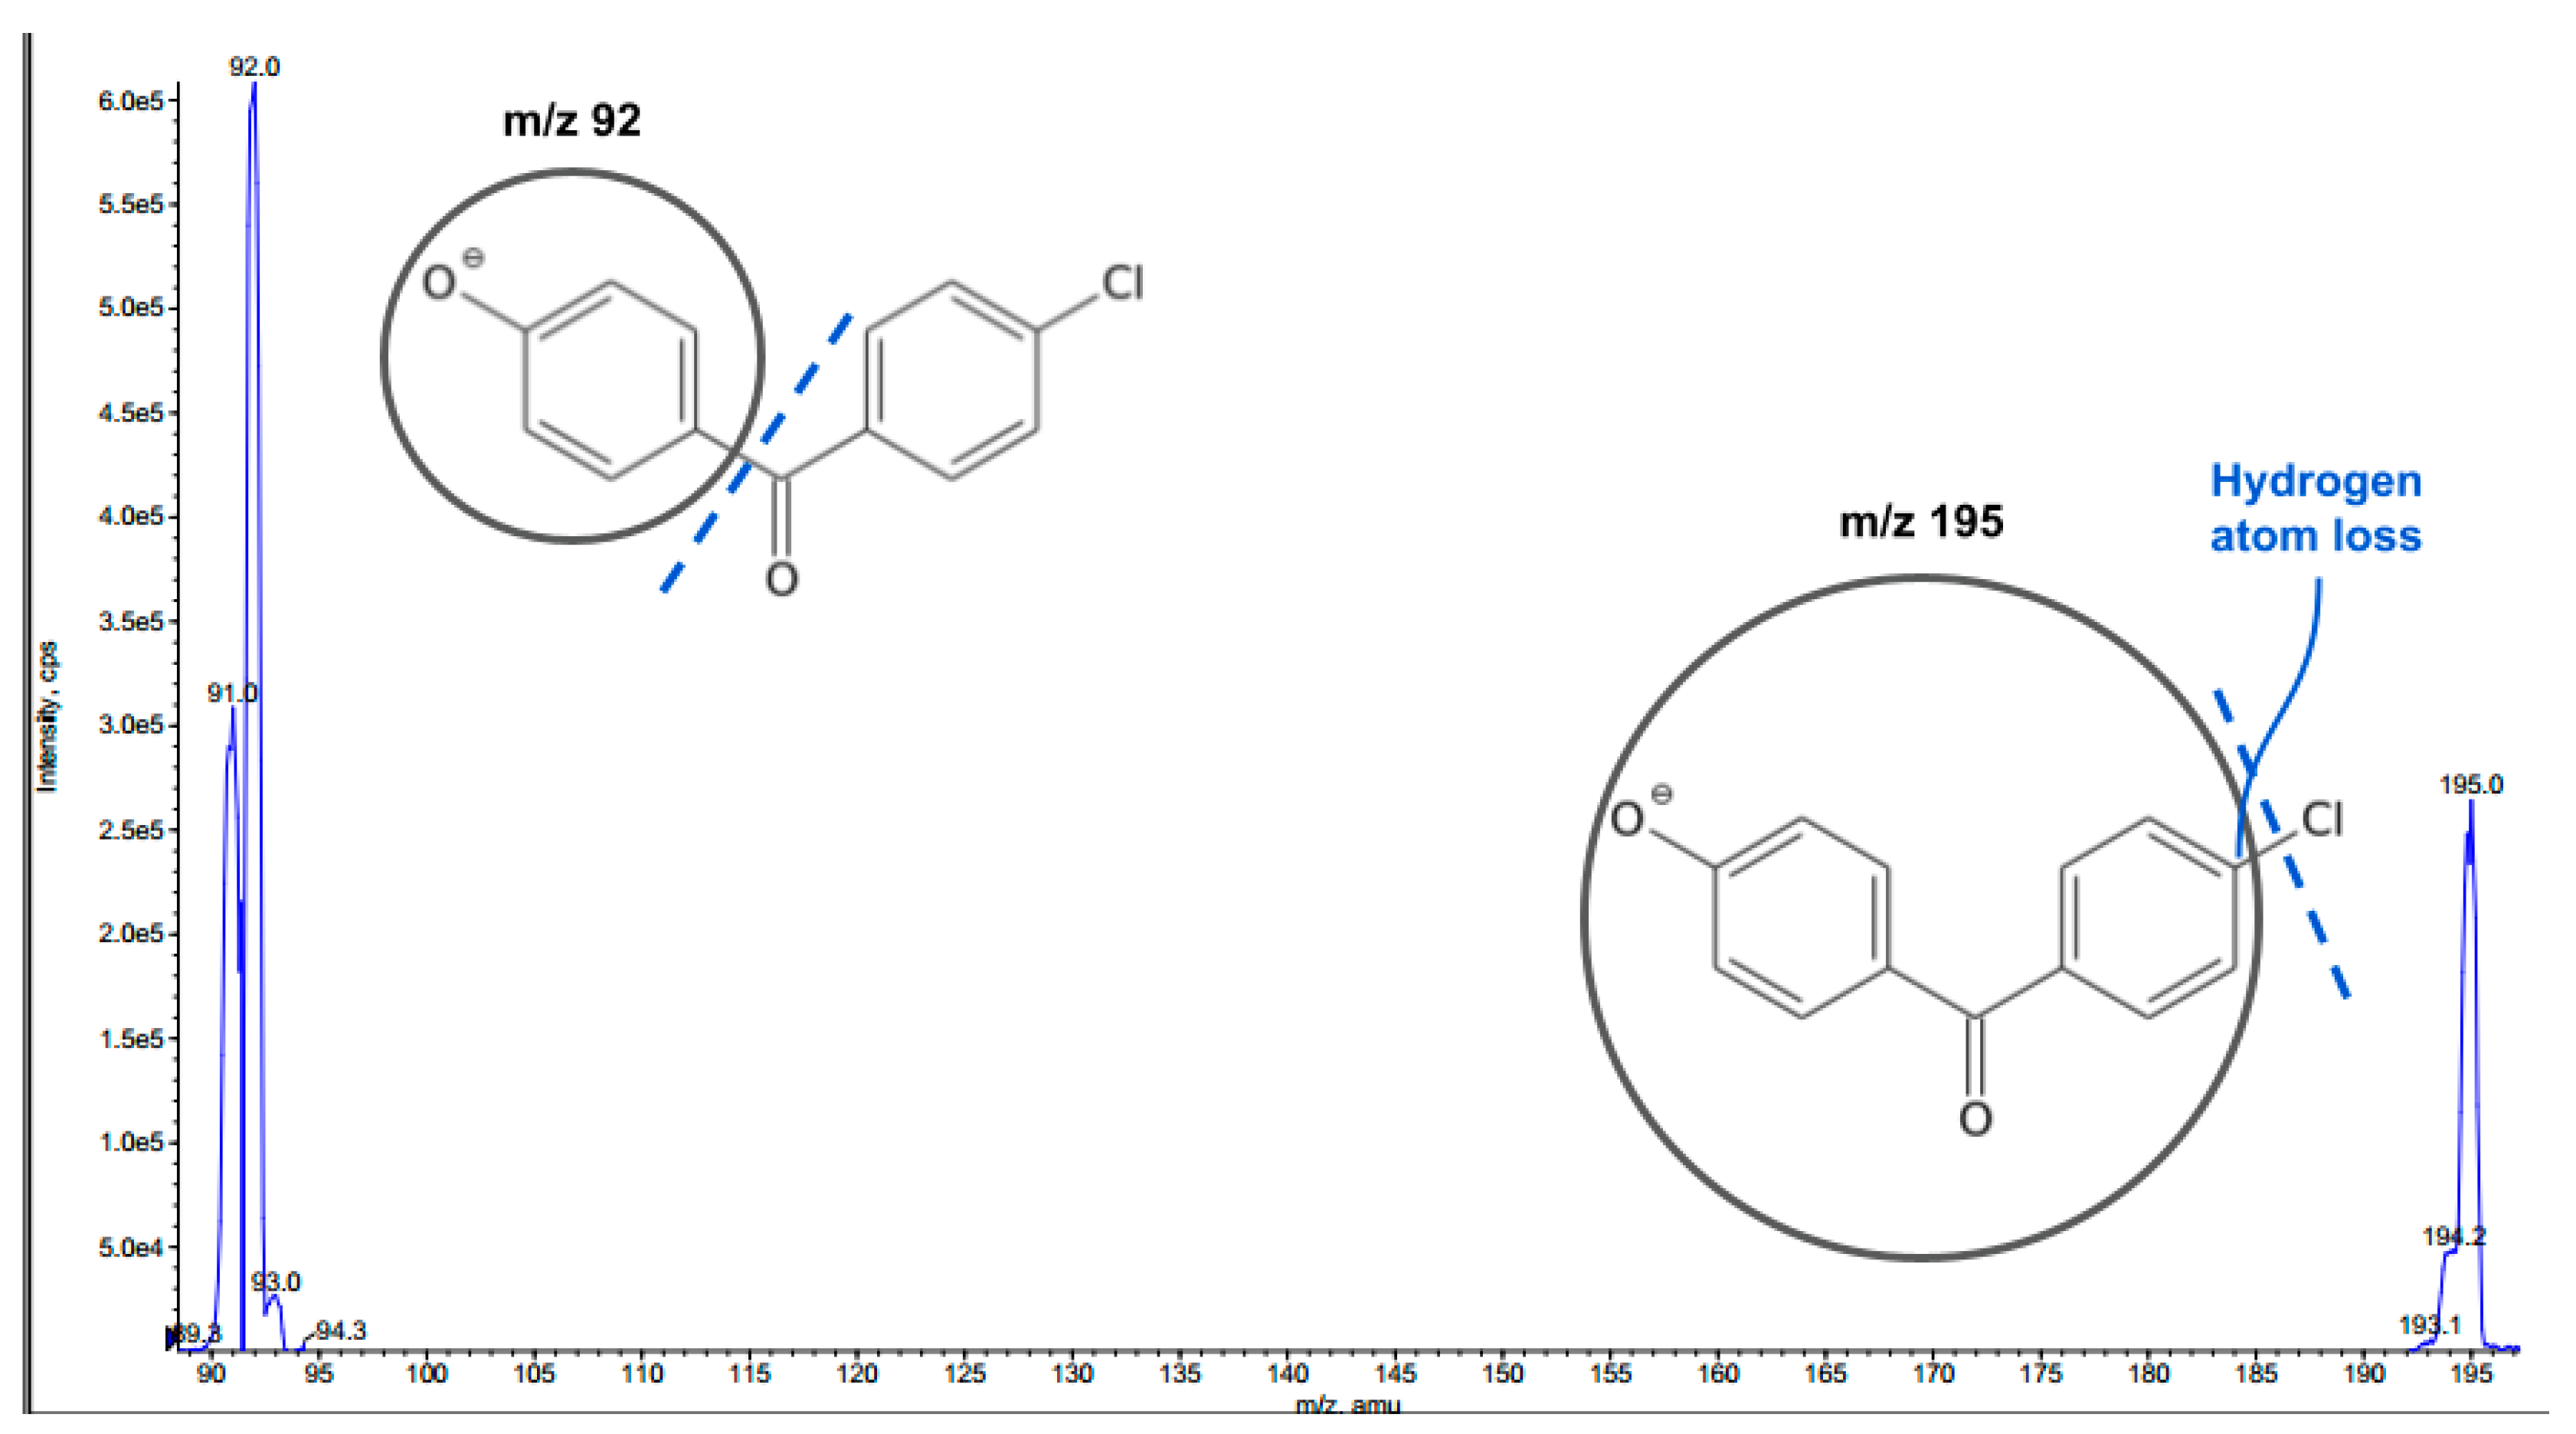
3.8.3. Mass Spectrometric Analysis and Data Interpretation
3.8.4. Method Validation
3.9. Data Analysis
4. Conclusions
Supplementary Materials
Author Contributions
Funding
Institutional Review Board Statement
Informed Consent Statement
Data Availability Statement
Acknowledgments
Conflicts of Interest
Sample Availability
References
- Marcillo-Parra, V.; Tupuna-Yerovi, D.S.; González, Z.; Ruales, J. Encapsulation of bioactive compounds from fruit and vegetable by-products for food application—A review. Trends Food Sci. Technol. 2021, 116, 11–23. [Google Scholar] [CrossRef]
- Torres-León, C.; Ramírez-Guzman, N.; Londoño-Hernandez, L.; Martinez-Medina, G.A.; Díaz-Herrera, R.; Navarro-Macias, V.; Alvarez-Pérez, O.B.; Picazo, B.; Villarreal-Vázquez, M.; Ascacio-Valdes, J.; et al. Food Waste and Byproducts: An Opportunity to Minimize Malnutrition and Hunger in Developing Countries. Front. Sustain. Food Syst. 2018, 2, 52. [Google Scholar] [CrossRef]
- Freitas, L.C.; Barbosa, J.R.; da Costa, A.L.C.; Bezerra, F.W.F.; Pinto, R.H.H.; Junior, R.N.C. From waste to sustainable industry: How can agro-industrial wastes help in the development of new products? Resour. Conserv. Recycl. 2021, 169, 105466. [Google Scholar] [CrossRef]
- Swallah, M.S.; Sun, H.; Affoh, R.; Fu, H.; Yu, H. Antioxidant Potential Overviews of Secondary Metabolites (Polyphenols) in Fruits. Int. J. Food Sci. 2020, 2020, 9081686. [Google Scholar] [CrossRef]
- Jideani, A.I.O.; Silungwe, H.; Takalani, T.; Omolola, A.O.; Udeh, H.O.; Anyasi, T.A. Antioxidant-rich natural fruit and vegetable products and human health. Int. J. Food Prop. 2021, 24, 41–67. [Google Scholar] [CrossRef]
- Nanaki, E.A.; Koroneos, C.J. Sustainable Peach Compote Production: A Life Cycle Thinking Approach. Sustainability 2018, 10, 4229. [Google Scholar] [CrossRef] [Green Version]
- Louka, P.; Kalatzis, N.; Marianos, N. SmartPeach: Smart Farming Practices Enhance the Adaptation of Peach Crops to Climate Change. Chem. Proc. 2022, 10, 96. [Google Scholar] [CrossRef]
- Ran, X.; Zhang, M.; Wang, Y.; Adhikari, B. Novel technologies applied for recovery and value addition of high value compounds from plant byproducts: A review. Crit. Rev. Food Sci. Nutr. 2019, 59, 450–461. [Google Scholar] [CrossRef]
- Lourenço, S.C.; Moldão-Martins, M.; Alves, V.D. Antioxidants of Natural Plant Origins: From Sources to Food Industry Applications. Molecules 2019, 24, 4132. [Google Scholar] [CrossRef] [Green Version]
- Rodríguez García, S.L.; Raghavan, V. Green extraction techniques from fruit and vegetable waste to obtain bioactive compounds—A review. Crit. Rev. Food Sci. Nutr. 2022, 62, 6446–6466. [Google Scholar] [CrossRef]
- Yusoff, I.M.; Taher, Z.M.; Rahmat, Z.; Chua, L.S. A review of ultrasound-assisted extraction for plant bioactive compounds: Phenolics, flavonoids, thymols, saponins and proteins. Food Res. Int. 2022, 157, 111268. [Google Scholar] [CrossRef] [PubMed]
- Bagade, S.B.; Patil, M. Recent Advances in Microwave Assisted Extraction of Bioactive Compounds from Complex Herbal Samples: A Review. Crit. Rev. Anal. Chem. 2021, 51, 138–149. [Google Scholar] [CrossRef] [PubMed]
- More, P.R.; Arya, S.S. Intensification of bio-actives extraction from pomegranate peel using pulsed ultrasound: Effect of factors, correlation, optimization and antioxidant bioactivities. Ultrason. Sonochemistry 2021, 72, 105423. [Google Scholar] [CrossRef] [PubMed]
- Bezerra, M.A.; Santelli, R.E.; Oliveira, E.P.; Villar, L.S.; Escaleira, L.A. Response surface methodology (RSM) as a tool for optimization in analytical chemistry. Talanta 2008, 76, 965–977. [Google Scholar] [CrossRef]
- Vázquez-Espinosa, M.; González de Peredo, A.V.; Ferreiro-González, M.; Barroso, C.G.; Palma, M.; Barbero, G.F.; Espada-Bellido, E. Optimizing and comparing ultrasound-and microwave-assisted extraction methods applied to the extraction of antioxidant capsinoids in peppers. Agronomy 2019, 9, 633. [Google Scholar] [CrossRef] [Green Version]
- Agarwal, C.; Máthé, K.; Hofmann, T.; Csóka, L. Ultrasound-assisted extraction of cannabinoids from Cannabis sativa L. optimized by response surface methodology. J. Food Sci. 2018, 83, 700–710. [Google Scholar] [CrossRef]
- Santos-Zea, L.; Gutierrez-Uribe, J.A.; Benedito, J. Effect of Solvent Composition on Ultrasound-Generated Intensity and Its Influence on the Ultrasonically Assisted Extraction of Bioactives from Agave Bagasse (Agave salmiana). Food Eng. Rev. 2021, 13, 713–725. [Google Scholar] [CrossRef]
- Tsiaka, T.; Fotakis, C.; Lantzouraki, D.Z.; Tsiantas, K.; Siapi, E.; Sinanoglou, V.J.; Zoumpoulakis, P. Expanding the Role of Sub-Exploited DOE-High Energy Extraction and Metabolomic Profiling towards Agro-Byproduct Valorization: The Case of Carotenoid-Rich Apricot Pulp. Molecules 2020, 25, E2702. [Google Scholar] [CrossRef]
- Xie, P.; Huang, L.; Zhang, C.; You, F.; Zhang, Y. Reduced pressure extraction of oleuropein from olive leaves (Olea europaea L.) with ultrasound assistance. Food Bioprod. Process. 2015, 93, 29–38. [Google Scholar] [CrossRef]
- Zhou, T.; Xu, D.-P.; Lin, S.-J.; Li, Y.; Zheng, J.; Zhou, Y.; Zhang, J.-J.; Li, H.-B. Ultrasound-Assisted Extraction and Identification of Natural Antioxidants from the Fruit of Melastoma sanguineum Sims. Molecules 2017, 22, 306. [Google Scholar] [CrossRef]
- Foujdar, R.; Bera, M.B.; Chopra, H.K. Optimization of process variables of probe ultrasonic-assisted extraction of phenolic compounds from the peel of Punica granatum Var. Bhagwa and it’s chemical and bioactivity characterization. J. Food Process. Preserv. 2020, 44, e14317. [Google Scholar] [CrossRef]
- Rodsamran, P.; Sothornvit, R. Extraction of phenolic compounds from lime peel waste using ultrasonic-assisted and microwave-assisted extractions. Food Biosci. 2019, 28, 66–73. [Google Scholar] [CrossRef]
- Azaroual, L.; Liazid, A.; Mansouri, F.E.; Brigui, J.; Ruíz-Rodriguez, A.; Barbero, G.F.; Palma, M. Optimization of the Microwave-Assisted Extraction of Simple Phenolic Compounds from Grape Skins and Seeds. Agronomy 2021, 11, 1527. [Google Scholar] [CrossRef]
- Wang, J.; Ma, H.; Pan, Z.; Qu, W. Sonochemical effect of flat sweep frequency and pulsed ultrasound (FSFP) treatment on stability of phenolic acids in a model system. Ultrason. Sonochemistry 2017, 39, 707–715. [Google Scholar] [CrossRef] [PubMed]
- Alara, O.R.; Abdurahman, N.H. Microwave-assisted extraction of phenolics from Hibiscus sabdariffa calyces: Kinetic modelling and process intensification. Ind. Crops Prod. 2019, 137, 528–535. [Google Scholar] [CrossRef]
- Zhao, C.N.; Zhang, J.J.; Li, Y.; Meng, X.; Li, H.B. Microwave-assisted extraction of phenolic compounds from Melastoma sanguineum fruit: Optimization and identification. Molecules 2018, 23, 2498. [Google Scholar] [CrossRef] [Green Version]
- Dzah, C.S.; Duan, Y.; Zhang, H.; Wen, C.; Zhang, J.; Chen, G.; Ma, H. The effects of ultrasound assisted extraction on yield, antioxidant, anticancer and antimicrobial activity of polyphenol extracts: A review. Food Biosci. 2020, 35, 100547. [Google Scholar] [CrossRef]
- Flórez, N.; Conde, E.; Domínguez, H. Microwave assisted water extraction of plant compounds. J. Chem. Technol. Biotechnol. 2015, 90, 590–607. [Google Scholar] [CrossRef]
- Coelho, E.; Rocha, M.A.M.; Saraiva, J.A.; Coimbra, M.A. Microwave superheated water and dilute alkali extraction of brewers’ spent grain arabinoxylans and arabinoxylo-oligosaccharides. Carbohydr. Polym. 2014, 99, 415–422. [Google Scholar] [CrossRef]
- Xiaokang, W.; Lyng, J.G.; Brunton, N.P.; Cody, L.; Jacquier, J.-C.; Harrison, S.M.; Papoutsis, K. Monitoring the effect of different microwave extraction parameters on the recovery of polyphenols from shiitake mushrooms: Comparison with hot-water and organic-solvent extractions. Biotechnol. Rep. 2020, 27, e00504. [Google Scholar] [CrossRef]
- Bento, C.; Gonçalves, A.C.; Silva, B.; Silva, L.R. Peach (Prunus Persica): Phytochemicals and Health Benefits. Food Rev. Int. 2022, 38, 1703–1734. [Google Scholar] [CrossRef]
- Christofi, M.; Pavlou, A.; Lantzouraki, D.Z.; Tsiaka, T.; Myrtsi, E.; Zoumpoulakis, P.; Haroutounian, S.A.; Mauromoustakos, A.; Biliaderis, C.G.; Manganaris, G.A. Profiling carotenoid and phenolic compounds in fresh and canned fruit of peach cultivars: Impact of genotype and canning on their concentration. J. Food Compos. Anal. 2022, 114, 104734. [Google Scholar] [CrossRef]
- Mihaylova, D.; Popova, A.; Desseva, I.; Petkova, N.; Stoyanova, M.; Vrancheva, R.; Slavov, A.; Slavchev, A.; Lante, A. Comparative Study of Early- and Mid-Ripening Peach (Prunus persica L.) Varieties: Biological Activity, Macro-, and Micro- Nutrient Profile. Foods 2021, 10, 164. [Google Scholar] [CrossRef]
- Bkhairia, I.; Salem, R.B.S.B.; Nasri, R.; Jridi, M.; Ghorbel, S.; Nasri, M. In-vitro antioxidant and functional properties of protein hydrolysates from golden grey mullet prepared by commercial, microbial and visceral proteases. J. Food Sci. Technol. 2016, 53, 2902–2912. [Google Scholar] [CrossRef] [Green Version]
- Mirzaei, M.; Aminlari, M.; Hosseini, E. Antioxidant, ACE-Inhibitory and Antimicrobial Activities of Kluyveromyces marxianus Protein Hydrolysates and Their Peptide Fractions. Funct. Foods Health Dis. 2016, 6, 425–439. [Google Scholar] [CrossRef]
- Zhang, L.; Zhu, C.; Liu, X.; Su, E.; Cao, F.; Zhao, L. Study on Synergistic Antioxidant Effect of Typical Functional Components of Hydroethanolic Leaf Extract from Ginkgo Biloba In Vitro. Molecules 2022, 27, 439. [Google Scholar] [CrossRef] [PubMed]
- Joshi, T.; Deepa, P.R.; Sharma, P.K. Effect of Different Proportions of Phenolics on Antioxidant Potential: Pointers for Bioactive Synergy/Antagonism in Foods and Nutraceuticals. Proc. Natl. Acad. Sci. India Sect. B Biol. Sci. 2022, 92, 939–946. [Google Scholar] [CrossRef]
- Lantzouraki, D.Z.; Sinanoglou, V.J.; Zoumpoulakis, P.; Proestos, C. Comparison of the Antioxidant and Antiradical Activity of Pomegranate (Punica granatum L.) by Ultrasound-Assisted and Classical Extraction. Anal. Lett. 2016, 49, 969–978. [Google Scholar] [CrossRef]
- Kedare, S.B.; Singh, R.P. Genesis and development of DPPH method of antioxidant assay. J. Food Sci. Technol. 2011, 48, 412–422. [Google Scholar] [CrossRef] [PubMed] [Green Version]
- Wołosiak, R.; Drużyńska, B.; Derewiaka, D.; Piecyk, M.; Majewska, E.; Ciecierska, M.; Worobiej, E.; Pakosz, P. Verification of the Conditions for Determination of Antioxidant Activity by ABTS and DPPH Assays—A Practical Approach. Molecules 2022, 27, 50. [Google Scholar] [CrossRef]
- Rossato, S.B.; Haas, C.; Raseira, M.D.C.B.; Moreira, J.C.F.; Zuanazzi, J.Â.S. Antioxidant Potential of Peels and Fleshes of Peaches from Different Cultivars. J. Med. Food 2009, 12, 1119–1126. [Google Scholar] [CrossRef]
- Tomás-Barberán, F.A.; Gil, M.I.; Cremin, P.; Waterhouse, A.L.; Hess-Pierce, B.; Kader, A.A. HPLC− DAD− ESIMS analysis of phenolic compounds in nectarines, peaches, and plums. J. Agric. Food Chem. 2001, 49, 4748–4760. [Google Scholar] [CrossRef] [PubMed]
- Dong, Z.; Wang, R.; Wang, M.; Meng, Z.; Wang, X.; Han, M.; Guo, Y.; Wang, X. Preparation of Naringenin Nanosuspension and Its Antitussive and Expectorant Effects. Molecules 2022, 27, 741. [Google Scholar] [CrossRef]
- Liu, J.; Zhang, X.; Tian, J.; Li, Y.; Liu, Q.; Chen, X.; Feng, F.; Yu, X.; Yang, C. Multiomics analysis reveals that peach gum colouring reflects plant defense responses against pathogenic fungi. Food Chem. 2022, 383, 132424. [Google Scholar] [CrossRef] [PubMed]
- Li, M.; Fokkink, R.; Ni, Y.; Kleijn, J.M. Bovine beta-casein micelles as delivery systems for hydrophobic flavonoids. Food Hydrocoll. 2019, 96, 653–662. [Google Scholar] [CrossRef]
- Nunes, N.M.; Coelho, Y.L.; Castro, J.S.; Vidigal, M.C.T.R.; Mendes, T.A.O.; da Silva, L.H.M.; Pires, A.C.S. Naringenin-lactoferrin binding: Impact on naringenin bitterness and thermodynamic characterization of the complex. Food Chem. 2020, 331, 127337. [Google Scholar] [CrossRef] [PubMed]
- Vargas, F.; Canudas, N.; Miranda, M.A.; Boscar, F. PHOTODEGRADATION AND in vitro PHOTOTOXICITY OF FENOFIBRATE, A PHOTOSENSITIZING ANTI-HYPEIUIPOPROTEINEMIC DRUG. Photochem. Photobiol. 1993, 58, 471–476. [Google Scholar] [CrossRef] [PubMed]
- FDA. US Food and Drug Administration, Bioanalytical Method Validation—Guidance for Industry. Available online: https://www.fda.gov/files/drugs/published/Bioanalytical-Method-Validation-Guidance-for-Industry.pdf (accessed on 7 December 2021).
- Tan, A.; Awaiye, K. Use of Internal Standards in LC-MS Bioanalysis. In Handbook of LC-MS Bioanalysis; John Wiley & Sons, Ltd.: Hoboken, NJ, USA, 2013; pp. 217–227. ISBN 978-1-118-67127-6. [Google Scholar]
- Saidani, F.; Giménez, R.; Aubert, C.; Chalot, G.; Betrán, J.A.; Gogorcena, Y. Phenolic, sugar and acid profiles and the antioxidant composition in the peel and pulp of peach fruits. J. Food Compos. Anal. 2017, 62, 126–133. [Google Scholar] [CrossRef] [Green Version]
- Koprivica, M.R.; Trifković, J.Đ.; Dramićanin, A.M.; Gašić, U.M.; Akšić, M.M.F.; Milojković-Opsenica, D.M. Determination of the phenolic profile of peach (Prunus persica L.) kernels using UHPLC–LTQ OrbiTrap MS/MS technique. Eur. Food Res. Technol. 2018, 244, 2051–2064. [Google Scholar] [CrossRef]
- Tagkouli, D.; Tsiaka, T.; Kritsi, E.; Soković, M.; Sinanoglou, V.J.; Lantzouraki, D.Z.; Zoumpoulakis, P. Towards the Optimization of Microwave-Assisted Extraction and the Assessment of Chemical Profile, Antioxidant and Antimicrobial Activity of Wine Lees Extracts. Molecules 2022, 27, 2189. [Google Scholar] [CrossRef]
- Lantzouraki, D.Z.; Sinanoglou, V.J.; Zoumpoulakis, P.G.; Glamočlija, J.; Ćirić, A.; Soković, M.; Heropoulos, G.; Proestos, C. Antiradical–antimicrobial activity and phenolic profile of pomegranate (Punica granatum L.) juices from different cultivars: A comparative study. RSC Adv. 2014, 5, 2602–2614. [Google Scholar] [CrossRef]
- Lantzouraki, D.Z.; Tsiaka, T.; Soteriou, N.; Asimomiti, G.; Spanidi, E.; Natskoulis, P.; Gardikis, K.; Sinanoglou, V.J.; Zoumpoulakis, P. Antioxidant Profiles of Vitis vinifera L. and Salvia triloba L. Leaves Using High-Energy Extraction Methodologies. J. AOAC Int. 2020, 103, 413–421. [Google Scholar] [CrossRef] [PubMed]
- Tsiaka, T.; Kritsi, E.; Lantzouraki, D.Z.; Christodoulou, P.; Tsigrimani, D.; Strati, I.F.; Sinanoglou, V.J.; Zoumpoulakis, P. Assessing the Phytochemical Profile and Potential of Traditional Herbal Infusions against Aldose Reductase through In Silico Studies and LC-MS/MS Analysis. Appl. Sci. 2022, 12, 8361. [Google Scholar] [CrossRef]
- ICH. International Council for Harmonisation of Technical Requirements for Pharmaceuticals for Human Use, ICH Harmonised Guidelines M10—Bioanalytical Method Validation (Draft Version). Available online: https://www.ema.europa.eu/en/documents/scientific-guideline/draft-ich-guideline-m10-bioanalytical-method-validation-step-2b_en.pdf (accessed on 7 September 2021).
- EMA. European Medicines Agency, Guideline of Bioanalytical Method Validation. Available online: https://www.ema.europa.eu/en/documents/scientific-guideline/guideline-bioanalytical-method-validation_en.pdf (accessed on 7 September 2021).
- Faccin, H.; Viana, C.; Nascimento, P.C.D.; Bohrer, D.; de Carvalho, L.M. Study of ion suppression for phenolic compounds in medicinal plant extracts using liquid chromatography–electrospray tandem mass spectrometry. J. Chromatogr. A 2016, 1427, 111–124. [Google Scholar] [CrossRef] [PubMed]
- Cittan, M.; Çelik, A. Development and Validation of an Analytical Methodology Based on Liquid Chromatography–Electrospray Tandem Mass Spectrometry for the Simultaneous Determination of Phenolic Compounds in Olive Leaf Extract. J. Chromatogr. Sci. 2018, 56, 336–343. [Google Scholar] [CrossRef] [PubMed] [Green Version]
- Liu, Z.; Tu, M.-J.; Zhang, C.; Jilek, J.L.; Zhang, Q.-Y.; Yu, A.-M. A Reliable LC-MS/MS Method for the Quantification of Natural Amino Acids in Mouse Plasma: Method Validation and Application to a Study on Amino Acid Dynamics during Hepatocellular Carcinoma Progression. J. Chromatogr. B 2019, 1124, 72–81. [Google Scholar] [CrossRef]


| Extraction Factors | Optimal Values | |
|---|---|---|
| UAE | MAE | |
| Extraction solvent (% v/v) | Methanol:Water 4:1 | Methanol:Water 4:1 |
| Extraction time (min) | 15 | 20 |
| Pulse sequence ON mode (s) | 8 | - |
| Pulse sequence OFF mode (s) | 5 | - |
| Extraction temperature (°C) | 35 | 58 |
| Solvent/material ratio (mL g−1) | 35 | 16 |
| US or MW power (W) | 600 | 50 |
| TPC at optimal conditions (mg of GAE g−1 dry sample) (±stdev), n = 3 1 | 2.72 ± 0.30 b | 3.067 ± 0.027 a |
| Extract Type | mg TE·g−1 Dry Sample (t = 5 min) | mg TE·g−1 Dry Sample (Τplateau = 3 h) | mg Fe(II)·g−1 Dry Sample |
|---|---|---|---|
| UAEoptimal | 5.70 (±0.41) 1,a | 9.84 (±0.95) a | 2.534 (±0.066) b |
| MAEoptimal | 6.06 (±0.48) a | 9.83 (±0.95) a | 2.742 (±0.075) a |
| Extraction Method | Run | Chlorogenic Acid (μg·g−1 Dry Sample) | Naringenin (μg·g−1 Dry Sample) |
|---|---|---|---|
| 23 design | |||
| UAE | 5 | 289.1 ± 4.0 1,c | 7.33 ± 0.28 c |
| 6 | 284 ± 10 c | 6.89 ± 0.17 c | |
| MAE | 3 | 285 ± 21 c | 6.27 ± 0.21 d |
| 7 | 348.5 ± 7.7 a | 7.98 ± 0.35 b | |
| BBD design | |||
| UAE | 3 | 231.2 ± 5.9 d | 5.969 ± 0.039 e,f |
| 11 | 314.4 ± 4.2 b | 7.71 ± 0.36 b,c | |
| MAE | 7 | 290.4 ± 8.5 c | 6.02 ± 0.27 d,e |
| 9 | 235.3 ± 7.8 d | 5.92 ± 0.29 d,f | |
| Optimal conditions | |||
| UAE | optimal | 351.1 ± 8.9 a | 7.13 ± 0.36 c |
| ΜAE | optimal | 295 ± 12 c | 9.42 ± 0.32 a |
| 23 Full Factorial Design | |||
| Coded values | −1 | 0 | +1 |
| Extraction time (X1, min) | 5 | - | 25 |
| Pulse sequence ON (UAE) (X2, s) | 10 | - | 30 |
| Extraction temperature (MAE) (X2, °C) | 50 | - | 70 |
| Solvent/material ratio (X3, mL g−1) | 20 | - | 50 |
| Box–Behnken design | |||
| Coded values for UAE | −1 | 0 | +1 |
| Extraction time (X1, min) | 15 | 20 | 25 |
| Pulse sequence ON (X2, s) | 10 | 15 | 20 |
| Solvent/material ratio (X3, mL g−1) | 15 | 25 | 35 |
| Coded values for MAE | −1 | 0 | +1 |
| Extraction time (X1, min) | 15 | 20 | 25 |
| Extraction temperature (X2, °C) | 60 | 65 | 70 |
| Solvent/material ratio (X3, mL g−1) | 15 | 20 | 25 |
| Compound | Molecular Structure 2 | MolecularFormula | Rt 1 (min) | MRM Transition (m/z) | Product Ion | DP 1 (V) | EP 1 (V) | CEP 1 (V) | CE 1 (eV) | CXP 1 (V) |
|---|---|---|---|---|---|---|---|---|---|---|
| Chlorogenic acid | C16H18O9 | 1.9 | 353.0 > 191.1 | qualifier | −50 | −4.5 | −14 | −26 | −4 | |
| 353.0 > 84.8 | quantifier | −50 | −4.5 | −14 | −56 | 0 | ||||
| Naringenin | 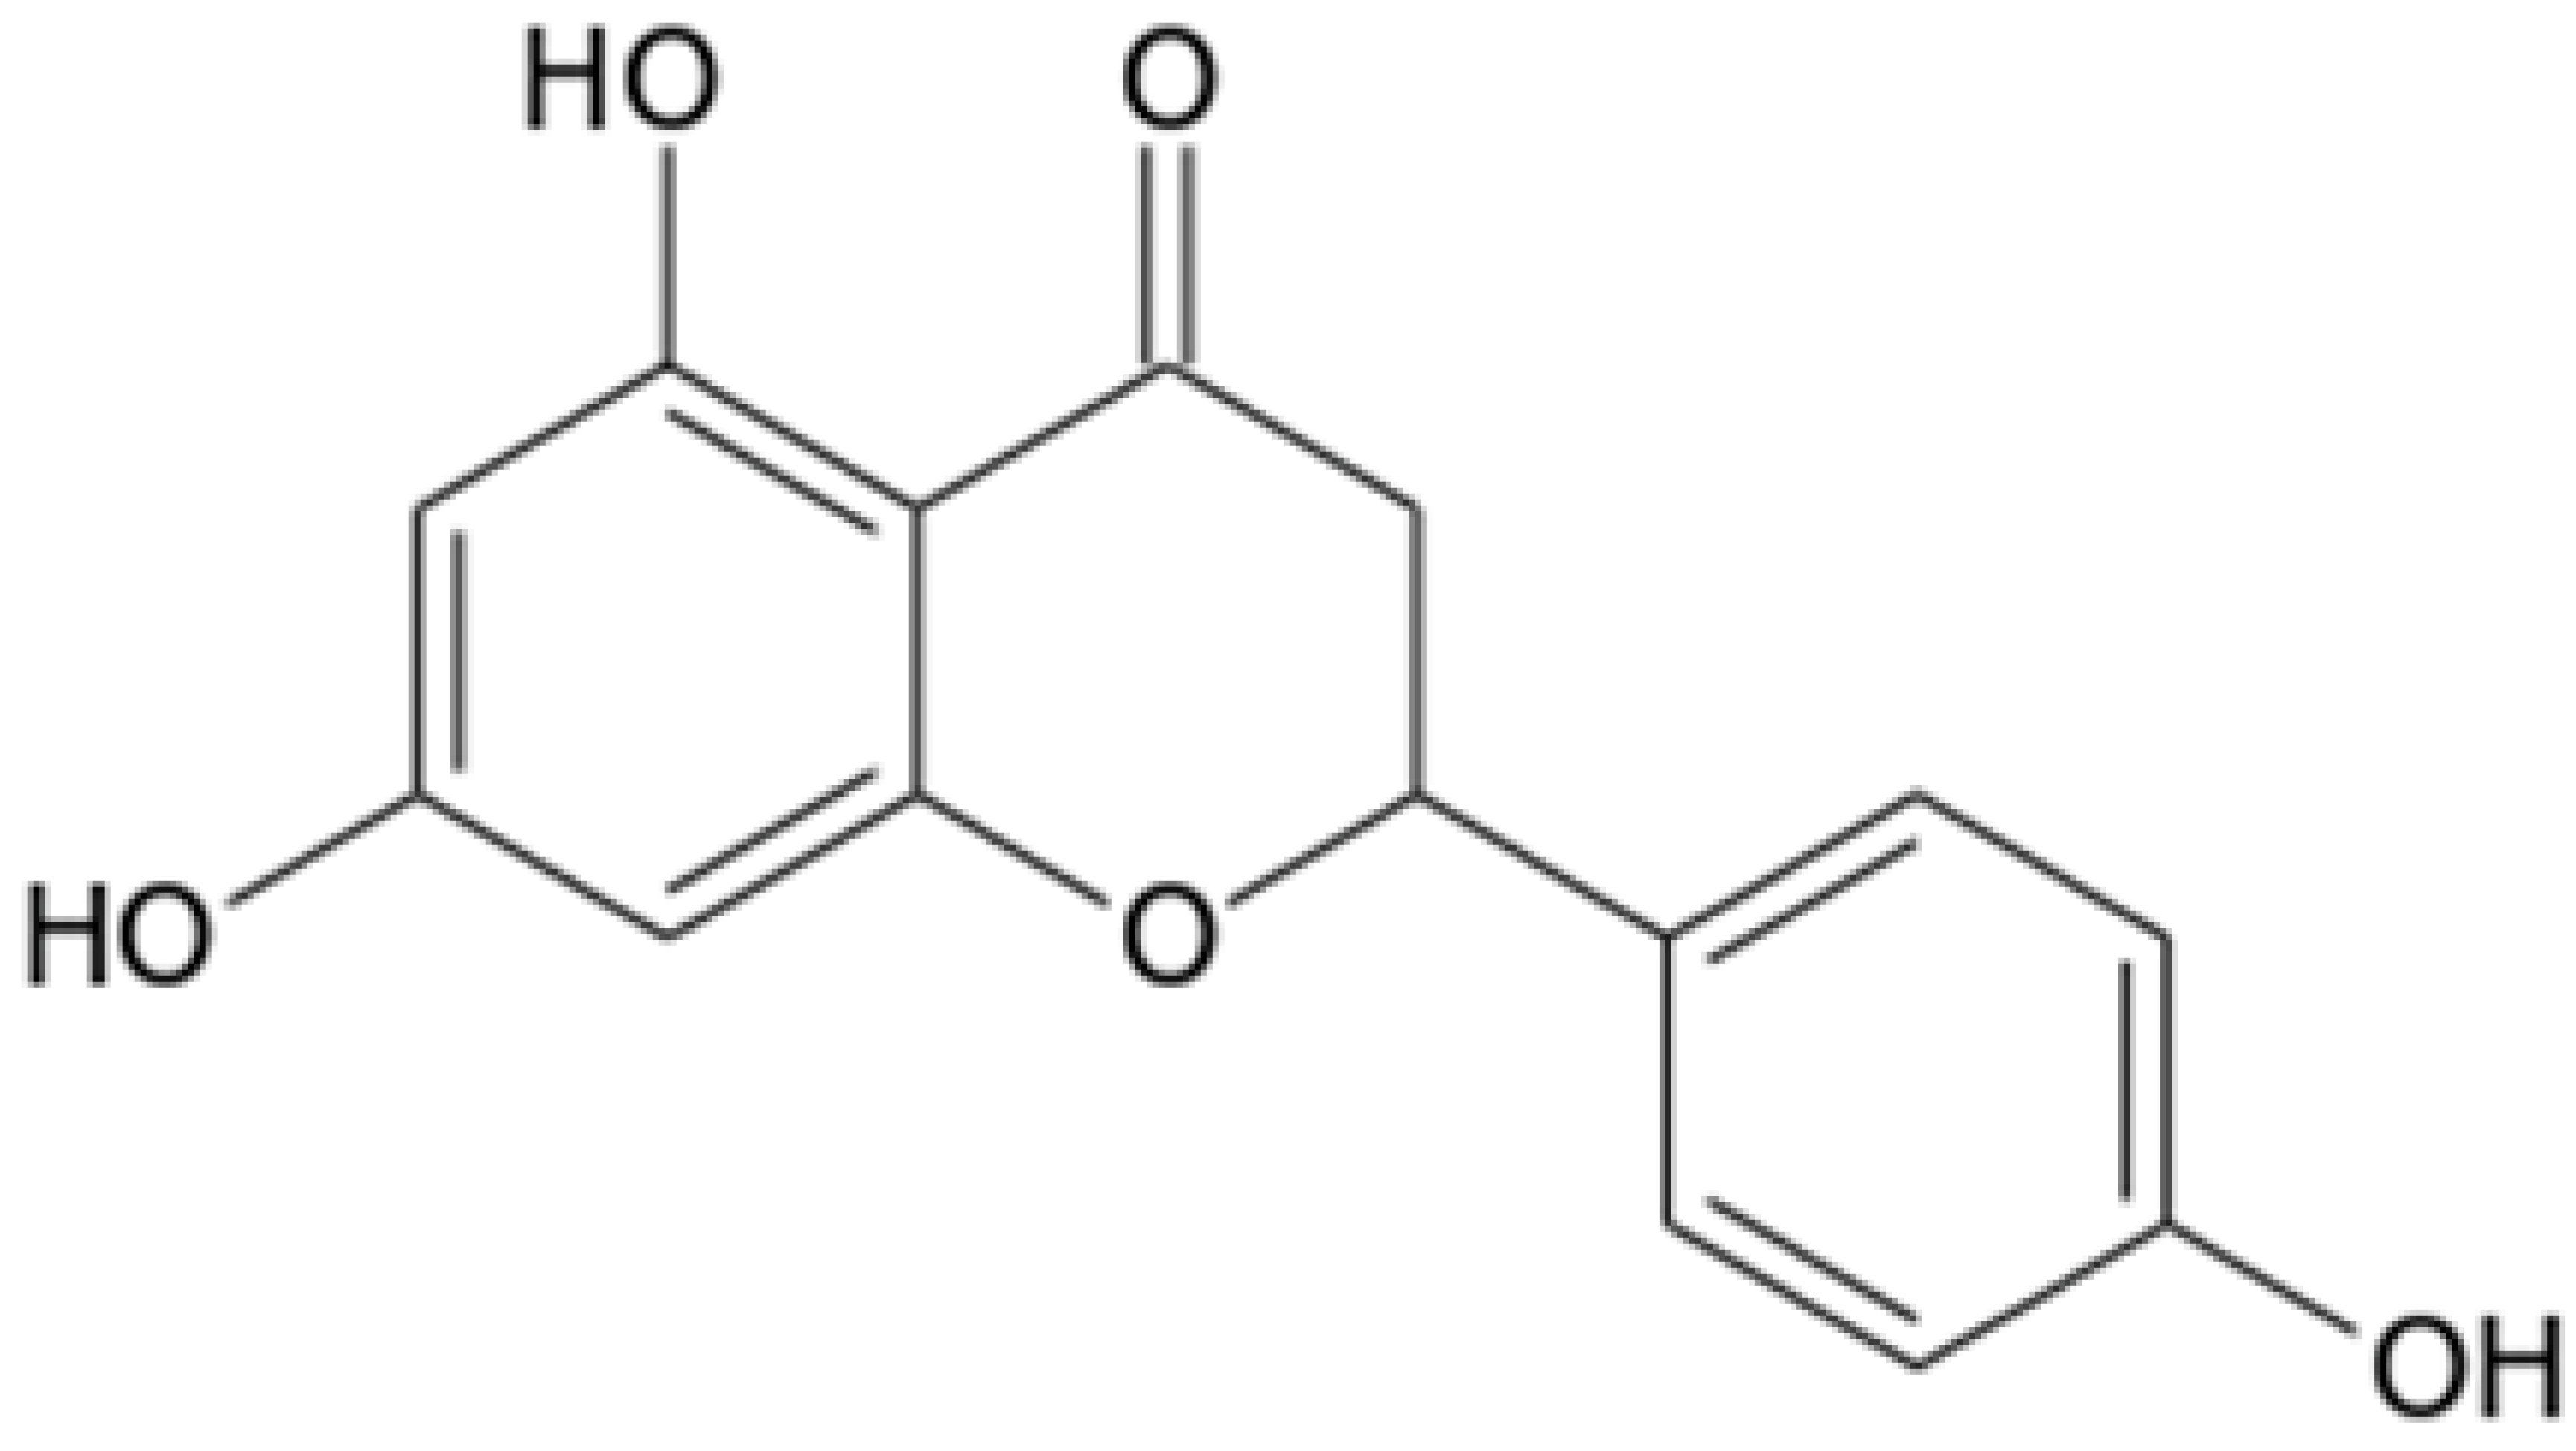 | C15H12O5 | 6.5 | 270.9 > 151.0 | qualifier | −55 | −6.5 | −14 | −26 | −2 |
| 270.9 > 119.1 | quantifier | −55 | −6.5 | −14 | −34 | −2 | ||||
| 4-Chloro-4′-hydroxybenzophenone (IS) | 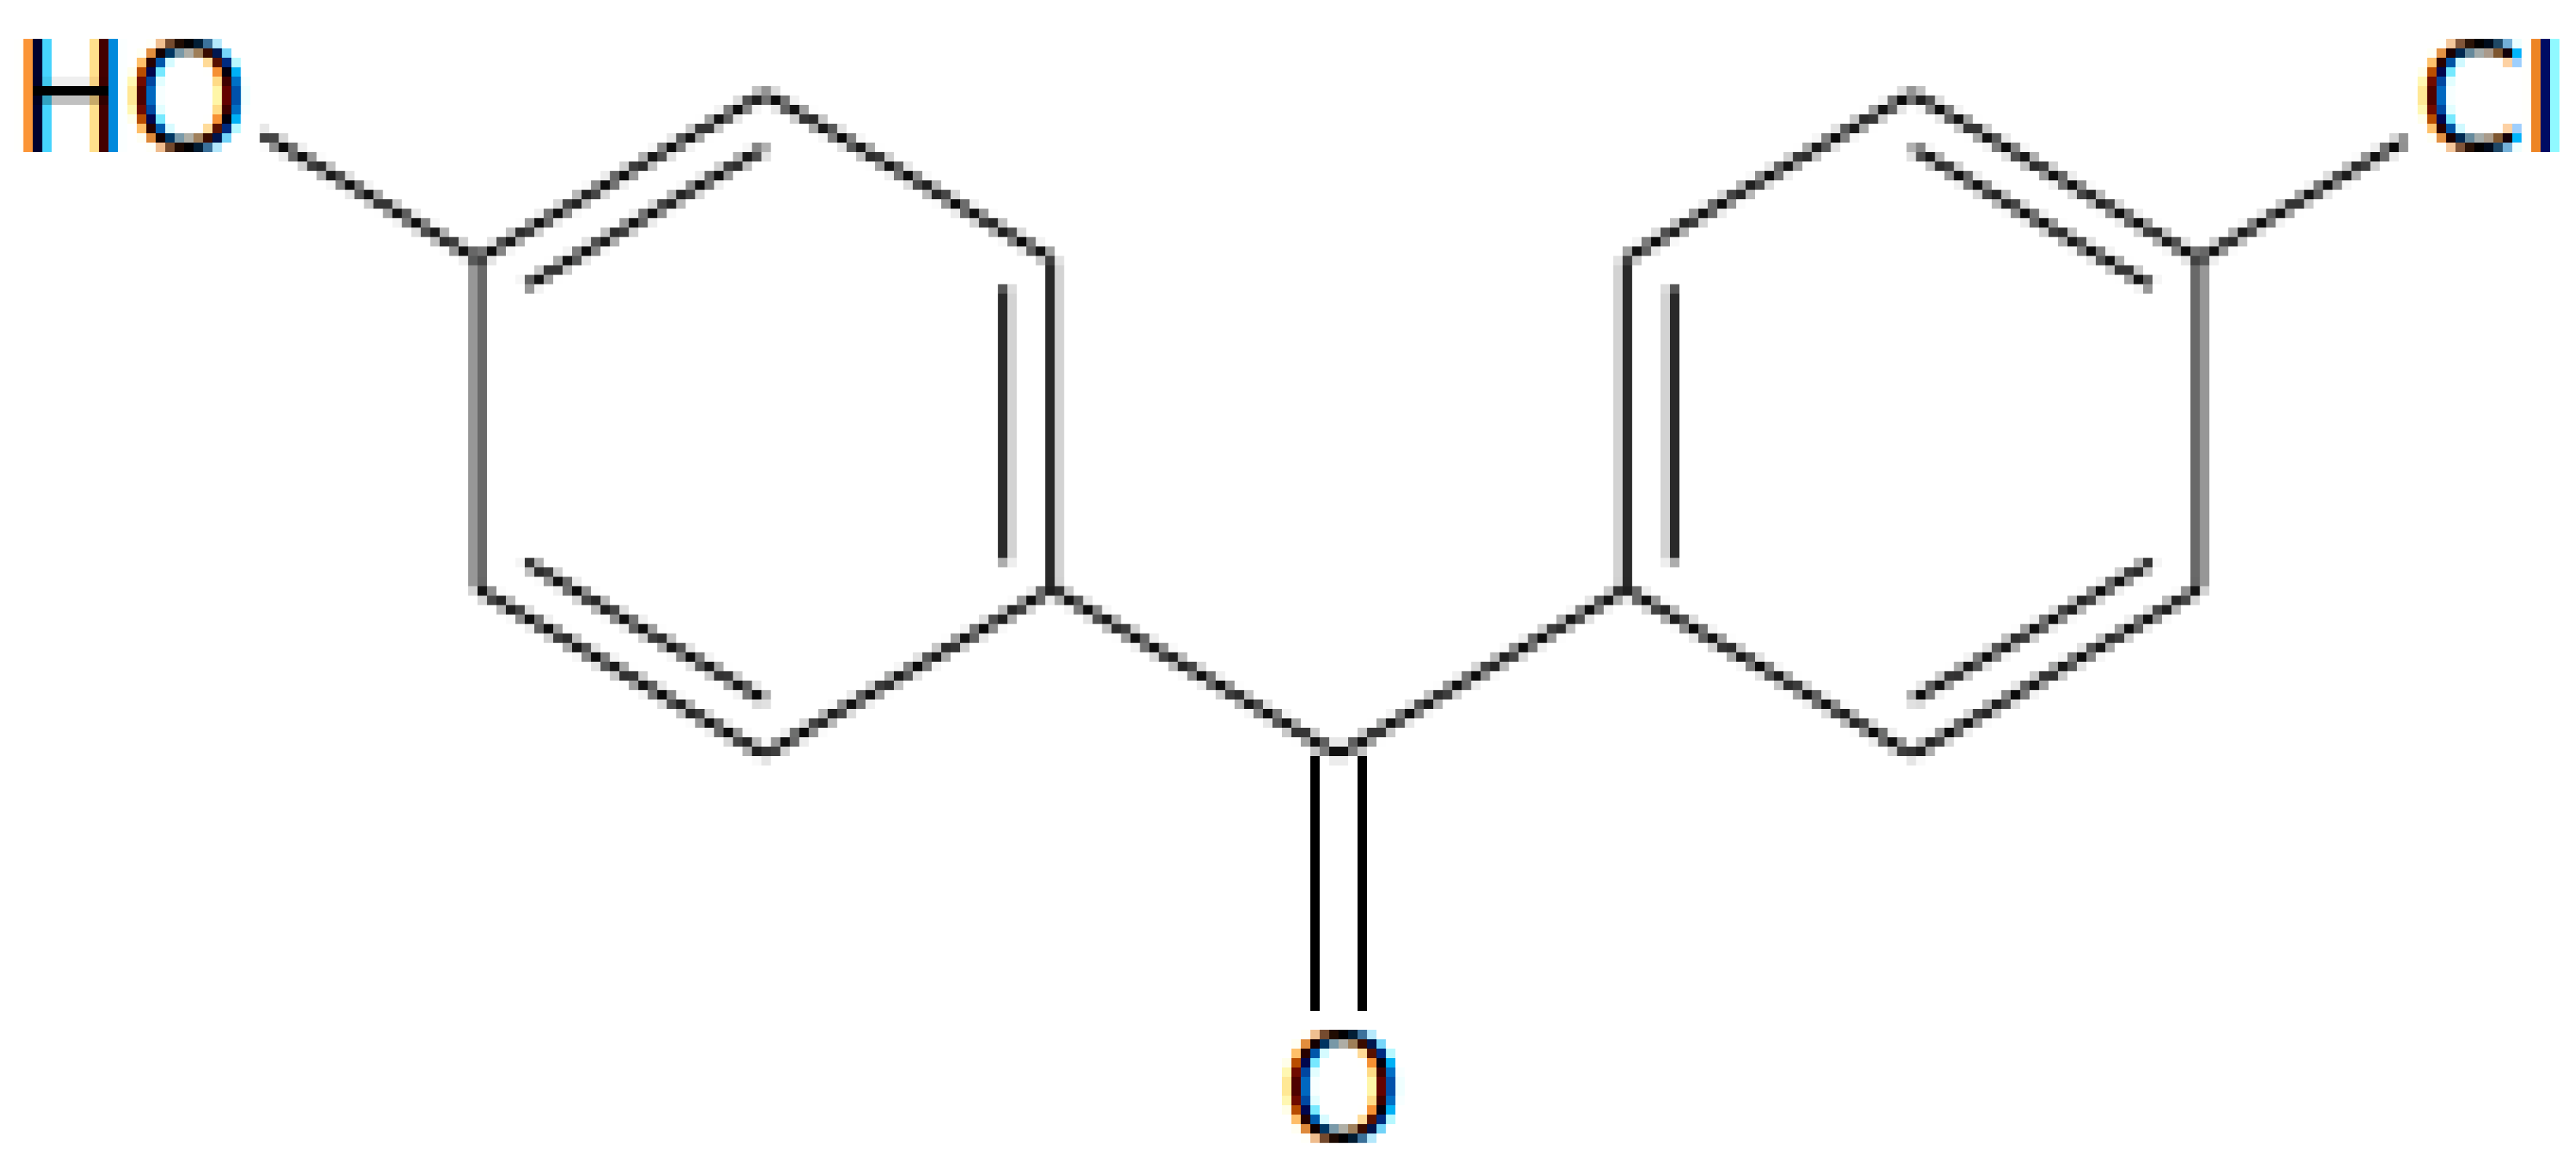 | C13H9ClO2 | 7.2 | 231.0 > 195.0 | qualifier | −70 | −9 | −12 | −32 | 0 |
| 231.0 > 92.0 | quantifier | −70 | −9 | −12 | −32 | −2 |
Disclaimer/Publisher’s Note: The statements, opinions and data contained in all publications are solely those of the individual author(s) and contributor(s) and not of MDPI and/or the editor(s). MDPI and/or the editor(s) disclaim responsibility for any injury to people or property resulting from any ideas, methods, instructions or products referred to in the content. |
© 2023 by the authors. Licensee MDPI, Basel, Switzerland. This article is an open access article distributed under the terms and conditions of the Creative Commons Attribution (CC BY) license (https://creativecommons.org/licenses/by/4.0/).
Share and Cite
Tsiaka, T.; Lantzouraki, D.Z.; Polychronaki, G.; Sotiroudis, G.; Kritsi, E.; Sinanoglou, V.J.; Kalogianni, D.P.; Zoumpoulakis, P. Optimization of Ultrasound- and Microwave-Assisted Extraction for the Determination of Phenolic Compounds in Peach Byproducts Using Experimental Design and Liquid Chromatography–Tandem Mass Spectrometry. Molecules 2023, 28, 518. https://doi.org/10.3390/molecules28020518
Tsiaka T, Lantzouraki DZ, Polychronaki G, Sotiroudis G, Kritsi E, Sinanoglou VJ, Kalogianni DP, Zoumpoulakis P. Optimization of Ultrasound- and Microwave-Assisted Extraction for the Determination of Phenolic Compounds in Peach Byproducts Using Experimental Design and Liquid Chromatography–Tandem Mass Spectrometry. Molecules. 2023; 28(2):518. https://doi.org/10.3390/molecules28020518
Chicago/Turabian StyleTsiaka, Thalia, Dimitra Z. Lantzouraki, Georgia Polychronaki, Georgios Sotiroudis, Eftichia Kritsi, Vassilia J. Sinanoglou, Despina P. Kalogianni, and Panagiotis Zoumpoulakis. 2023. "Optimization of Ultrasound- and Microwave-Assisted Extraction for the Determination of Phenolic Compounds in Peach Byproducts Using Experimental Design and Liquid Chromatography–Tandem Mass Spectrometry" Molecules 28, no. 2: 518. https://doi.org/10.3390/molecules28020518
APA StyleTsiaka, T., Lantzouraki, D. Z., Polychronaki, G., Sotiroudis, G., Kritsi, E., Sinanoglou, V. J., Kalogianni, D. P., & Zoumpoulakis, P. (2023). Optimization of Ultrasound- and Microwave-Assisted Extraction for the Determination of Phenolic Compounds in Peach Byproducts Using Experimental Design and Liquid Chromatography–Tandem Mass Spectrometry. Molecules, 28(2), 518. https://doi.org/10.3390/molecules28020518