Article

Fabry–Pérot Cavities with Suspended Palladium Membranes on Optical Fibers for Highly Sensitive Hydrogen Sensing

Guangdong Provincial Key Laboratory of Optical Fiber Sensing and Communications, Institute of Photonics Technology, Jinan University, Guangzhou 511443, China
*
Author to whom correspondence should be addressed.
Molecules 2023, 28(19), 6984; https://doi.org/10.3390/molecules28196984
Submission received: 29 August 2023 / Revised: 26 September 2023 / Accepted: 7 October 2023 / Published: 9 October 2023
(This article belongs to the Special Issue Nano-Functional Materials for Sensor Applications)

Abstract

:
Hydrogen (H2) sensors are critical to various applications such as the situation where H2 is used as the clean energy for industry or the indicator for human disease diagnosis. Palladium (Pd) is widely used as the hydrogen sensing material in different types of sensors. Optical fiber H2 sensors are particularly promising due to their compactness and spark-free operation. Here, we report a Fabry–Pérot (FP)-cavity-based H2 sensor that is formed with a freestanding Pd membrane and integrated on a conventional single-mode optical fiber end. The freestanding Pd membrane acts both as the active hydrogen sensing material and as one of the reflective mirrors of the cavity. When the Pd film absorbs H2 to form PdHx, it will be stretched, resulting in a change of the cavity length and thus a shift of the interference spectrum. The H2 concentration can be derived from the amplitude of the wavelength shift. Experimental results showed that H2 sensors based on suspended Pd membranes can achieve a detection sensitivity of about 3.6 pm/ppm and a detection limit of about 3.3 ppm. This highly sensitive detection scheme is expected to find applications for sensing low-concentration H2.

1. Introduction

As a renewable energy source, hydrogen has attracted increasing attention for its potential to replace fossil fuels. However, due to its high diffusion coefficient, low ignition energy, high combustion heat, and wide flammable range (4–75%), there are severe safety risks during the transportation, storage, and use of H2 [1,2,3,4,5]. Additionally, H2 is colorless and odorless with the smallest molecular weight, which makes it easy to leak but hard to be detected in practical applications [6,7,8]. Therefore, reliable and accurate H2 monitoring at low concentrations is extremely important. It is noted that H2 can also be used for medical diagnosis in a simple and noninvasive way with breath tests, where the amount of H2 acts as indicators of certain digestive problems. Therefore, highly sensitive H2 sensors are desired for safe and fast H2 detection or monitoring. Over the past decades, various types of H2 sensors have been proposed and developed, including electrochemical sensors, micromechanical sensors, resistance sensors, and optical sensors [9,10,11,12]. Among these sensors, optical sensors, especially optical fiber sensors, have shown attractive and promising prospects due to their combined properties of compactness, high sensitivity, good reliability, and anti-electromagnetic interference [13,14]. Optical fiber H2 sensors use optical signals as the sensing transducers, which eliminates any potential electrical sparks in the sensing site [15,16,17,18].
One type of optical fiber H2 sensor involves integrating a miniaturized FP cavity on top of the end of a single-mode optical fiber. The FP cavity is formed by a short silica capillary with the fiber end as one reflective element and a diaphragm on the capillary as the other reflective element. Such sensors have been widely studied because of their small size, simple structure, high sensitivity, and low cost [19,20,21]. To make the cavity responsive to H2, the diaphragm usually consists of Pd, which is a hydrogen-sensitive material with high affinity for H2 and good reversibility [22,23,24]. In most cases, the diaphragms usually appear in the form of composite layers with other elastic materials as supporting layers [25,26]. For example, Ma et al. [26] used a hybrid Pd/graphene film to construct the Fabry–Pérot cavity. While the multilayer graphene provides good support for the Pd layer, the stiffness of graphene could result in lower H2 sensitivity of the sensor, ≈0.25 pm/ppm. Zhang et al. constructed a similar FP cavity on the fiber tip with UV-curable epoxy [27]. They first transferred a gold (Au) film on top of a capillary with a simple press-and-detach method where UV-curable epoxy was used to bond the gold film to the capillary. A thin Pd layer was then deposited forming a composite Au/Pd H2-sensitive film. The sensor shows a good response to H2 in the range of 1~3.5%. In another work, Xiong et al. fabricated a FP cavity on top of a fiber tip with a micro-cantilever that is developed by a two-photo polymerization (TPP) method with femtosecond laser printing [28]. Subsequent Pd sputtering enables the cantilever and the FP cavity sensitive to environmental H2 changes. In addition, the preparation process of the composite films can be complex, adding to the overall cost of the sensor. Therefore, it is highly desirable to investigate the H2 sensing performance of a freestanding Pd thin film without any support materials.
In this study, we report an optical fiber H2 sensor that uses a suspended Pd thin film (30 nm in thickness) to form a FP cavity. The Pd film is readily transferred onto a silica capillary that is fused onto an optical fiber. After hydrogen absorption, the expansion of the Pd lattice causes stretching and deformation of the Pd film resulting in shortening of the cavity and blue-shift of the interference spectrum. Then, the H2 concentration can be derived from the magnitude of the wavelength shift. The results show that unsupported Pd thin films enable highly sensitive detection of H2 at low concentrations.

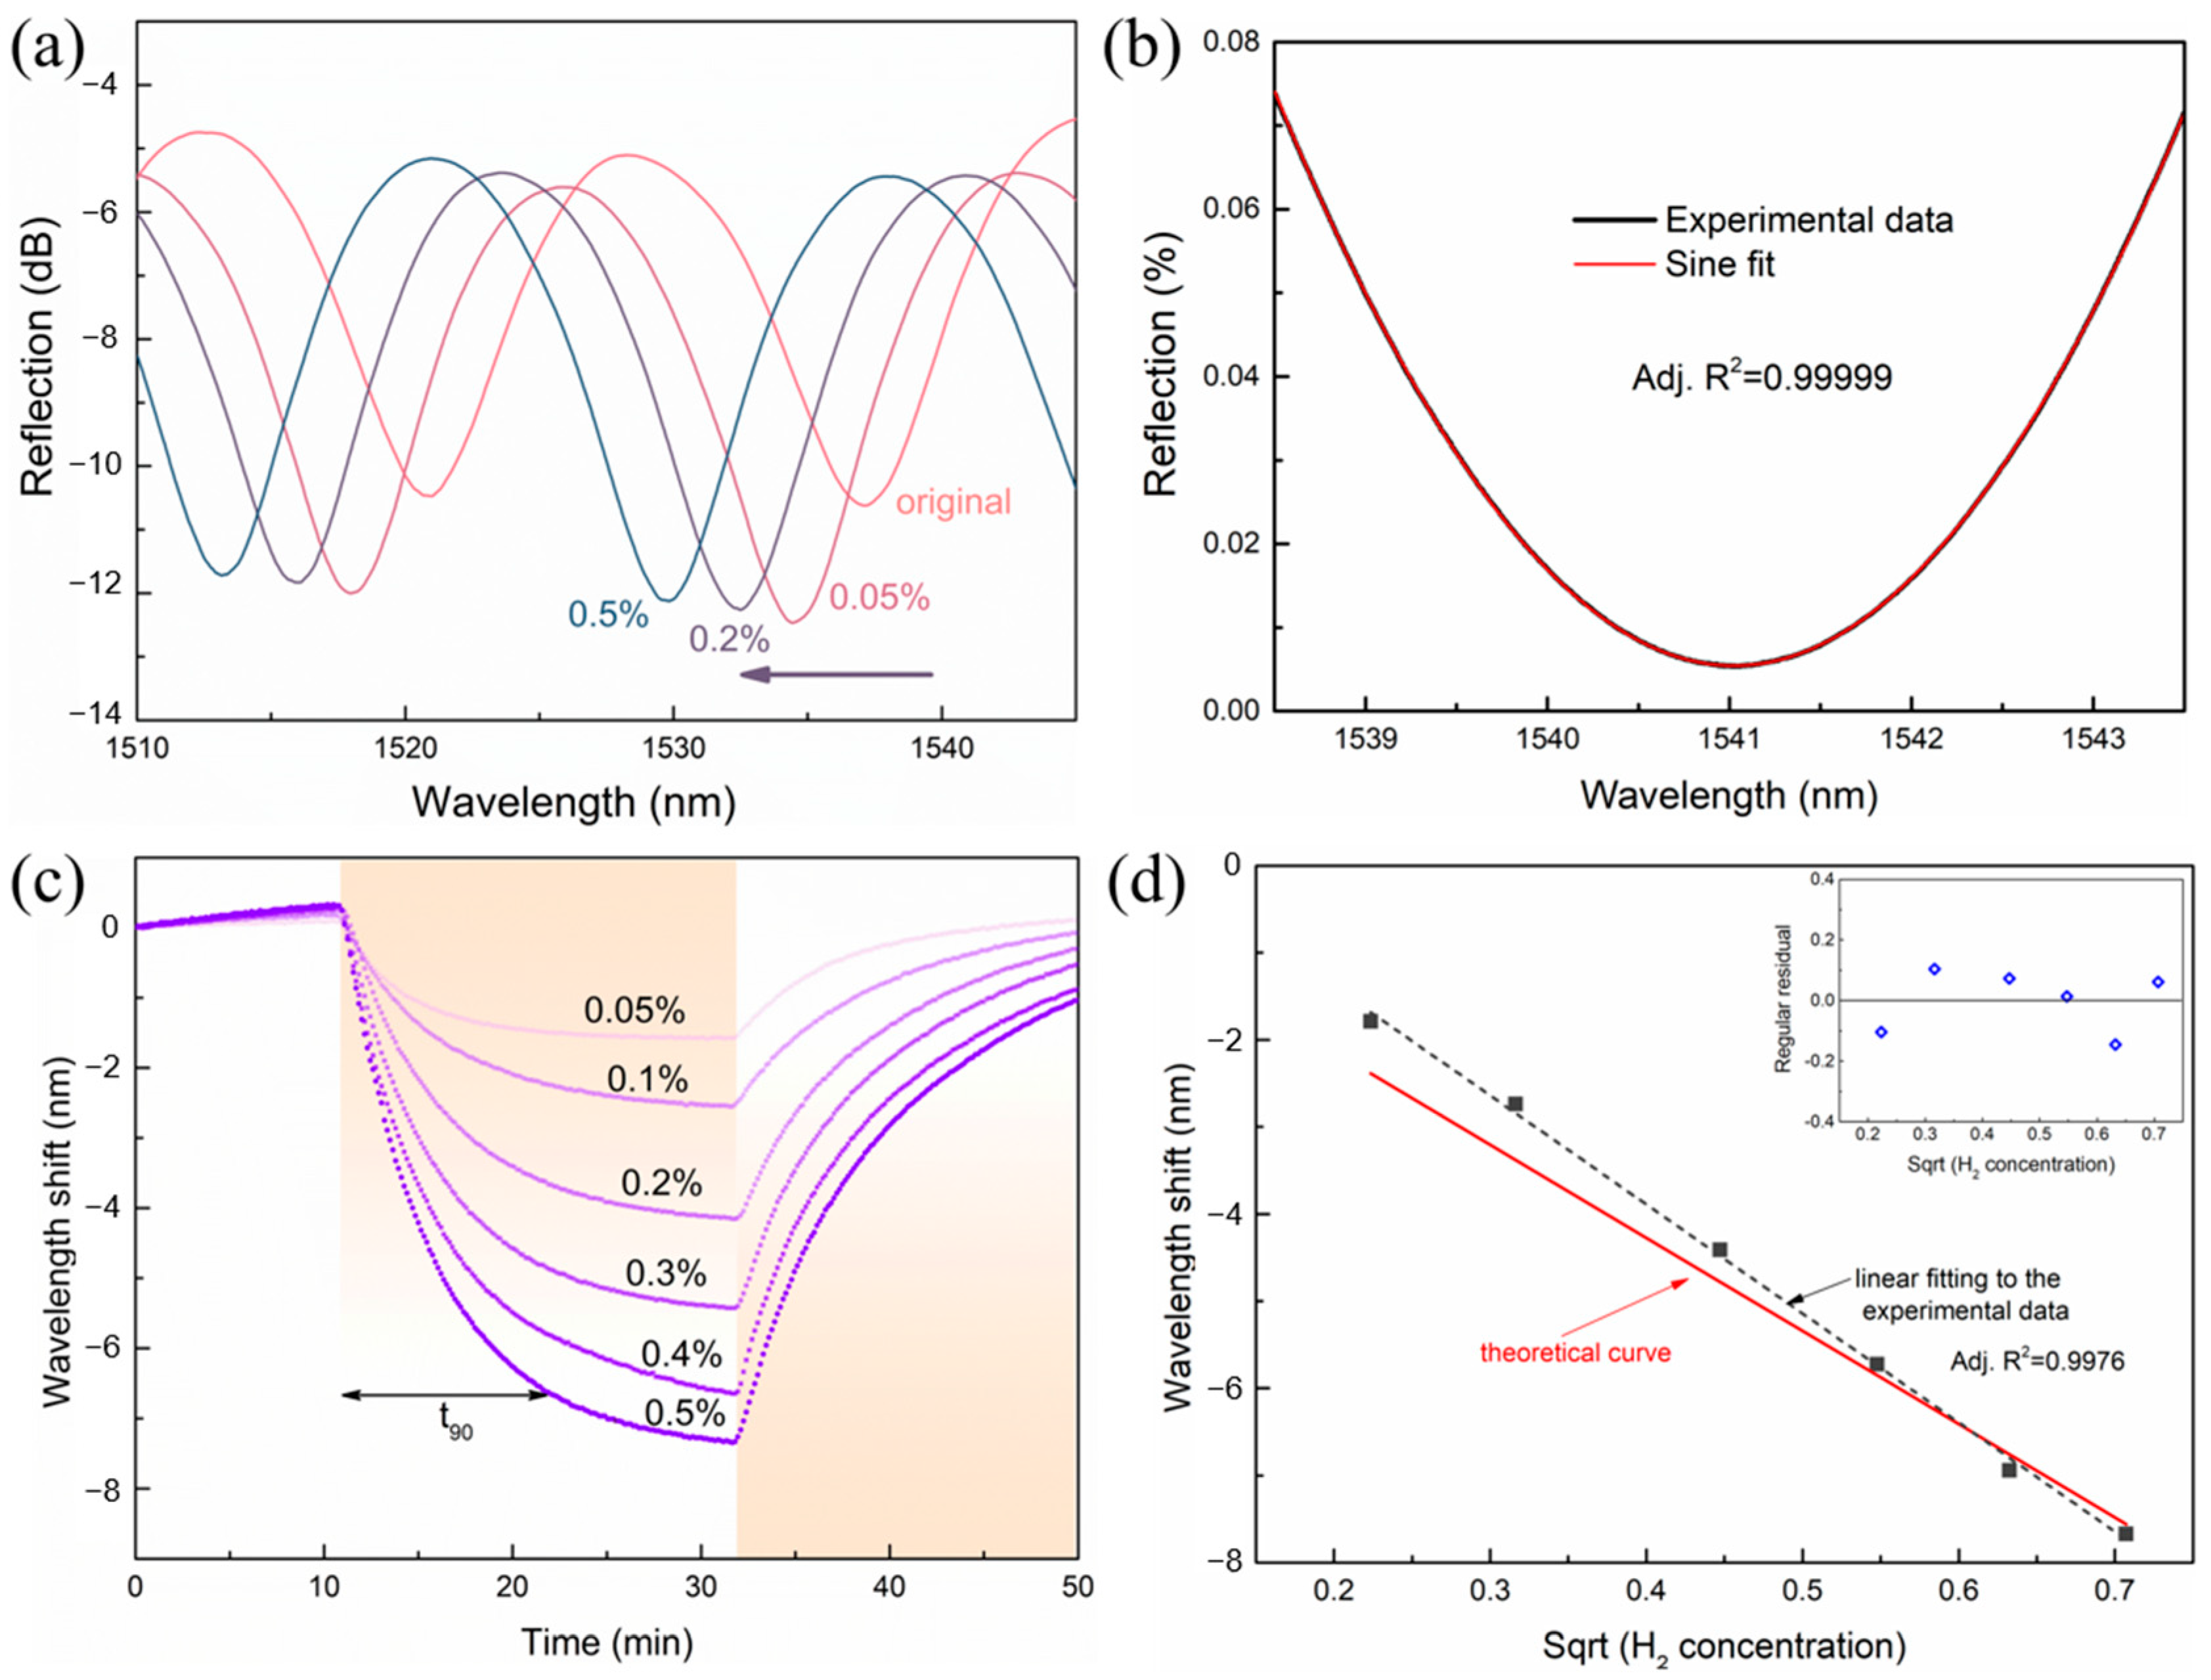
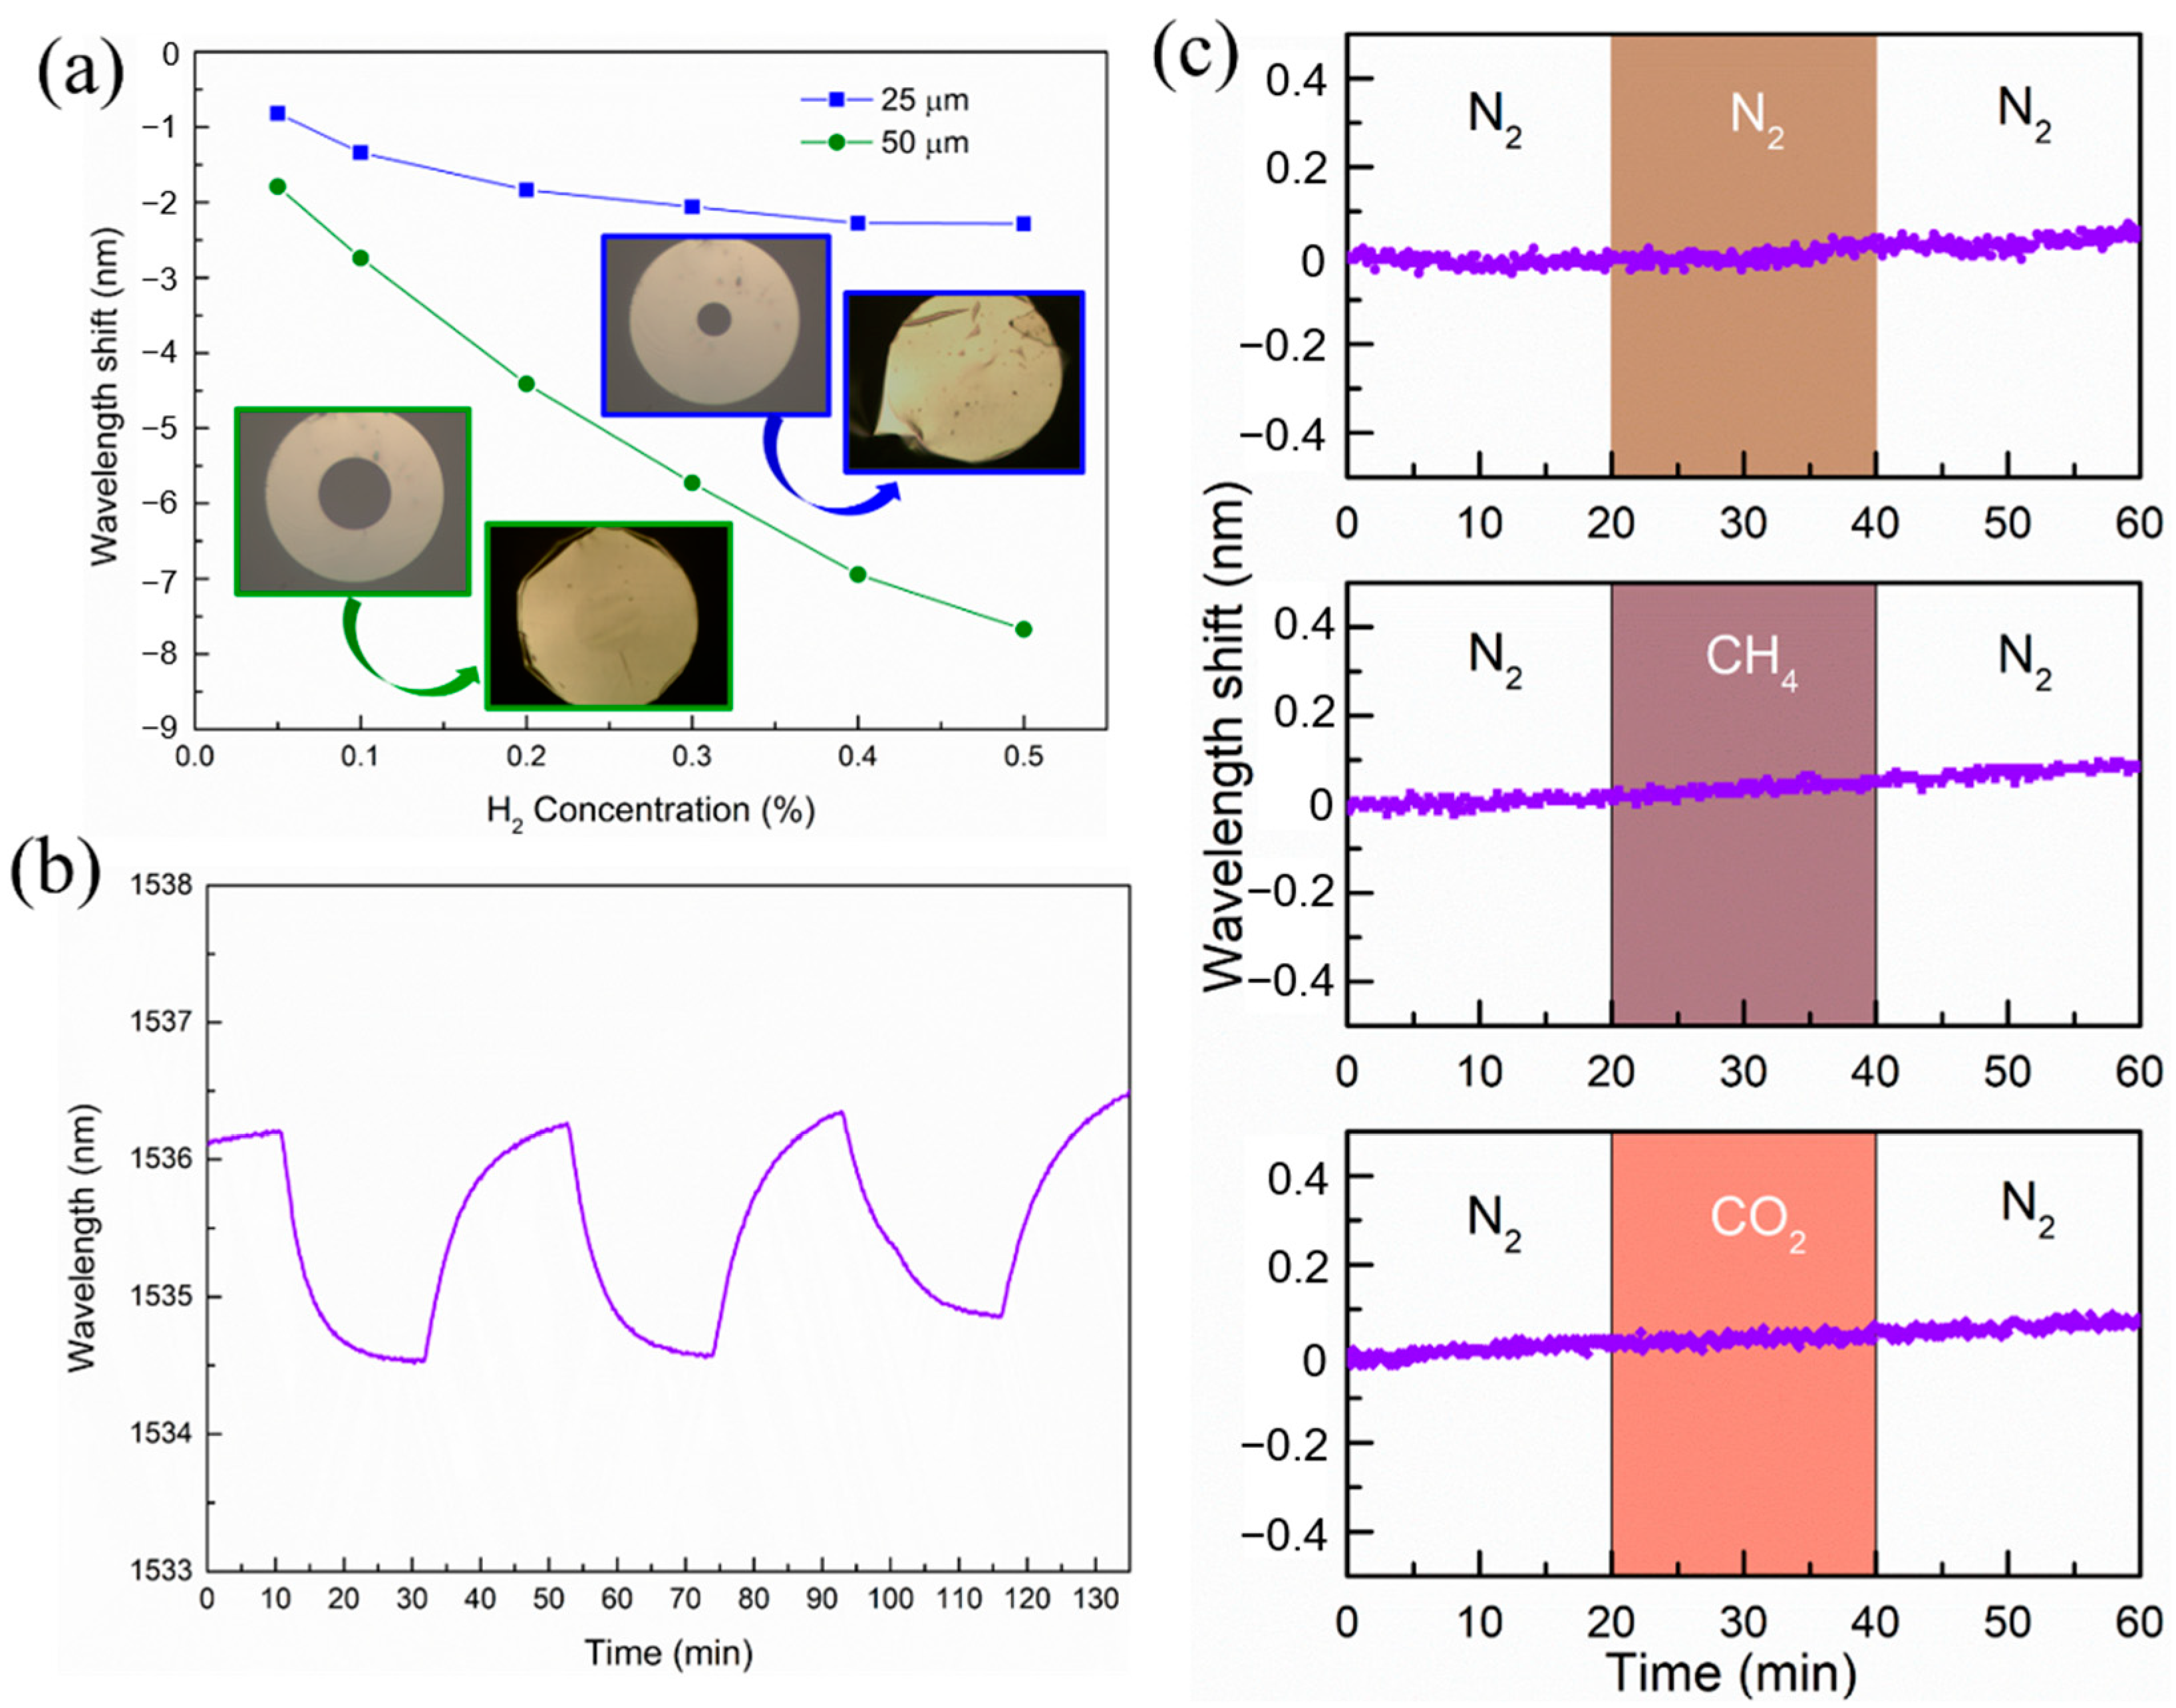
2. Results and Discussions

The proposed optical fiber H2 sensor is schematically shown in Figure 1a. The main component of the sensor is made from a section of quartz capillary tube that is fusion spliced to a single mode optical fiber. The flat fiber end and the suspended Pd film over the capillary act as two mirrors to form a low finesse FP cavity. When the sensor is exposed to hydrogen, the Pd film absorbs the hydrogen molecules, which split upon the metal surface into atoms. The hydrogen atoms then diffuse into the metal lattice to form PdHx until equilibrium is reached, where x represents the atomic ratio of H to Pd. In this process, the lattice of Pd film expands and deflection occurs, thus reducing the cavity length L. The decrease in L leads to blueshift of the peaks or troughs of the FP interference fringe. Once the relationship between the H2 concentrations and the wavelength shift is established, the H2 concentration in the environment can be detected by monitoring the wavelength shift of the interference spectrum.
Figure 1b illustrates the schematic used to calculate the relationship between the deflection of Pd film and the H2 concentration. The Pd film can be considered thin and elastic. Initially the Pd film is assumed to be flat, and its position is indicated by the line AB in Figure 1b. After hydrogen absorption, the Pd film bends inwards as indicated by the arc AO’B, whose geometrical center is labeled as O. A simple formula Δλ/λ = ΔL/L can be used to relate the wavelength shift Δλ to the decrement of the cavity length ΔL. It can be seen from Figure 1b that ΔL equals the deflection value h of the Pd film. The deflection h is then related to the film strain εPd caused by Pd lattice expansion [26], which can be expressed as follows:
ε P d = R β r r = β s i n β s i n β
where R is the curvature radius of the Pd film after deflection, r is the inner radius of the capillary, and β is half of the AO’B arc angle.
The out-of-plane deflection h of the Pd film is related to the angle β:
h = r · s i n β 1 + c o s β
Through Equations (1) and (2), using Taylor expansion, it can be obtained that
h 6 2 r ε P d
It is known that εPd is related to H2 content via εPd = 0.026CH [4], where CH is the concentration of hydrogen. Therefore, the relationship between the deflection h (i.e., cavity length change ΔL) and H2 concentration CH can be obtained as follows:
Δ L = h = 6 2 r 0.026 · C H
Considering Δλ/λ = ΔL/L, the wavelength shift Δλ can be obtained as follows:
Δ λ = λ · 6 2 L r 0.026 · C H
Thus, the relationship between the hydrogen concentration and the wavelength shift is established.
The fabrication of the sensors consists of two steps: fusion of a section of silica capillary and transfer of a Pd thin film onto the open cavity (see more details in Section 3). Figure 2a shows the optical images of one fabricated sensor. It is clear that the Pd thin film was successfully transferred onto the silica capillary and completely covered the opening of the capillary. The outer diameter of the capillary is 125 μm, the same as that of single-mode fibers, making it easier for them to bond together. The capillary’s inner diameter is 50 μm, allowing sufficient surface area for welding. It was expected that the thickness of the Pd thin film would have a great influence on the performance of the sensor. Smaller thickness could lead to bigger bending of the film, but thinner films also make it harder to transfer them onto the capillary openings. After several preliminary experiments, we chose 30 nm thick Pd films to form the FP cavity H2 sensors. Figure 2c shows the interference spectrum of the sensor. Clear fringes were observed, suggesting good quality of the cavity. The length L of the Fabry–Pérot cavity can be calculated from the spectrum using the adjacent valley wavelengths [26]. It was estimated that the cavity was about 71 μm, which was close to what is estimated from Figure 2a. It is noted that the fringe contrast of the spectrum can be further improved by matching the reflection coefficient of the two surfaces. The reflection coefficient of the glass–air interface was smaller than that of the air–Pd interface. Therefore, it is feasible to deposit a metal layer on the fiber end to increase the reflection at this interface and thus enhance the fringe contrast as well as reduce the spectral width, which is helpful in boosting the performance of the sensor.
To test the H2 sensing performance of the suspended Pd film, the sensor was characterized using the setup shown in Figure 2b. There were two ports on the chamber for the inflow and outflow of the mixed gas of H2 and N2. A mass flow controller was used to regulate the H2 concentrations in the range 0 to 0.5%, with the total flow rate of the gas mixture fixed at 300 sccm.
Figure 3a shows the reflection spectra of the sensor that were recorded in equilibrium at 0.05%, 0.2%, and 0.5% H2 concentrations. As H2 was introduced to the gas chamber, the whole interference fringes of the sensor showed a consistent blue-shift, which became larger as the concentration of H2 increased. This can be ascribed to the strain-induced inward bending of the freestanding Pd film. To characterize this shift of the spectra caused by the adsorption of H2, we monitored the movement of one (at 1537.13 nm) of the dips, whose spectral positions were extracted using sine fitting to the dips as shown in Figure 3b. Considering the mediocre quality of the FP interference spectra, we used a sine function to find the spectral centroid instead of the Lorentz function used for high-quality FP cavities. The fitting result showed good agreement with the experimental results with R2 > 0.99.
Figure 3c shows the time response and wavelength shift of the sensor at various H2 concentrations between 0.05% and 0.5%. The sensor was initially kept in an N2 environment. As soon as H2 was introduced, the spectral positions of the dips progressively shifted to shorter wavelengths and eventually become stabilized. When the H2 concentration was as low as 0.05% (500 ppm), the wavelength shift was about 1.79 nm. As the H2 concentration increased to 0.5%, the wavelength shift was able to reach 7.67 nm. After the H2 inflow was stopped, the dip gradually returned to its original position, indicating the good recoverability of the suspended Pd membrane. It is estimated from Figure 3c that the response time of the sensor (defined as the time interval when the sensor reached 90% of its stable response) was about 11 min when the H2 concentration was 0.5%. The value of the response time varied a little bit under different H2 concentrations. Specifically, t90 decreased with the increases of H2 concentration, which was probably due to the variation of the diffusion speed of the hydrogen molecules. It is noted that the recovery time of the sensor was approximately the same as the response time. Although the response time and recovery time were in the range of minutes, the suspended Pd films did provide enhanced sensitivity, as shown below.
Figure 3d shows the relationship of the wavelength shift of the dip with the H2 concentration, together with the results obtained from the model in this paper. It is noted that the x-axis was the square root of the H2 concentration, which was intentionally used for a simple linear fitting, as indicated in Equation (5). As shown in Figure 3d, a good linear fitting was obtained for the experimental data, showing the good and robust response of the sensor to environmental hydrogen concentration changes. The red line in Figure 3d shows the calculation result from the theoretical model. Compared with the experimental data, the simple model provided a good prediction of performance of the sensor, indicating the rationality and accuracy of the modelling. It was expected that more accurate prediction can be obtained when advanced calculation methods are used to model mechanical strain in the Pd films as well as the deformation caused by the strain.
We then calculated the sensitivity of the proposed sensor by taking the ratio between the wavelength shift and the corresponding H2 concentration [29]. At H2 concentration of 500 ppm, the corresponding sensitivity of H2 detection was about 3.6 pm/ppm, and the sensitivity slightly decreased as the hydrogen concentration increased. The sensitivity at 0.5% H2 concentration was 1.5 pm/ppm. We monitored the wavelength fluctuation (noise level) of the sensor at stable H2 concentrations and calculated the standard deviation of the fluctuation (1σ = 11.6 pm). Then, the limit of detection (LOD) of the H2 sensor was LOD  = σ sensitivity = 11.6 pm 3.6 pm / ppm  3.3 ppm.
Sensing performance of other reported H2 sensors based on FP cavities is shown in Table 1. It was found that the proposed sensors with freestanding Pd membranes presented in this work were able to achieve relatively high sensitivity (3.6 pm/ppm) at a low hydrogen concentration (500 ppm), which can mainly be attributed to the fact that suspended Pd thin films were used as both the active sensing materials and the reflective surfaces of the FP cavities. In other reported sensors, the supporting composite membranes were usually made of materials with large stiffness, which weakens the deflection caused by the internal strain of the Pd film. For example, the Young’s modulus of graphene is nearly ten times of that of Pd, even though graphene can be made into one-atom thickness. Without any supporting layers, the deflection of the cavities is only determined by the material (Young’s modulus) and geometrical (moment of inertia) properties of the suspended Pd film. While the response time and recovery time were larger than some of the values in Table 1, the proposed sensor did provide excellent sensitivity and a detection limit, making it desirable for applications where high sensitivity is preferred. It is known that the alloying of Pd offers a plausible means to improve the response of the H2 sensor [30]. In particular, it is shown that mixing Pd with Au facilitates the hydrogen absorption process in the metal [31]. Therefore, instead of pure Pd thin films, suspended Pd/Au alloy thin films could be used in the proposed sensor to improve its response time. Other metals, such as silver and copper, can also be used for this purpose. Such topics will be explored in a future study. We would like to emphasize that the miniaturized sensor with a small footprint can be easily fit into sensing application in a confined space. The integration with optical fibers also enables remote sensing, separating the active sensing area and the data analysis units.
We also studied the effect of capillary aperture size on the sensitivity of the sensor. In Figure 4a, we compare the wavelength shifts of sensors made from 25 μm and 50 μm capillary apertures at concentrations below 0.5% H2. With smaller aperture, the wavelength shift became smaller. At H2 concentration of 0.4%, the wavelength shift from the FP sensor with 50 μm aperture was ≈3.4 times larger than that with 25 μm aperture. Additionally, larger aperture leads to a larger linear measurement range. Based on the model in Equation (4), there is a positive correlation between the Pd film deflection value h and the capillary’s aperture (2r). The larger the capillary aperture, the greater the Pd film deflection (FP cavity length change), and therefore the higher the sensor’s sensitivity.
Figure 4b shows the variation of the spectral positions of the dip when the sensor was exposed to N2 and H2 (500 ppm) consecutively for several cycles. It can be seen that the sensor showed good repeated stability. The specificity of the sensor to H2 gas was also confirmed by carrying out the same experiments with 0.5% concentration of N2, CH4, and CO2 gases, and the test results are shown in Figure 4c. It is clear that the sensor showed no responses to the CO2, CH4, and N2 gases, which meets the performance standard of hydrogen sensors [33].

3. Materials and Methods

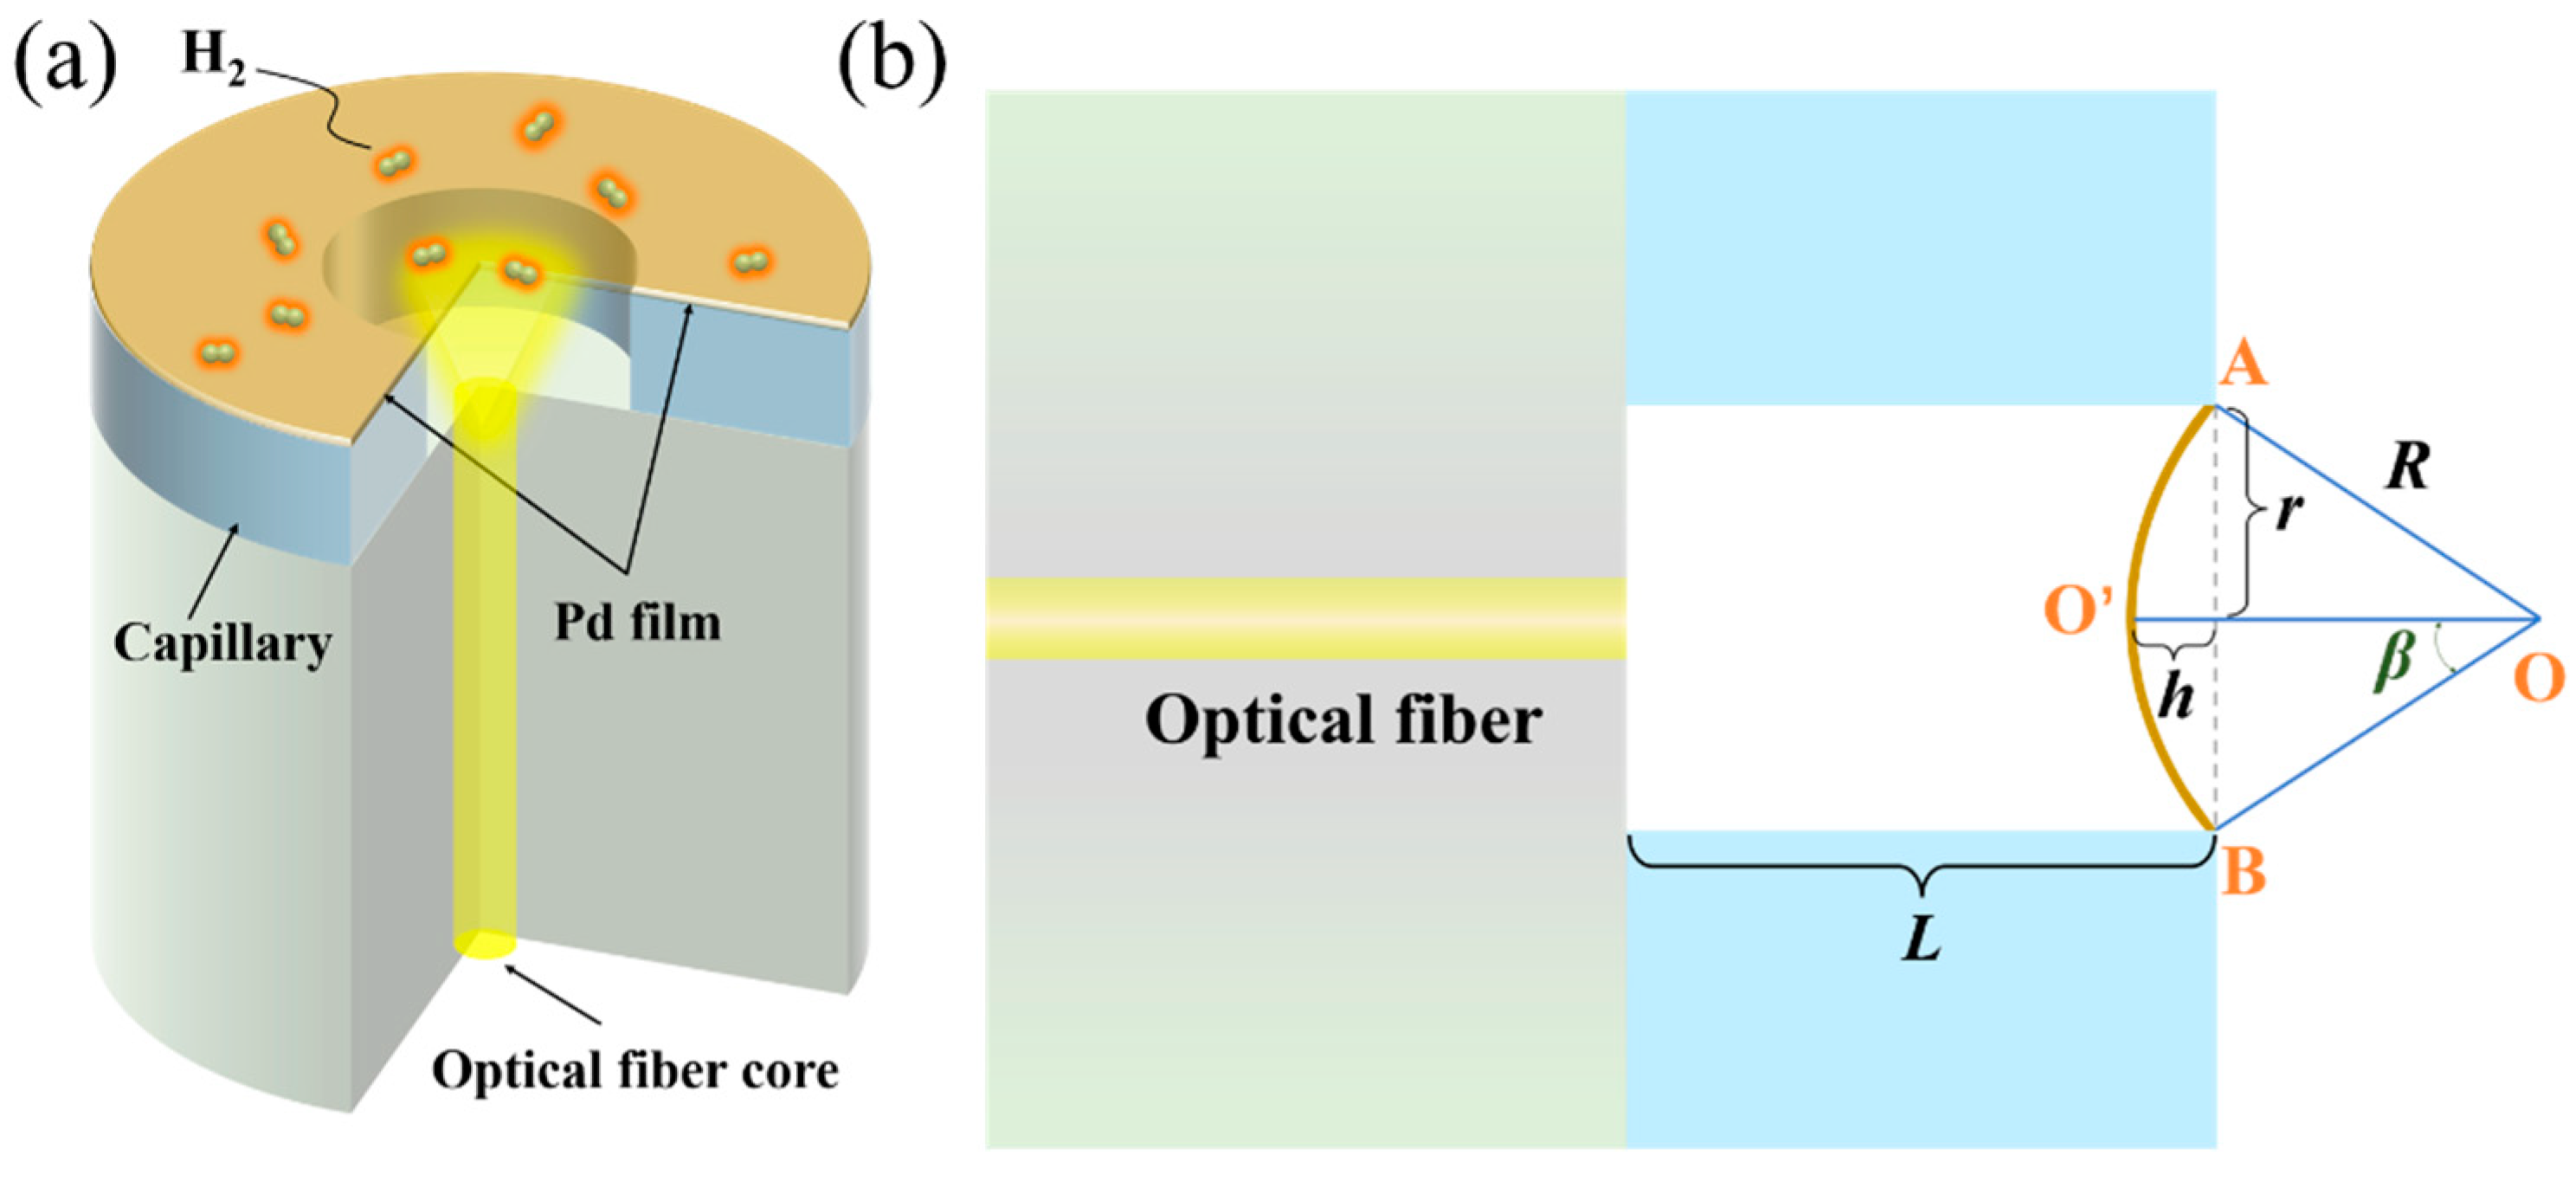
3.1. Fabrication of the Sensor

A silica capillary (Polymicro, TSP025150) with a 50 μm aperture was fused to a conventional single-mode fiber using a fusion splicer (Fujikura, FSM-45PM, Tokyo, Japan, slice parameters: 50 bits, 150 ms). The capillary was then cut at a distance of L from the splice joint using a standard fiber cutter under an optical microscope. This distance L determined the initial length of the FP cavity, whose value can be adjusted from 20 to 100 μm.
A Pd film with a thickness of 30 nm was prepared on quartz substrate by electron beam evaporation. Then, the Pd film was transferred onto the capillary to form a microcavity. The transfer process is schematically shown in Figure 5. First, the Pd/quartz sample was immersed in hydrofluoric acid solution to separate the Pd film from (step 1 in Figure 5). Then, the Pd film was moved to deionized water using a clean slide, and the process was repeated three times to wash off residual ions (step 2 in Figure 5). Finally, the Pd film floating on the water surface was transferred onto the open end of the microcavity by a dipping process (step 3 in Figure 5). The optical fiber was mounted on a translation stage with the capillary facing down the water and moved slowly towards the Pd film. Once the capillary touched the Pd film, the optical fiber was pulled up. Due to the surface tension of water, the Pd film was attached to the capillary, forming a micro cavity (step 4 in Figure 5). So far, the preparation of the Pd nanofilm optical fiber sensor has been completed.

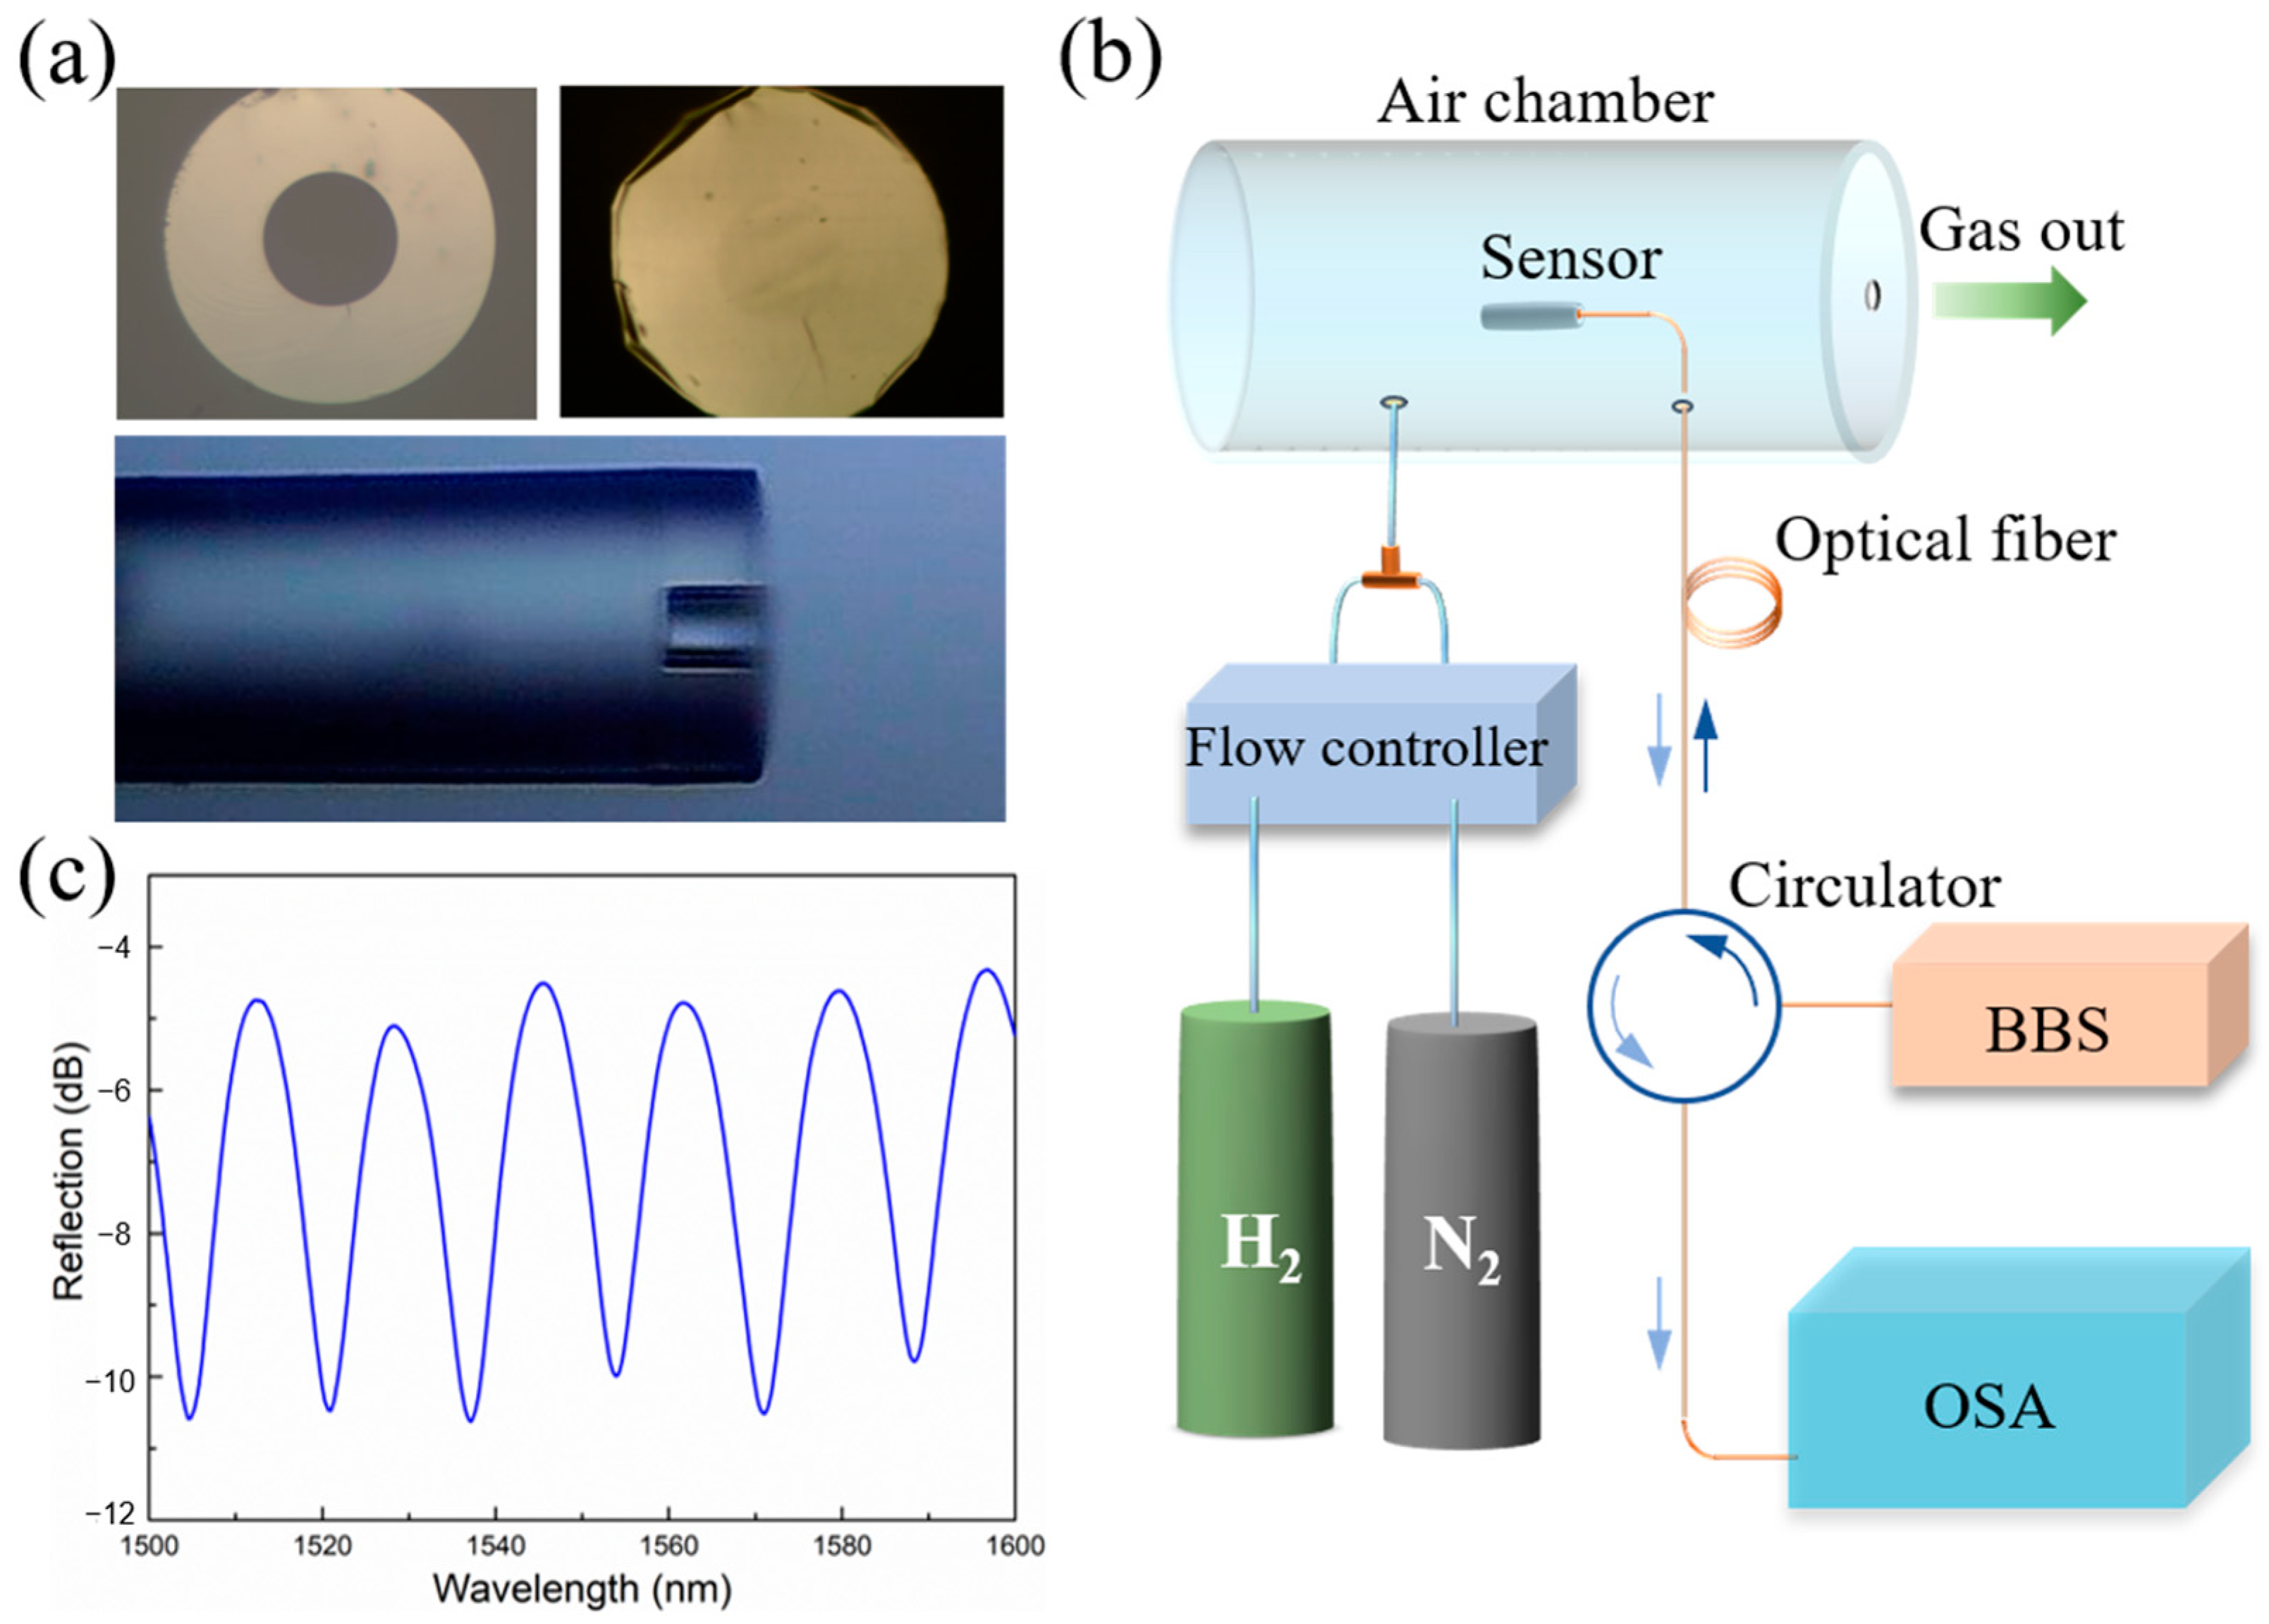
3.2. H2 Sensing Tests

The sensor was characterized using the setup shown in Figure 2b. A broadband optical source (BBS, operating wavelength: 1250 nm~1650 nm) was used in the experiments, and an optical spectrum analyzer (OSA, Golight, AE8600) was used to record and monitor the shift of the reflection spectra of the sensors. The detection wavelength resolution was 0.02 nm.To test the sensor’s response, initially only N2 was introduced into the gas chamber with one mass flowrate controller. Then, H2 was introduced at a fixed concentration until the reflection spectrum became stable. The H2 concentration was regulated by controlling the relative ratio of the flowrates of the two gases while keeping the total fixed at 300 sccm. After certain time, H2 was turned off and N2 was injected into the gas chamber again to return to the initial state. During the tests, the reflection spectra of the sensor were recorded across a broad wavelength range or the spectra near one of the dips (≈1537.13 nm in this case) were collected every 8 s to monitor the spectral shift.

4. Conclusions

In this study, we proposed and demonstrated a highly sensitive optical fiber H2 sensor based on a FP cavity consisting of a suspended Pd membrane. The Pd film acted both as a reflective surface of the FP cavity and the active H2 sensing material. Upon H2 absorption, the strain inside the Pd film caused deflection of the film, leading to wavelength shift of the spectra. The magnitude of the shift depended on the deflection and thus the H2 concentration. High H2 sensitivity at low concentrations was achieved. At a low H2 concentration of 500 ppm, the wavelength shift of the sensor was able to reach 1.79 nm, corresponding to a sensitivity of about 3.6 pm/ppm and a detection limit about 3.3 ppm. The sensor showed good cycle stability and gas selectivity. The FP cavity H2 sensors with suspended Pd thin films and no other supporting materials provided a compact all-optical solution for high sensitivity detection in low-hydrogen environments.

Author Contributions

Conceptualization, K.C., F.X. and J.M.; methodology, K.C., B.-O.G., F.X. and J.M.; software, F.X. and J.M.; validation, F.X. and J.M.; formal analysis, J.L., C.L. and C.M.; investigation, F.X. and J.M.; resources, K.C.; data curation, K.C., F.X. and J.M.; writing—original draft preparation, F.X., J.M. and K.C.; writing—review and editing, K.C., F.X. and J.M.; visualization, F.X., J.M., J.L. and C.M.; supervision, K.C. and B.-O.G.; project administration, K.C.; funding acquisition, K.C. All authors have read and agreed to the published version of the manuscript.

Funding

This research was funded by the National Natural Science Foundation of China (61975067, 12004140), Guangdong Department of Science and Technology of Guangdong Province (2020A151501905). The APC was funded by the National Natural Science Foundation of China (61975067).

Institutional Review Board Statement

Not applicable.

Informed Consent Statement

Not applicable.

Data Availability Statement

Data are available from the authors upon request.

Conflicts of Interest

The authors declare no conflict of interest.

Sample Availability

Samples of the compounds are not available from the authors.

References

  1. Abdalla, A.M.; Hossain, S.; Nisfindy, O.B.; Azad, A.T.; Dawood, M.; Azad, A.K. Hydrogen production, storage, transportation and key challenges with applications: A review. Energy Convers. Manag. 2018, 165, 602–627. [Google Scholar] [CrossRef]
  2. Balta, M.Ö.; Balta, M.T. Development of a sustainable hydrogen city concept and initial hydrogen city projects. Energy Policy 2022, 166, 113015. [Google Scholar] [CrossRef]
  3. Nicoletti, G.; Arcuri, N.; Nicoletti, G.; Bruno, R. A technical and environmental comparison between hydrogen and some fossil fuels. Energy Convers. Manag. 2015, 89, 205–213. [Google Scholar] [CrossRef]
  4. Butler, M.A.; Ginley, D.S. Hydrogen sensing with palladium-coated optical fibers. J. Appl. Phys. 1988, 64, 3706–3712. [Google Scholar] [CrossRef]
  5. Wadell, C.; Syrenova, S.; Langhammer, C. Plasmonic Hydrogen Sensing with Nanostructured Metal Hydrides. ACS Nano 2014, 8, 11925–11940. [Google Scholar] [CrossRef]
  6. Buttner, W.J.; Post, M.B.; Burgess, R.; Rivkin, C. An overview of hydrogen safety sensors and requirements. Int. J. Hydrog. Energy 2011, 36, 2462–2470. [Google Scholar] [CrossRef]
  7. TobišKa, P.; Hugon, O.; Trouillet, A.; Gagnaire, H. An integrated optic hydrogen sensor based on SPR on palladium. Sens. Actuators B Chem. 2001, 74, 168–172. [Google Scholar] [CrossRef]
  8. Ai, B.; Sun, Y.; Zhao, Y. Plasmonic Hydrogen Sensors. Small 2022, 18, 2107882. [Google Scholar] [CrossRef]
  9. LaConti, A.B.; Maget, H.J.R. Electrochemical Detection of H2, CO, and Hydrocarbons in Inert or Oxygen Atmospheres. J. Electrochem. Soc. 1971, 118, 506. [Google Scholar] [CrossRef]
  10. Langhammer, C.; Larsson, E.M.; Zhdanov, V.P.; Zorić, I. Asymmetric Hysteresis in Nanoscopic Single-Metal Hydrides: Palladium Nanorings. J. Phys. Chem. C 2012, 116, 21201–21207. [Google Scholar] [CrossRef]
  11. Seiyama, T.; Kagawa, S. A New Detector for Gaseous Components Using Semiconductive Thin Films. Anal. Chem. 1966, 38, 1502–1503. [Google Scholar] [CrossRef]
  12. Butler, M.A. Fiber Optic Sensor for Hydrogen Concentrations near the Explosive Limit. J. Electrochem. Soc. 1991, 138, 46–47. [Google Scholar] [CrossRef]
  13. Trouillet, A.; Marin, E.; Veillas, C. Fibre gratings for hydrogen sensing. Int. Conf. Opt. Fibre Sens. Int. Soc. Opt. Photonics 2005, 5855, 395. [Google Scholar]
  14. Kim, Y.H.; Kim, M.J.; Rho, B.S.; Park, M.S.; Jang, J.H.; Lee, B.H. Ultra Sensitive Fiber-Optic Hydrogen Sensor Based on High Order Cladding Mode. IEEE Sens. J. 2011, 11, 1423–1426. [Google Scholar] [CrossRef]
  15. Hübert, T.; Boon-Brett, L.; Black, G.; Banach, U. Hydrogen sensors-a review. Sens. Actuators B Chem. 2011, B157, 329–352. [Google Scholar] [CrossRef]
  16. Sutapun, B.; Tabib-Azar, M.; Kazemi, A. Pd-coated elastooptic fiber optic Bragg grating sensors for multiplexed hydrogen sensing. Sens. Actuators B Chem. 1999, 60, 27–34. [Google Scholar] [CrossRef]
  17. Wang, M.; Yang, M.; Cheng, J.; Dai, J.; Yang, M.; Wang, D.N. Femtosecond laser fabricated micro Mach-Zehnder interferometer with Pd film as sensing materials for hydrogen sensing. Opt. Lett. 2012, 37, 1940–1942. [Google Scholar] [CrossRef]
  18. Ming, T.; Ping, L.; Li, C.; Liu, D.; Zhang, J. Femtosecond laser fabricated in-line micro multicavity fiber FP interferometers sensor. Opt. Commun. 2014, 316, 80–85. [Google Scholar]
  19. Zeakes, J.S.; Murphy, K.A.; Elshabini-Riad, A.; Claus, R.O. Modified extrinsic Fabry-Perot interferometric hydrogen gas sensor. IEEE Lasers Electro-Opt. Soc. Meet. 1994, 2, 235–236. [Google Scholar]
  20. Kim, Y.H.; Lee, C.; Ji, H.K.; Lee, Y.T.; Lee, B.H. High finesse interferometric hydrogen sensor based on fiber-optic Fabry-Perot cavity modulations. In Proceedings of the OFS International Conference on Optical Fiber Sensors, Beijing, China, 15–19 October 2012. [Google Scholar]
  21. Wang, M.; Yang, M.; Cheng, J.; Zhang, G.; Liao, C.R.; Wang, D.N. Fabry–Pérot Interferometer Sensor Fabricated by Femtosecond Laser for Hydrogen Sensing. IEEE Photonics Technol. Lett. 2013, 25, 713–716. [Google Scholar] [CrossRef]
  22. Nugroho, F.; Darmadi, I.; Cusinato, L.; Susarrey-Arce, A.; Schreuders, H.; Bannenberg, L.J.; Fanta, A.S.; Kadkhodazadeh, S.; Wagner, J.B.; Antosiewicz, T. Metal–polymer hybrid nanomaterials for plasmonic ultrafast hydrogen detection. Nat. Mater. 2019, 18, 489–495. [Google Scholar] [CrossRef] [PubMed]
  23. Xu, F.; Zhang, Z.; Ma, J.; Ma, C.; Guan, B.O.; Chen, K. Large-Area Ordered Palladium Nanostructures by Colloidal Lithography for Hydrogen Sensing. Molecules 2022, 27, 6100. [Google Scholar] [CrossRef] [PubMed]
  24. Liu, N.; Tang, M.L.; Hentschel, M.; Giessen, H.; Alivisatos, P. Nanoantenna-enhanced gas sensing in a single tailored nanofocus. Nat. Mater. 2011, 10, 631–636. [Google Scholar] [CrossRef]
  25. Iannuzzi, D.; Deladi, S.; Slaman, M.; Rector, J.H.; Schreuders, H.; Elwenspoek, M.C. A fiber-top cantilever for hydrogen detection. Sens. Actuators B Chem. 2007, 121, 706–708. [Google Scholar] [CrossRef]
  26. Ma, J.; Zhou, Y.; Bai, X.; Chen, K.; Guan, B.O. High-sensitivity and fast-response fiber-tip Fabry-Perot hydrogen sensor with suspended palladium-decorated graphene. Nanoscale 2019, 11, 15821–15827. [Google Scholar] [CrossRef]
  27. Zhang, X.; Zhang, X.; Li, X.; Liu, Q.; Zhang, Y.; Liang, Y.; Liu, Y.; Peng, W. The nanophotonic machinal cavity and its hydrogen sensing application. Sens. Actuators B Chem. 2022, 367, 132095. [Google Scholar] [CrossRef]
  28. Xiong, C.; Zhou, J.; Liao, C.; Zhu, M.; Wang, Y.; Liu, S.; Li, C.; Zhang, Y.; Zhao, Y.; Gan, Z.; et al. Fiber-Tip Polymer Microcantilever for Fast and Highly Sensitive Hydrogen Measurement. ACS Appl. Mater. Interfaces 2020, 12, 33163–33172. [Google Scholar] [CrossRef]
  29. Ma, J.; Jin, W.; Xuan, H.; Wang, C.; Ho, H.L. Fiber-optic ferrule-top nanomechanical resonator with multilayer graphene film. Opt. Lett. 2014, 39, 4769–4772. [Google Scholar] [CrossRef]
  30. Lee, E.; Lee, J.M.; Lee, E.; Noh, J.-S.; Joe, J.H.; Jung, B.; Lee, W. Hydrogen gas sensing performance of Pd–Ni alloy thin films. Thin Solid Film. 2010, 519, 880–884. [Google Scholar] [CrossRef]
  31. Nugroho, F.A.A.; Eklund, R.; Nilsson, S.; Langhammer, C. A fiber-optic nanoplasmonic hydrogen sensor via pattern-transfer of nanofabricated PdAu alloy nanostructures. Nanoscale 2018, 10, 20533–20539. [Google Scholar] [CrossRef]
  32. Zhou, X.; Ma, F.; Ling, H.; Yu, B.; Peng, W.; Yu, Q. A compact hydrogen sensor based on the fiber-optic Fabry-Perot interferometer. Opt. Laser Technol. 2020, 124, 105995. [Google Scholar] [CrossRef]
  33. ISO26142; Hydrogen Detection Apparatus-Stationary Applications. ISO: Geneva, Switzerland, 2010.
Figure 1. (a) Illustration of the proposed hydrogen sensor based on a FP cavity by a freestanding Pd film on an optical fiber. (b) The geometrical diagram used to characterize the bending of the Pd film. L is the length of the capillary tube and the initial length of the FP cavity. The remaining symbols in the figure are explained later in the text.
Molecules 28 06984 g001
Figure 2. (a) Optical microscopy images of the fabricated sensor. Top: the capillary opening before (left) and after (right) the covering of the Pd thin film; bottom: side-view of the fabricated sensor. (b) The optical setup used to measure the performance of the sensors. H2 and N2 were mixed before being introduced into a home-made chamber. The concentration of the H2 was regulated by controlling its flow rate while keeping the total flow rate of H2 and N2 fixed at 300 sccm. BBS: broad-band source; OSA: optical spectrum analyzer. (c) shows the interference spectrum of the sensor.
Molecules 28 06984 g002
Figure 3. H2 sensing performance of the FP sensors. (a) Reflectance spectra of the sensor at 0.05%, 0.2%, and 0.5% H2 concentration. (b) Sine fitting of a reflectance spectrum to obtain the spectral position of the dip. (c) Time response and wavelength shift at different H2 concentrations. t90 is the response time of the sensor at 0.5% hydrogen concentration. (d) The relationship between the wavelength shift and square root of H2 concentration obtained from the experiments and the theoretical calculation. The x-axis used the square root of H2 concentration in order to obtain a linear fitting, as indicated from Equation (5) in the main text. The inset shows the regular residual of the linear fitting in panel (d).
Molecules 28 06984 g003
Figure 4. Other factors considered in the design of the H2 sensors. (a) Comparison of the sensing performance of H2 sensors made from 25 and 50 μm apertures. The insets show the SEM images of the capillary ends before and after the covering of the Pd thin films. (b) Stability test of the sensor. (c) The specificity test of the sensor showing no response to N2, CH4, and CO2 gases with 0.5% concentration.
Molecules 28 06984 g004
Figure 5. Schematic diagram of the transfer process of Pd thin films onto a silica capillary. The capillary was fused onto the end of a single-mode fiber.
Molecules 28 06984 g005
Table 1. Performance of several Fabry–Pérot interferometer hydrogen sensors [19,20,21,26,32].
Sensitive FilmDetection RangeSensitivity and
Detection Limit
Response TimeRecovery TimeWorking Temp.Ref.
100 μm Pd4–10%0. 144 pm/ppm at 8% CH
(500 ppm detection limit)
401 s≈500 sRT[32]
2 μm Pd0.5–5%(32 ppm detection limit)≈30 min-RT[19]
50 nm Pd and 2 nm Ni4%0.0175 pm/ppm at 4% CH50 s-RT[20]
Multiple 20 nm Pd2–8%≈0.0019 pm/ppm at 8% CH≈2 min≈5 minRT[21]
5.6 nm Pd and 3 nm MLG0.02–3%0.25 pm/ppm at 0.02% CH
(20 ppm detection limit)
18 s-RT[26]
30 nm Pd0.05–0.5%3.6 pm/ppm at 0.05% CH
1.5 pm/ppm at 0.5% CH
(3.3 ppm detection limit)
11 min11 minRTThis work
Disclaimer/Publisher’s Note: The statements, opinions and data contained in all publications are solely those of the individual author(s) and contributor(s) and not of MDPI and/or the editor(s). MDPI and/or the editor(s) disclaim responsibility for any injury to people or property resulting from any ideas, methods, instructions or products referred to in the content.

