
Olive Fruit Ripening Degree and Water Content Relationships with Phenolic Acids and Alcohols, Secoiridoids, Flavonoids and Pigments in Fruit and Oil

 ,
,  ,
,  , ,
, ,  and
and 
Abstract
:1. Introduction
2. Results
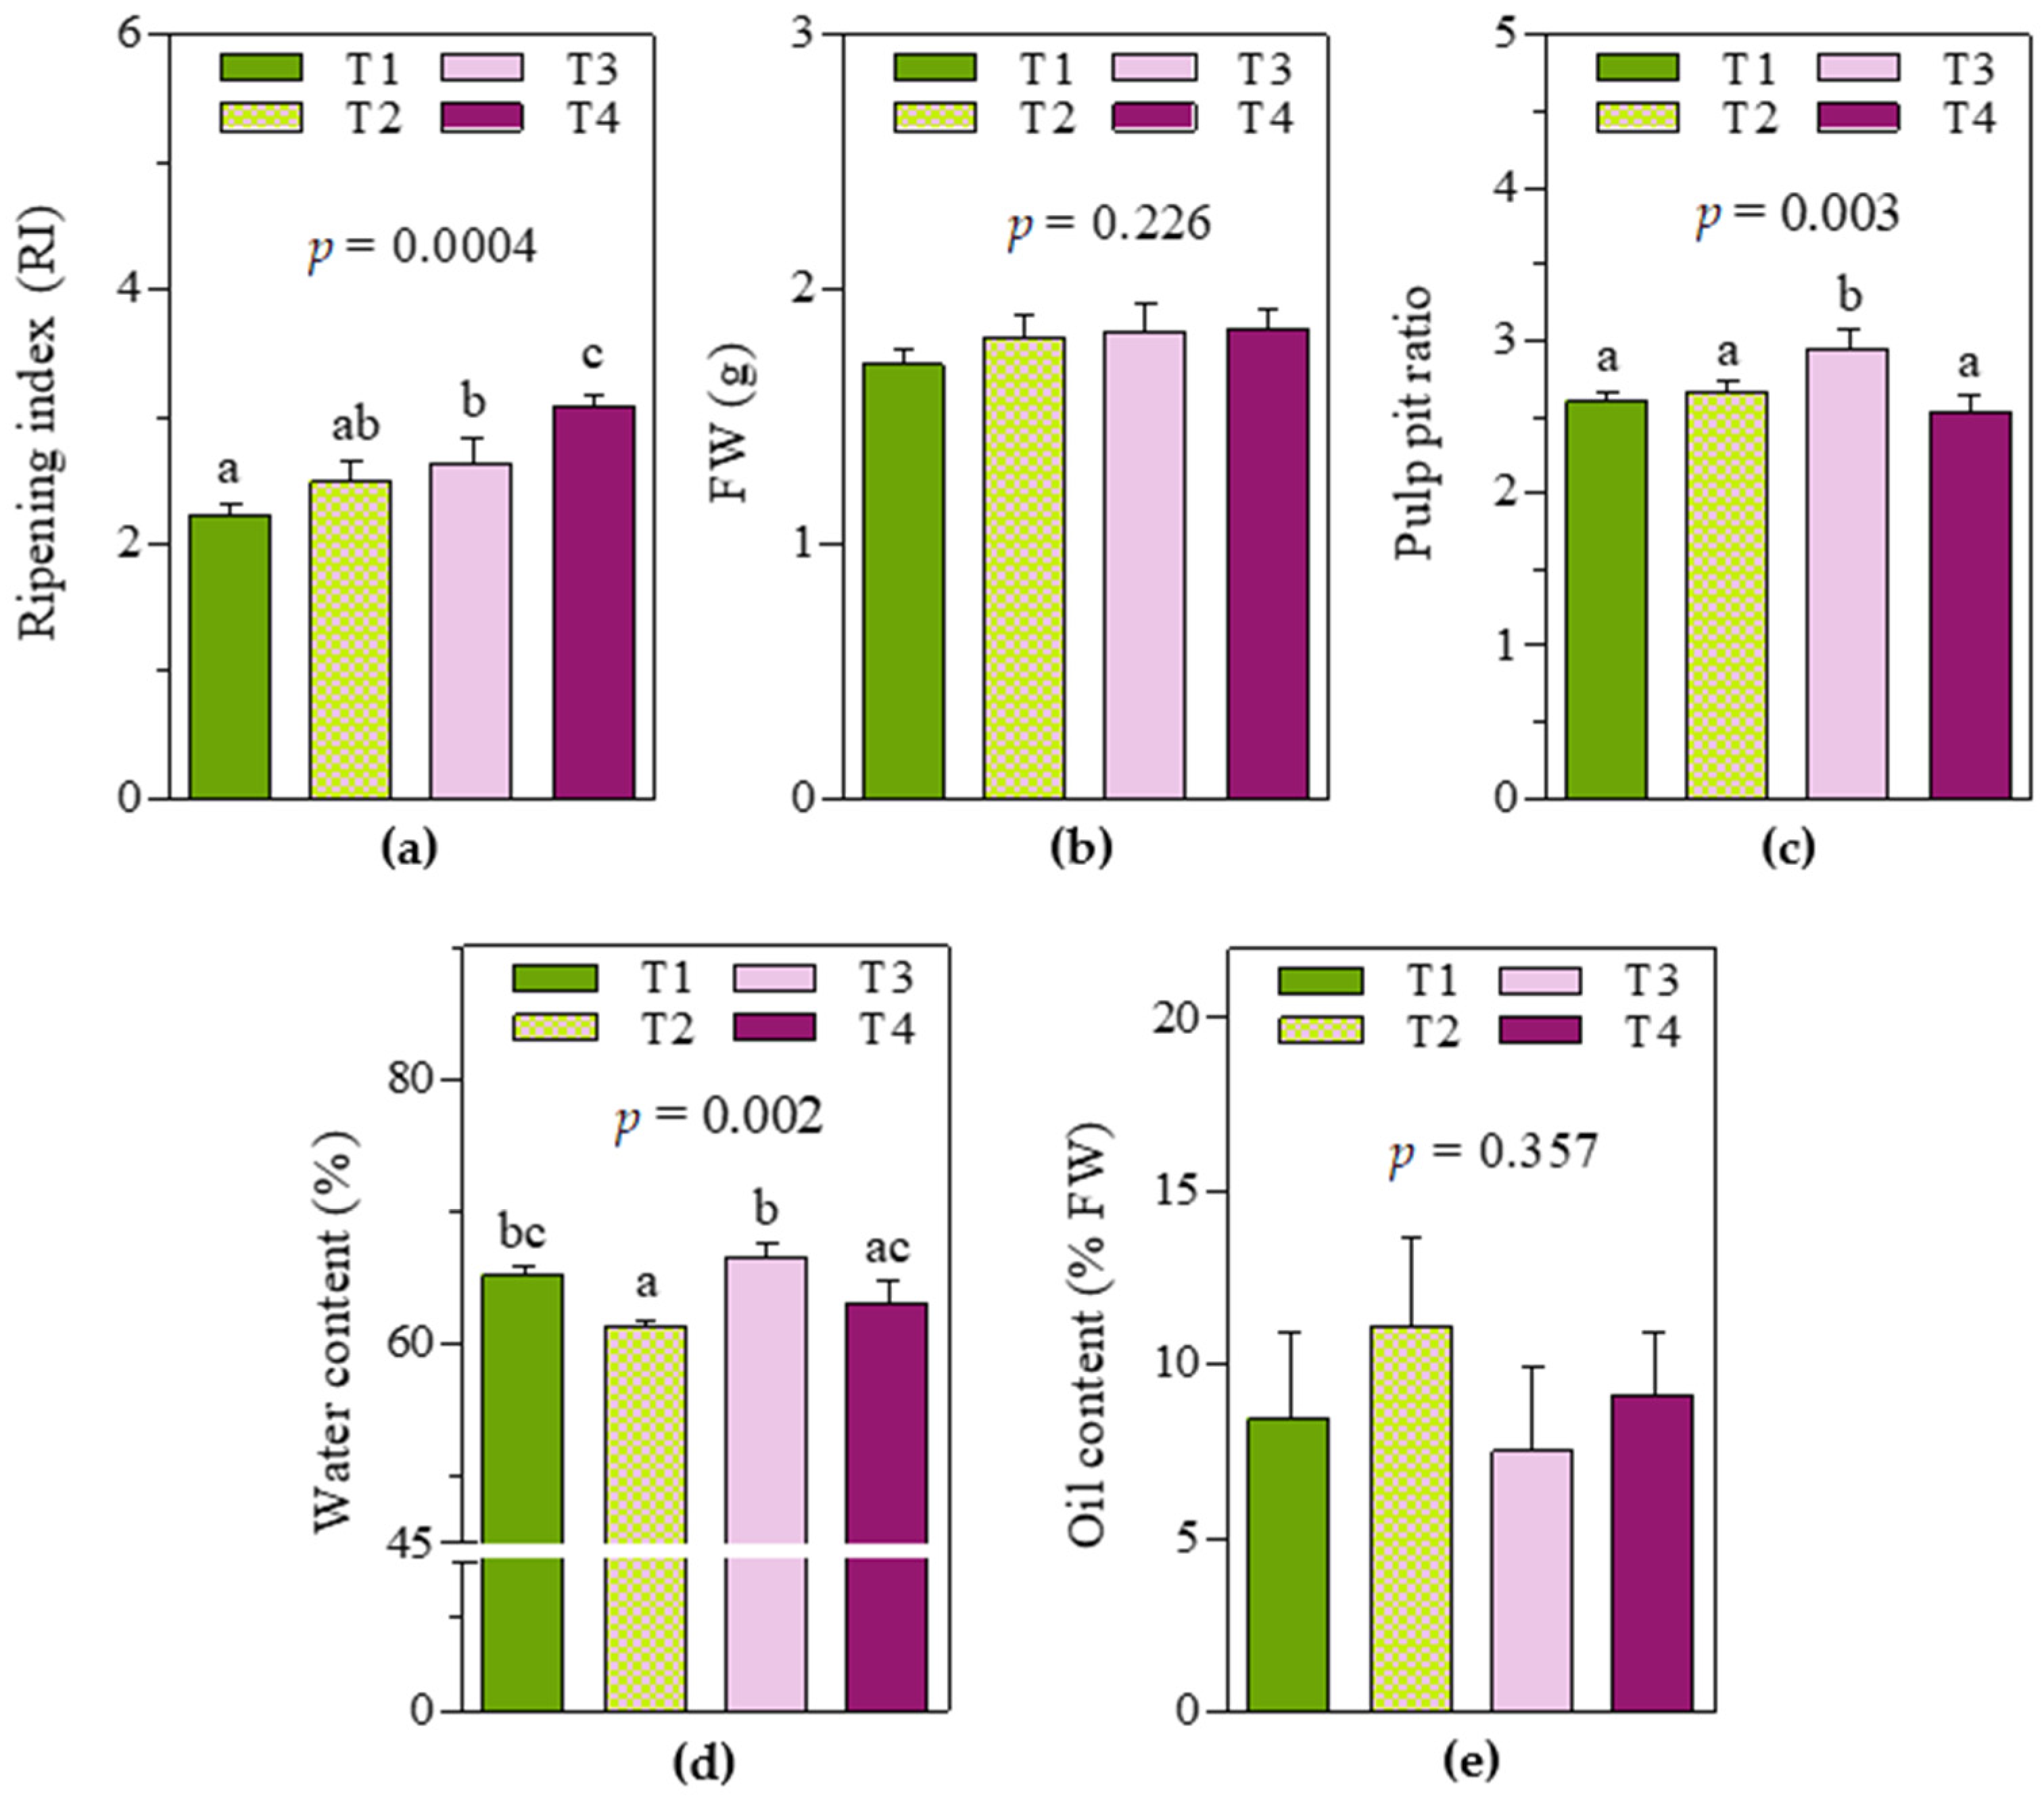
2.1. Fruit Traits
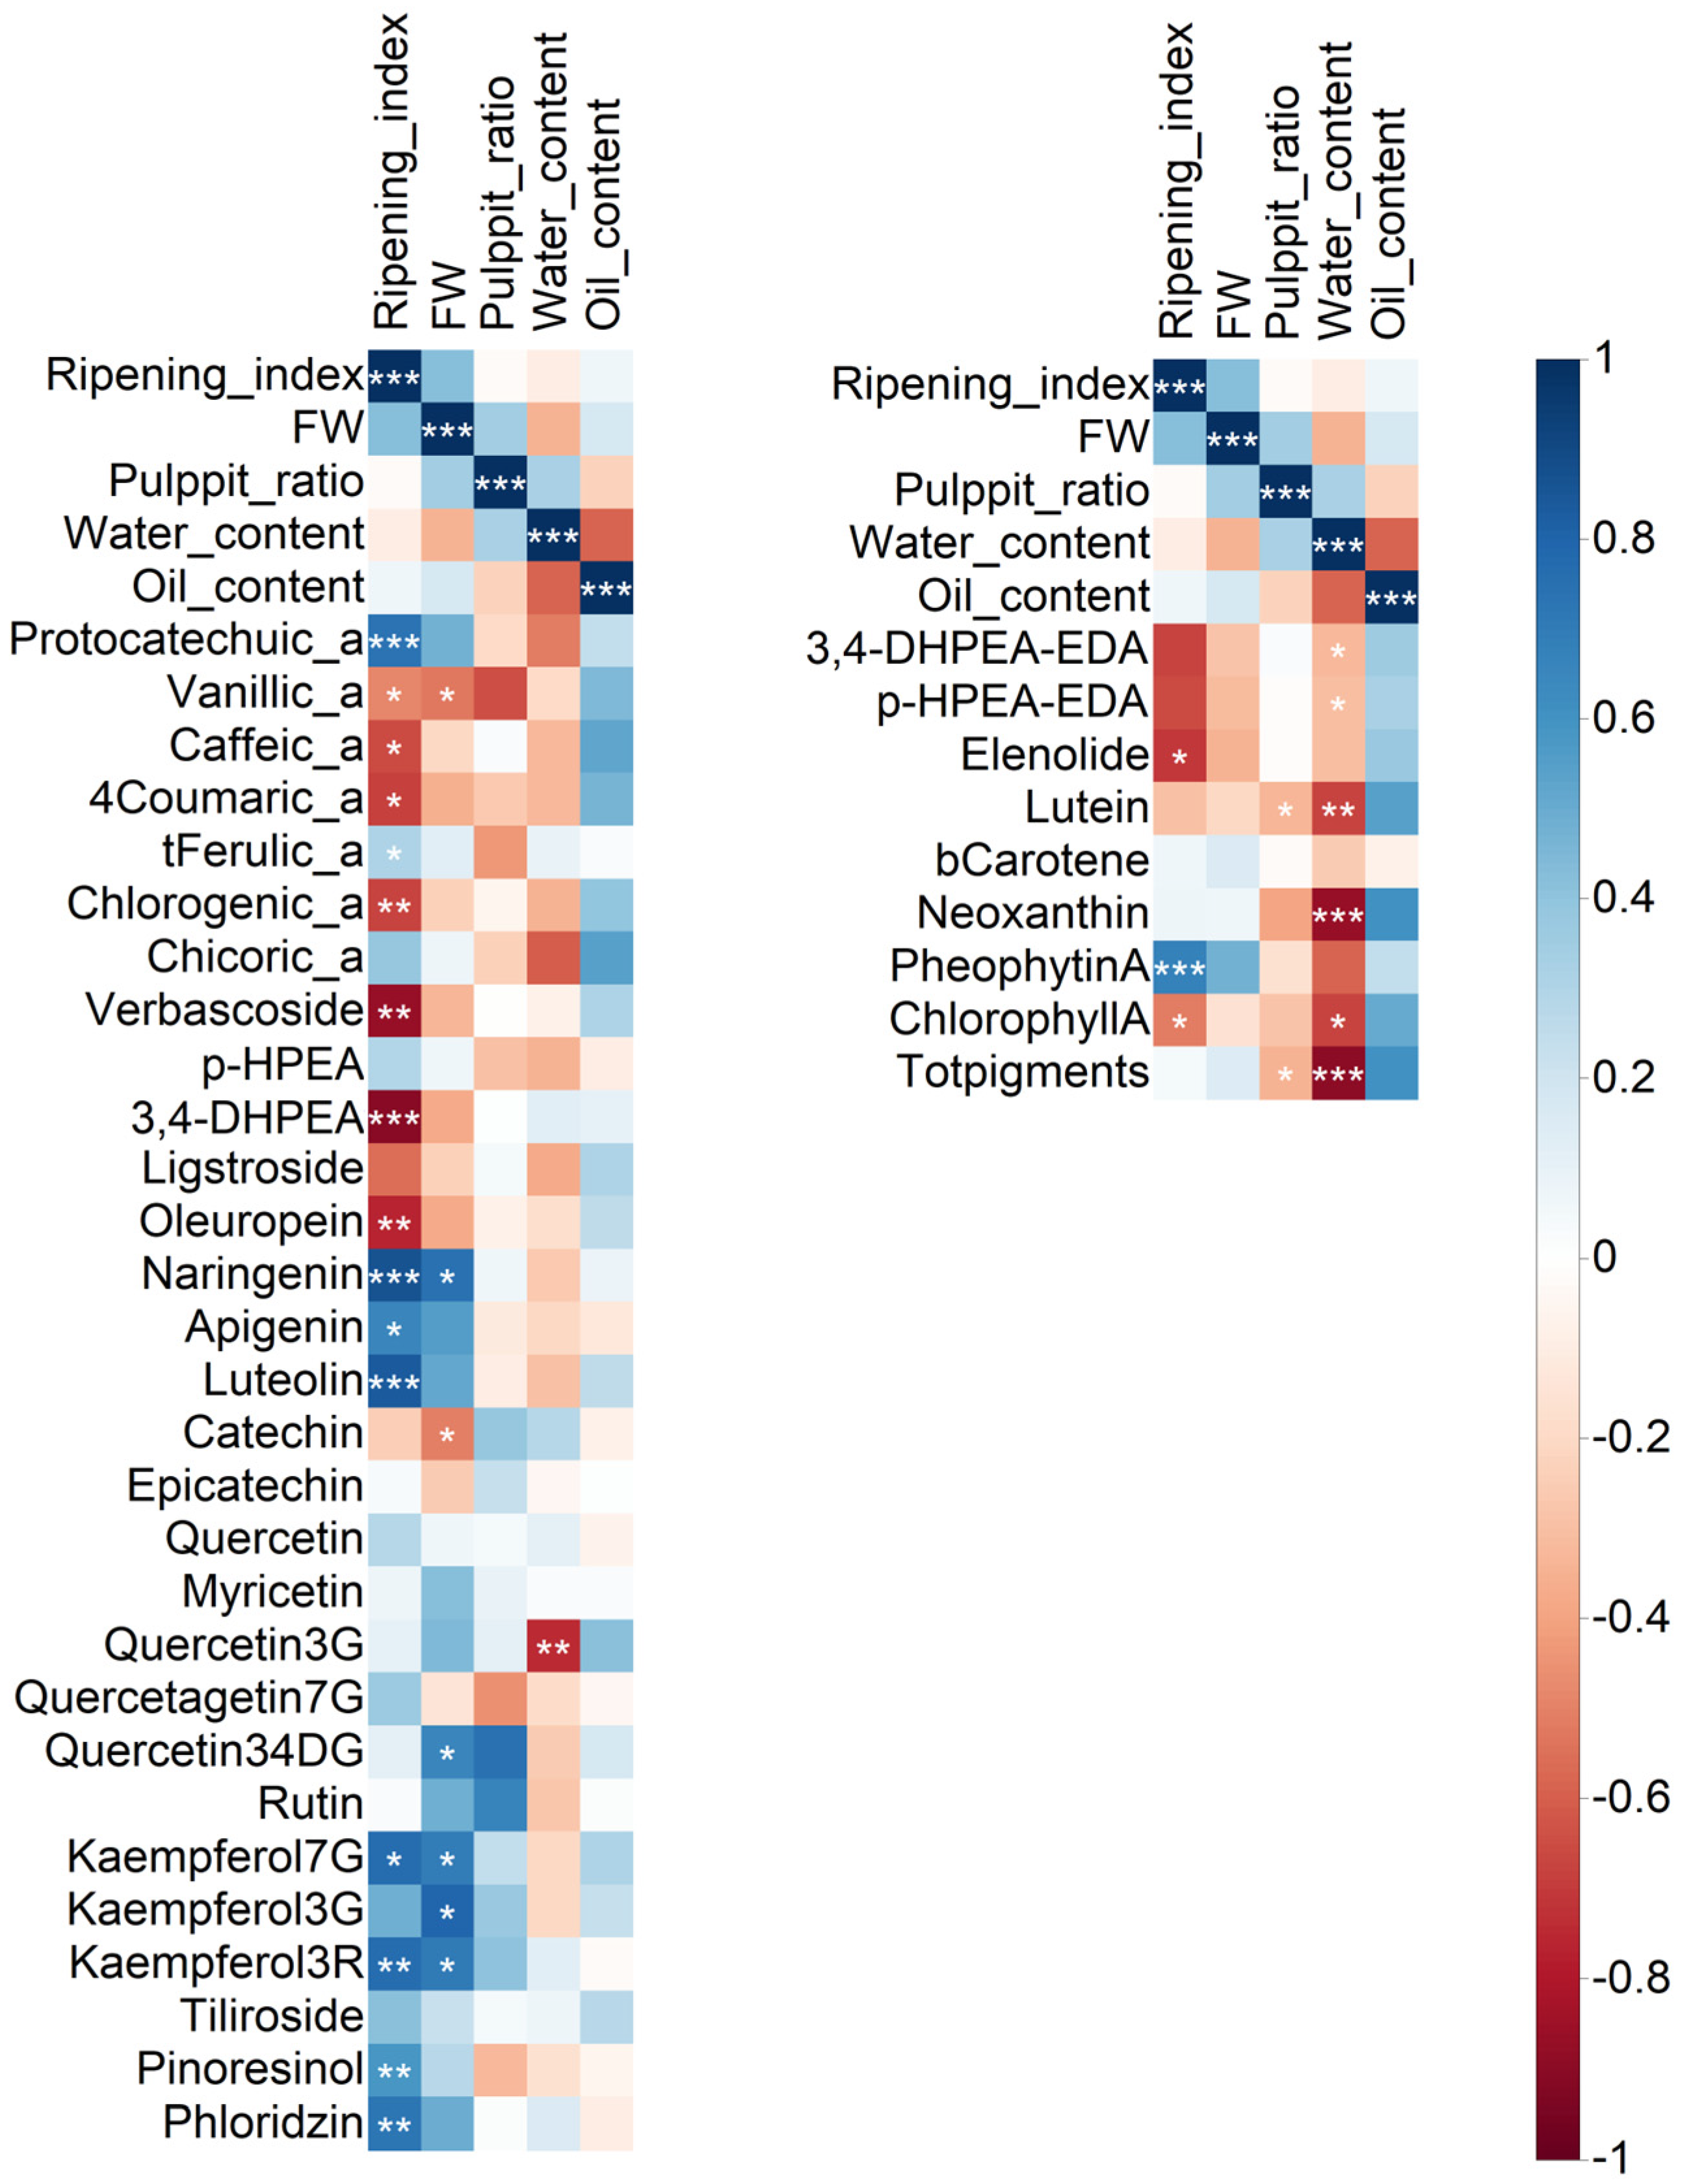
2.2. Correlation Analysis
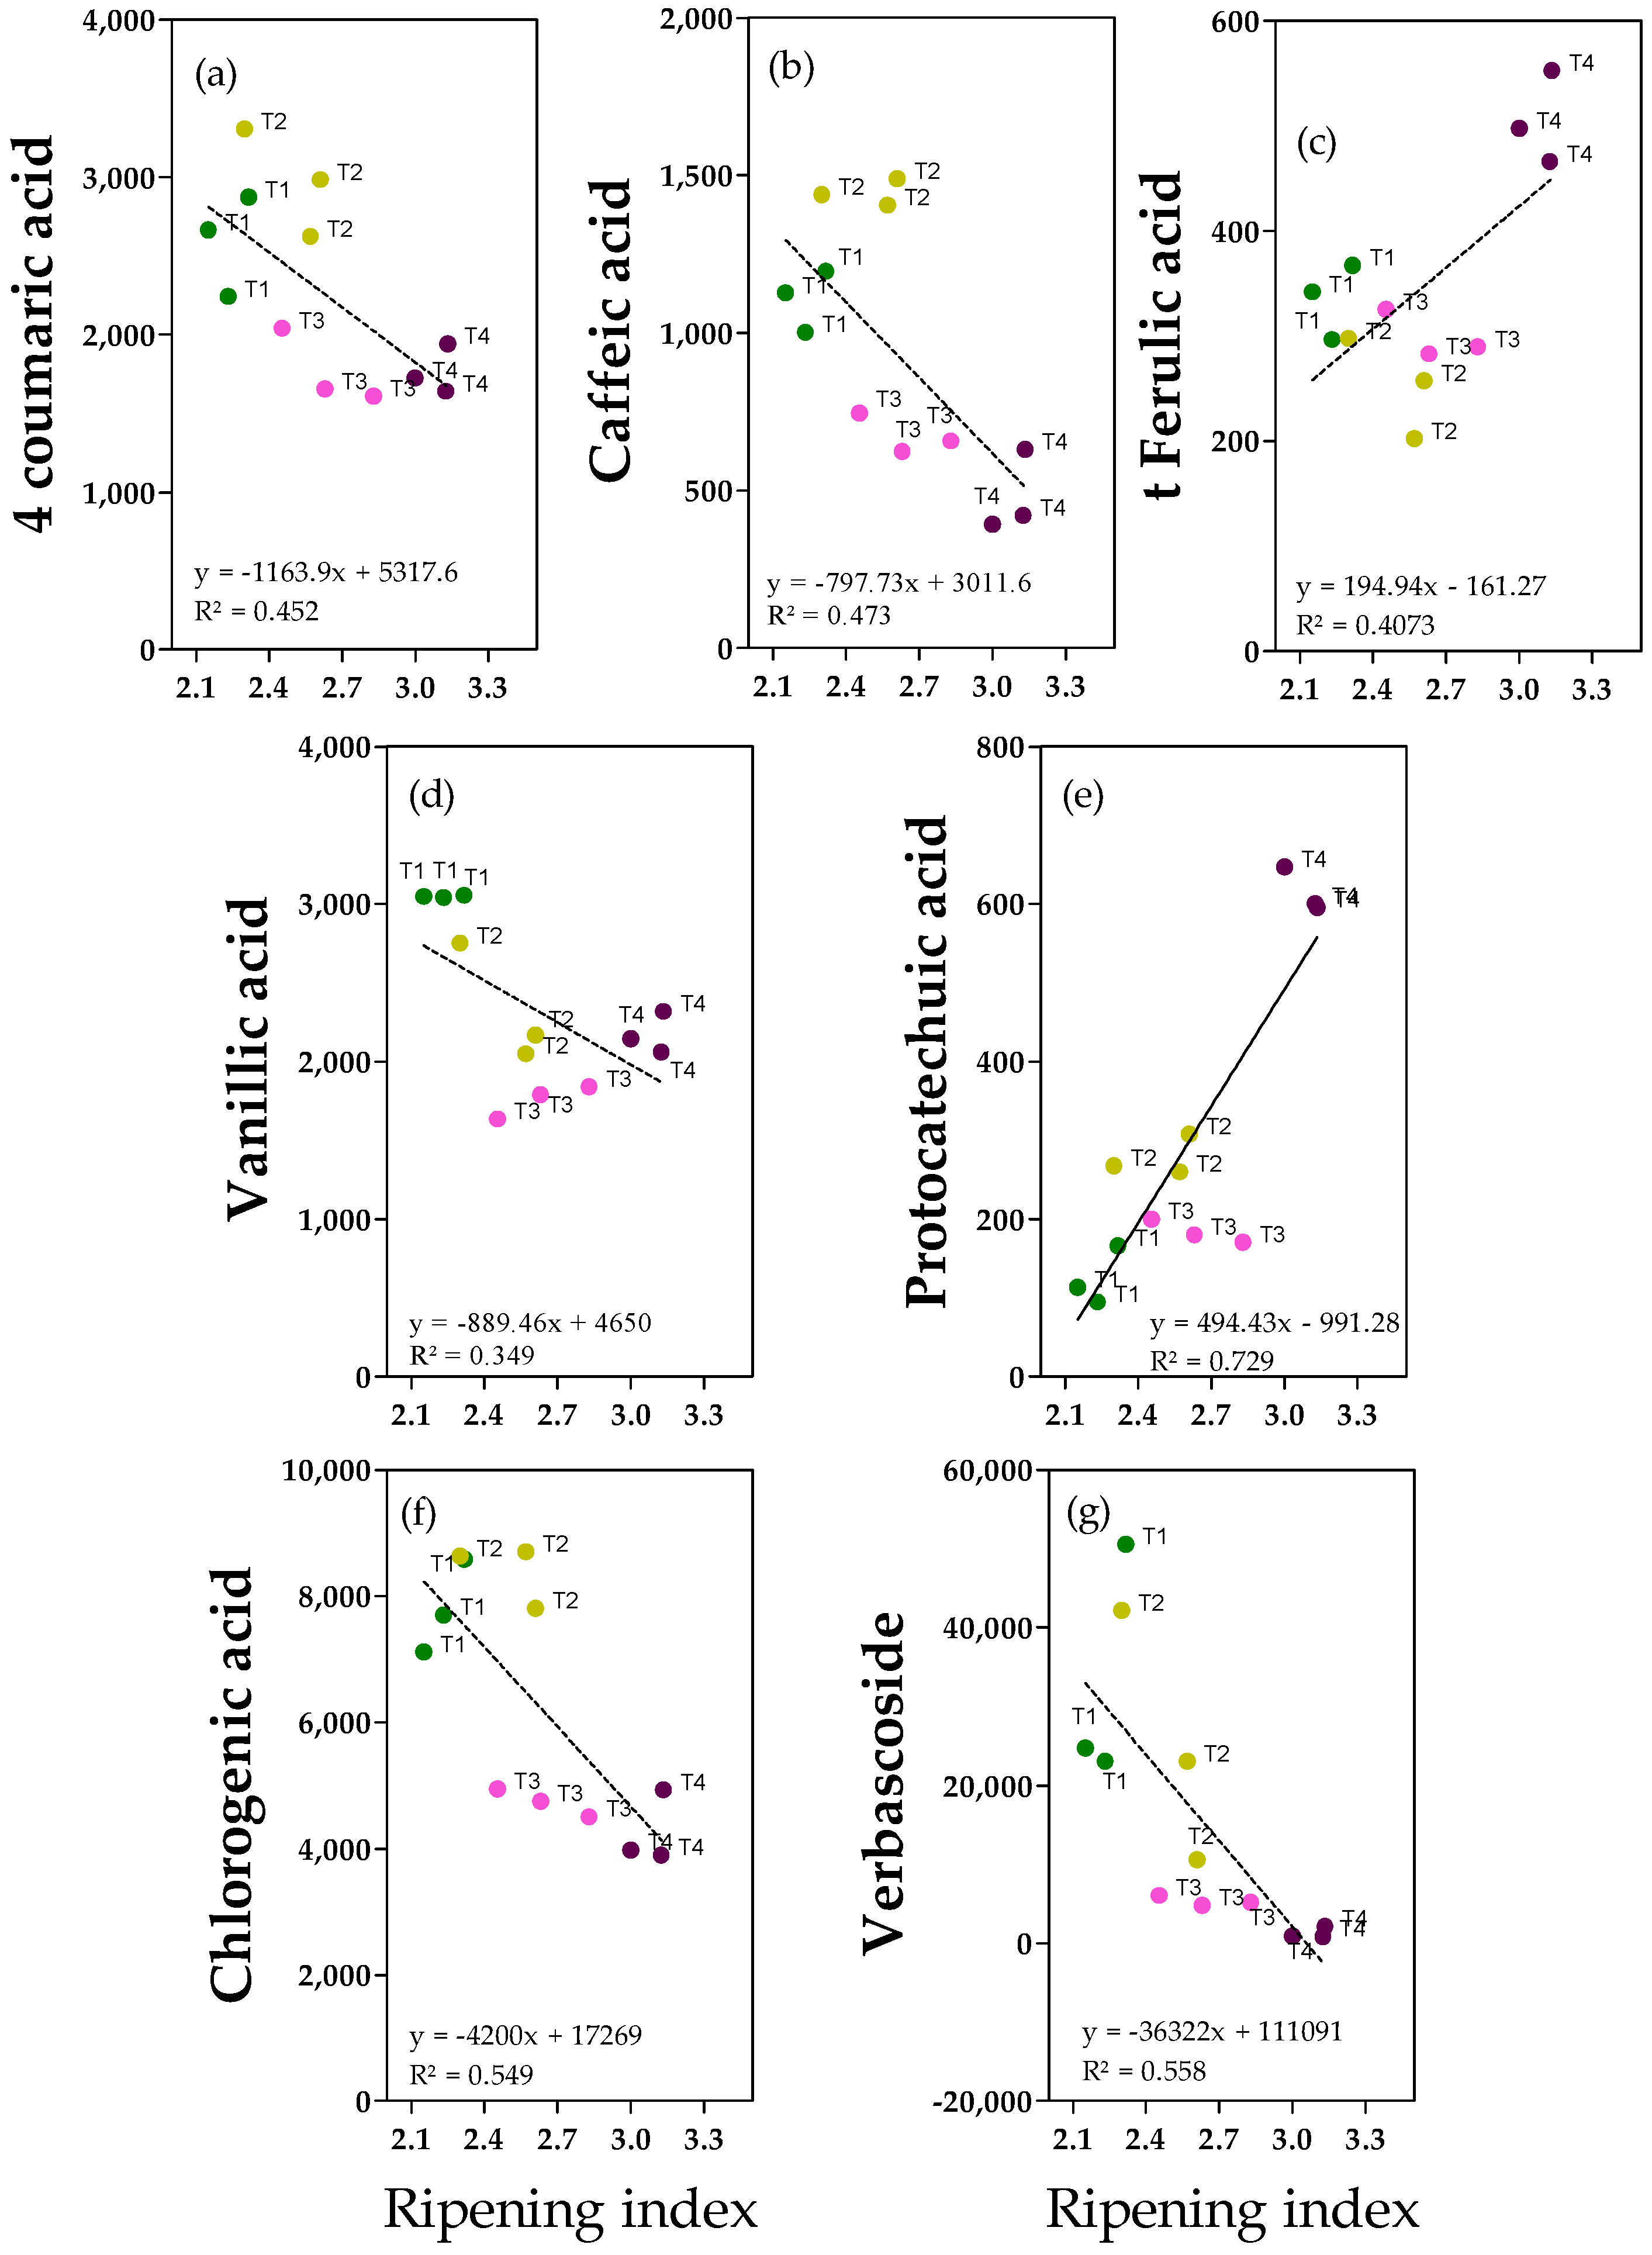
2.3. Phenolic Acids and Derivates
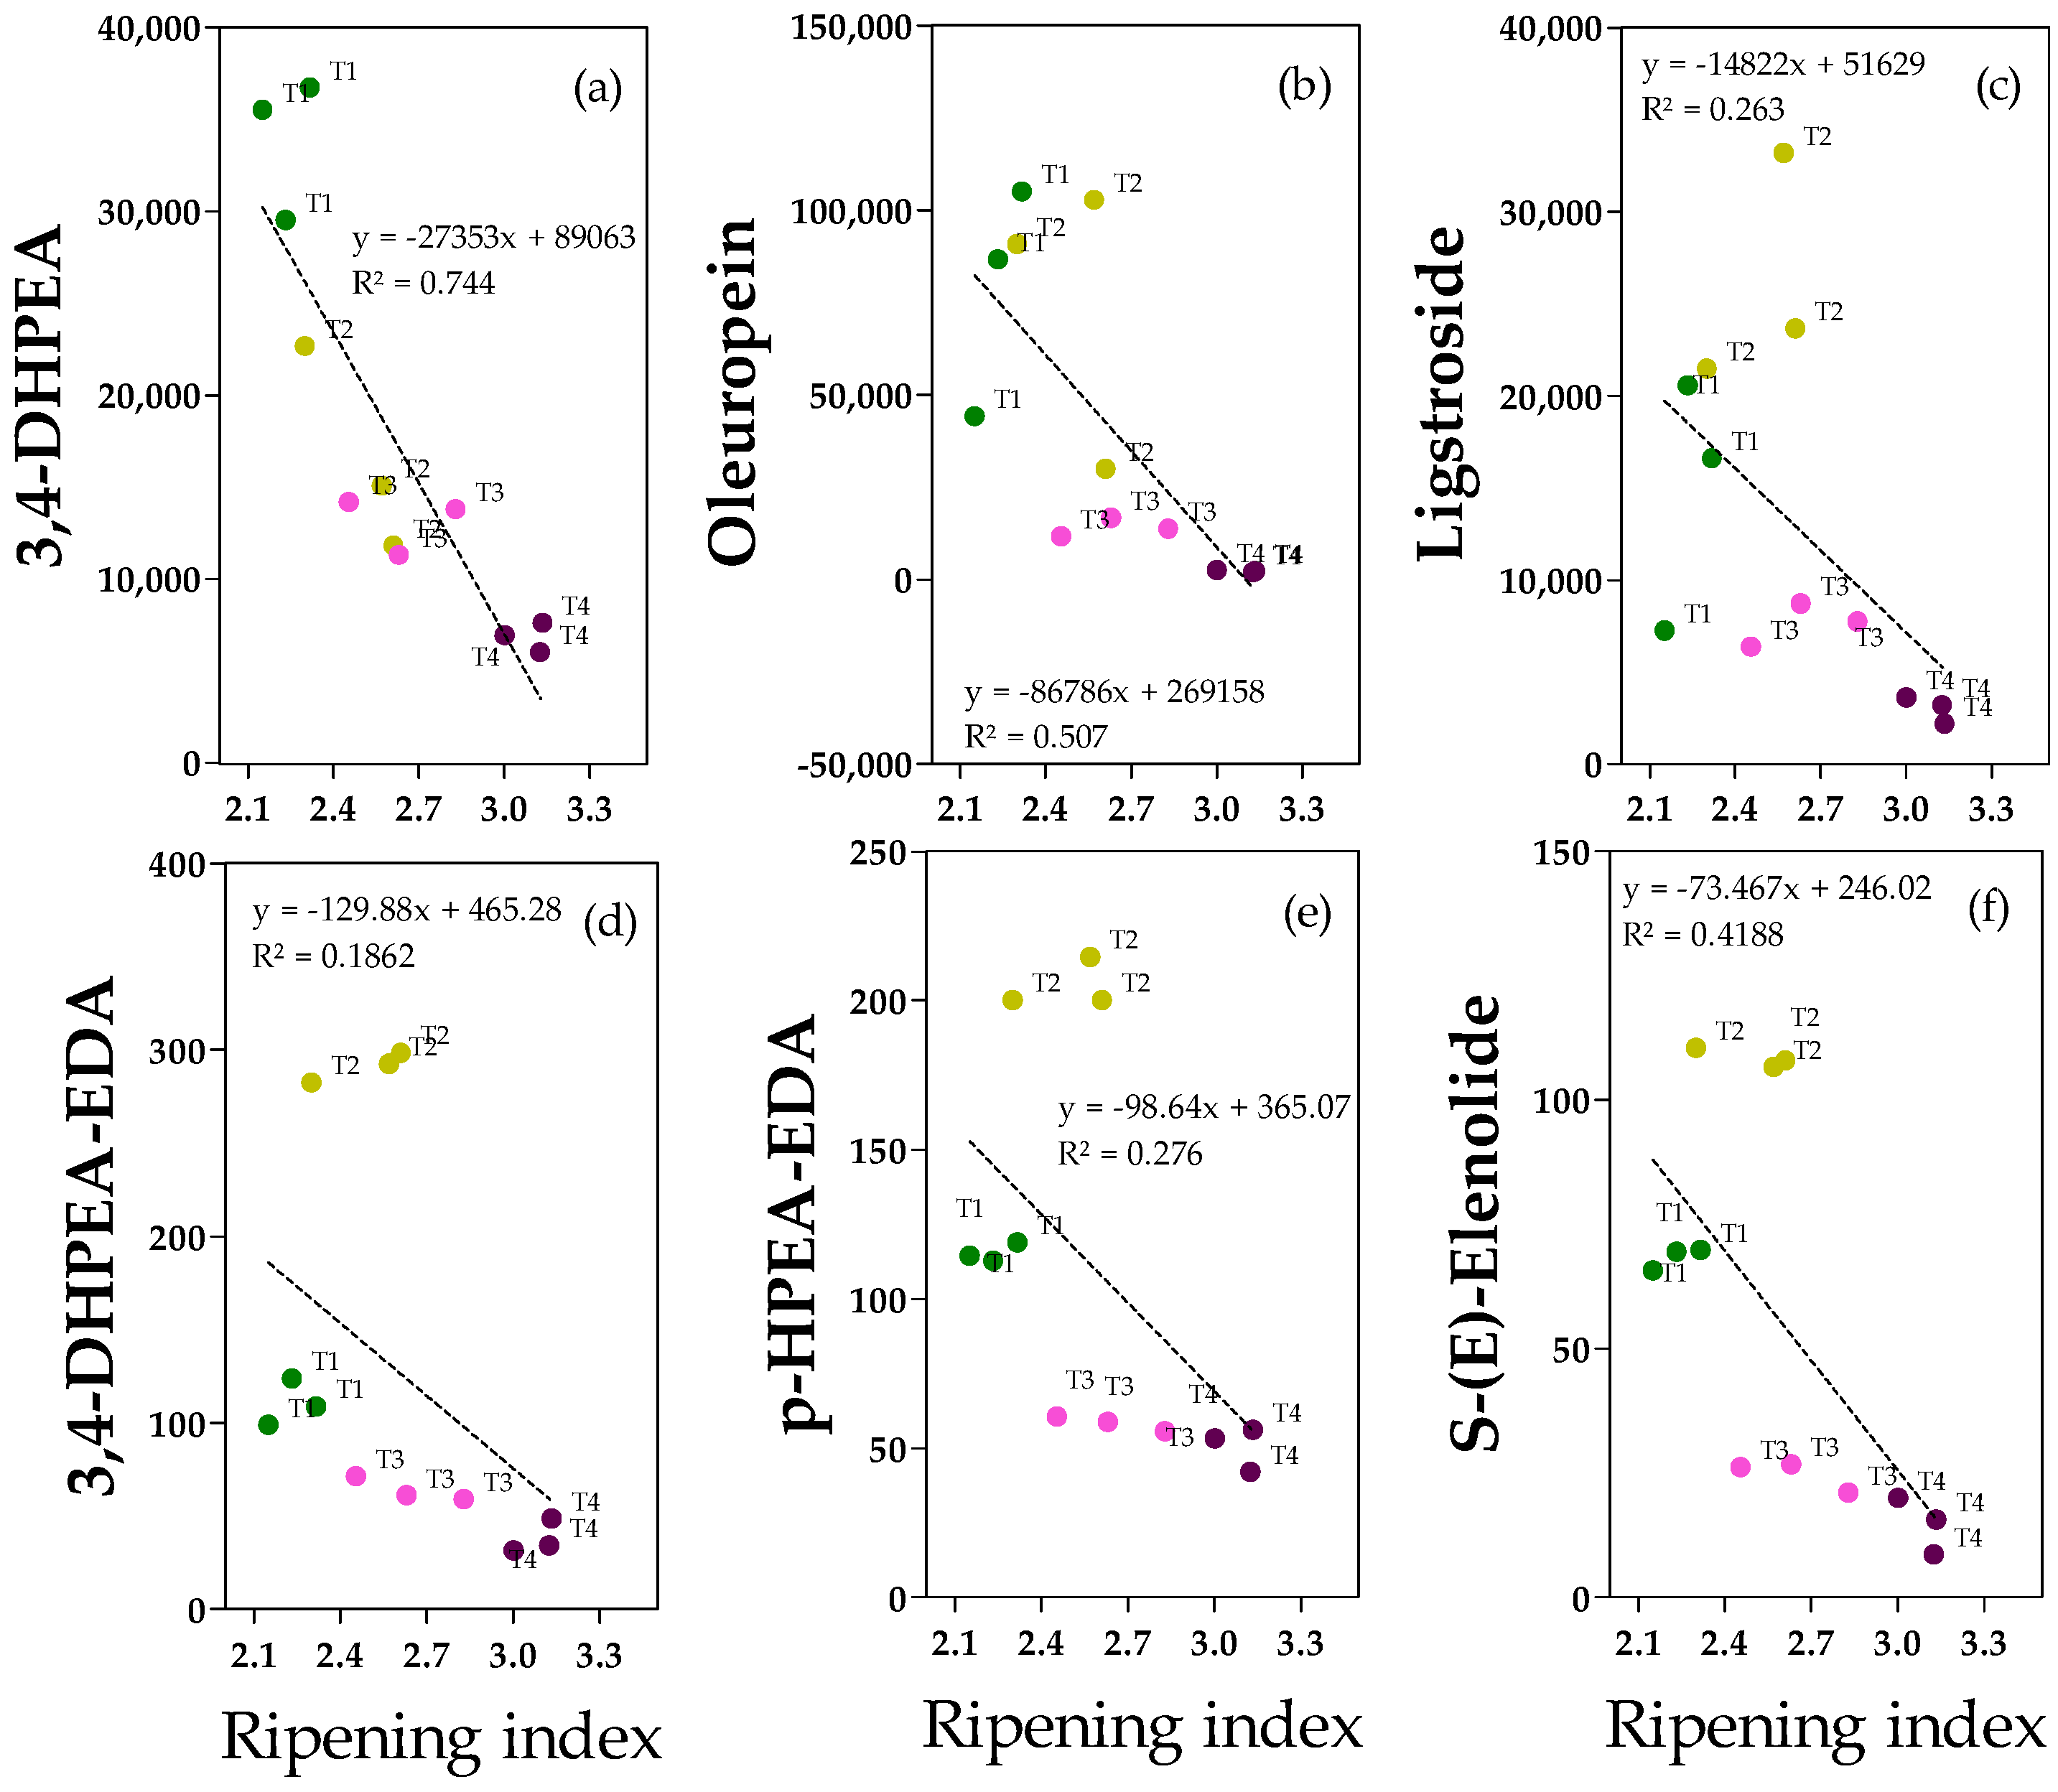
2.4. Phenolic Alcohols, Secoiridoids and Derivates
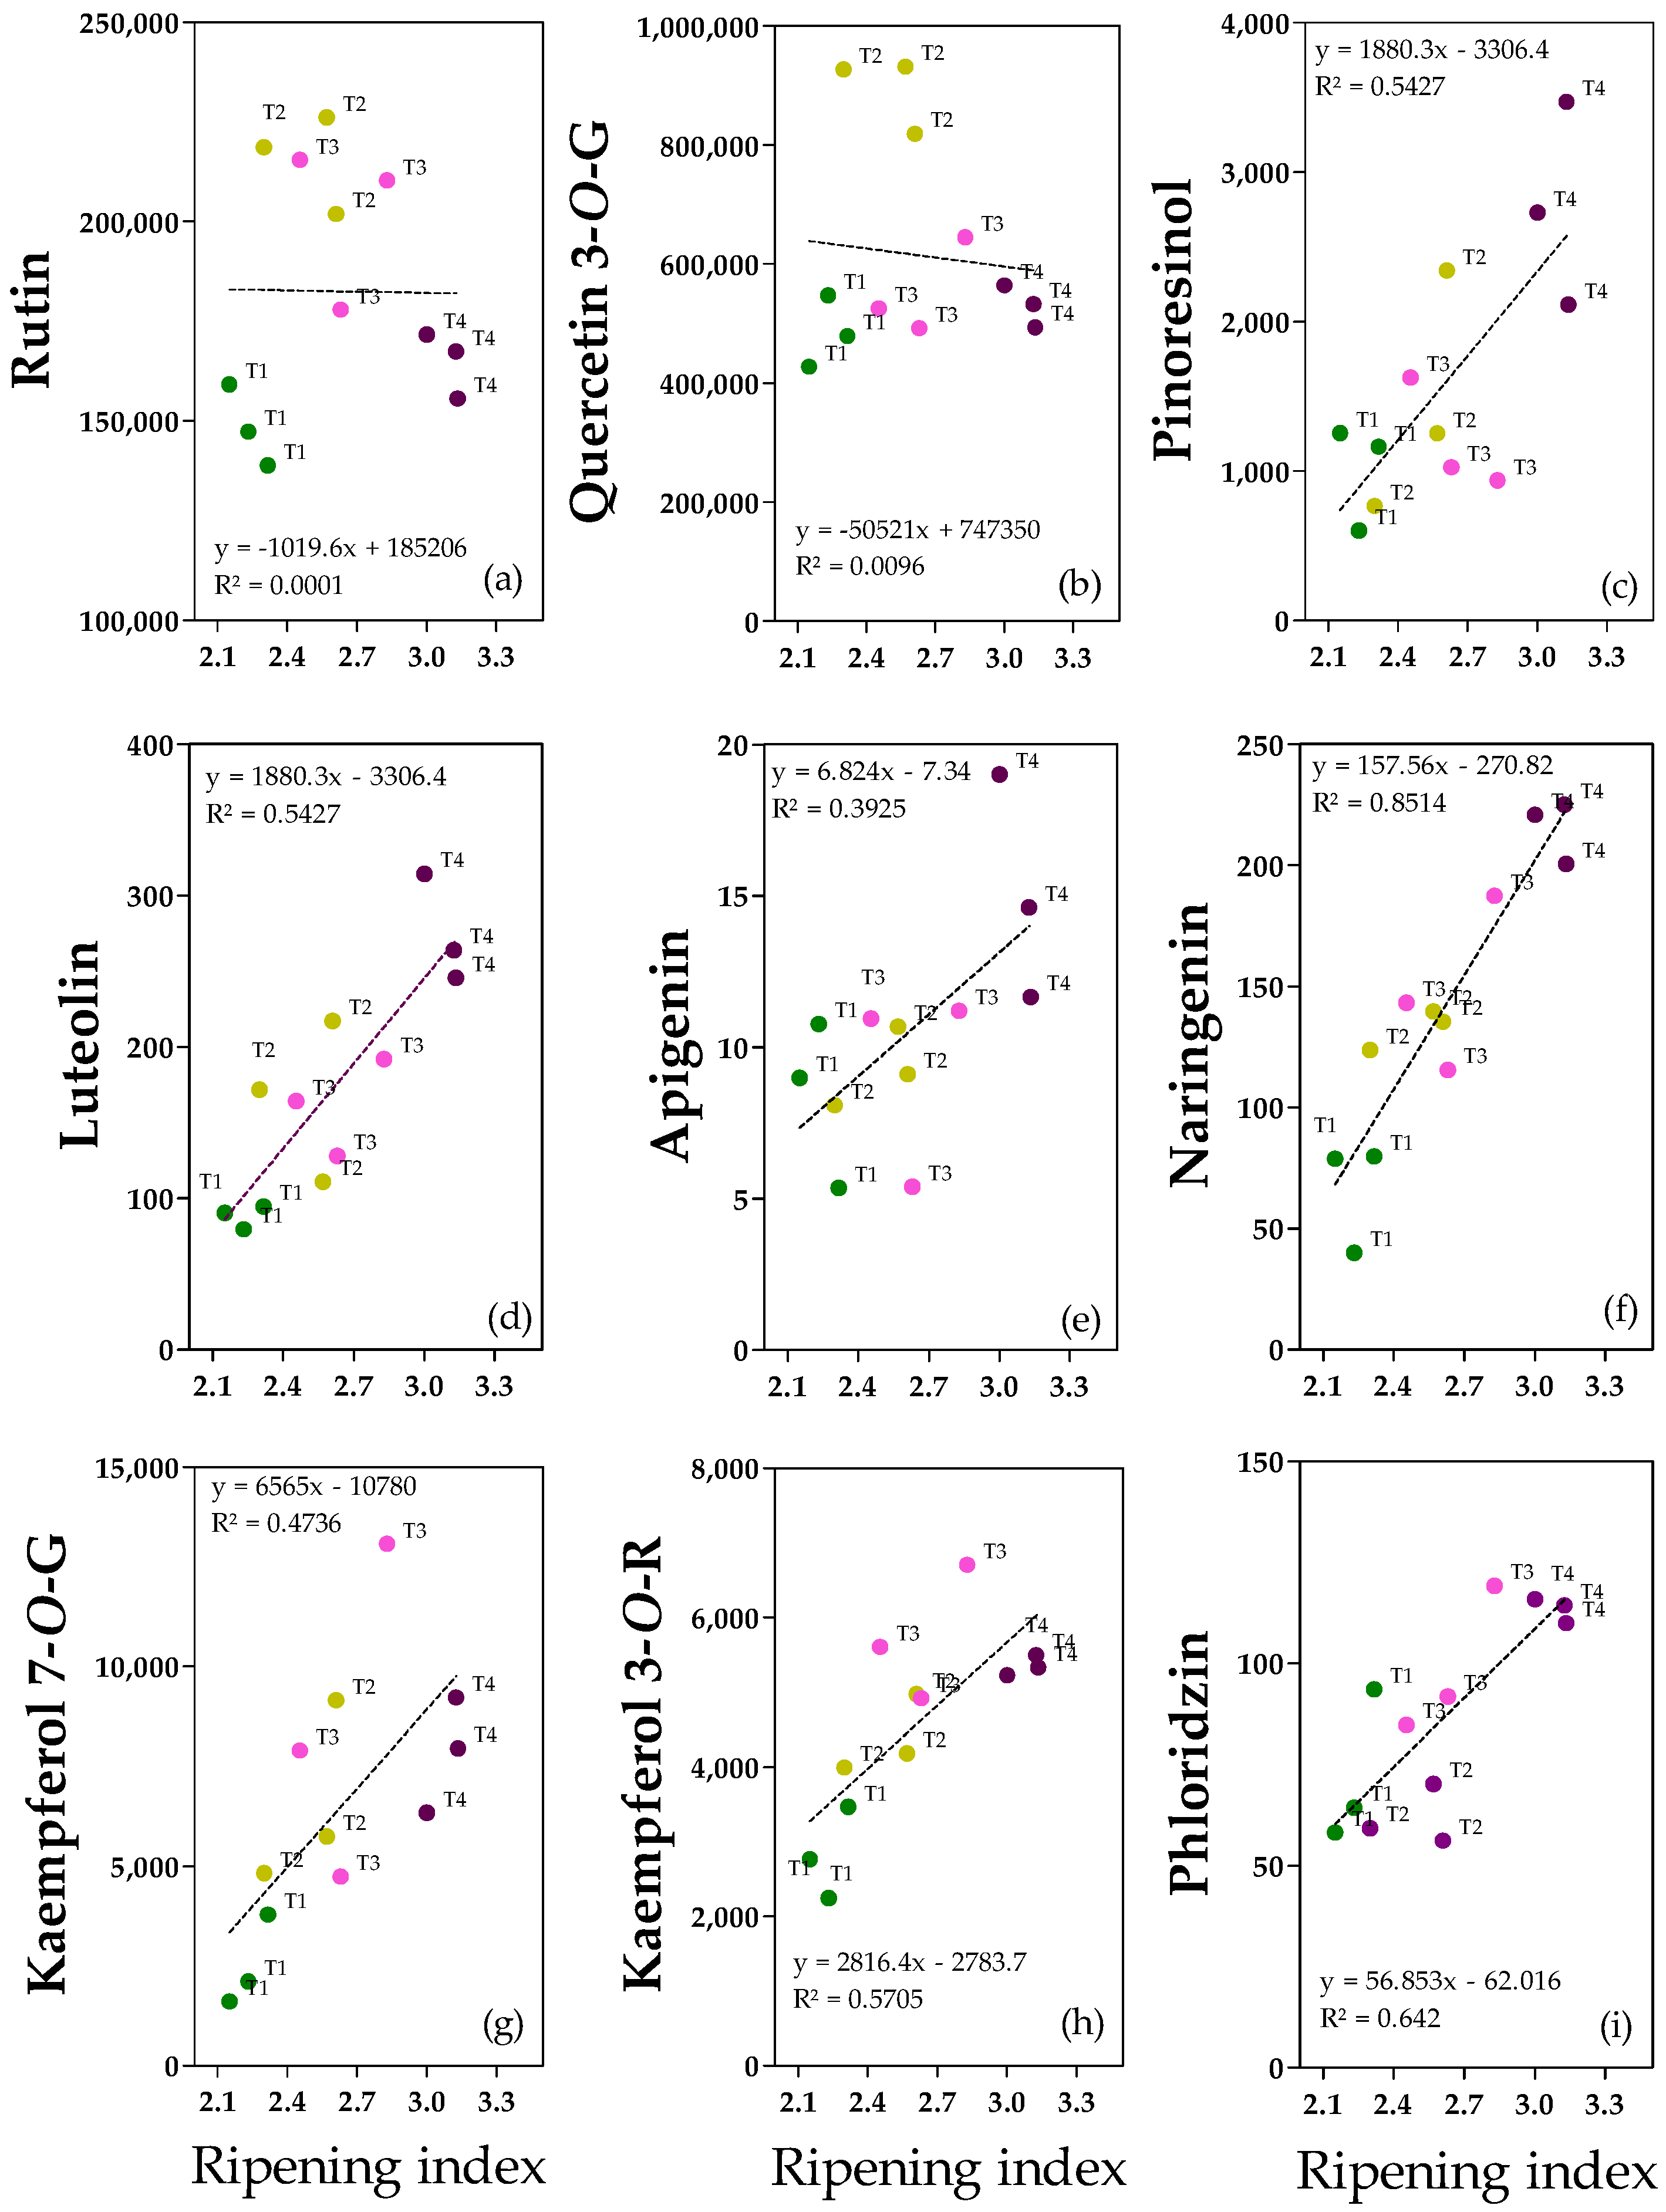
2.5. Flavonoids and Lignan
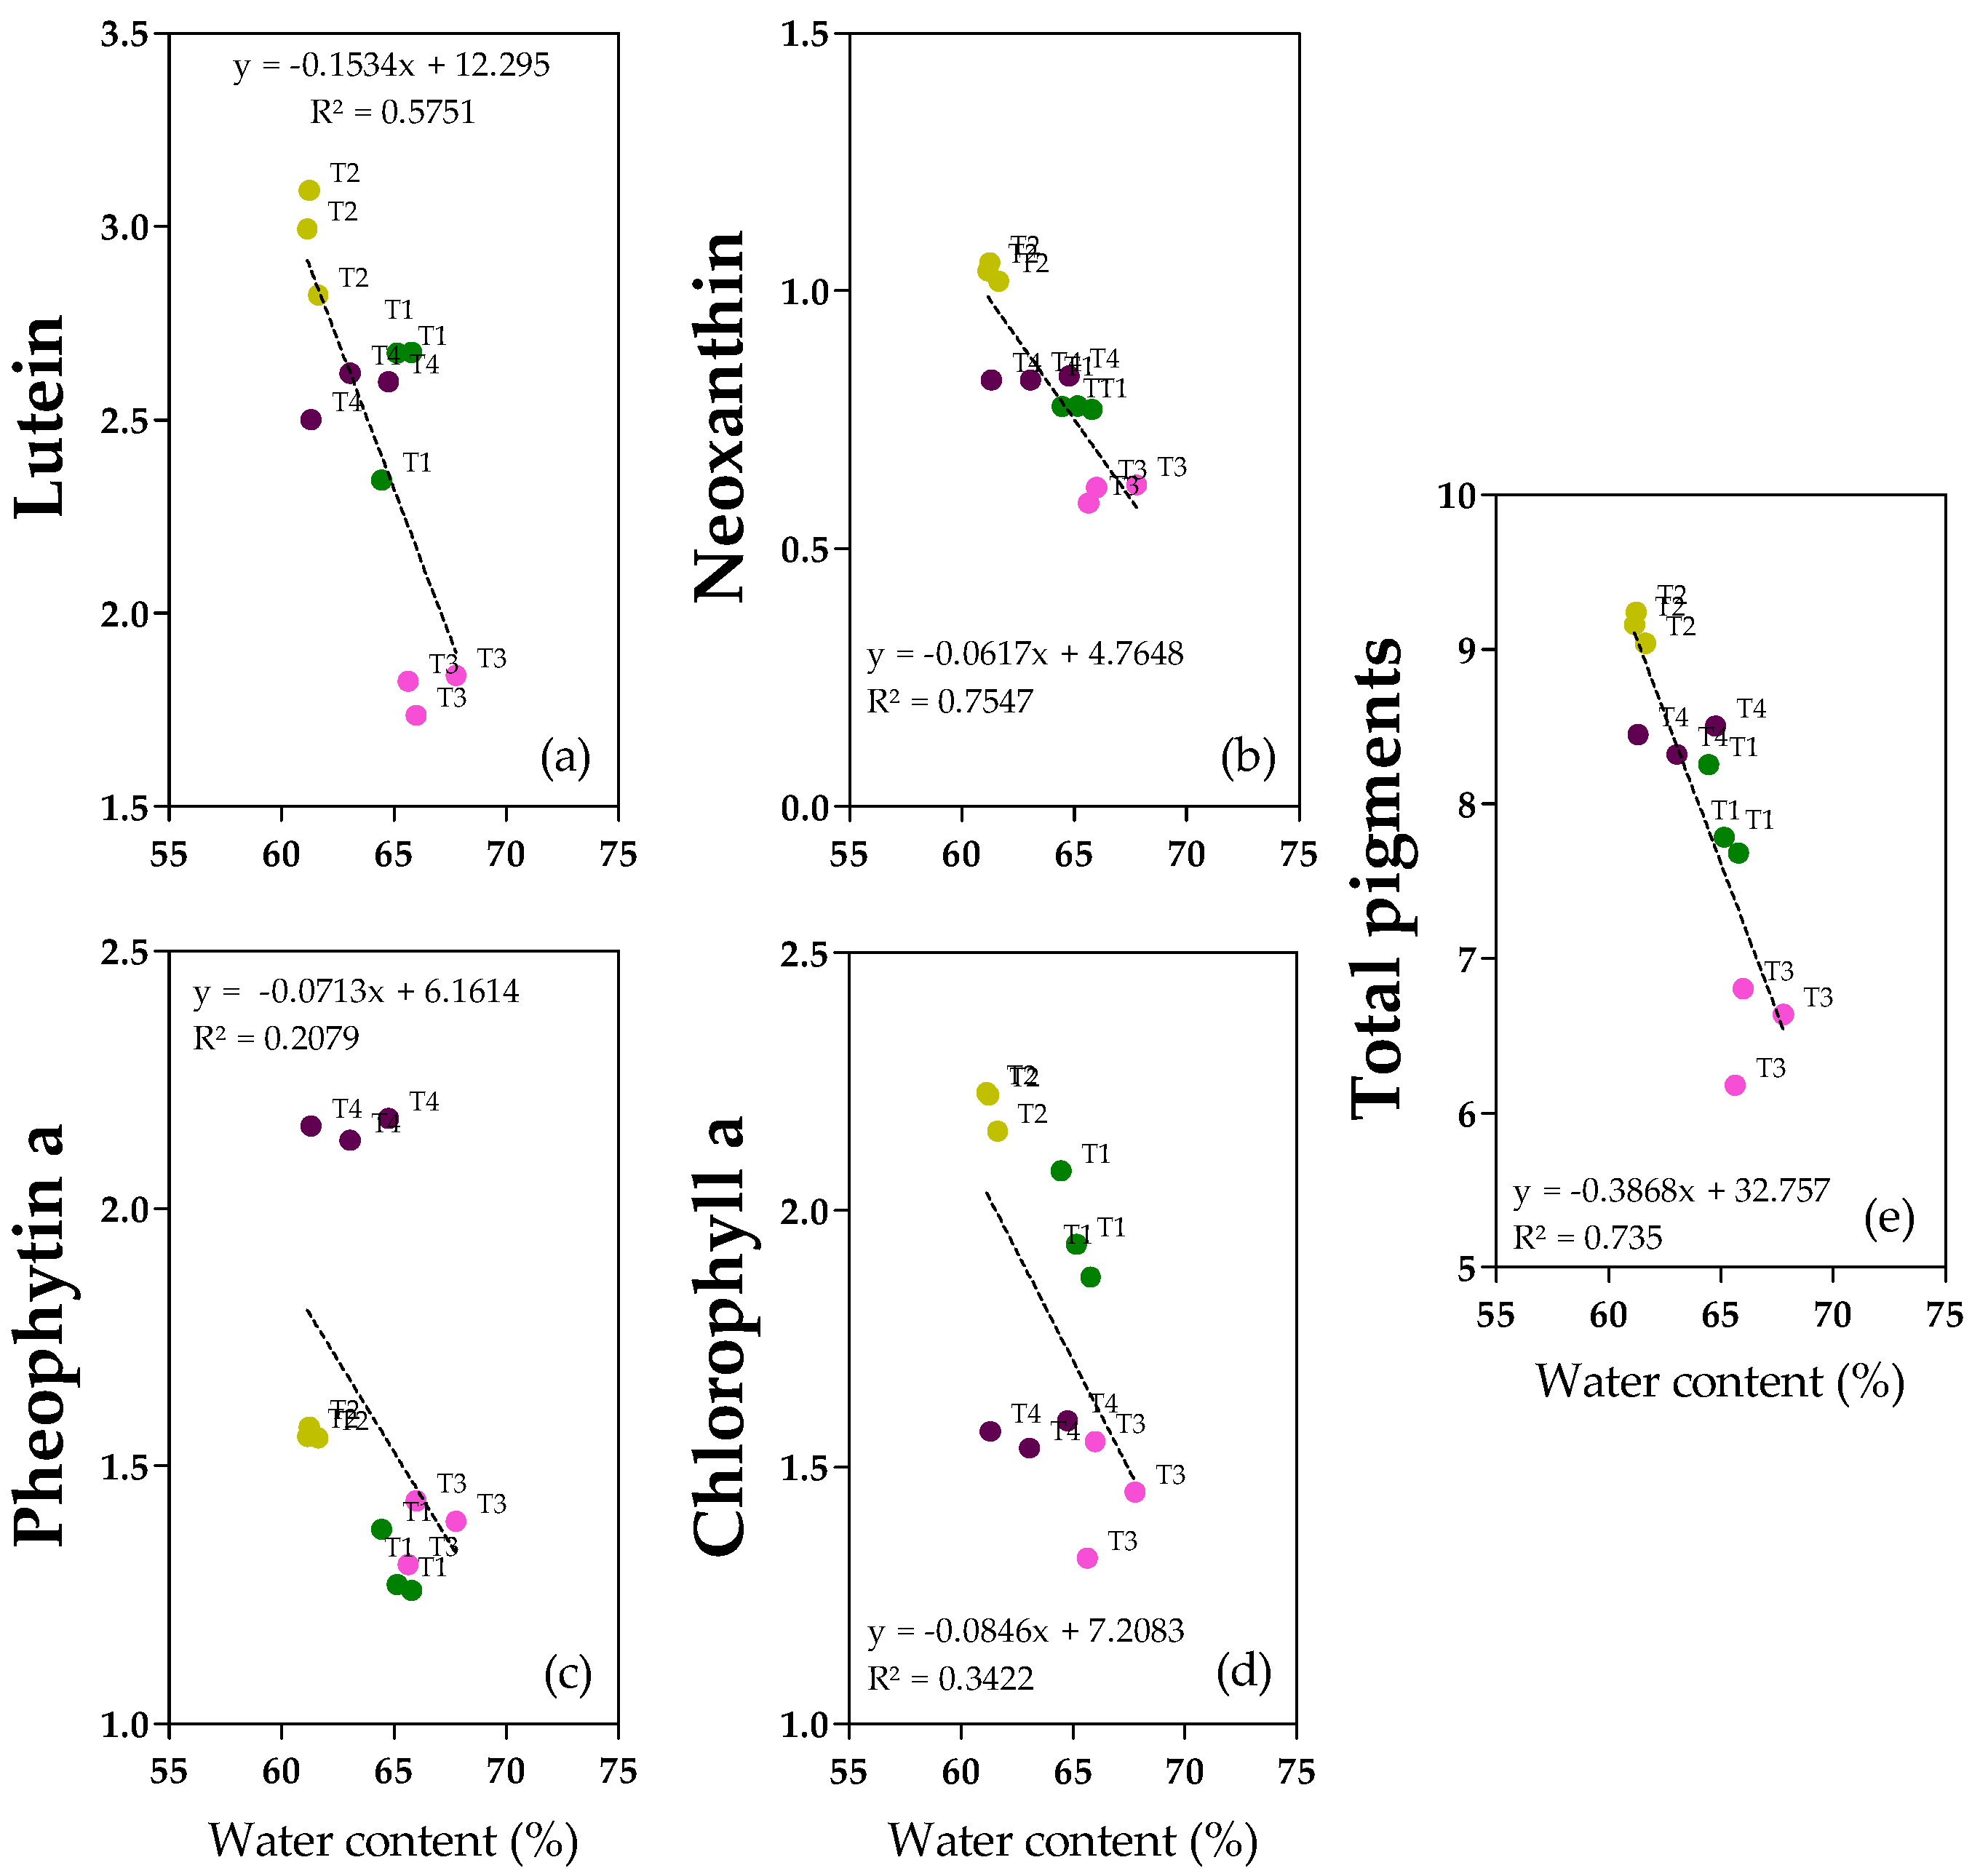
2.6. Pigments
3. Discussion
4. Materials and Methods
4.1. Experimental Material
- i.
- T1: Full irrigation with tilled soil.
- ii.
- T2: Reduced irrigation with tilled soil.
- iii.
- T3: full irrigation with non-tilled soil.
- iv.
- T4: Reduced irrigation with non-tilled soil.
4.2. Fruit Traits
4.3. Phenolic Compounds Determination in Olive Fruit
4.4. Secoiridoids Quantification in Olive Oil
4.5. Pigments Determination in Olive Oil
4.6. Statistical Analysis
5. Conclusions
Supplementary Materials
Author Contributions
Funding
Data Availability Statement
Conflicts of Interest
References
- Obied, H.K.; Prenzler, P.D.; Ryan, D.; Servili, M.; Taticchi, A.; Esposto, S.; Robards, K. Biosynthesis and biotransformations of phenol-conjugated oleosidic secoiridoids from Olea europaea L. Nat. Prod. Rep. 2008, 25, 1167–1179. [Google Scholar] [CrossRef] [PubMed]
- Finicelli, M.; Squillaro, T.; Galderisi, U.; Peluso, G. Polyphenols, the healthy brand of olive oil: Insights and perspectives. Nutrients 2021, 13, 3831. [Google Scholar] [CrossRef] [PubMed]
- Servili, M.; Montedoro, G. Contribution of phenolic compounds to virgin olive oil quality. Eur. J. Lipid Sci. Technol. 2002, 104, 602–613. [Google Scholar] [CrossRef]
- Montedoro, G.; Baldioli, M.; Selvaggini, R.; Begliomini, A.L.; Taticchi, A.; Servili, M. Relationships between phenolic composition of olive fruit and olive oil: The importance of the endogenous enzymes. IV Int. Symp. Olive Grow. 2000, 2, 551–556. [Google Scholar] [CrossRef]
- García-Rodríguez, R.; Romero-Segura, C.; Sanz, C.; Sánchez-Ortiz, A.; Pérez, A.G. Role of polyphenol oxidase and peroxidase in shaping the phenolic profile of virgin olive oil. Food Res. Int. 2011, 44, 629–635. [Google Scholar] [CrossRef]
- Servili, M.; Selvaggini, R.; Esposto, S.; Taticchi, A.; Montedoro, G.; Morozzi, G. Health and sensory properties of virgin olive oil hydrophilic phenols: Agronomic and technological aspects of production that affect their occurrence in the oil. J. Chromatogr. A 2004, 1054, 113–127. [Google Scholar] [CrossRef]
- EFSA Panel on Dietetic Products, Nutrition and Allergies (NDA). Scientific opinion on the substantiation of health claims related to polyphenols in olive and protection of LDL particles from oxidative damage (ID 1333, 1638, 1639, 1696, 2865), maintenance of normal blood HDL cholesterol concentrations (ID 1639), maintenance of normal blood pressure (ID 3781),“anti-inflammatory properties”(ID 1882),“contributes to the upper respiratory tract health”(ID 3468),“can help to maintain a normal function of gastrointestinal tract”(3779), and “contributes to body defences. EFSA J. 2011, 9, 2033. [Google Scholar] [CrossRef]
- Ryan, D.; Antolovich, M.; Herlt, T.; Prenzler, P.D.; Lavee, S.; Robards, K. Identification of phenolic compounds in tissues of the novel olive cultivar hardy’s mammoth. J. Agric. Food Chem. 2002, 50, 6716–6724. [Google Scholar] [CrossRef]
- Criado, M.N.; Motilva, M.J.; Ramo, T.; Romero, M.P. Chlorophyll and carotenoid profile and enzymatic activities (chlorophyllase and lipoxygenase) in olive drupes from the fruit-setting period to harvest time. J. Am. Soc. Hortic. Sci. 2006, 131, 593–600. [Google Scholar] [CrossRef]
- Minguez-Mosquera, M.I.; Gandul-Rojas, B.; Garrido-Fernandez, J.; Gallardo-Guerrero, L. Pigments present in virgin olive oil. J. Am. Oil Chem. Soc. 1990, 67, 192–196. [Google Scholar] [CrossRef]
- Giuliani, A.; Cerretani, L.; Cichelli, A. Chlorophylls in olive and in olive oil: Chemistry and occurrences. Crit. Rev. Food Sci. Nutr. 2011, 51, 678–690. [Google Scholar] [CrossRef]
- Gandul-Rojas, B.; Minguez-Mosquera, M.I. Chlorophyll and carotenoid composition in virgin olive oils from various Spanish olive varieties. J. Sci. Food Agric. 1996, 72, 31–39. [Google Scholar] [CrossRef]
- Rallo, L.; Díez, C.M.; Morales-Sillero, A.; Miho, H.; Priego-Capote, F.; Rallo, P. Quality of olives: A focus on agricultural preharvest factors. Sci. Hortic. 2018, 233, 491–509. [Google Scholar] [CrossRef]
- Amiot, M.J.; Fleuriet, A.; Macheix, J.J. Importance and evolution of phenolic compounds in olive during growth and maturation. J. Agric. Food Chem. 1986, 34, 823–826. [Google Scholar] [CrossRef]
- Morelló, J.R.; Romero, M.P.; Motilva, M.J. Effect of the maturation process of the olive fruit on the phenolic fraction of drupes and oils from Arbequina, Farga, and Morrut cultivars. J. Agric. Food Chem. 2004, 52, 6002–6009. [Google Scholar] [CrossRef] [PubMed]
- Damak, N.; Bouaziz, M.; Ayadi, M.; Sayadi, S.; Damak, M. Effect of the maturation process on the phenolic fractions, fatty acids, and antioxidant activity of the Chétoui olive fruit cultivar. J. Agric. Food Chem. 2008, 56, 1560–1566. [Google Scholar] [CrossRef]
- Cecchi, L.; Migliorini, M.; Cherubini, C.; Giusti, M.; Zanoni, B.; Innocenti, M.; Mulinacci, N. Phenolic profiles, oil amount and sugar content during olive ripening of three typical Tuscan cultivars to detect the best harvesting time for oil production. Food Res. Int. 2013, 54, 1876–1884. [Google Scholar] [CrossRef]
- Gómez-Rico, A.; Fregapane, G.; Salvador, M.D. Effect of cultivar and ripening on minor components in Spanish olive fruits and their corresponding virgin olive oils. Food Res. Int. 2008, 41, 433–440. [Google Scholar] [CrossRef]
- Gandul-Rojas, B.; Cepero, M.R.L.; Mínguez-Mosquera, M.I. Chlorophyll and carotenoid patterns in olive fruits, Olea europaea cv. Arbequina. J. Agric. Food Chem. 1999, 47, 2207–2212. [Google Scholar] [CrossRef]
- García, J.M.; Hueso, A.; Gómez-del-Campo, M. Deficit irrigation during the oil synthesis period affects olive oil quality in high-density orchards (cv. Arbequina). Agric. Water Manag. 2020, 230, 105858. [Google Scholar] [CrossRef]
- Garcia-Gonzalez, I.; Garcia-Diaz, A.; Sastre, B.; Teutscherova, N.; Pérez, M.Á.; Bienes, R.; Espejo, R.; Hontoria, C. Mycorrhizal, nutritional and virgin olive oil parameters affected by groundcovers. J. Plant Nutr. Soil Sci. 2019, 182, 815–823. [Google Scholar] [CrossRef]
- Tovar, M.J.; Romero, M.P.; Girona, J.; Motilva, M.J. l-Phenylalanine ammonia-lyase activity and concentration of phenolics in developing olive (Olea europaea L cv Arbequina) fruit grown under different irrigation regimes. J. Sci. Food Agric. 2002, 82, 892–898. [Google Scholar] [CrossRef]
- Servili, M.; Esposto, S.; Lodolini, E.; Selvaggini, R.; Taticchi, A.; Urbani, S.; Montedoro, G.; Serravalle, M.; Gucci, R. Irrigation effects on quality, phenolic composition, and selected volatiles of virgin olive oils cv. Leccino. J. Agric. Food Chem. 2007, 55, 6609–6618. [Google Scholar] [CrossRef] [PubMed]
- García, J.M.; Cuevas, M.V.; Fernández, J.E. Production and oil quality in ‘Arbequina’ olive (Olea europaea, L.) trees under two deficit irrigation strategies. Irrig. Sci. 2013, 31, 359–370. [Google Scholar] [CrossRef]
- Sastre, B.; Arbonés, A.; Pérez-Jiménez, M.Á.; Pascual, M.; Benito, A.; de Lorenzo, C.; Villar, J.M.; Bonet, L.J.; Paz, S.; Santos, A.; et al. Influence of regulated deficit irrigation on arbequina’s crop yield and EVOOs quality and sensory profile. Agronomy 2022, 13, 31. [Google Scholar] [CrossRef]
- Rigakou, A.; Diamantakos, P.; Melliou, E.; Magiatis, P. S-(E)-Elenolide: A new constituent of extra virgin olive oil. J. Sci. Food Agric. 2019, 99, 5319–5326. [Google Scholar] [CrossRef]
- Pérez, A.G.; León, L.; Sanz, C.; De la Rosa, R. Fruit phenolic profiling: A new selection criterion in olive breeding programs. Front. Plant Sci. 2018, 9, 241. [Google Scholar] [CrossRef]
- Medina, G.; Sanz, C.; León, L.; Pérez, A.G.; de la Rosa, R. Phenolic variability in fruit from the ‘Arbequina’olive cultivar under Mediterranean and Subtropical climatic conditions. Grasas Aceites 2021, 72, e438. [Google Scholar] [CrossRef]
- Ortega-García, F.; Peragon, J. The response of phenylalanine ammonia-lyase, polyphenol oxidase and phenols to cold stress in the olive tree (Olea europaea L. cv. Picual). J. Sci. Food Agric. 2009, 89, 1565–1573. [Google Scholar] [CrossRef]
- Machado, M.; Felizardo, C.; Fernandes-Silva, A.A.; Nunes, F.M.; Barros, A. Polyphenolic compounds, antioxidant activity and l-phenylalanine ammonia-lyase activity during ripening of olive cv. “Cobrançosa” under different irrigation regimes. Food Res. Int. 2013, 51, 412–421. [Google Scholar] [CrossRef]
- Alagna, F.; Mariotti, R.; Panara, F.; Caporali, S.; Urbani, S.; Veneziani, G.; Esposto, S.; Taticchi, A.; Rosati, A.; Rao, R.; et al. Olive phenolic compounds: Metabolic and transcriptional profiling during fruit development. BMC Plant Biol. 2012, 12, 162. [Google Scholar] [CrossRef]
- De Torres, A.; Espínola, F.; Moya, M.; Alcalá, S.; Vidal, A.M.; Castro, E. Assessment of phenolic compounds in virgin olive oil by response surface methodology with particular focus on flavonoids and lignans. LWT 2018, 90, 22–30. [Google Scholar] [CrossRef]
- De Fernandez, M.D.L.A.; Soto Vargas, V.C.; Silva, M.F. Phenolic compounds and antioxidant capacity of monovarietal olive oils produced in Argentina. J. Am. Oil Chem. Soc. 2014, 91, 2021–2033. [Google Scholar] [CrossRef]
- Bouarroudj, K.; Tamendjari, A.; Larbat, R. Quality, composition and antioxidant activity of Algerian wild olive (Olea europaea L. subsp. Oleaster) oil. Ind. Crops Prod. 2016, 83, 484–491. [Google Scholar] [CrossRef]
- Tamasi, G.; Baratto, M.C.; Bonechi, C.; Byelyakova, A.; Pardini, A.; Donati, A.; Leone, G.; Consumi, M.; Lamponi, S.; Magnani, A.; et al. Chemical characterization and antioxidant properties of products and by-products from Olea europaea L. Food Sci. Nutr. 2019, 7, 2907–2920. [Google Scholar] [CrossRef] [PubMed]
- Artajo, L.S.; Romero, M.P.; Motilva, M.J. Transfer of phenolic compounds during olive oil extraction in relation to ripening stage of the fruit. J. Sci. Food Agric. 2006, 86, 518–527. [Google Scholar] [CrossRef]
- Rossi, L.; Borghi, M.; Francini, A.; Lin, X.; Xie, D.Y.; Sebastiani, L. Salt stress induces differential regulation of the phenylpropanoid pathway in Olea europaea cultivars Frantoio (salt-tolerant) and Leccino (salt-sensitive). J. Plant Physiol. 2016, 204, 8–15. [Google Scholar] [CrossRef]
- Ghisoni, S.; Lucini, L.; Angilletta, F.; Rocchetti, G.; Farinelli, D.; Tombesi, S.; Trevisan, M. Discrimination of extra-virgin-olive oils from different cultivars and geographical origins by untargeted metabolomics. Food Res. Int. 2019, 121, 746–753. [Google Scholar] [CrossRef]
- Niu, E.; Hu, W.; Ding, J.; Wang, W.; Romero, A.; Shen, G.; Zhu, S. GC-MS/LC-MS and transcriptome analyses revealed the metabolisms of fatty acid and flavonoid in olive fruits (Olea europaea L.). Sci. Hortic. 2022, 299, 111017. [Google Scholar] [CrossRef]
- Ahmad, N.; Zuo, Y.; Lu, X.; Anwar, F.; Hameed, S. Characterization of free and conjugated phenolic compounds in fruits of selected wild plants. Food Chem. 2016, 190, 80–89. [Google Scholar] [CrossRef]
- Zhang, C.; Xin, X.; Zhang, J.; Zhu, S.; Niu, E.; Zhou, Z.; Liu, D. Comparative evaluation of the phytochemical profiles and antioxidant potentials of olive leaves from 32 cultivars grown in China. Molecules 2022, 27, 1292. [Google Scholar] [CrossRef] [PubMed]
- Benito, M.; Lasa, J.M.; Gracia, P.; Oria, R.; Abenoza, M.; Varona, L.; Sánchez-Gimeno, A.C. Olive oil quality and ripening in super-high-density Arbequina orchard. J. Sci. Food Agric. 2013, 93, 2207–2220. [Google Scholar] [CrossRef] [PubMed]
- Lazzerini, C.; Cifelli, M.; Domenici, V. Pigments in extra virgin olive oils produced in different mediterranean countries in 2014: Near UV-vis spectroscopy versus HPLC-DAD. LWT 2017, 84, 586–594. [Google Scholar] [CrossRef]
- Caruso, G.; Palai, G.; Gucci, R.; Priori, S. Remote and Proximal Sensing Techniques for Site-Specific Irrigation Management in the Olive Orchard. Appl. Sci. 2022, 12, 1309. [Google Scholar] [CrossRef]
- Uceda, M.; Frias, L. Harvest dates. Evolution of the fruit oil content, oil composition and oil quality. In Proceedings II. Seminario Oleícola Internacional; International Olive Oil Council: Madrid, Spain, 1975; pp. 125–128. [Google Scholar]
- Karkoula, E.; Skantzari, A.; Melliou, E.; Magiatis, P. Direct measurement of oleocanthal and oleacein levels in olive oil by quantitative 1H NMR. Establishment of a new index for the characterization of extra virgin olive oils. J. Agric. Food Chem. 2012, 60, 11696–11703. [Google Scholar] [CrossRef] [PubMed]
- Vicario, G.; Francini, A.; Cifelli, M.; Domenici, V.; Sebastiani, L. Near UV-vis and NMR spectroscopic methods for rapid screening of antioxidant molecules in extra-virgin olive oil. Antioxidants 2020, 9, 1245. [Google Scholar] [CrossRef] [PubMed]
- Domenici, V.; Ancora, D.; Cifelli, M.; Serani, A.; Veracini, C.A.; Zandomeneghi, M. Extraction of pigment information from near-UV vis absorption spectra of extra virgin olive oils. J. Agric. Food Chem. 2014, 62, 9317–9325. [Google Scholar] [CrossRef]


Disclaimer/Publisher’s Note: The statements, opinions and data contained in all publications are solely those of the individual author(s) and contributor(s) and not of MDPI and/or the editor(s). MDPI and/or the editor(s) disclaim responsibility for any injury to people or property resulting from any ideas, methods, instructions or products referred to in the content. |
© 2023 by the authors. Licensee MDPI, Basel, Switzerland. This article is an open access article distributed under the terms and conditions of the Creative Commons Attribution (CC BY) license (https://creativecommons.org/licenses/by/4.0/).
Share and Cite
Vicario, G.; Cantini, C.; Francini, A.; Raffaelli, A.; Cifelli, M.; Domenici, V.; Sebastiani, L. Olive Fruit Ripening Degree and Water Content Relationships with Phenolic Acids and Alcohols, Secoiridoids, Flavonoids and Pigments in Fruit and Oil. Molecules 2023, 28, 6943. https://doi.org/10.3390/molecules28196943
Vicario G, Cantini C, Francini A, Raffaelli A, Cifelli M, Domenici V, Sebastiani L. Olive Fruit Ripening Degree and Water Content Relationships with Phenolic Acids and Alcohols, Secoiridoids, Flavonoids and Pigments in Fruit and Oil. Molecules. 2023; 28(19):6943. https://doi.org/10.3390/molecules28196943
Chicago/Turabian StyleVicario, Giulia, Claudio Cantini, Alessandra Francini, Andrea Raffaelli, Mario Cifelli, Valentina Domenici, and Luca Sebastiani. 2023. "Olive Fruit Ripening Degree and Water Content Relationships with Phenolic Acids and Alcohols, Secoiridoids, Flavonoids and Pigments in Fruit and Oil" Molecules 28, no. 19: 6943. https://doi.org/10.3390/molecules28196943
APA StyleVicario, G., Cantini, C., Francini, A., Raffaelli, A., Cifelli, M., Domenici, V., & Sebastiani, L. (2023). Olive Fruit Ripening Degree and Water Content Relationships with Phenolic Acids and Alcohols, Secoiridoids, Flavonoids and Pigments in Fruit and Oil. Molecules, 28(19), 6943. https://doi.org/10.3390/molecules28196943