
NMR-Verified Dearomatization of 5,7-Substituted Pyrazolo[1,5-a]pyrimidines

 , , ,
, , ,  , and
, and
Abstract
:
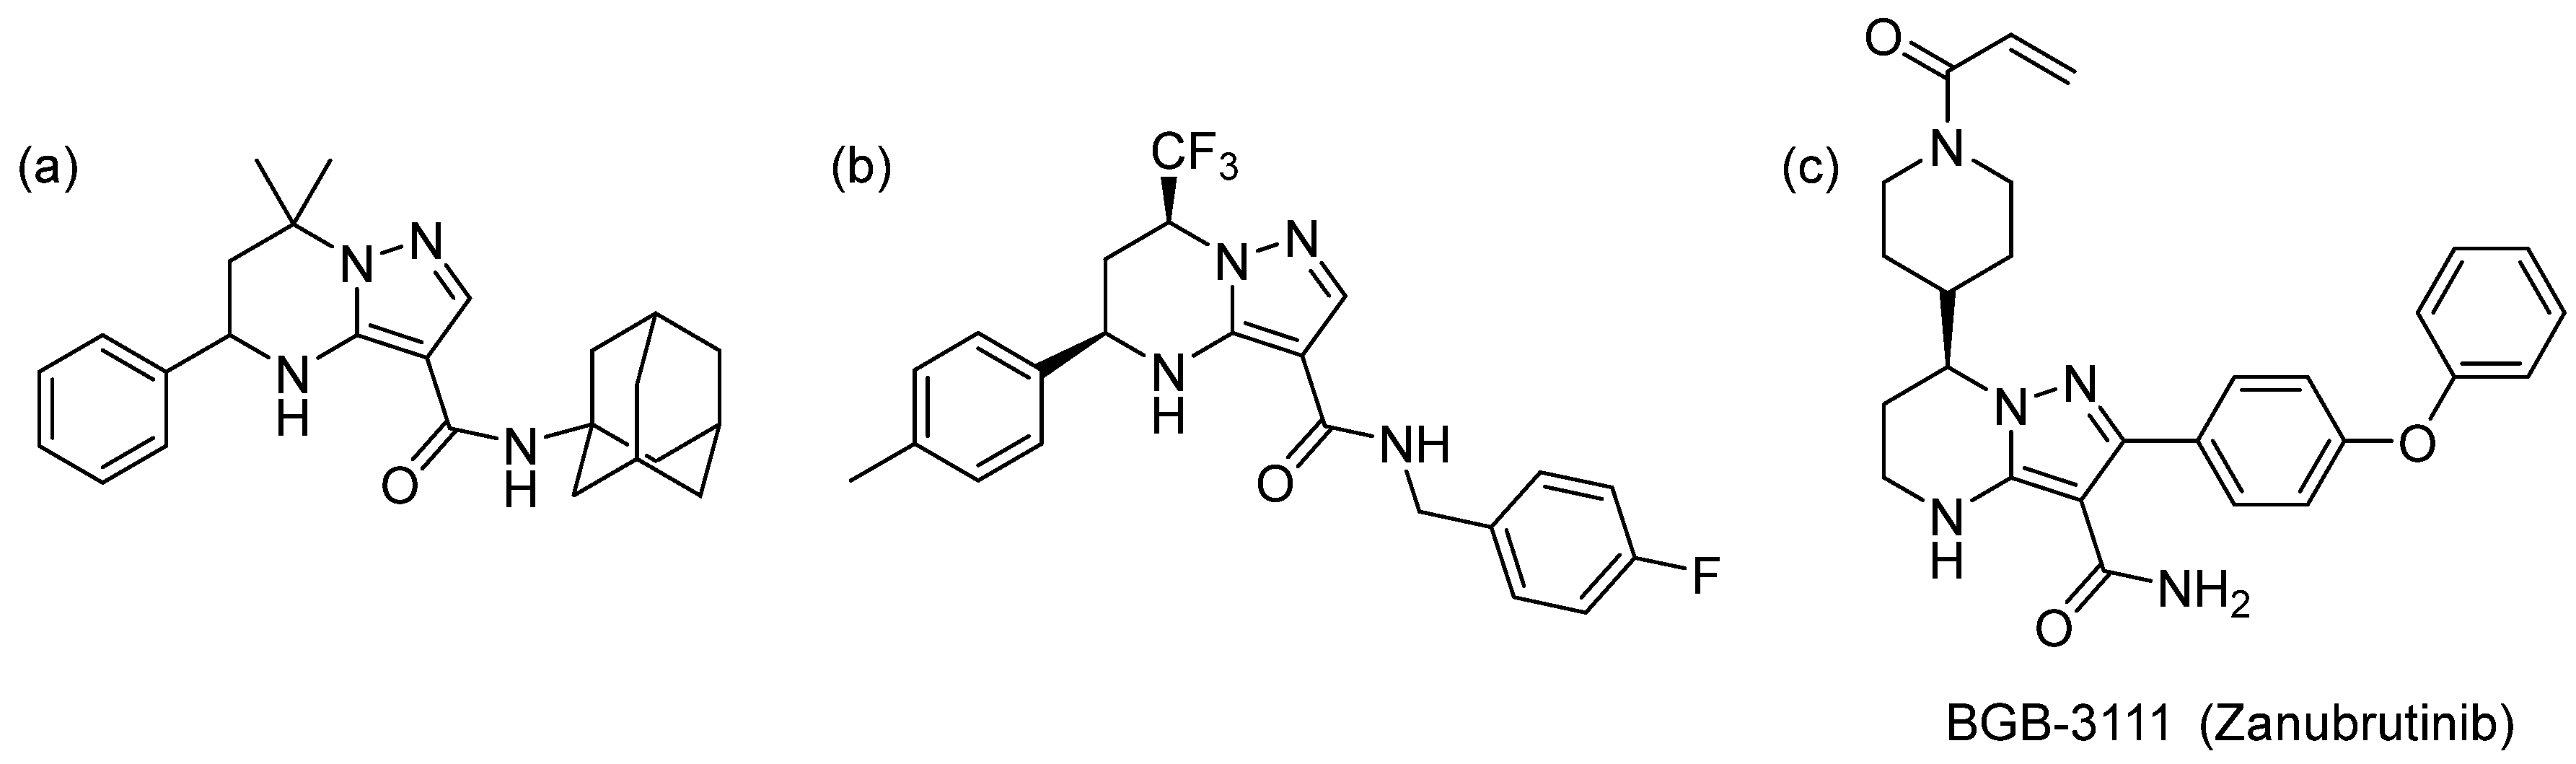
1. Introduction
2. Results
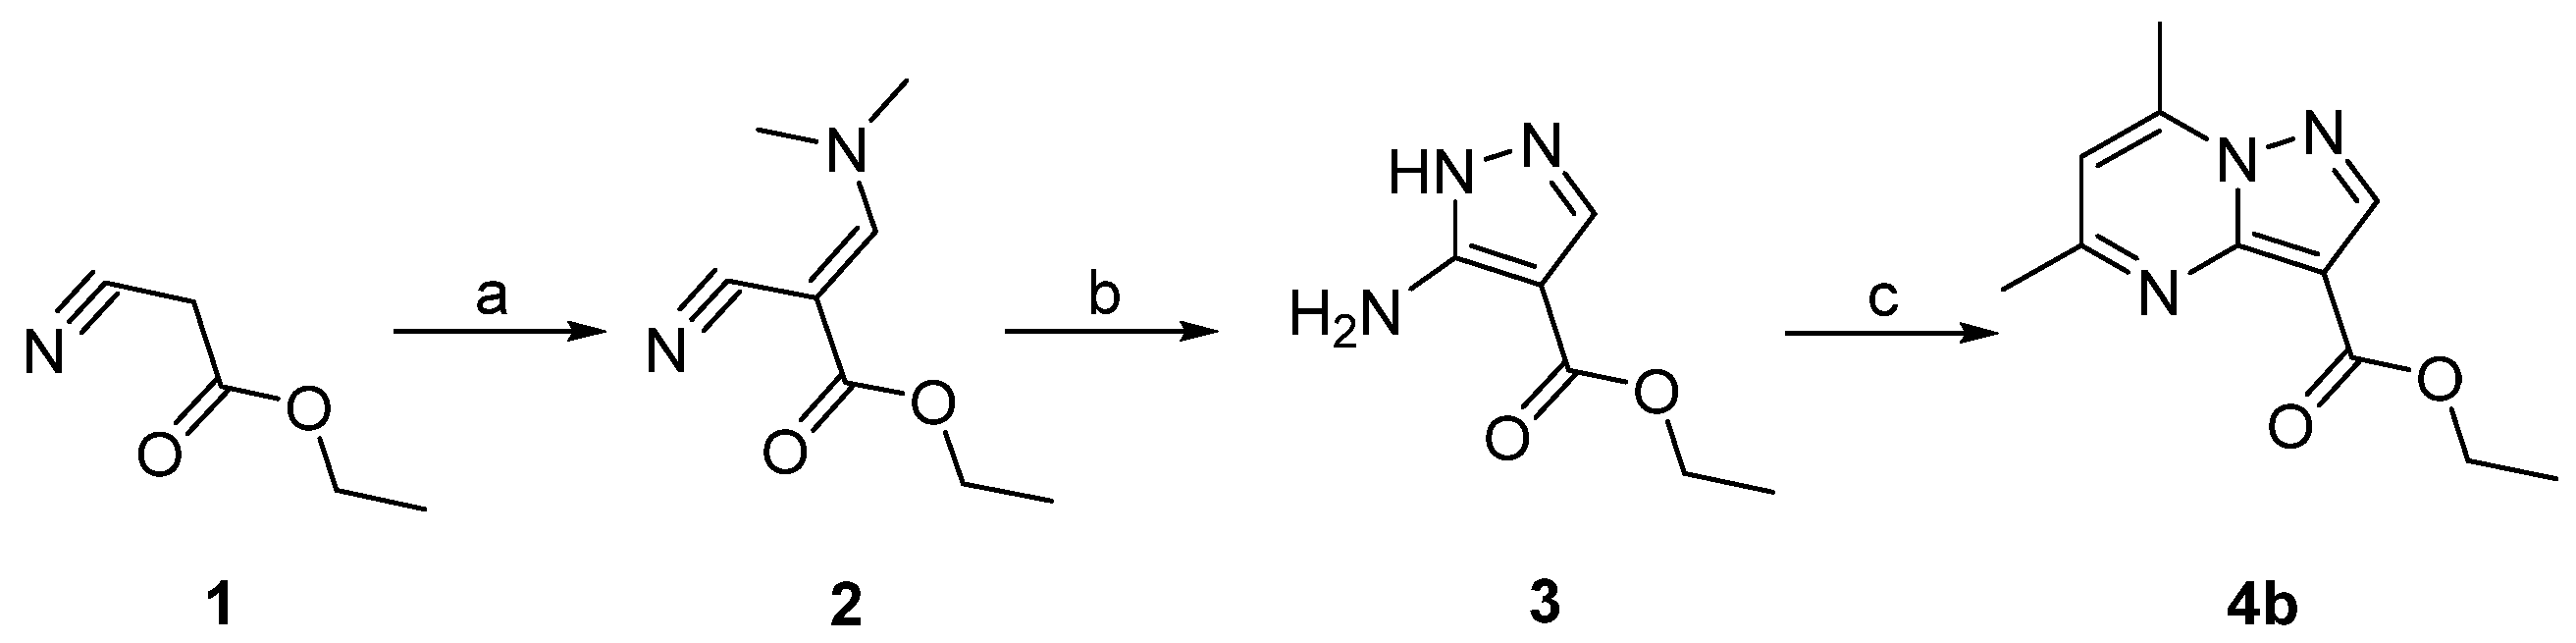
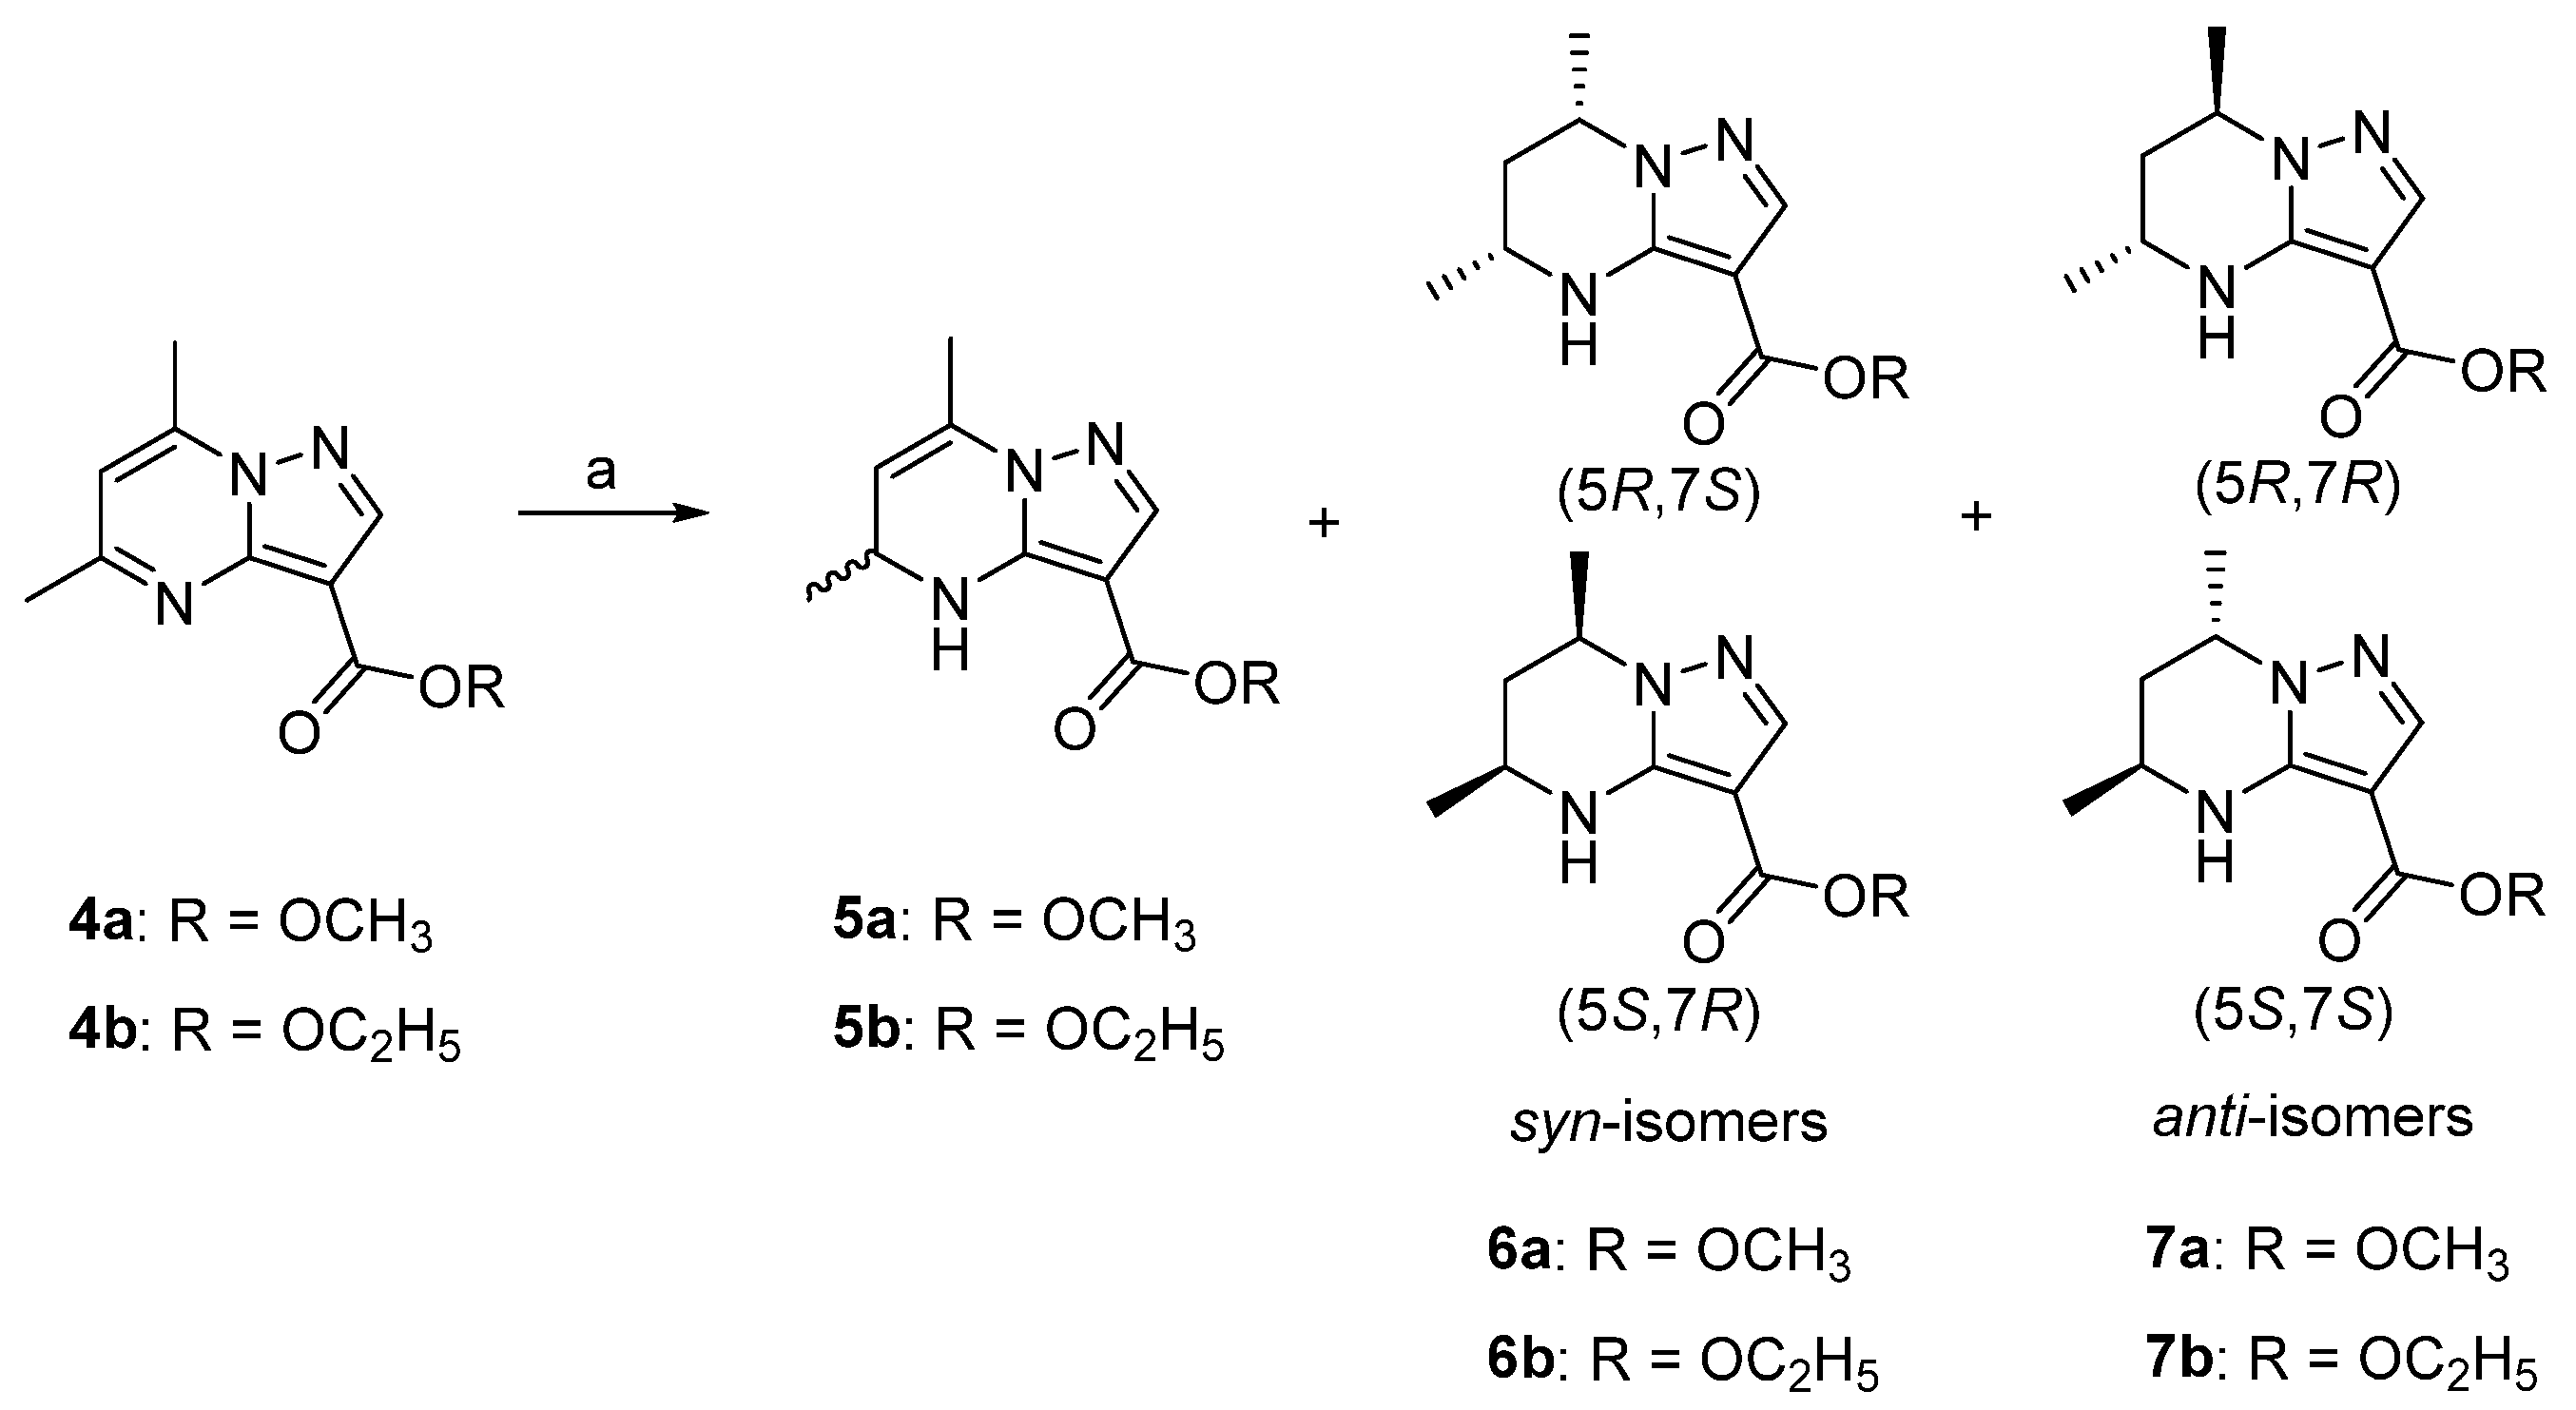
2.1. Chemistry
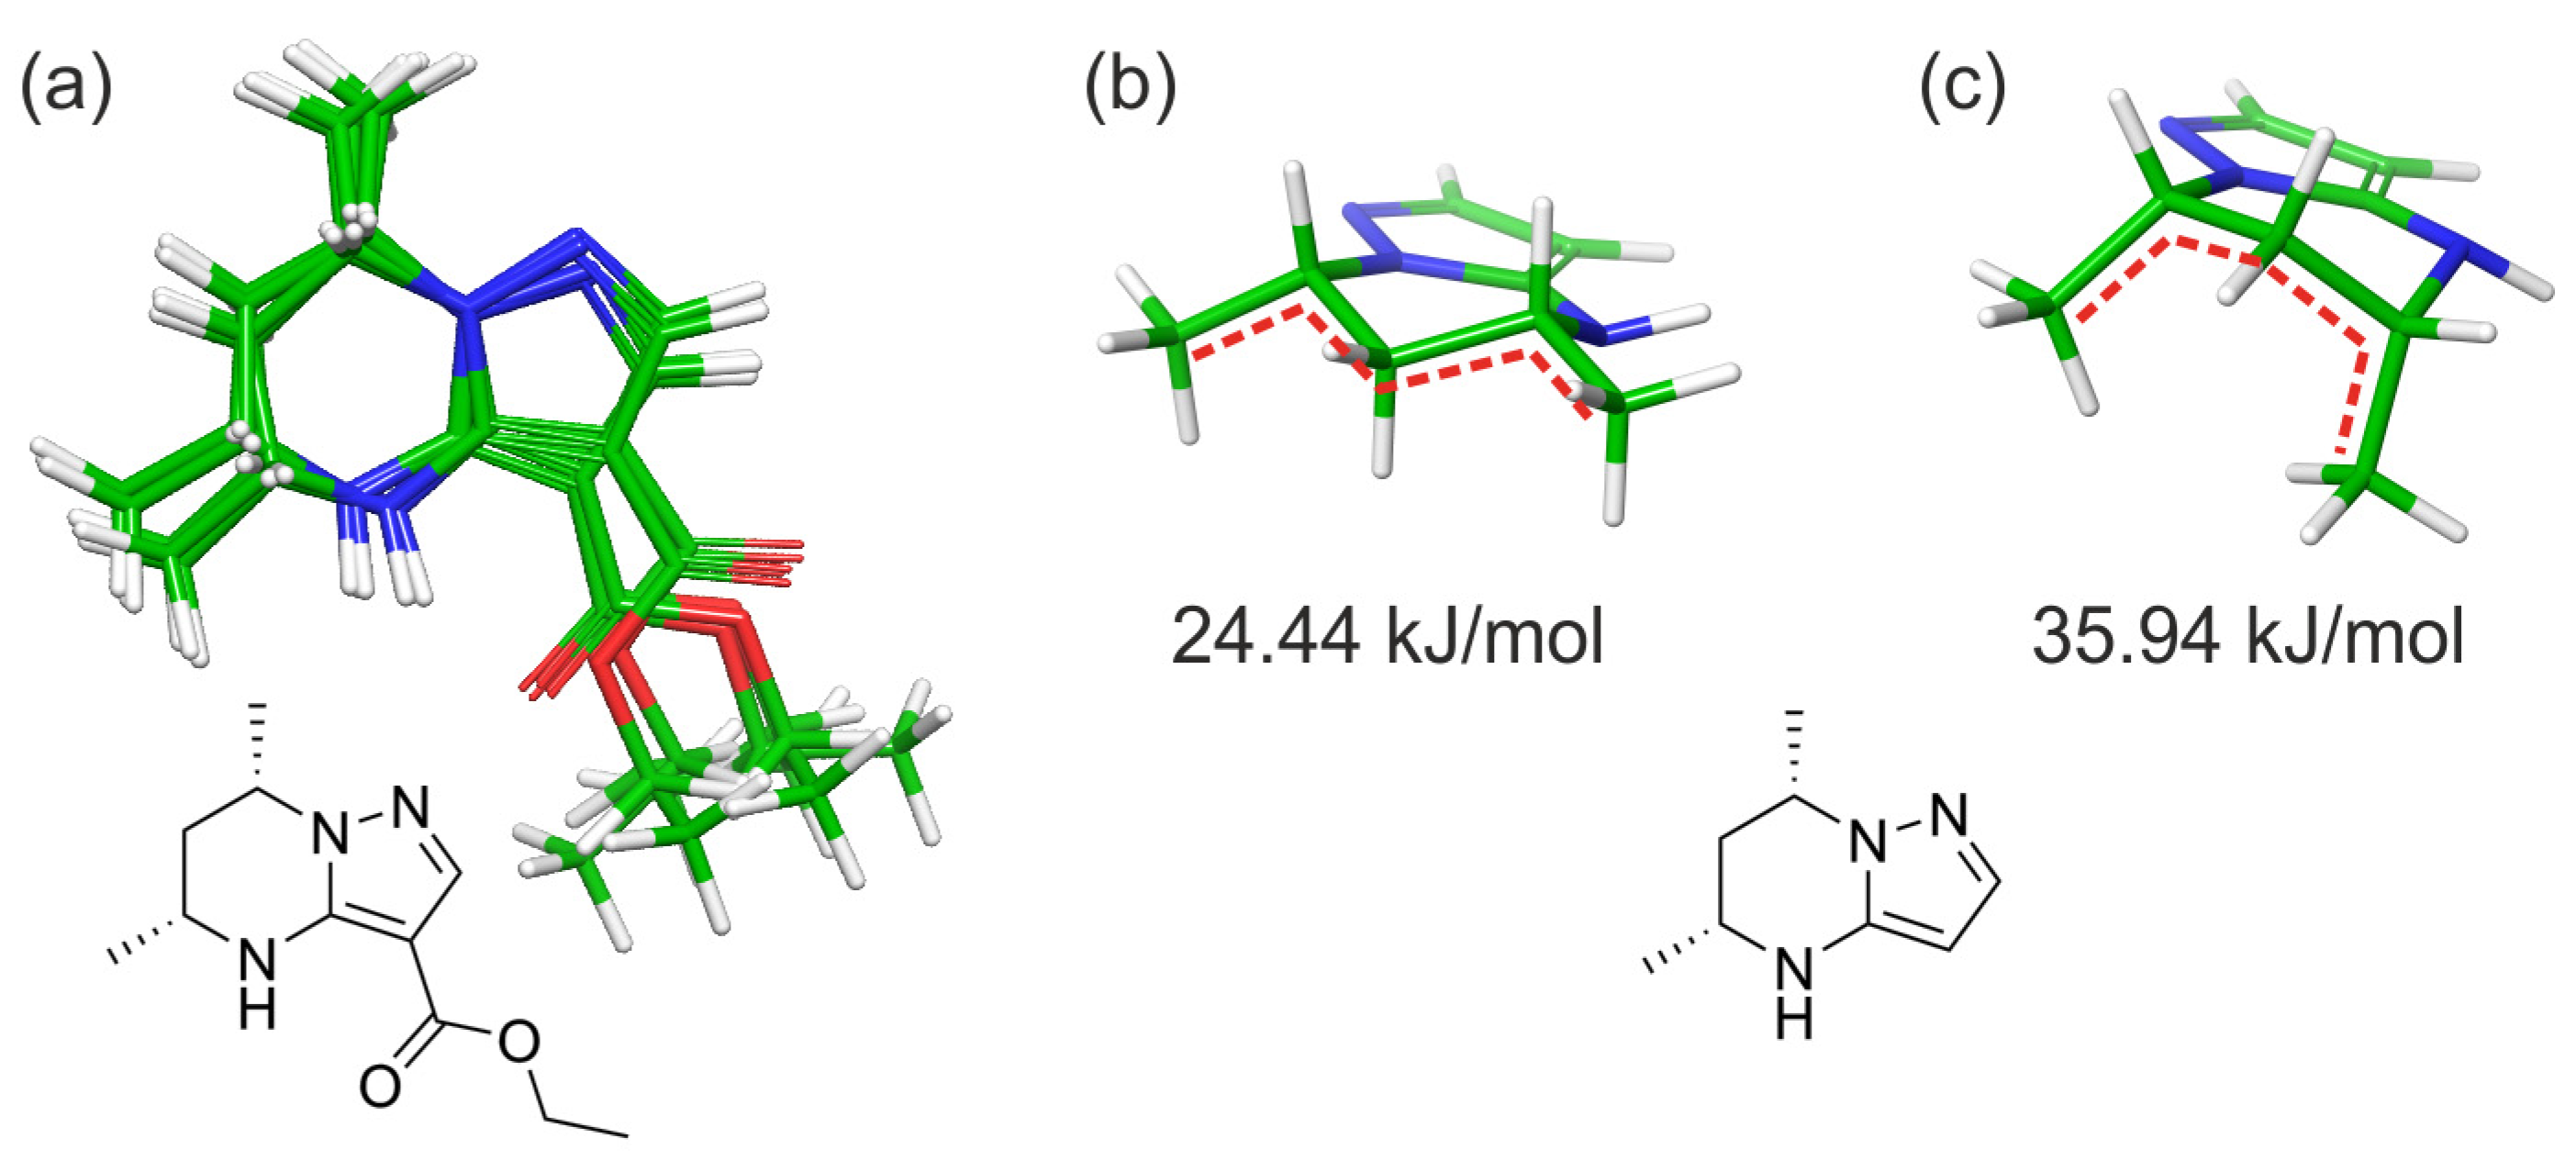
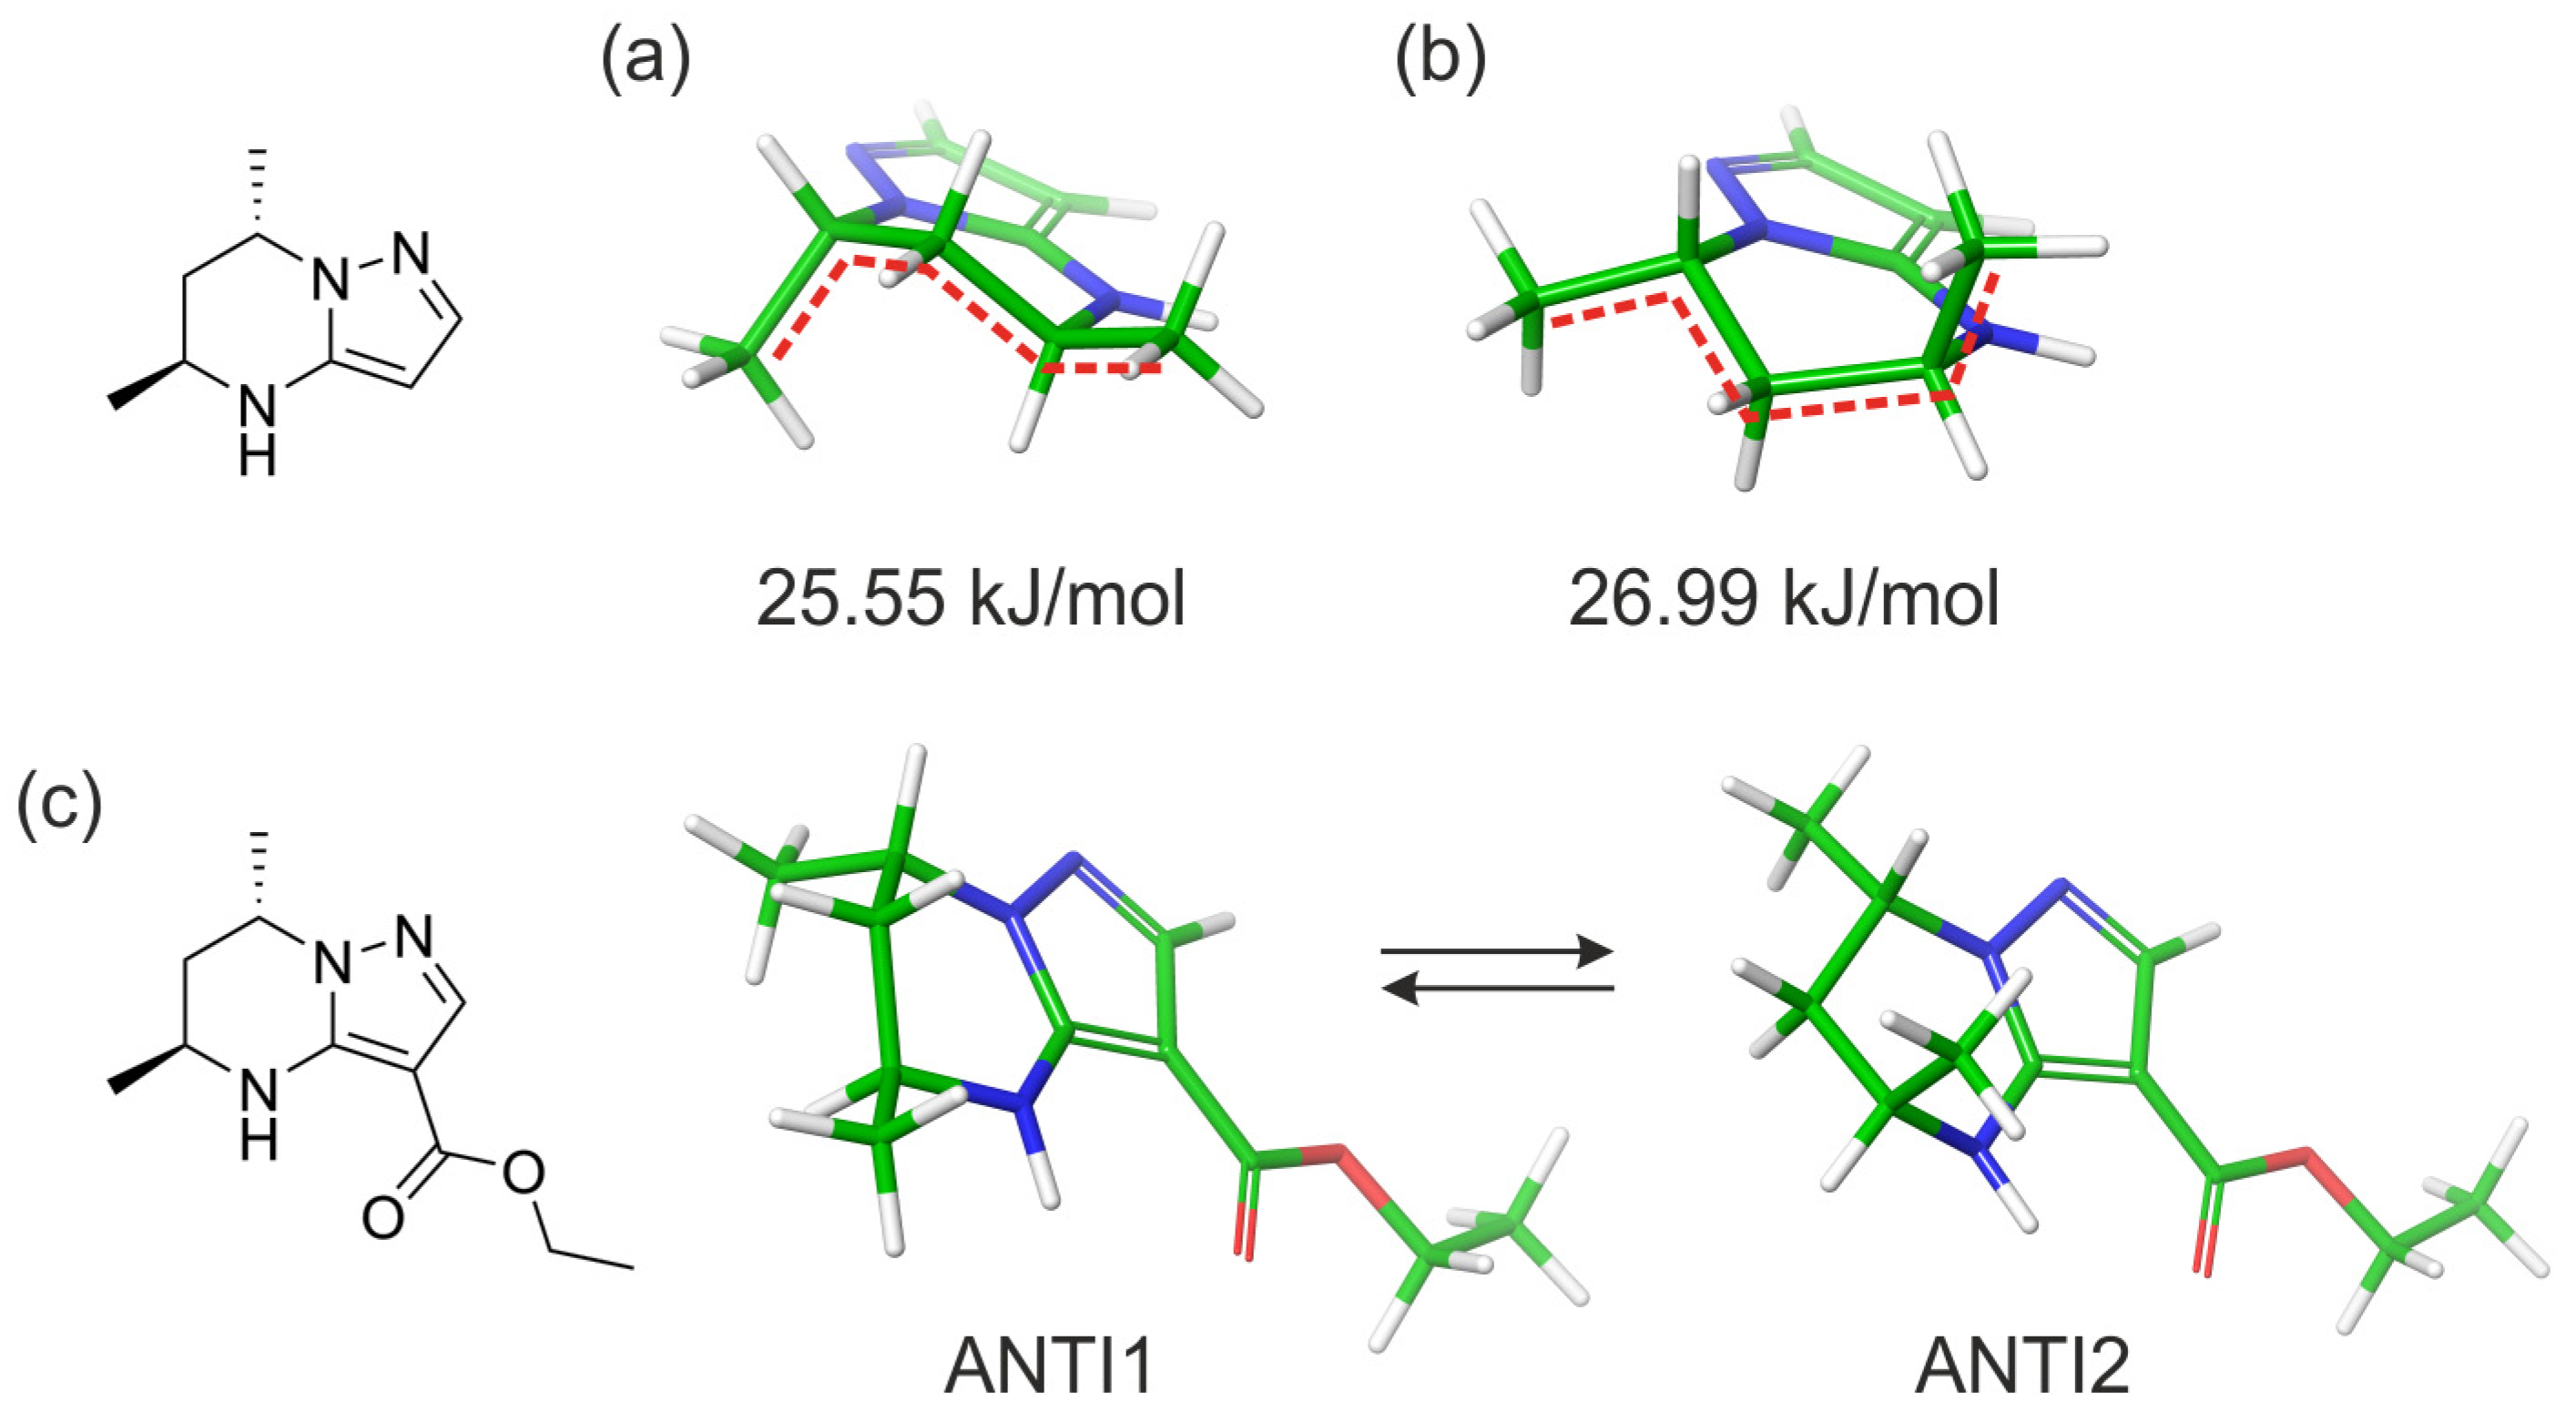
2.2. Computational Studies
2.3. NMR Studies
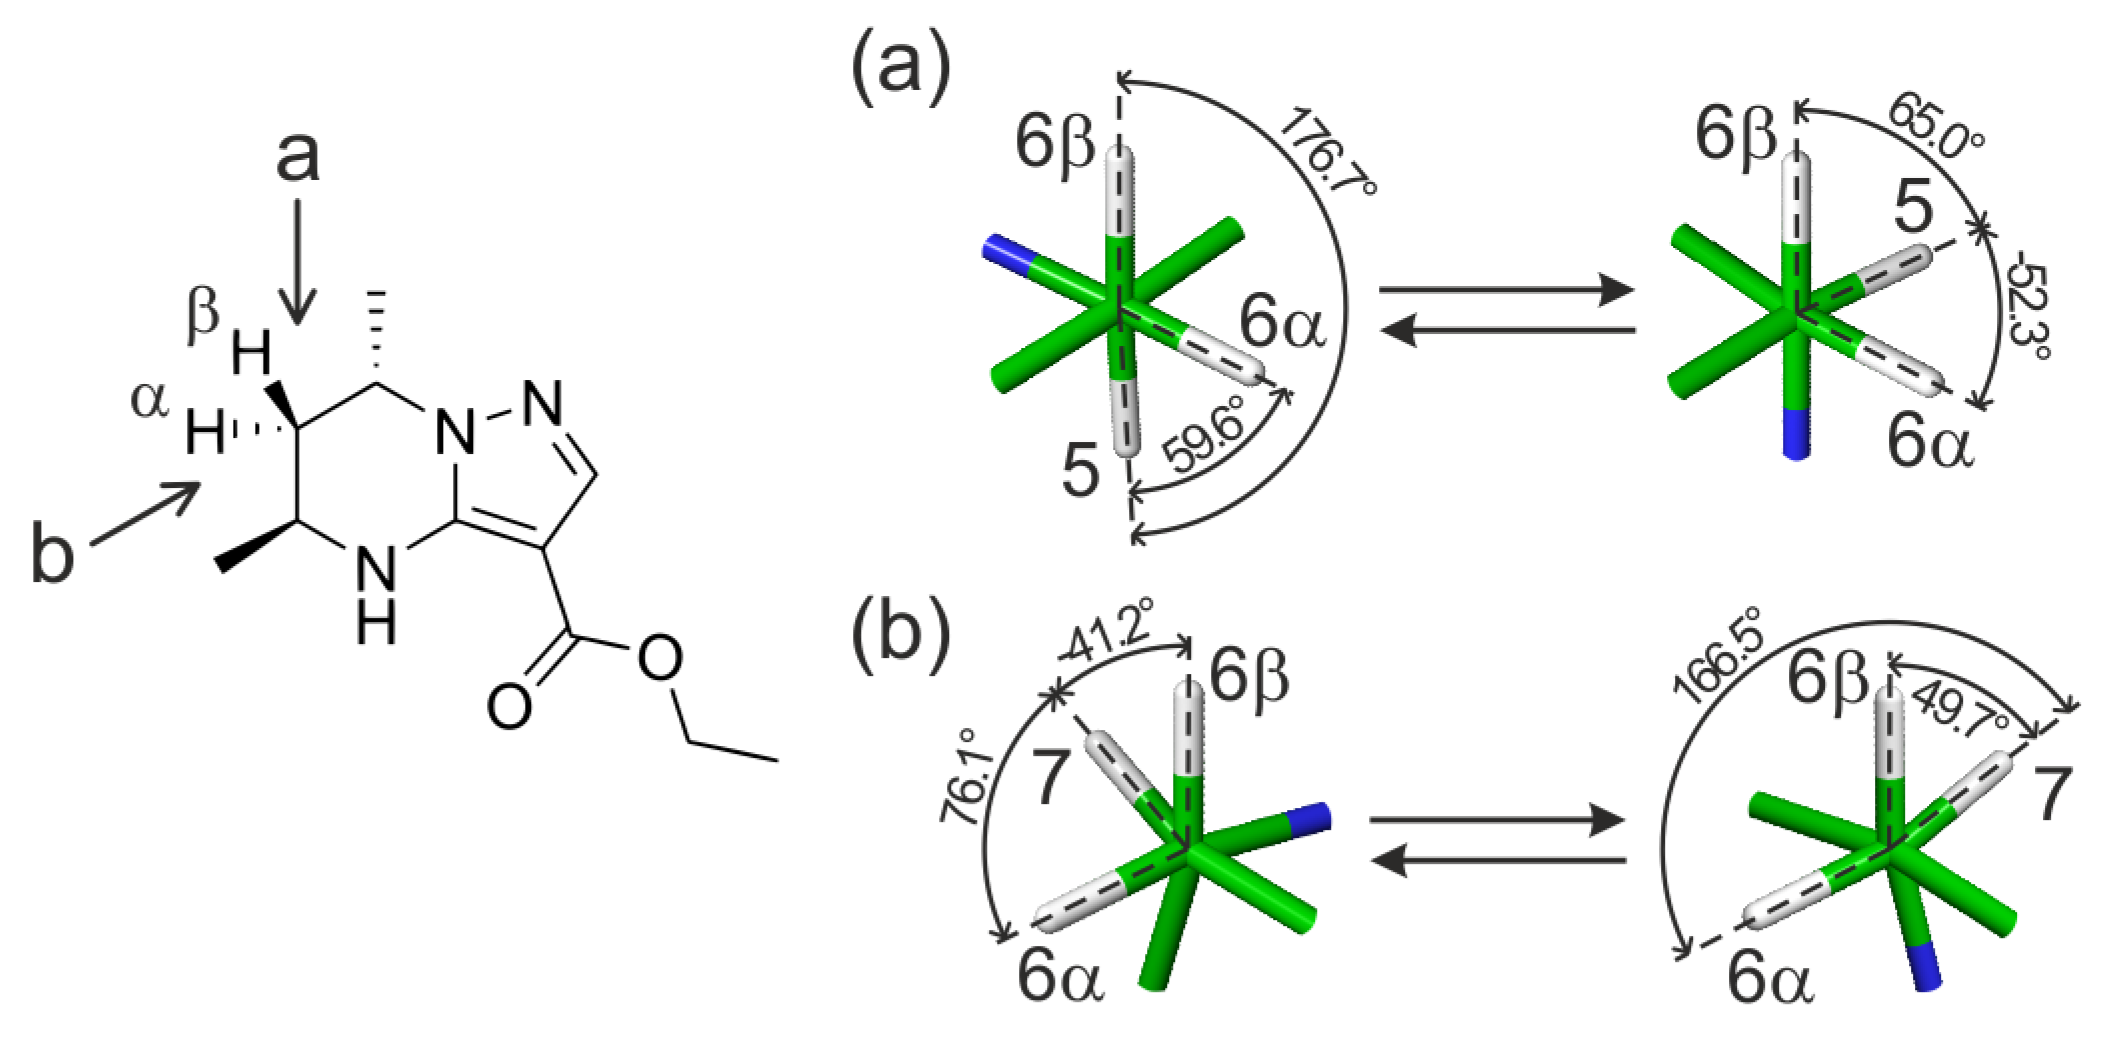
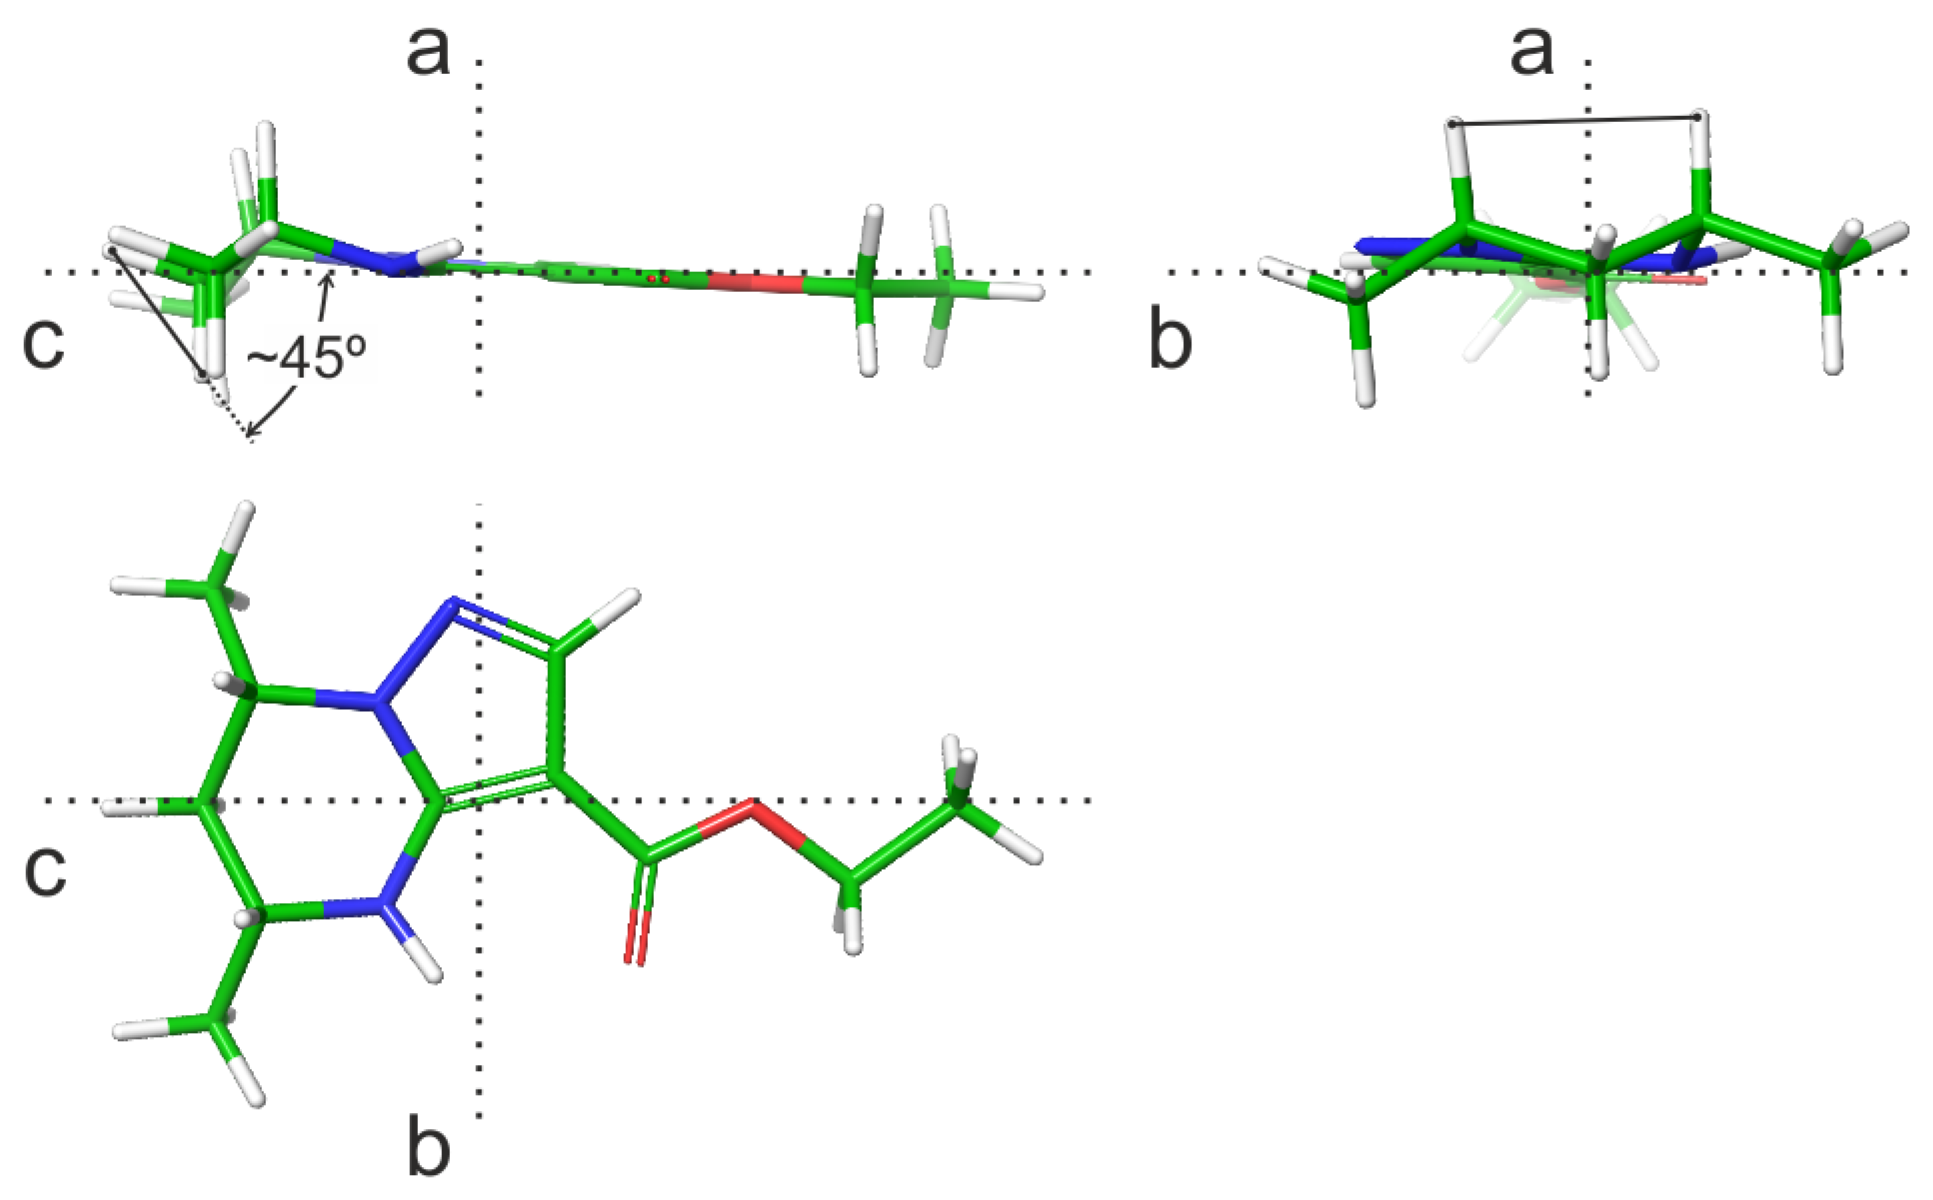
2.3.1. Analysis of Vicinal Constants to Study the Spatial Structure and Intramolecular Flexibility of Reaction Products
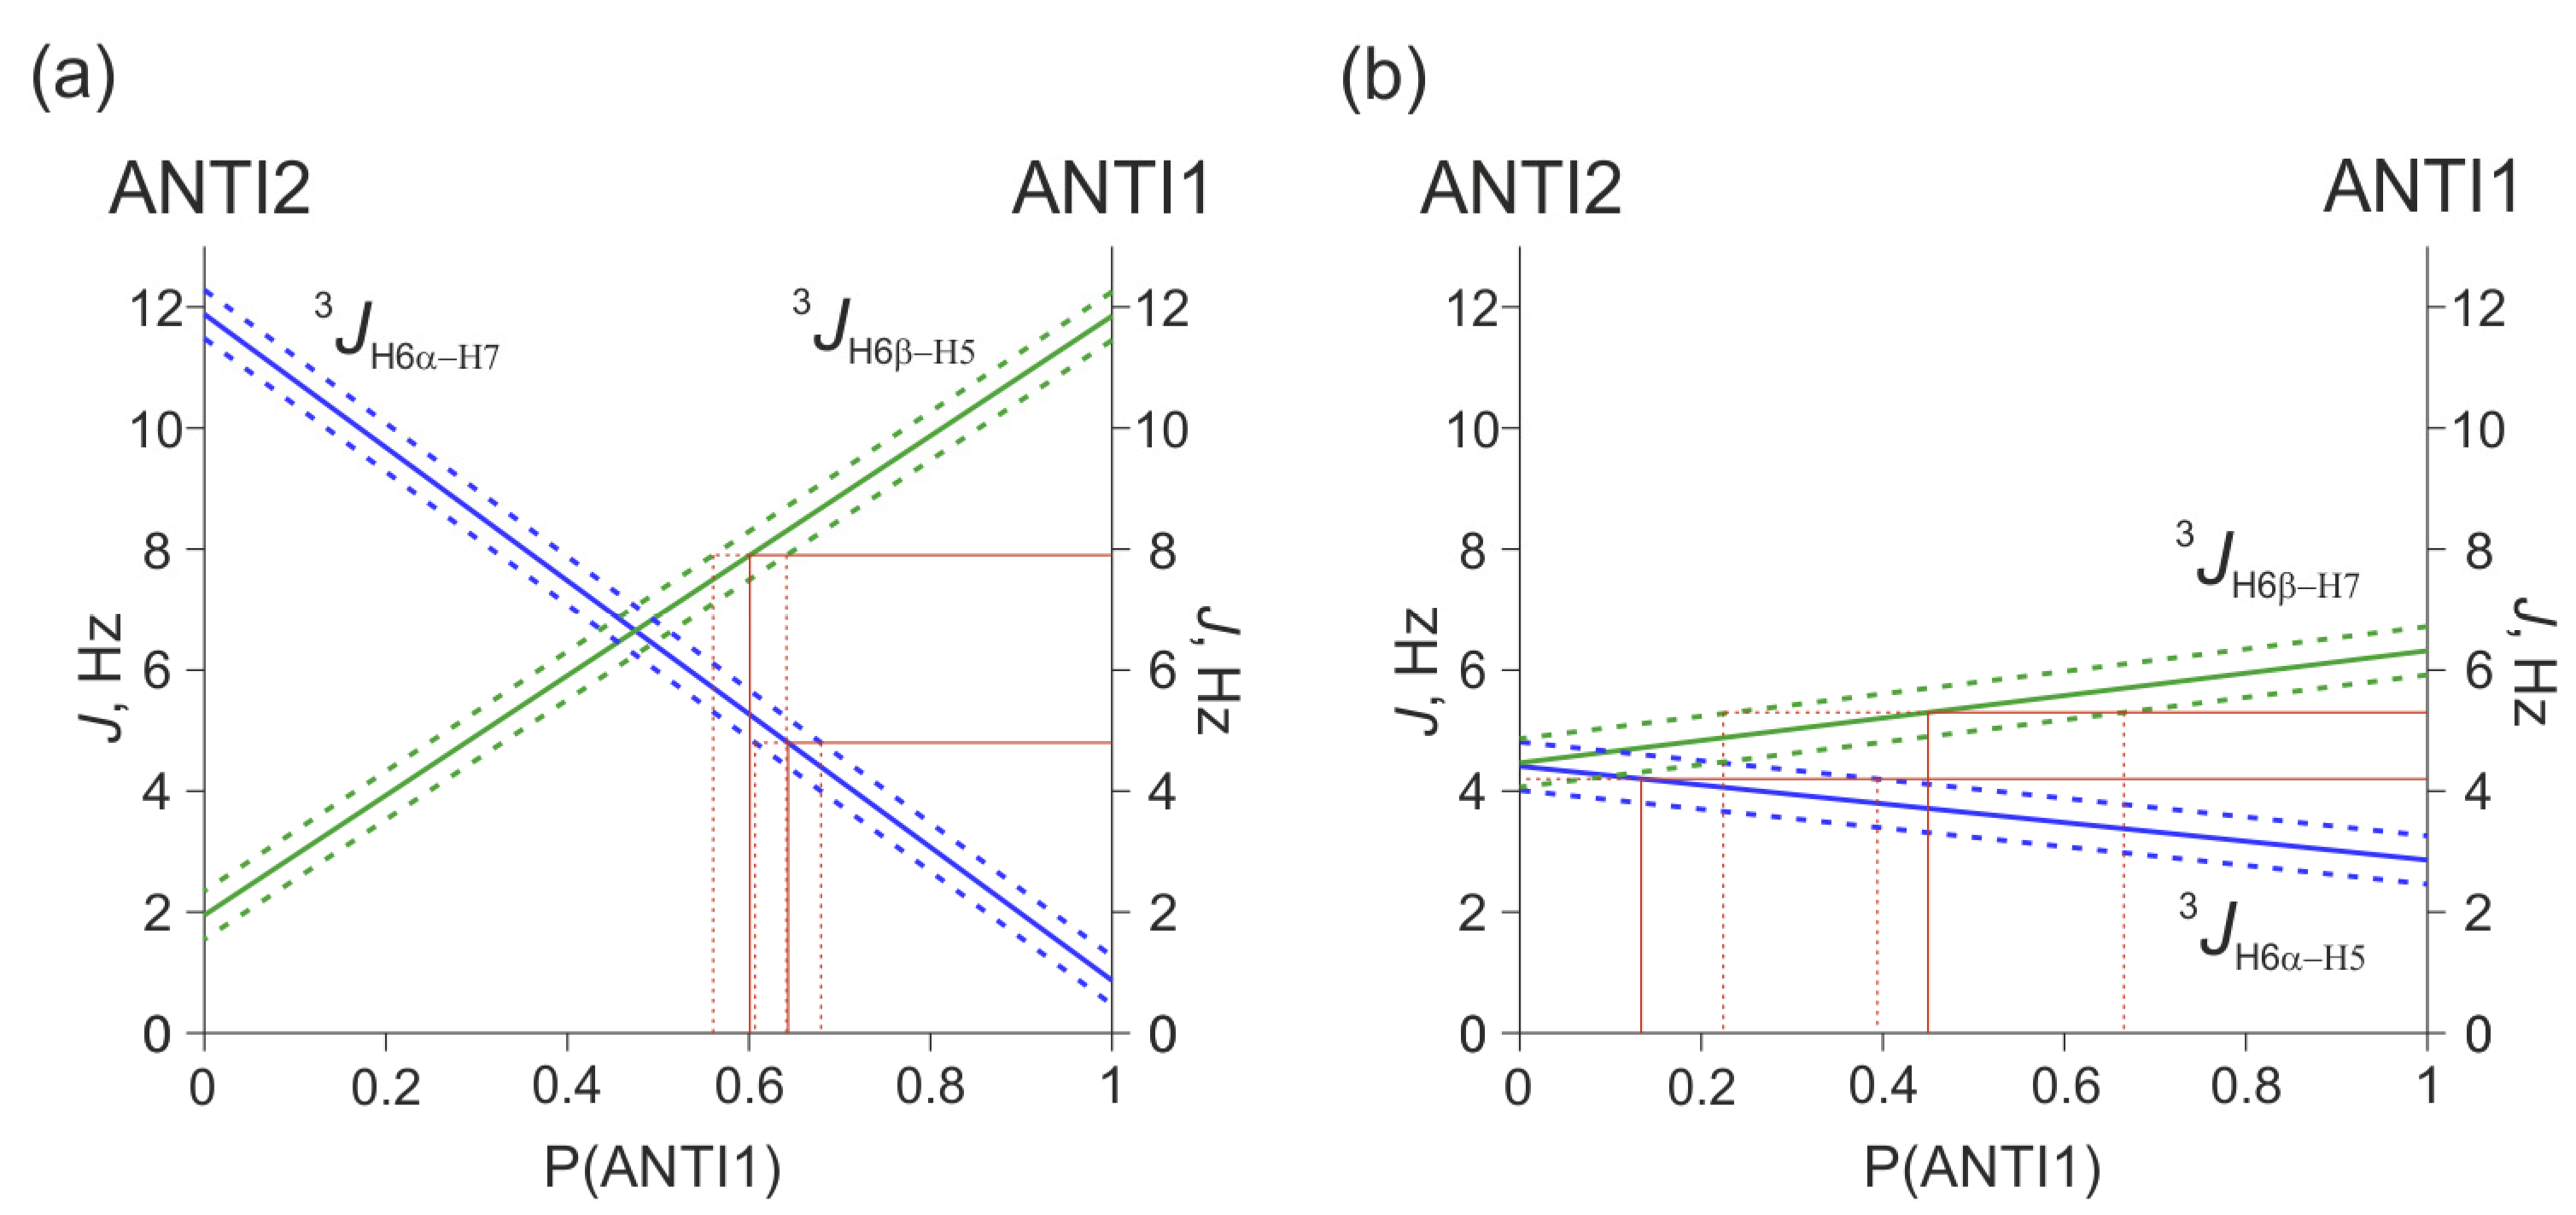
2.3.2. Quantitative Evaluation of the Ratio of ANTI Conformers Based on Vicinal Constant Values
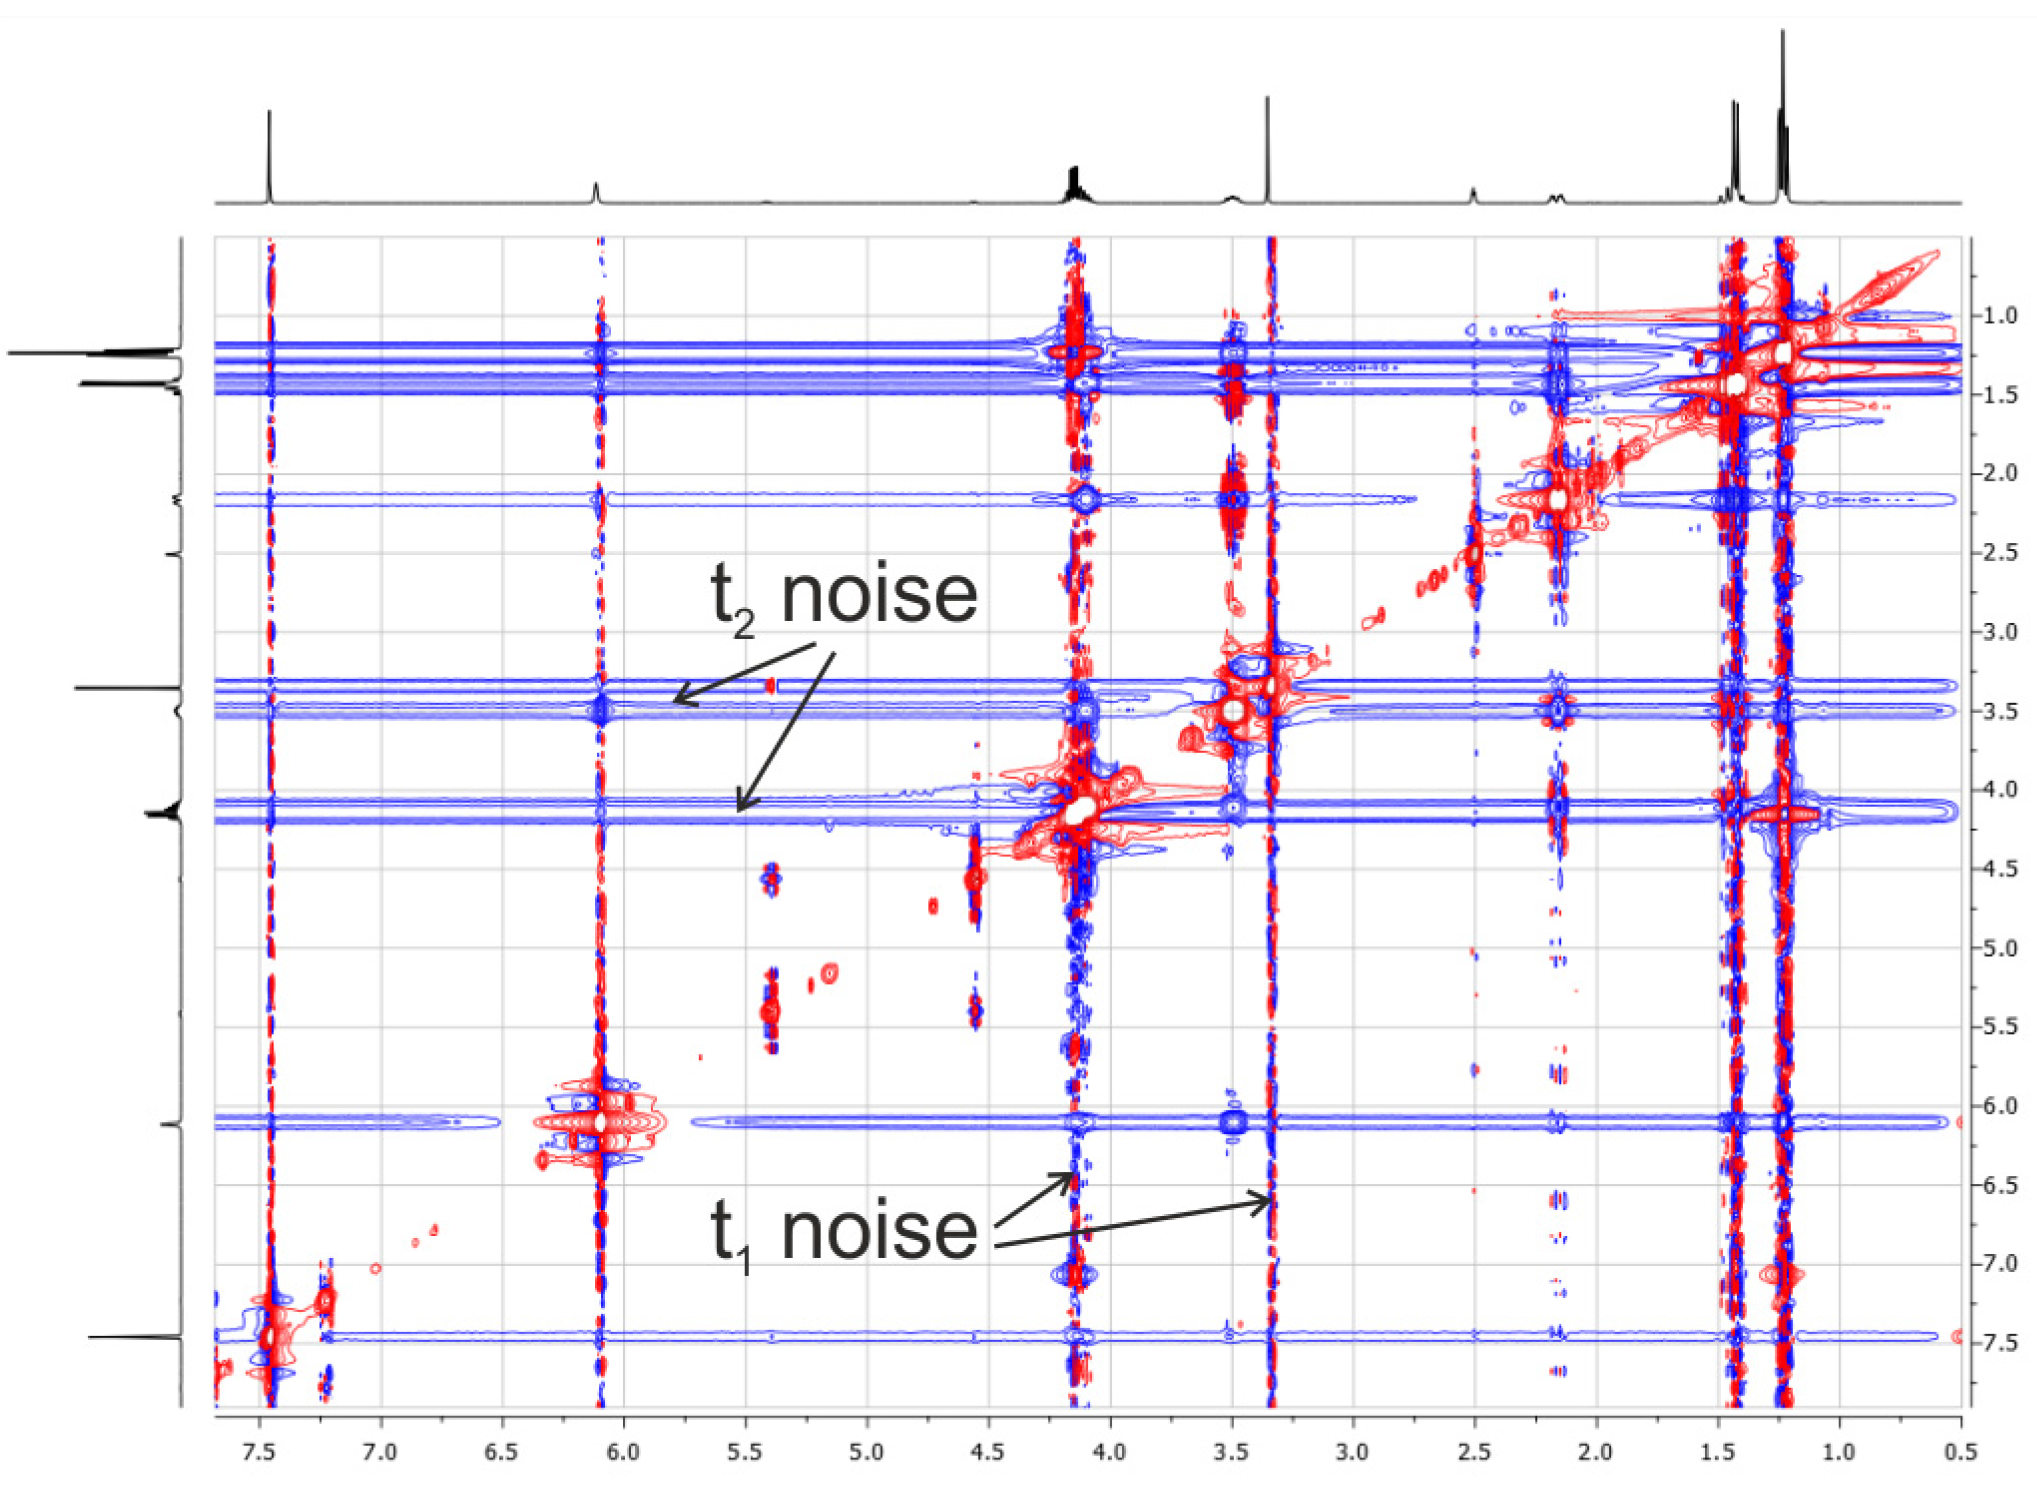
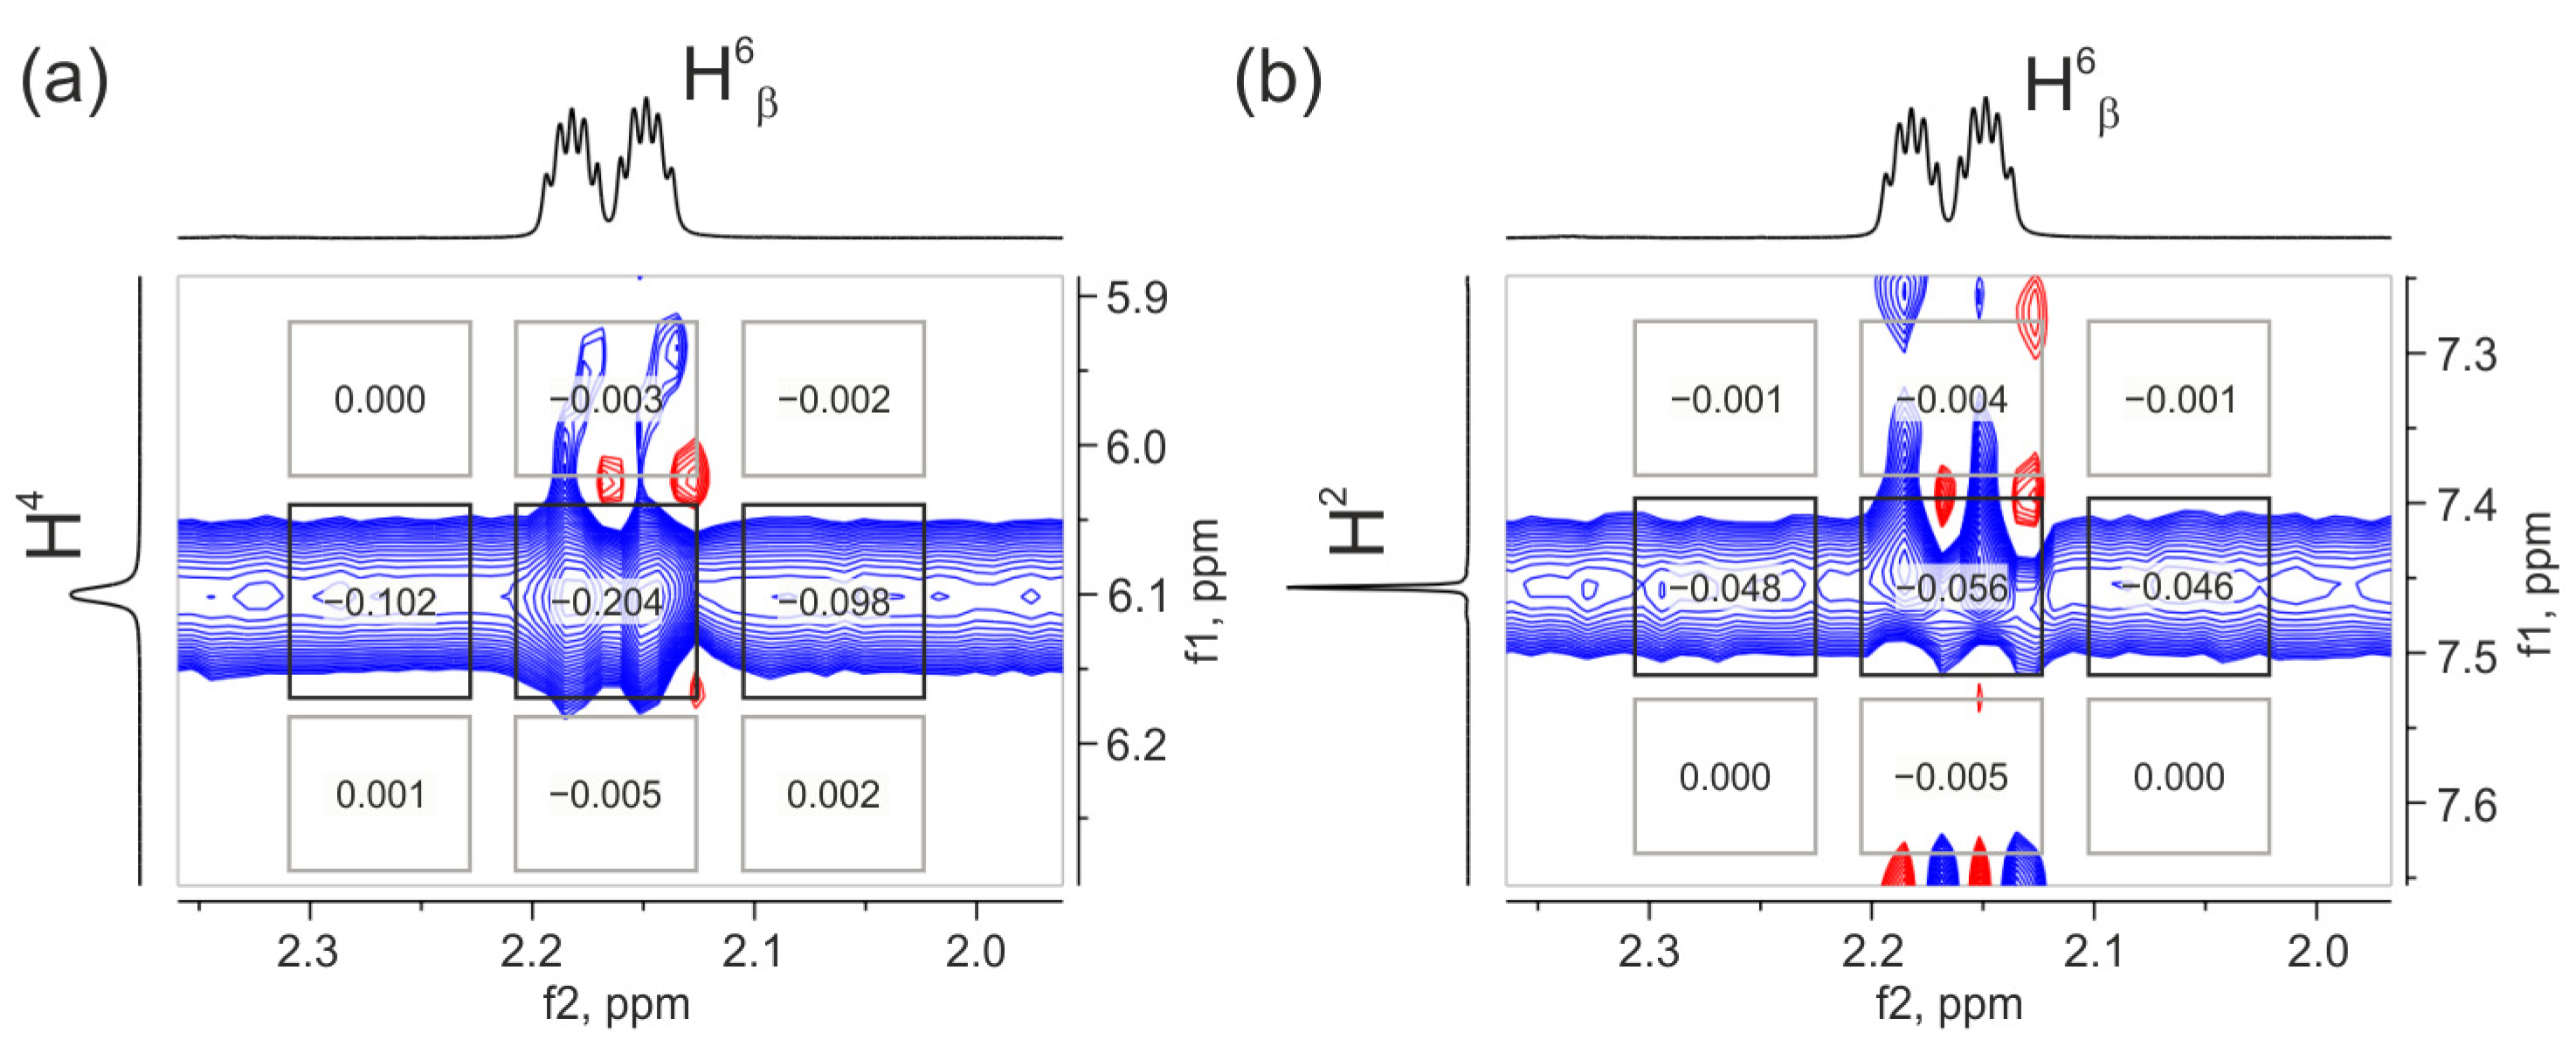
2.3.3. Influence of Noise Bands on the Accuracy of Weak Cross-Peak Integration in NOESY Spectra
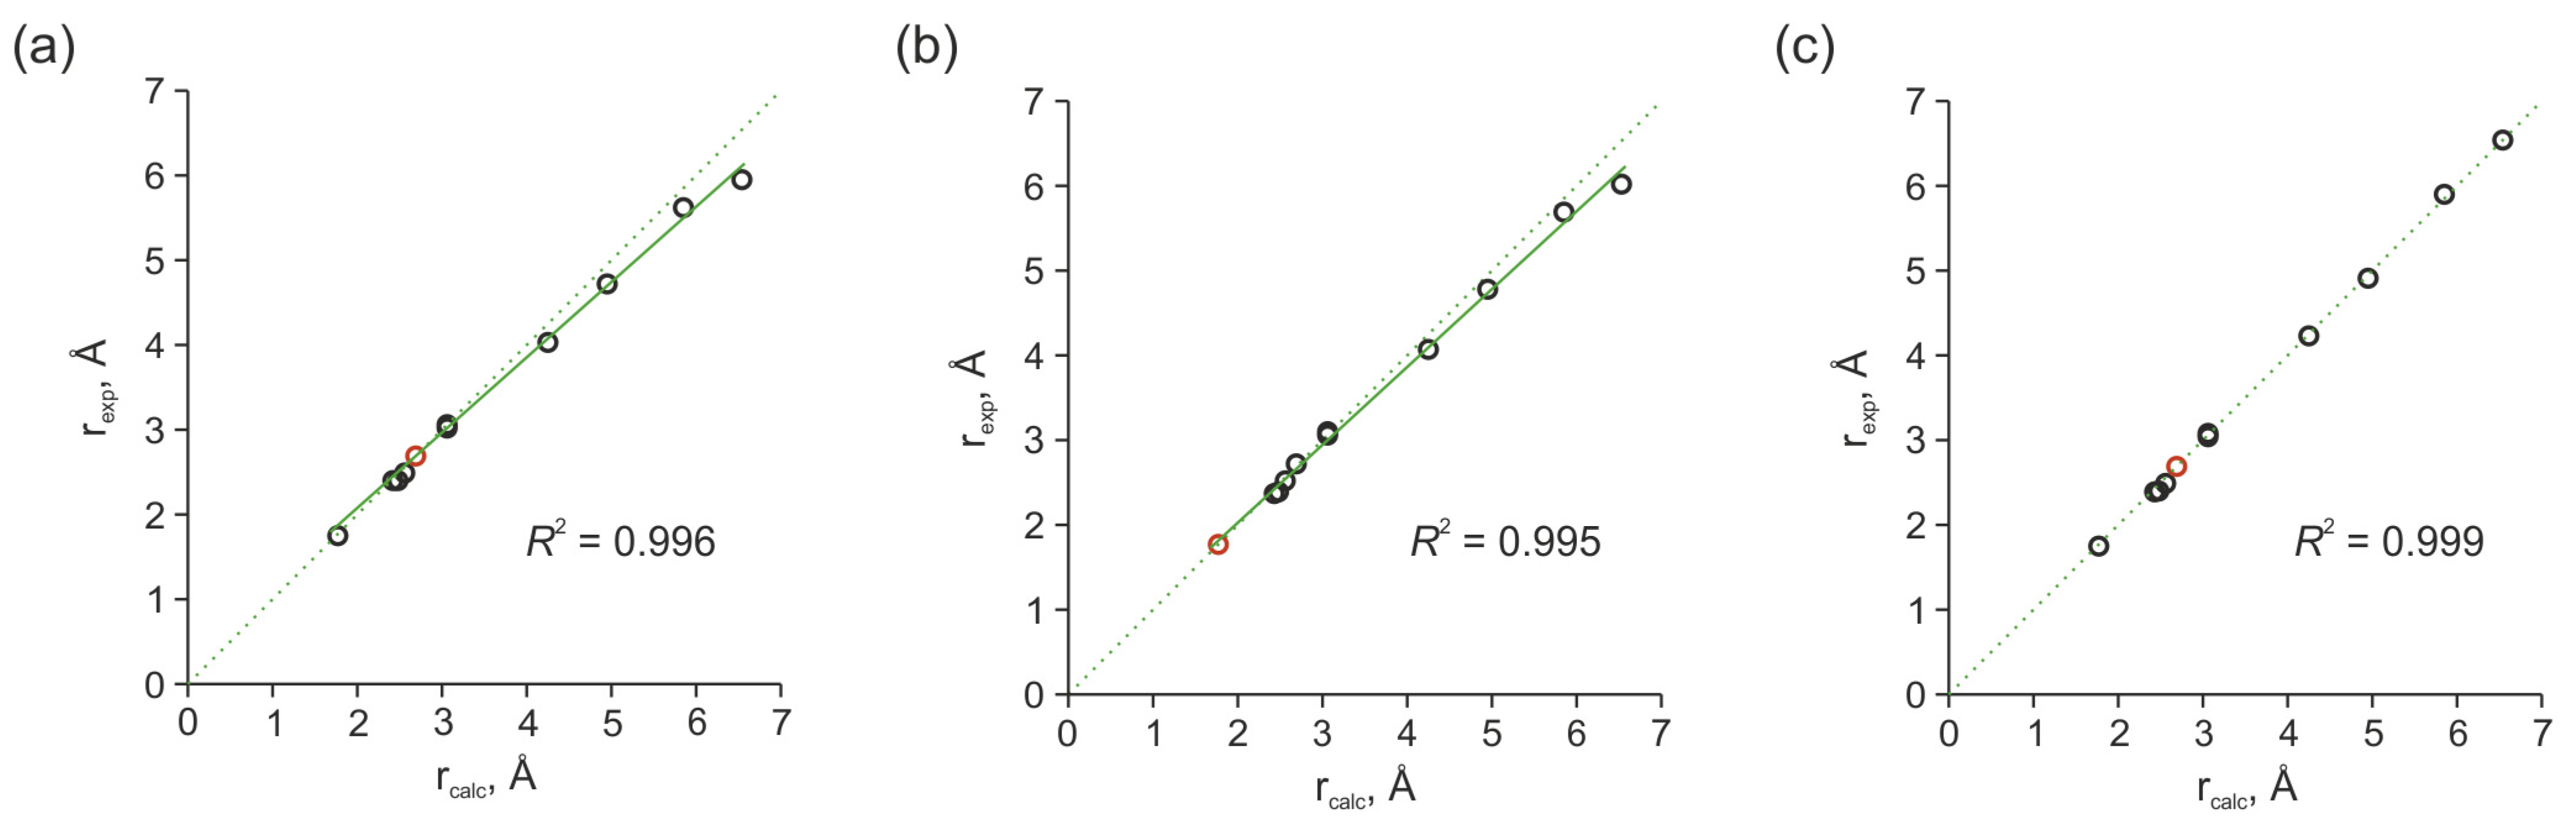
2.3.4. Estimation of Interproton Distances Based on NOESY Data
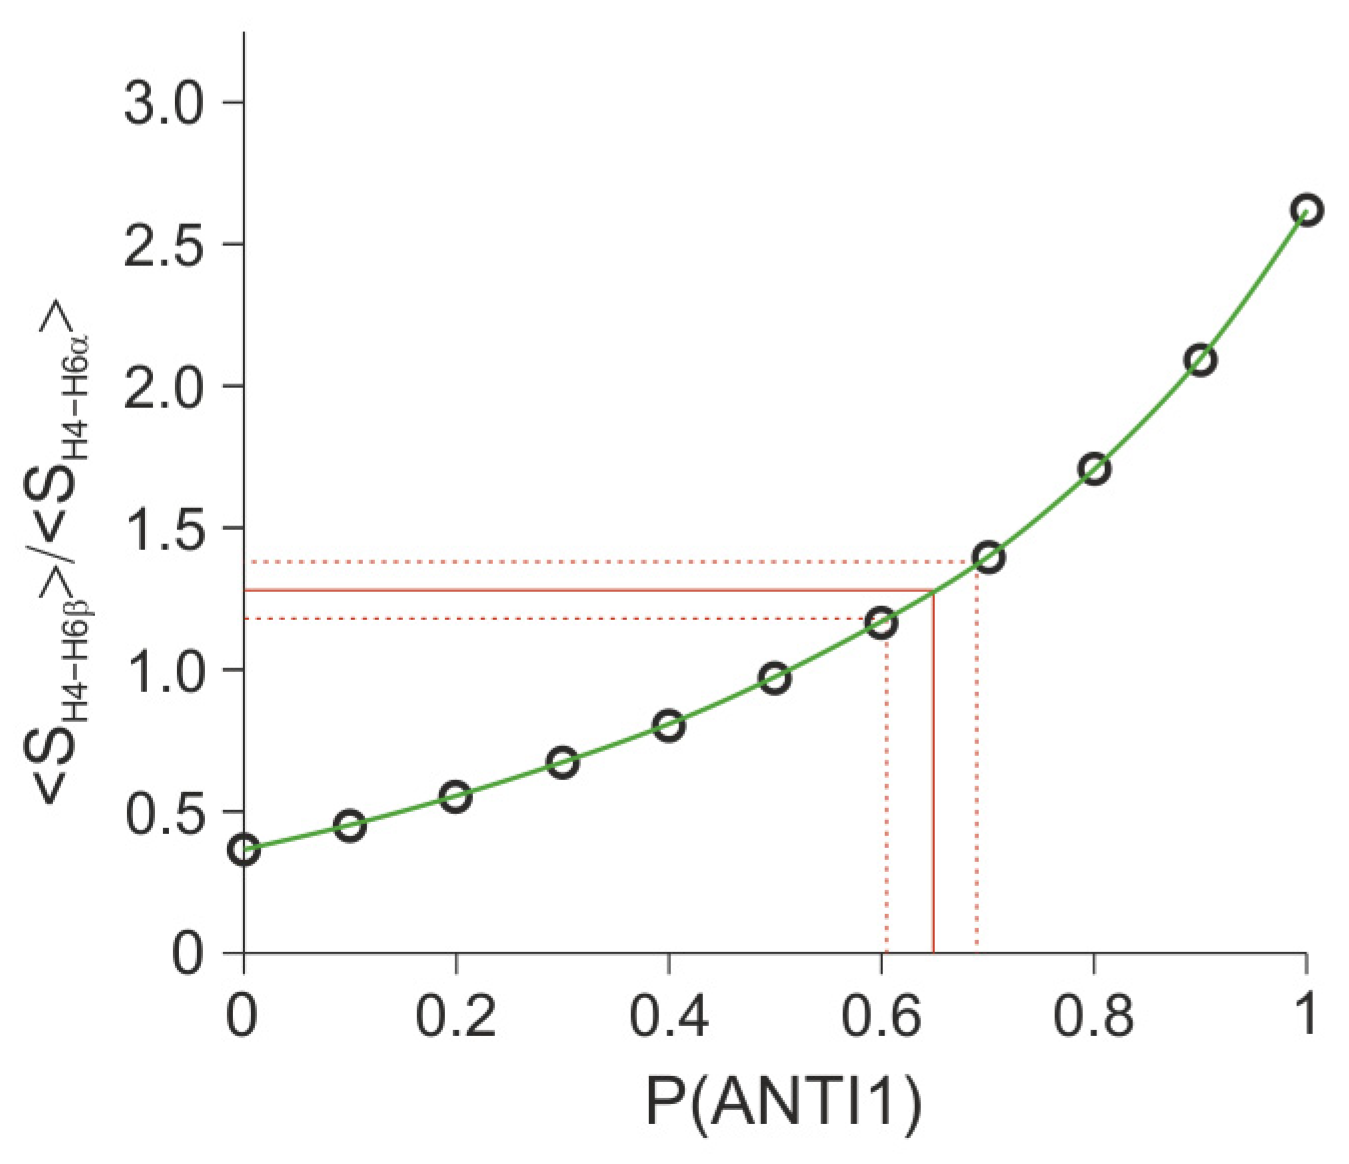
2.3.5. Study of Conformational Equilibrium Using NOE
3. Materials and Methods
3.1. Chemistry
3.1.1. General Procedure for Reduction in Methanol
3.1.2. General Procedure for Reduction in Ethanol
3.1.3. General Procedure for Reduction with Tetrabutylammonium Borohydride
3.2. Calculations
3.3. NMR Studies
4. Conclusions
Supplementary Materials
Author Contributions
Funding
Institutional Review Board Statement
Informed Consent Statement
Data Availability Statement
Acknowledgments
Conflicts of Interest
Sample Availability
References
- Neuhaus, D.; Williamson, M.P. The Nuclear Overhauser Effect in Structural and Conformational Analysis, 2nd ed.; Wiley-VCH: Weinheim, Germany, 2000. [Google Scholar]
- Boros, S.; Gáspári, Z.; Batta, G. Accurate NMR determinations of proton–proton distances. In Annual Reports on NMR Spectroscopy, 1st ed.; Webb, G., Ed.; Academic Press: London, UK, 2018; Volume 94, pp. 1–38. [Google Scholar]
- Vogeli, B. The nuclear Overhauser effect from a quantitative perspective. Prog. Nucl. Magn. Reson. Spectrosc. 2014, 78, 1–46. [Google Scholar] [CrossRef]
- Contreras, R.H.; Peralta, J.E. Angular dependence of spin-spin coupling constants. Progr. Nucl. Magn. Reson. Spectrosc. 2000, 37, 321–425. [Google Scholar] [CrossRef]
- Karplus, M. Vicinal proton coupling in nuclear magnetic resonance. J. Am. Chem. Soc. 1963, 85, 2870–2871. [Google Scholar] [CrossRef]
- Kumar, A. Two-dimensional nuclear Overhauser effect experiment in a protein: The first NOESY (1979–1980). Magn. Reson. Chem. 2003, 41, S26–S32. [Google Scholar] [CrossRef]
- Vogeli, B.; Segawa, T.; Leitz, D.; Sobol, A.; Choutko, A.; Trzesniak, D.; Van Gunsteren, W.; Riek, R. Exact distances and internal dynamics of perdeuterated ubiquitin from NOE buildups. J. Am. Chem. Soc. 2009, 131, 17215–17225. [Google Scholar] [CrossRef]
- Lindorff-Larsen, K.; Best, R.B.; DePristo, M.A.; Dobson, C.M.; Vendruscolo, M. Simultaneous determination of protein structure and dynamics. Nature 2005, 433, 128–132. [Google Scholar] [CrossRef] [PubMed]
- Katritzky, A.R.; Kiely, J.S.; Hebert, N.; Chassaing, C. Definition of templates within combinatorial libraries. J. Comb. Chem. 2000, 2, 2–5. [Google Scholar] [CrossRef]
- Hu, Y.; Bajorath, J. Target family-directed exploration of scaffolds with different SAR profiles. J. Chem. Inf. Model. 2011, 51, 3138–3148. [Google Scholar] [CrossRef] [PubMed]
- Manelfi, C.; Gemei, M.; Talarico, C.; Cerchia, C.; Fava, A.; Lunghini, F.; Beccari, A.R. “Molecular Anatomy”: A new multi-dimensional hierarchical scaffold analysis tool. J Cheminform. 2021, 13, 54. [Google Scholar] [CrossRef]
- Cherukupalli, S.; Karpoormath, R.; Chandrasekaran, B.; Hampannavar, G.A.; Thapliyal, N.; Palakollu, V.N. An insight on synthetic and medicinal aspects of pyrazolo[1,5-a]pyrimidine scaffold. Eur. J. Med. Chem. 2017, 126, 298–352. [Google Scholar] [CrossRef]
- Dalinger, I.L.; Vatsadse, I.A.; Shevelev, S.A.; Ivachtchenko, A.V. Liquid-phase synthesis of combinatorial libraries based on 7-trifluoromethyl-substituted pyrazolo[1,5-a]pyrimidine scaffold. J. Comb. Chem. 2005, 7, 236–245. [Google Scholar] [CrossRef]
- Yoshida, M.; Mori, A.; Inaba, A.; Masahiro, O.; Makino, H.; Yamaguchi, M.; Fujita, H.; Kawamoto, T.; Goto, M.; Kimura, H.; et al. Synthesis and structure–activity relationship of tetrahydropyrazolopyrimidine derivatives—A novel structural class of potent calcium-sensing receptor antagonists. Bioorg. Med. Chem. 2010, 18, 8501–8511. [Google Scholar] [CrossRef] [PubMed]
- Yokokawa, F.; Wang, G.; Chan, W.L.; Ang, S.H.; Wong, J.; Ma, I.; Rao, S.P.S.; Man-junatha, U.; Lakshminarayana, S.B.; Herve, M.; et al. Discovery of tetrahydropyrazolopyrimidine carboxamide derivatives as potent and orally active antitubercular agents. ACS Med. Lett. 2013, 4, 451–455. [Google Scholar] [CrossRef]
- Fernández-Álvaro, E.; Esquivias, J.; Pérez-Sánchez, M.; Domínguez de María, P.; Remuiñán-Blanco, M.J. Assessing biocatalysis for the synthesis of optically active tetrahydropyrazolo[1,5-α]pyrimidines (THPPs) as novel therapeutic agents. J. Mol. Catal. B Enzym. 2014, 100, 1–6. [Google Scholar] [CrossRef]
- Lovering, F.; Bikker, J.; Humblet, C. Escape from flatland: Increasing saturation as an approach to improving clinical success. J. Med. Chem. 2009, 52, 6752–6756. [Google Scholar] [CrossRef] [PubMed]
- Novikova, D.S.; Grigoreva, T.A.; Ivanov, G.S.; Melino, G.; Barlev, N.A.; Tribulovich, V.G. Activating effect of 3-benzylidene oxindoles on AMPK: From computer simulation to high-content screening. ChemMedChem 2020, 15, 2521–2529. [Google Scholar] [CrossRef]
- Novikova, D.S.; Grigoreva, T.A.; Zolotarev, A.A.; Garabadzhiu, A.V.; Tribulovich, V.G. Advanced palladium free approach to the synthesis of substituted alkene oxindoles via aluminum-promoted Knoevenagel reaction. RSC Adv. 2018, 8, 34543–34551. [Google Scholar] [CrossRef] [PubMed]
- Gureev, M.; Novikova, D.; Grigoreva, T.; Vorona, S.; Garabadzhiu, A.; Tribulovich, V. Simulation of MDM2 N-terminal domain conformational lability in the presence of imidazoline based inhibitors of MDM2-p53 protein-protein interaction. J. Comput. Aided Mol. Des. 2020, 34, 55–70. [Google Scholar] [CrossRef]
- Grigoreva, T.A.; Vorona, S.V.; Novikova, D.S.; Tribulovich, V.G. Analysis of P-glycoprotein transport cycle reveals a new way to identify efflux inhibitors. ACS Omega 2022, 7, 42835–42844. [Google Scholar] [CrossRef]
- Guo, Y.; Liu, Y.; Hu, N.; Yu, D.; Zhou, C.; Shi, G.; Zhang, B.; Wei, M.; Liu, J.; Luo, L.; et al. Discovery of zanubrutinib (BGB-3111), a novel, potent, and selective covalent inhibitor of Bruton’s tyrosine kinase. J. Med. Chem. 2019, 62, 792–7940. [Google Scholar] [CrossRef]
- Novikova, D.S.; Garabadzhiu, A.V.; Melino, G.; Barlev, N.A.; Tribulovich, V.G. Small-molecule activators of AMP-activated protein kinase as modulators of energy metabolism. Russ. Chem. Bull. 2015, 64, 1497–1517. [Google Scholar] [CrossRef]
- Grigoreva, T.A.; Sagaidak, A.V.; Vorona, S.V.; Novikova, D.S.; Tribulovich, V.G. ATP mimetic attack on the nucleotide-binding domain to overcome ABC transporter mediated chemoresistance. ACS Med. Chem. Lett. 2022, 13, 1848–1855. [Google Scholar] [CrossRef] [PubMed]
- Grigoreva, T.A.; Novikova, D.S.; Gureev, M.A.; Garabadzhiu, A.V.; Tribulovich, V.G. Amino acids as chiral derivatizing agents for antiproliferative substituted N-benzyl isoindolinones. Chirality 2018, 30, 785–797. [Google Scholar] [CrossRef]
- Novikova, D.S.; Darwish, F.; Grigoreva, T.A.; Tribulovich, V.G. Development of a reproducible and scalable method for the synthesis of biologically active pyrazolo[1,5-a]pyrimidine derivatives. Russ. J. Gen. Chem. 2023, 93, 1040–1049. [Google Scholar] [CrossRef]
- Elyashberg, M.; Argyropoulos, D. Computer-assisted structure elucidation (CASE): Current and future perspectives. Magn. Reson. Chem. 2021, 59, 667–668. [Google Scholar] [CrossRef]
- Navarro-Vázquez, A. State of the art and perspectives in the application of quantum chemical prediction of 1 H and 13 C chemical shifts and scalar couplings for structural elucidation of organic compounds. Magn. Reson. Chem. 2017, 55, 29–32. [Google Scholar] [CrossRef] [PubMed]
- Holzgrabe, U. Quantitative NMR spectroscopy in pharmaceutical applications. Prog. Nucl. Magn. Reson. Spectrosc. 2010, 57, 229–240. [Google Scholar] [CrossRef]
- Pauli, G.F.; Gödecke, T.; Jaki, B.U.; Lankin, D.C. Quantitative 1H NMR. Development and potential of an analytical method: An update. J. Nat. Prod. 2012, 75, 834–851. [Google Scholar] [CrossRef]
- Karplus, M. Contact electron-spin coupling of nuclear magnetic moments. J. Chem. Phys. 1959, 30, 11–15. [Google Scholar] [CrossRef]
- Coxon, B. Developments in the Karplus equation as they relate to the NMR coupling constants of carbohydrates. Adv. Carbohydr. Chem. Biochem. 2009, 62, 17–82. [Google Scholar] [CrossRef]
- Cerda-Garcia-Rojas, C.M.; Zepeda, L.D.; Joseph-Nathan, P. A PC program for calculation of dihedral angles from 1H NMR data. Tetrahedron Comput. Methodol. 1990, 3, 113–118. [Google Scholar] [CrossRef]
- Navarro-Vazquez, A.; Cobas, J.C.; Sardina, F.J.; Casanueva, J.; Diez, E. A graphical tool for the prediction of vicinal proton-proton 3J(HH) coupling constants. J. Chem. Inf. Comput. Sci. 2004, 44, 1680–1685. [Google Scholar] [CrossRef]
- Selivanov, S.I. Usage of relative differences of experimental and calculated vicinal constants 3JH-H for conformational analysis of rigid molecules in liquid. Appl. Magn. Reson. 2018, 49, 563–578. [Google Scholar] [CrossRef]
- Mo, H.; Harwood, J.S.; Yang, D.; Post, C.B. A simple method for NMR t1 noise suppression. J. Magn. Reson. 2017, 276, 43–50. [Google Scholar] [CrossRef]
- Cobas, J.C.; Bernstein, M.A.; Mart-Pastor, M.; Tahoces, P.G. A new general-purpose fully automatic baseline-correction procedure for 1D and 2D NMR data. J. Magn. Reson. 2006, 183, 145–151. [Google Scholar] [CrossRef]
- Pronina, J.A.; Komolova, D.D.; Boitsov, V.M.; Stepakov, A.V.; Selivanov, S.I. Regioisomers of 2,5,6,7,8-pentaaryl-1H-azepino[3,2,1-ij]quinazoline-1,3(2H)-dione containing various aryl substituents in the azepine ring: Structure determination using NMR methods. Appl. Magn. Reson. 2022, 53, 1677–1691. [Google Scholar] [CrossRef]
- Sounier, R.; Blanchard, L.; Wu, Z.; Boisbouvier, J. High-accuracy distance measurement between remote methyls in specifically protonated proteins. J. Am. Chem. Soc. 2007, 129, 472–473. [Google Scholar] [CrossRef]
- Reyes-Lopez, E.; Quiroz-Garcia, B.; Carpio-Martinez, P.; Jimenez-Barbero, J.; Cortes-Guzman, F.; Esturau-Escofet, N.; Cuevas, G. The folded conformation of perezone revisited. Long range nOe interaction in small molecules: Interpretable small signals or useless large artifacts? J. Mex. Chem. Soc. 2017, 61, 177–185. [Google Scholar] [CrossRef]
- Nichols, P.J.; Born, A.; Henen, M.A.; Strotz, D.; Orts, J.; Olsson, S.; Guntert, P.; Chi, C.N.; Vogeli, B. The exact nuclear overhauser enhancement: Recent advances. Molecules 2017, 22, 1176. [Google Scholar] [CrossRef]
- Strotz, D.; Orts, J.; Minges, M.; Vogeli, B. The experimental accuracy of the uni-directional exact NOE. J. Magn. Reson. 2015, 259, 32–46. [Google Scholar] [CrossRef]
- Butts, C.P.; Jones, C.R.; Song, Z.; Simpson, T.J. Accurate NOE-distance determination enables the stereochemical assignment of a flexible molecule—Arugosin C. Chem. Commun. 2012, 48, 9023–9025. [Google Scholar] [CrossRef]
- Jones, C.R.; Greenhalgh, M.D.; Bame, J.R.; Simpson, T.J.; Cox, R.J.; Marshall, J.W.; Butts, C.P. Subtle temperature-induced changes in small molecule conformer dynamics—Observed and quantified by NOE spectroscopy. Chem. Commun. 2016, 52, 2920–2923. [Google Scholar] [CrossRef] [PubMed]
- Selivanov, S.I.; Solov’ev, A.Y.; Morozkina, S.N.; Shavva, A.G. An NMR study of the conformational mobility of estrogen 7α-methyl-8α analogues. Russ. J. Bioorg. Chem. 2007, 33, 302–309. [Google Scholar] [CrossRef] [PubMed]
- Selivanov, S.I.; Wang, S.; Filatov, A.S.; Stepakov, A.V. NMR study of spatial structure and internal dynamic of adducts of ninhydrin-derived azomethine ylide with cyclopropenes. Appl. Magn. Reson. 2020, 51, 165–182. [Google Scholar] [CrossRef]
- Borgias, B.A.; Gochin, M.; Kerwood, D.J.; James, T.L. Relaxation matrix analysis of 2D NMR data. Prog. NMR Spectrosc. 1990, 22, 83–100. [Google Scholar] [CrossRef]
- Selivanov, S.I.; Shavva, A.G. An NMR study of the spatial structure and intramolecular dynamics of modified analogues of steroid hormones. Russ. J. Bioorg. Chem. 2002, 28, 194–208. [Google Scholar] [CrossRef] [PubMed]
- Belov, K.V.; Dyshin, A.A.; Krestyaninov, M.A.; Efimov, S.V.; Khodov, I.A.; Kiselev, M.G. Conformational preferences of tolfenamic acid in DMSO-CO2 solvent system by 2D NOESY. J. Mol. Liq. 2022, 367, 120481. [Google Scholar] [CrossRef]
- Khodov, I.A.; Nikiforov, M.Y.; Alper, G.A.; Blokhin, D.S.; Efimov, S.V.; Klochkov, V.V.; Georgi, N. Spatial structure of felodipine dissolved in DMSO by 1D NOE and 2D NOESY NMR spectroscopy. J. Mol. Struct. 2013, 1035, 358–362. [Google Scholar] [CrossRef]
- Jones, C.R.; Butts, C.P.; Harvey, J.N. Accuracy in determining interproton distances using Nuclear Overhauser Effect data from a flexible molecule. Beilstein J. Org. Chem. 2011, 7, 145–150. [Google Scholar] [CrossRef]
- Butts, C.P.; Jones, C.R.; Harvey, J.N. High precision NOEs as a probe for low level conformers—Second conformation of strychnine. Chem. Commun. 2011, 47, 1193–1195. [Google Scholar] [CrossRef] [PubMed]
- Raber, D.J.; Guida, W.C. Tetrabutylammonium borohydride. Borohydride reductions in dichloromethane. J. Org. Chem. 1976, 41, 690–696. [Google Scholar] [CrossRef]
- Haasnoot, C.A.G.; de Leeuw, F.A.A.M.; Altona, C. The relationship between proton-proton NMR coupling constants and substituent electronegativities—I: An empirical generalization of the Karplus equation. Tetrahedron 1980, 36, 2783–2795. [Google Scholar] [CrossRef]


| N | Hi–Hj | Θijcalc, Grad | 3Jijcalc, Hz | 3Jijexp, Hz |
|---|---|---|---|---|
| 1 | H6α(ax)–H5 | −177.7 | 11.85 | 11.1 |
| 2 | H6α(ax)–H7 | 168.8 | 11.32 | 11.1 |
| 3 | H6β(eq)–H5 | −60.2 | 2.64 | 2.9 |
| 4 | H6β(eq)–H7 | 51.7 | 4.13 | 4.2 |
| N | Hi–Hj | Θijcalc, Grad | 3Jijcalc, Hz | <3Jij>exp, Hz | ||
|---|---|---|---|---|---|---|
| ANTI1 | ANTI2 | ANTI1 | ANTI2 | |||
| 1 | H6α–H5 | 59.6 | −52.3 | 2.86 | 4.41 | 4.2 |
| 2 | H6α–H7 | 76.1 | 166.5 | 0.87 | 11.88 | 4.8 |
| 3 | H6β–H5 | 176.7 | 65.0 | 11.85 | 1.95 | 7.9 |
| 4 | H6β–H7 | −41.2 | 49.7 | 6.32 | 4.46 | 5.3 |
Disclaimer/Publisher’s Note: The statements, opinions and data contained in all publications are solely those of the individual author(s) and contributor(s) and not of MDPI and/or the editor(s). MDPI and/or the editor(s) disclaim responsibility for any injury to people or property resulting from any ideas, methods, instructions or products referred to in the content. |
© 2023 by the authors. Licensee MDPI, Basel, Switzerland. This article is an open access article distributed under the terms and conditions of the Creative Commons Attribution (CC BY) license (https://creativecommons.org/licenses/by/4.0/).
Share and Cite
Novikova, D.; Al Mustafa, A.; Grigoreva, T.; Vorona, S.; Selivanov, S.; Tribulovich, V. NMR-Verified Dearomatization of 5,7-Substituted Pyrazolo[1,5-a]pyrimidines. Molecules 2023, 28, 6584. https://doi.org/10.3390/molecules28186584
Novikova D, Al Mustafa A, Grigoreva T, Vorona S, Selivanov S, Tribulovich V. NMR-Verified Dearomatization of 5,7-Substituted Pyrazolo[1,5-a]pyrimidines. Molecules. 2023; 28(18):6584. https://doi.org/10.3390/molecules28186584
Chicago/Turabian StyleNovikova, Daria, Ammar Al Mustafa, Tatyana Grigoreva, Svetlana Vorona, Stanislav Selivanov, and Vyacheslav Tribulovich. 2023. "NMR-Verified Dearomatization of 5,7-Substituted Pyrazolo[1,5-a]pyrimidines" Molecules 28, no. 18: 6584. https://doi.org/10.3390/molecules28186584
APA StyleNovikova, D., Al Mustafa, A., Grigoreva, T., Vorona, S., Selivanov, S., & Tribulovich, V. (2023). NMR-Verified Dearomatization of 5,7-Substituted Pyrazolo[1,5-a]pyrimidines. Molecules, 28(18), 6584. https://doi.org/10.3390/molecules28186584