Article

Influence of Ligand Environment Stoichiometry on NIR-Luminescence Efficiency of Sm3+, Pr3+ and Nd3+ Ions Coordination Compounds

1
P. N. Lebedev Physical Institute of the Russian Academy of Sciences, 53 Leninskiy 1. Prospect, 119991 Moscow, Russia
2
Faculty of Chemistry, National Research University Higher School of Economics, 20 Miasnitskaya Str., 101000 Moscow, Russia
3
Kurnakov Institute of General and Inorganic Chemistry, Russian Academy of Sciences, 119991 Moscow, Russia
4
Chemistry Department, M.V. Lomonosov Moscow State University, Leninskie Gory Str., Building 1/3, 119991 Moscow, Russia
*
Author to whom correspondence should be addressed.
Molecules 2023, 28(15), 5892; https://doi.org/10.3390/molecules28155892
Submission received: 14 July 2023 / Revised: 28 July 2023 / Accepted: 1 August 2023 / Published: 5 August 2023
(This article belongs to the Special Issue Applications of Spectroscopy in Molecules)

Abstract

:
Six new complexes of the ligand HQcy (-4-(cyclohexanecarbonyl)-5-methyl-2-phenyl-2,4-dihydro-3H-pyrazol-3-one) and Ln3+ ions with emission in the near-infrared (Nd3+) or visible and near-infrared (Sm3+, Pr3+) spectral regions were synthesized and characterized using various methods, including single crystal X-ray diffraction. The study demonstrated that both tris complexes [LnQcy3(H2O)(EtOH)] and tetrakis-acids [H3O][LnQcy4] can be synthesized by varying the synthetic conditions. The photochemical properties of the complexes were investigated experimentally and theoretically using various molecular spectroscopy techniques and Judd–Ofelt theory. The objective was to quantitatively and qualitatively disclose the influence of complex stoichiometry on its luminescence properties. The study showed that the addition of an extra ligand molecule (in the tetrakis species) increased molar extinction by up to 2 times, affected the shape of photoluminescence spectra, especially of the Pr3+ complex, and increased the quantum yield of the Sm3+ complex by up to 2 times. The results obtained from this study provide insights into the luminescent properties of lanthanide coordination compounds, which are crucial for the design and development of novel photonic materials with tailored photophysical properties.

Graphical Abstract

1. Introduction

Nowadays, there is a high demand for creating new highly efficient sources of emission at the near-infrared (NIR) [1,2] or both the NIR and visible spectral regions [3,4]. One of the prominent material classes for such purposes is lanthanide coordination compounds with organic ligands. Such interest is related to optoelectronic [5,6,7,8], spectroscopic and photonic applications [9,10,11] due to the relatively high luminescence efficiency and narrow emission bands typical to trivalent lanthanide ions [9,10,11]. However, lanthanide ion’s luminescence intensity is limited by Laporte selection rules [12]. Coordinating lanthanide ions with organic molecules usually significantly increases the luminescence efficiency of the ions. This happens due to the “antenna effect” [13], which is based on the electronic excitation energy transfer from a ligand to an ion, partially allowing the forbidden f ⟶ f* transition. Interestingly, intensities for the f ⟶ f* transitions in compounds with a high-symmetry coordination polyhedron tend to be weaker than those with low symmetry [14].
Acylpyrazolones have previously been studied as chelating ligands, heterocyclic analogues of β-diketones, effectively sensitizing the luminescence of terbium [15,16,17] and dysprosium [3,18,19] ions. This is possible due to the relatively high triplet state energy of the ligands [20,21] compared to conventional β-diketones such as dibenzoylmethane and tenoyltrifluoroacetone [22,23]. In addition, there are separate works devoted to the emission properties of complexes of samarium [20,24] and neodymium [24,25], but this area remains poorly investigated. The luminescence of acylpyrazolonates of praseodymium has not been studied before. Moreover, there are few systematic studies of the photophysical properties of coordination compounds based on Pr3+ ions [3,26].
Regarding chemical structure, acylpyrazolones form complexes of different composition: neutral tris-complexes [LnQ3(solv)1–2] [21,24,25,27,28,29,30,31], adducts with dipyridyl, phenanthroline or phosphinoxides [LnQ3(L)], binuclear [Ln2Q6] [32,33], obtained in the absence of coordinating solvents and M[LnQ4] tetrakis-acid anions, where M is an hydroxonium [3,20,34,35], alkylammonium [25,36] or silver cation [20]. Easily formed tris-complexes, in which the coordination number of lanthanide takes values of 7 or 8 depending on steric hindrance of the ligand, were investigated in the best way [37]. Unfortunately, tris-complexes contain coordinated solvent molecules (water or alcohols), so their luminescence is attenuated by phonon-beam relaxation processes [3]. Tetrakis compounds are barely described and their photophysical properties have practically not been investigated in the literature [3,20,38,39]. Constructing a tetrakis compound, we modify luminescence properties of compounds by three factors. Firstly, replacing two water molecules with an additional neutral ligand molecule leads to suppression of the nonradiative multiphonon relaxation on the O-H group oscillations [40]. Secondly, in general, a tetrakis compound is not electrically neutral. Therefore, a cation in a compound may influence the electronic structure of organic ligands. On the other hand, an additional ligand molecule can alter the crystal symmetry of a coordination polyhedron [41,42,43].
In the present work, a series of tris and tetrakis coordination complexes of Sm3+, Pr3+ and Nd3+ ions with methanoncyclohexyl(5-hydroxy-3-methyl-1-phenyl-1H-pyrazo-4-yl)methanon were synthesized (see Scheme 1) and widely investigated using various methods of molecular spectroscopy. The main goal was to quantitatively and qualitatively compare the photophysical parameters of tris and tetrakis coordination compounds pairwise, such as photoluminescence quantum yields, radiative and non-radiative processes rates in dependence on the amount of ligand molecules coordinating each ion.

2. Results

2.1. Crystal Structure

As all lanthanide complexes are isostructural (Table S1), structure description will only be given for [Sm(Qcy)3(H2O)(EtOH)]∙(EtOH) and [H3O][Sm(Qcy)4].

2.1.1. Tris-Complexes

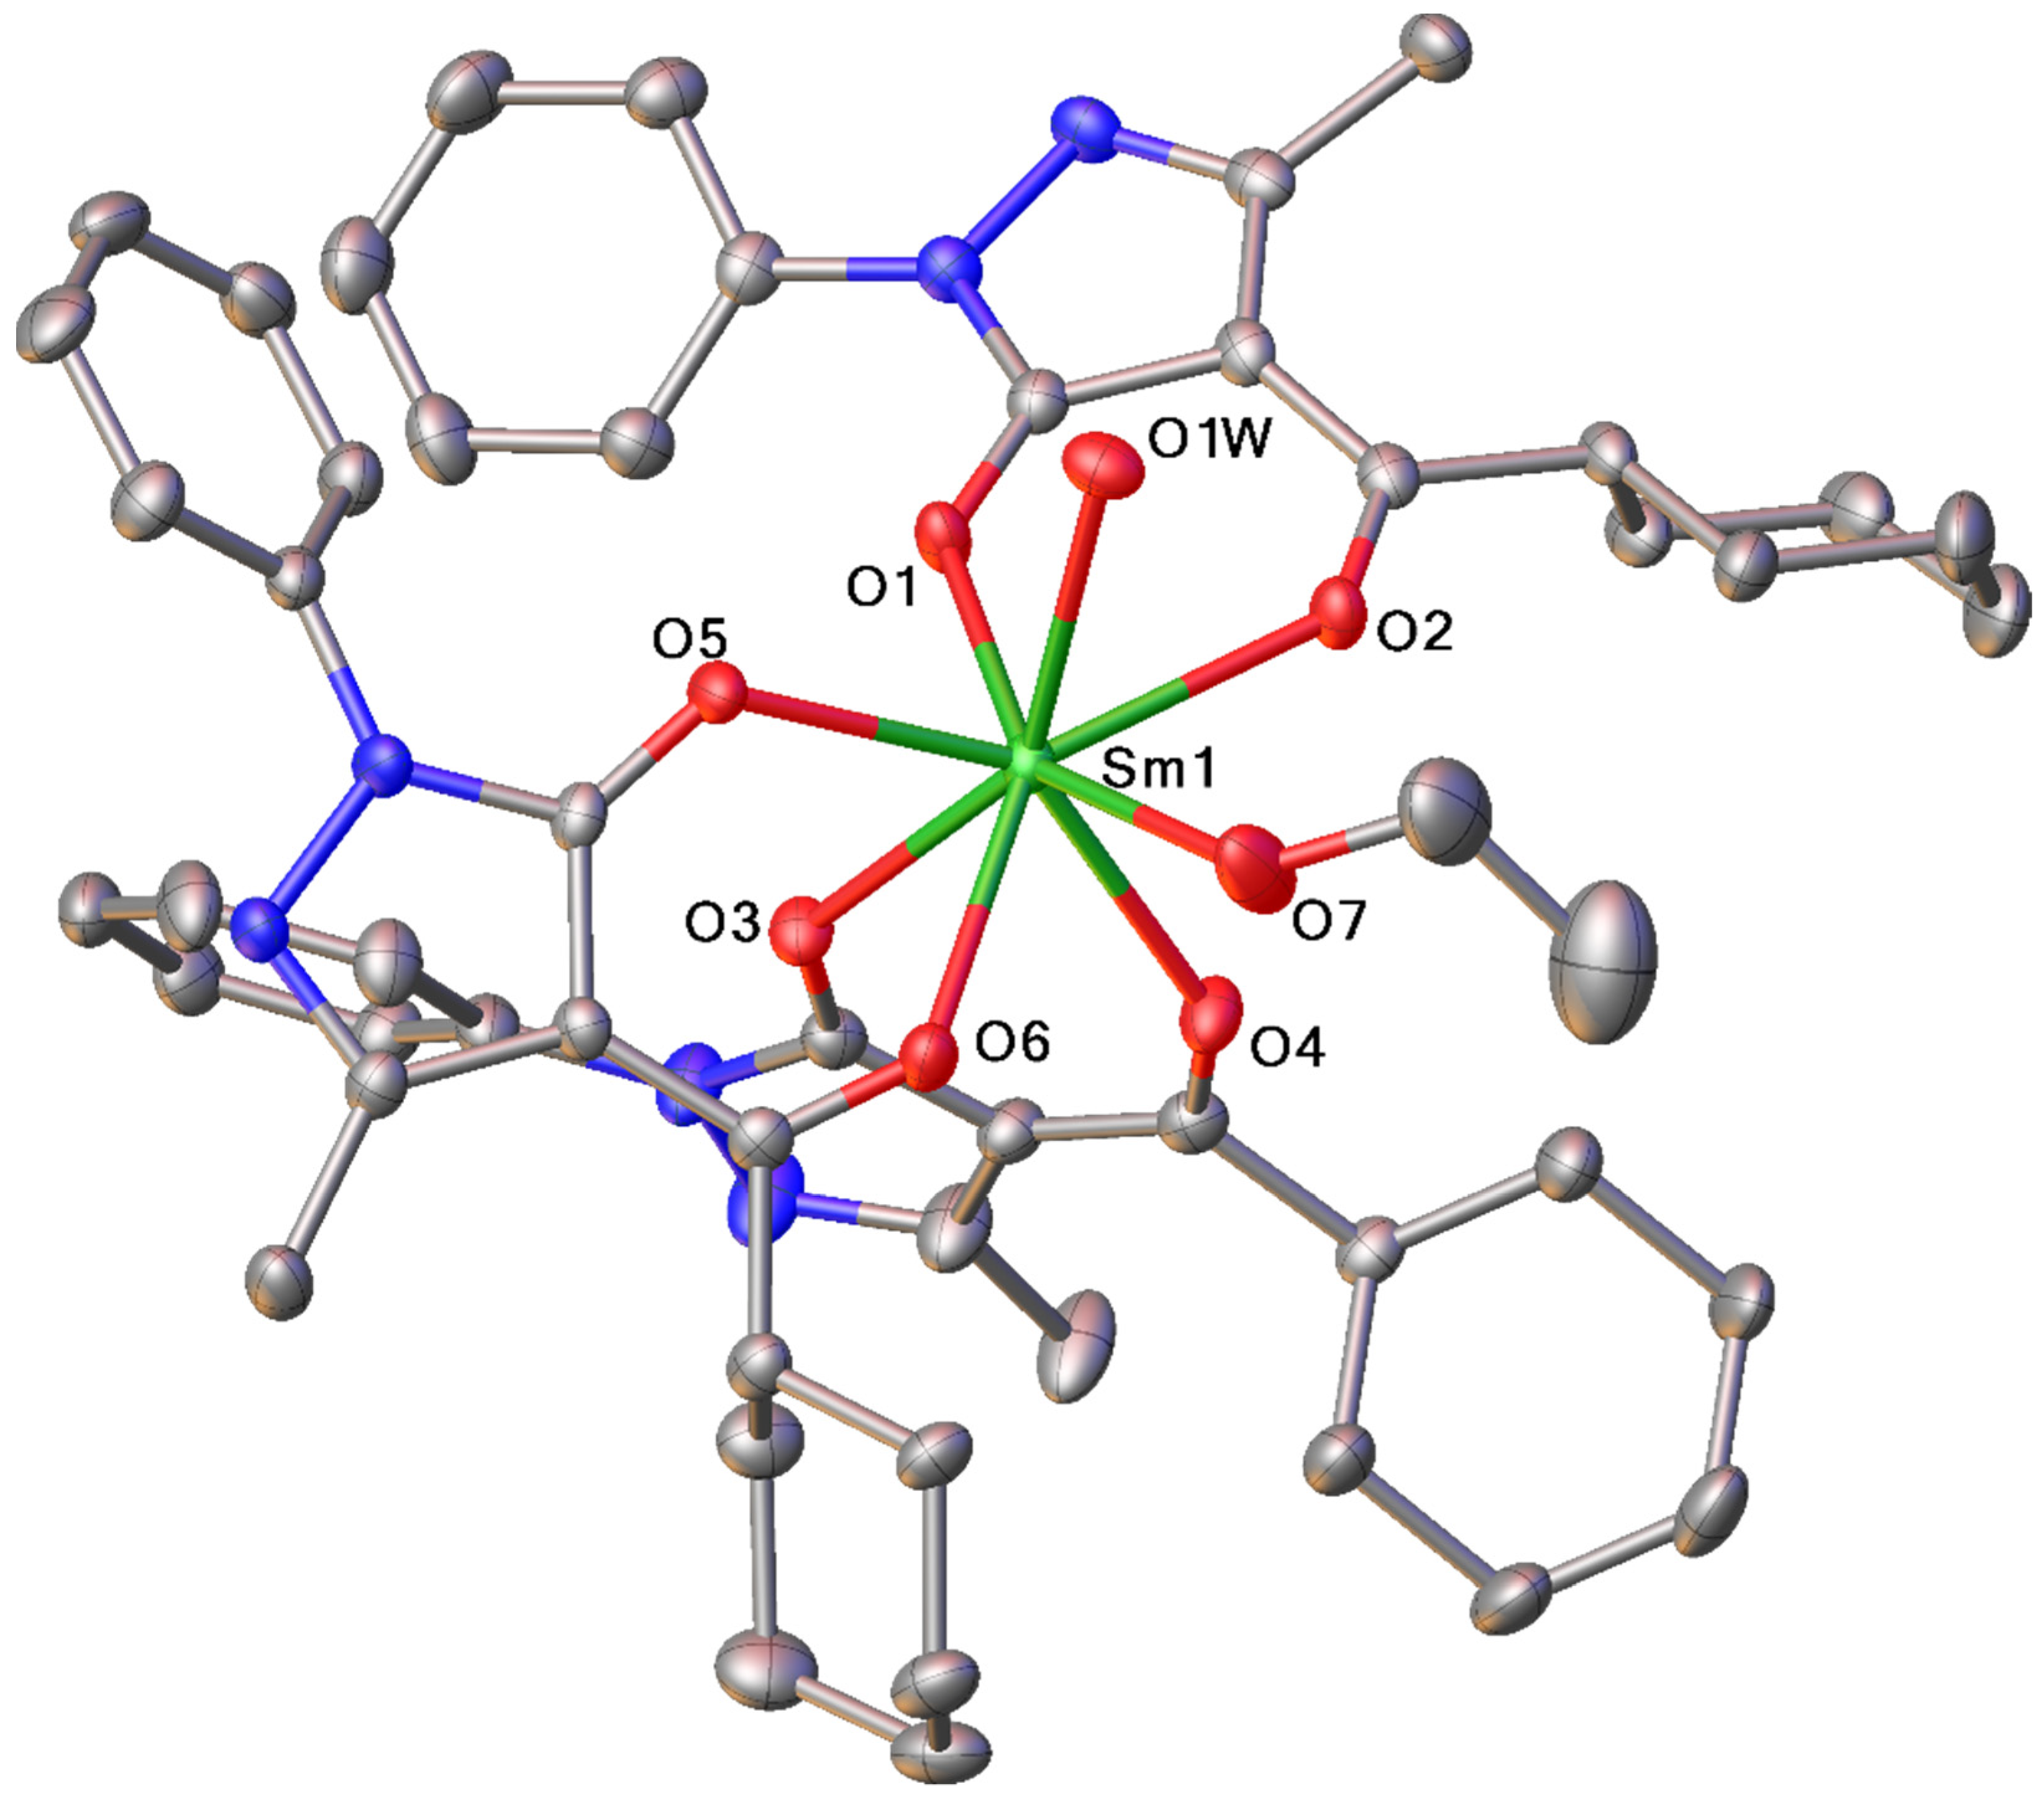
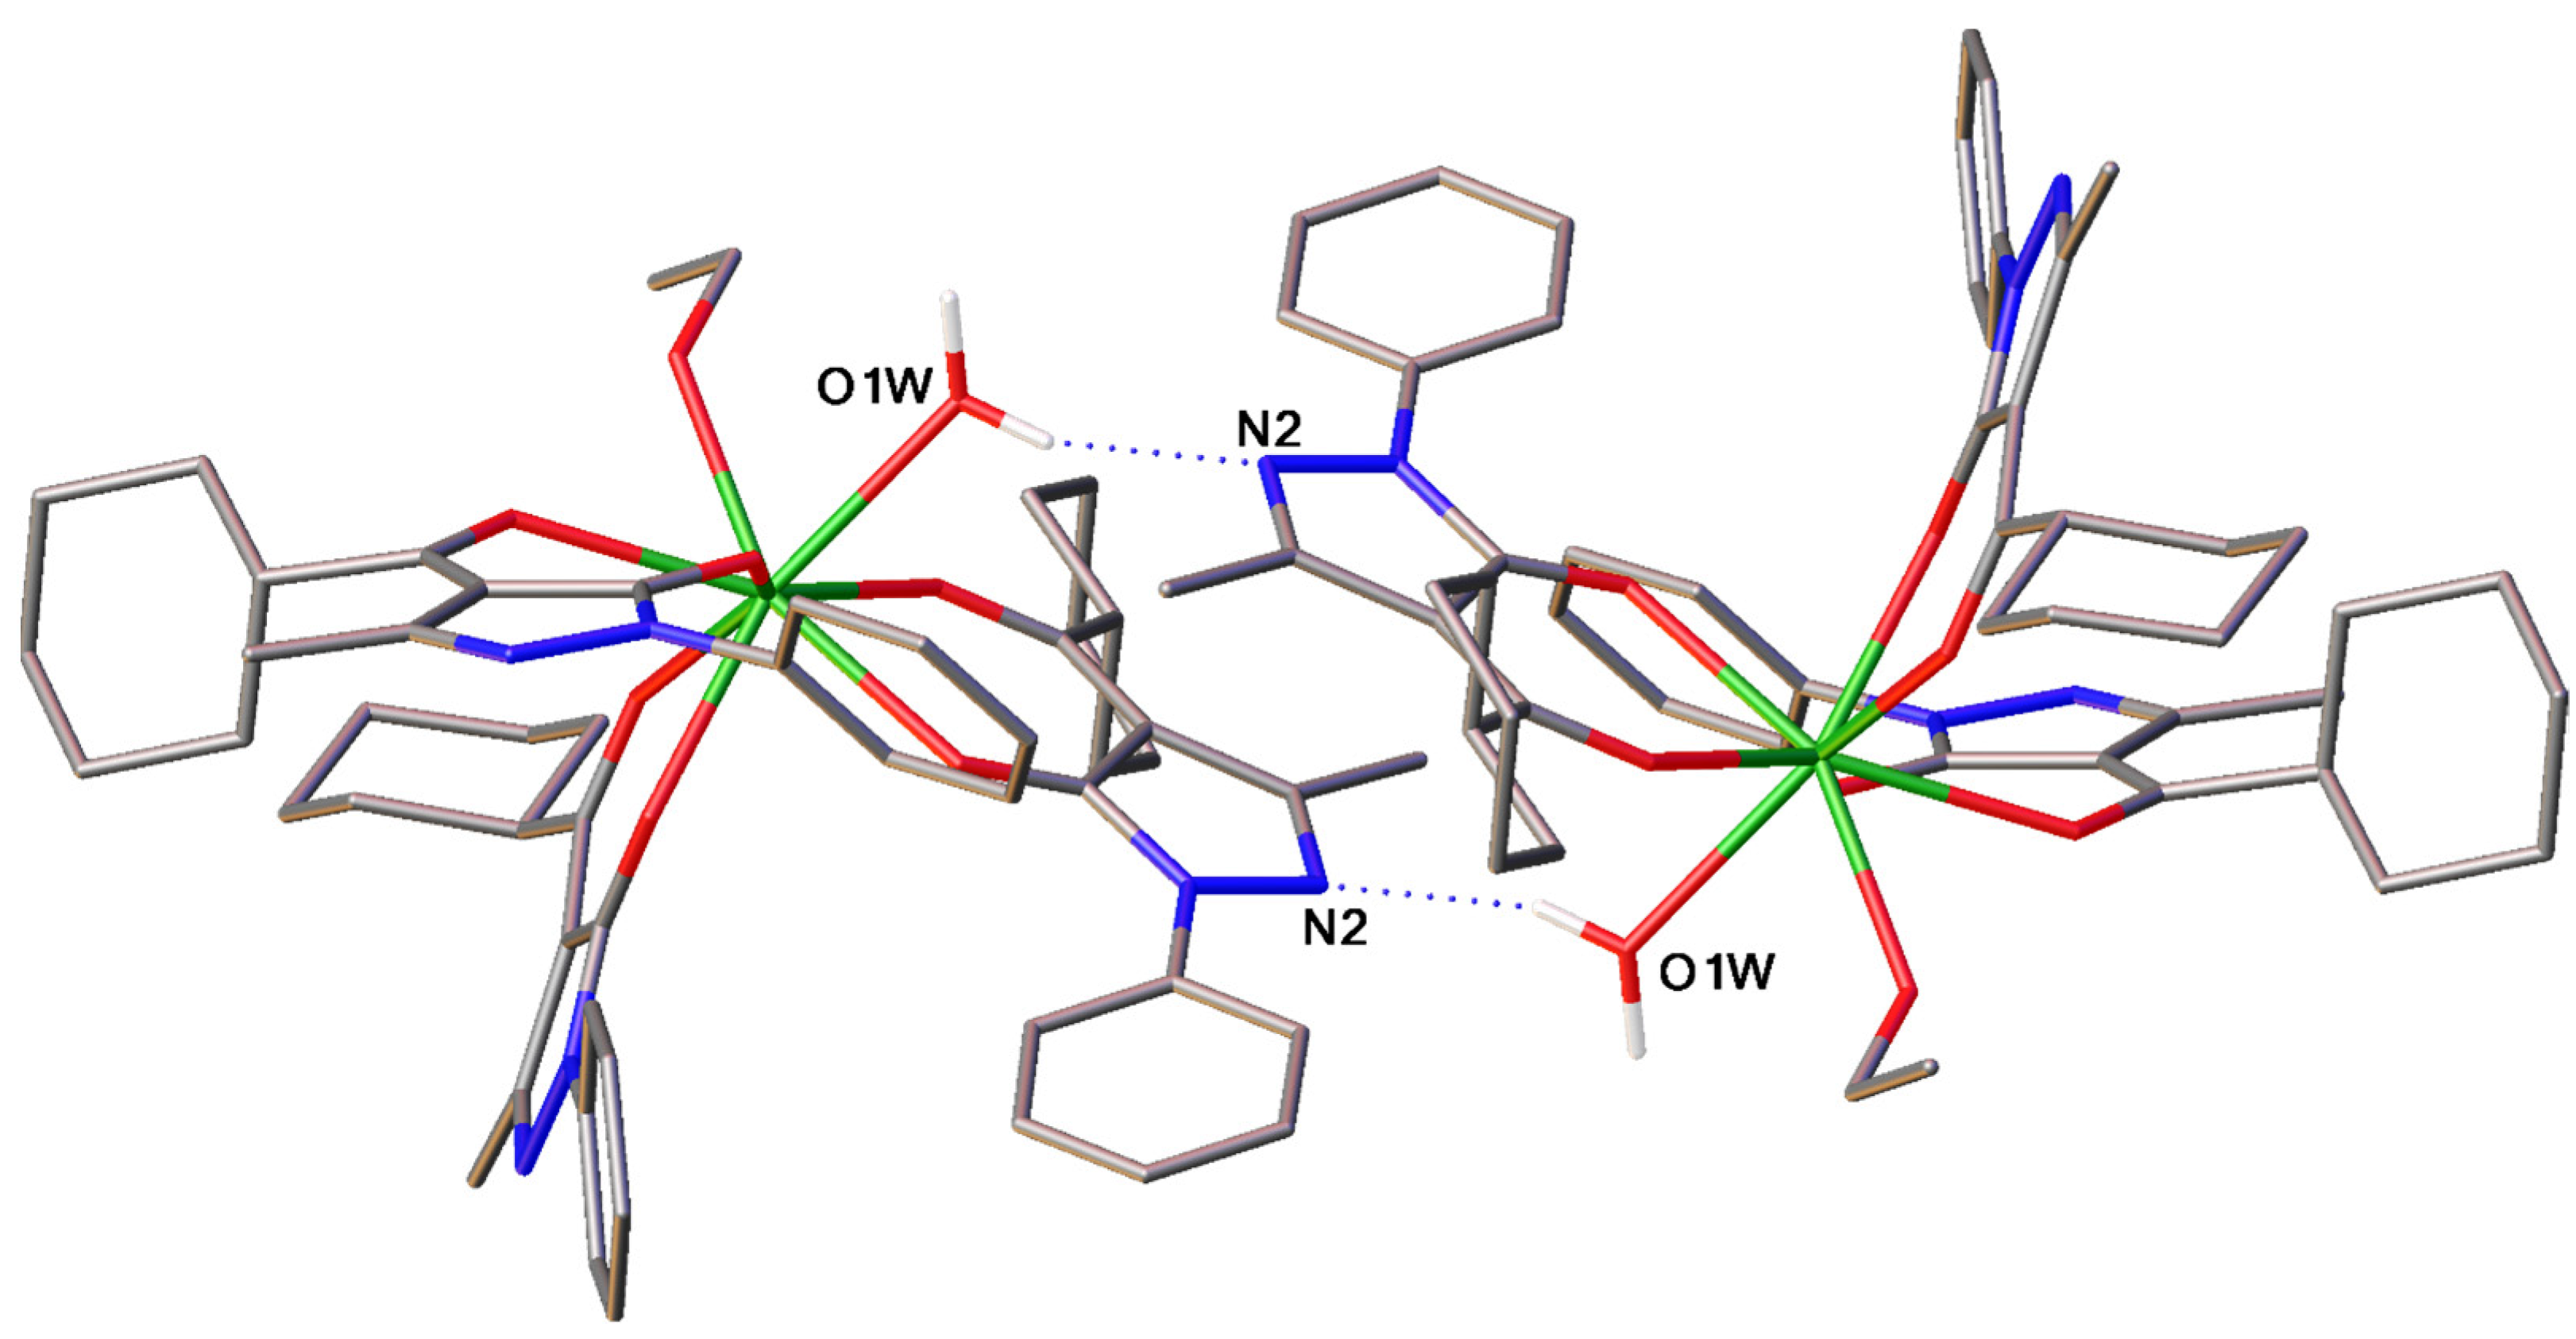
The structure is a mononuclear complex (See Figure 1), where the lanthanide ion is coordinated by oxygen atoms of three ligands (O1–O6) and two oxygen atoms of solvate molecules (O7 of ethanol and O1W of water), leading to the octa-coordinated complex with the coordination polyhedron {SmO8} which is best described as a square antiprism. Additionally, the structure contains one solvated molecule of ethanol, which is involved in hydrogen bonding with the water molecule (O1W…O1S distance is 2.70 Å). Upon further analysis of the crystal packing, the presence of intermolecular hydrogen bonds between the water molecule and pyrazole fragment of the adjacent molecule of the complex (O1W…N2 distance is 2.83 Å) was revealed, leading to the formation of hydrogen-bonded centrosymmetric dimers (See Figure 2).

2.1.2. Tetrakis-Complexes

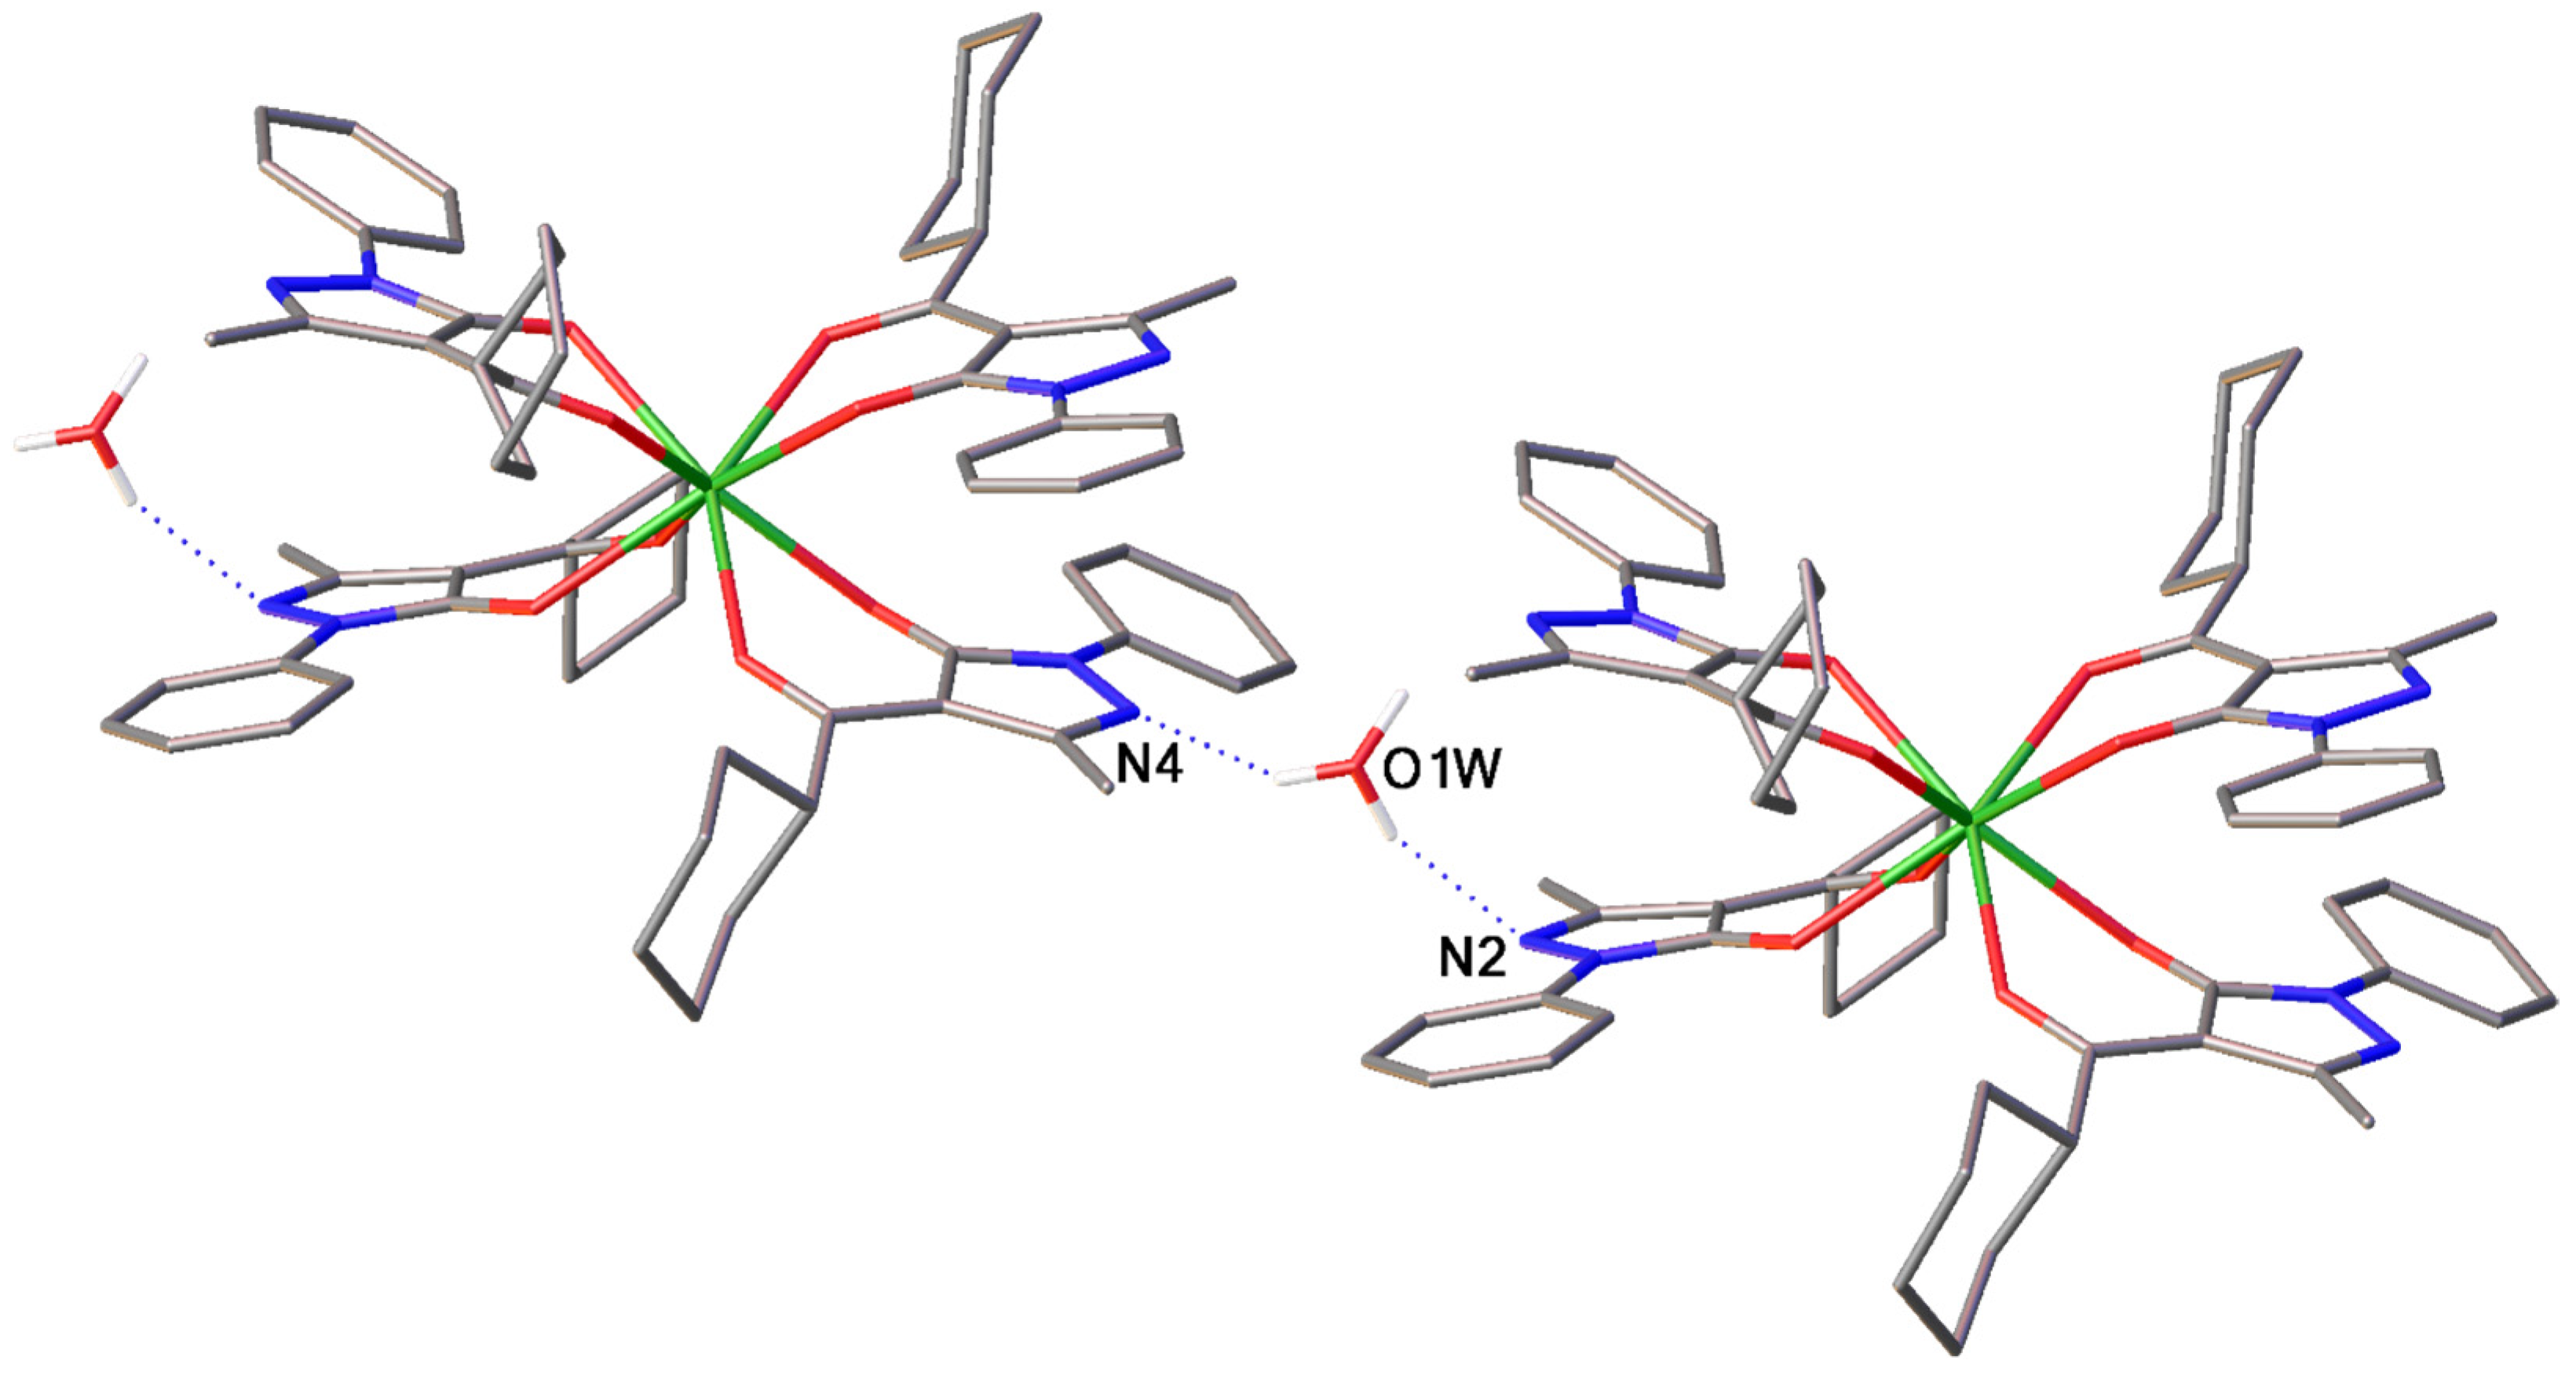
This structure is a mononuclear complex (See Figure 3), where the lanthanide ion is coordinated by oxygen atoms of four ligands, leading to an octa-coordinated negatively charged complex [Sm(Qcy)4], while the hydronium cation (H3O)+ is present as a counterion. The {SmO8} coordination polyhedron is best described as a square antiprism. Additionally, the complex lies on a two-fold rotation axis, and only half of the molecule lies in the asymmetric unit of the crystal structure. Additional proof of the electric negativity of the complex can be found from the bond length analysis of the diketone fragment (Table S2). A rather small difference in C–O and C–C bond lengths indicates that this fragment possesses delocalized negative charge. The analysis of crystal packing revealed that the hydronium cation is involved in two intermolecular hydrogen bonds with nitrogen atoms of pyrazole fragments (O1W…N2 distance is 2.78 Å and O1W…N4 distance is 2.59 Å) of two adjacent molecules of the complex, leading to the linear polymer-like crystal packing (See Figure 4).

2.2. Optical Absorption

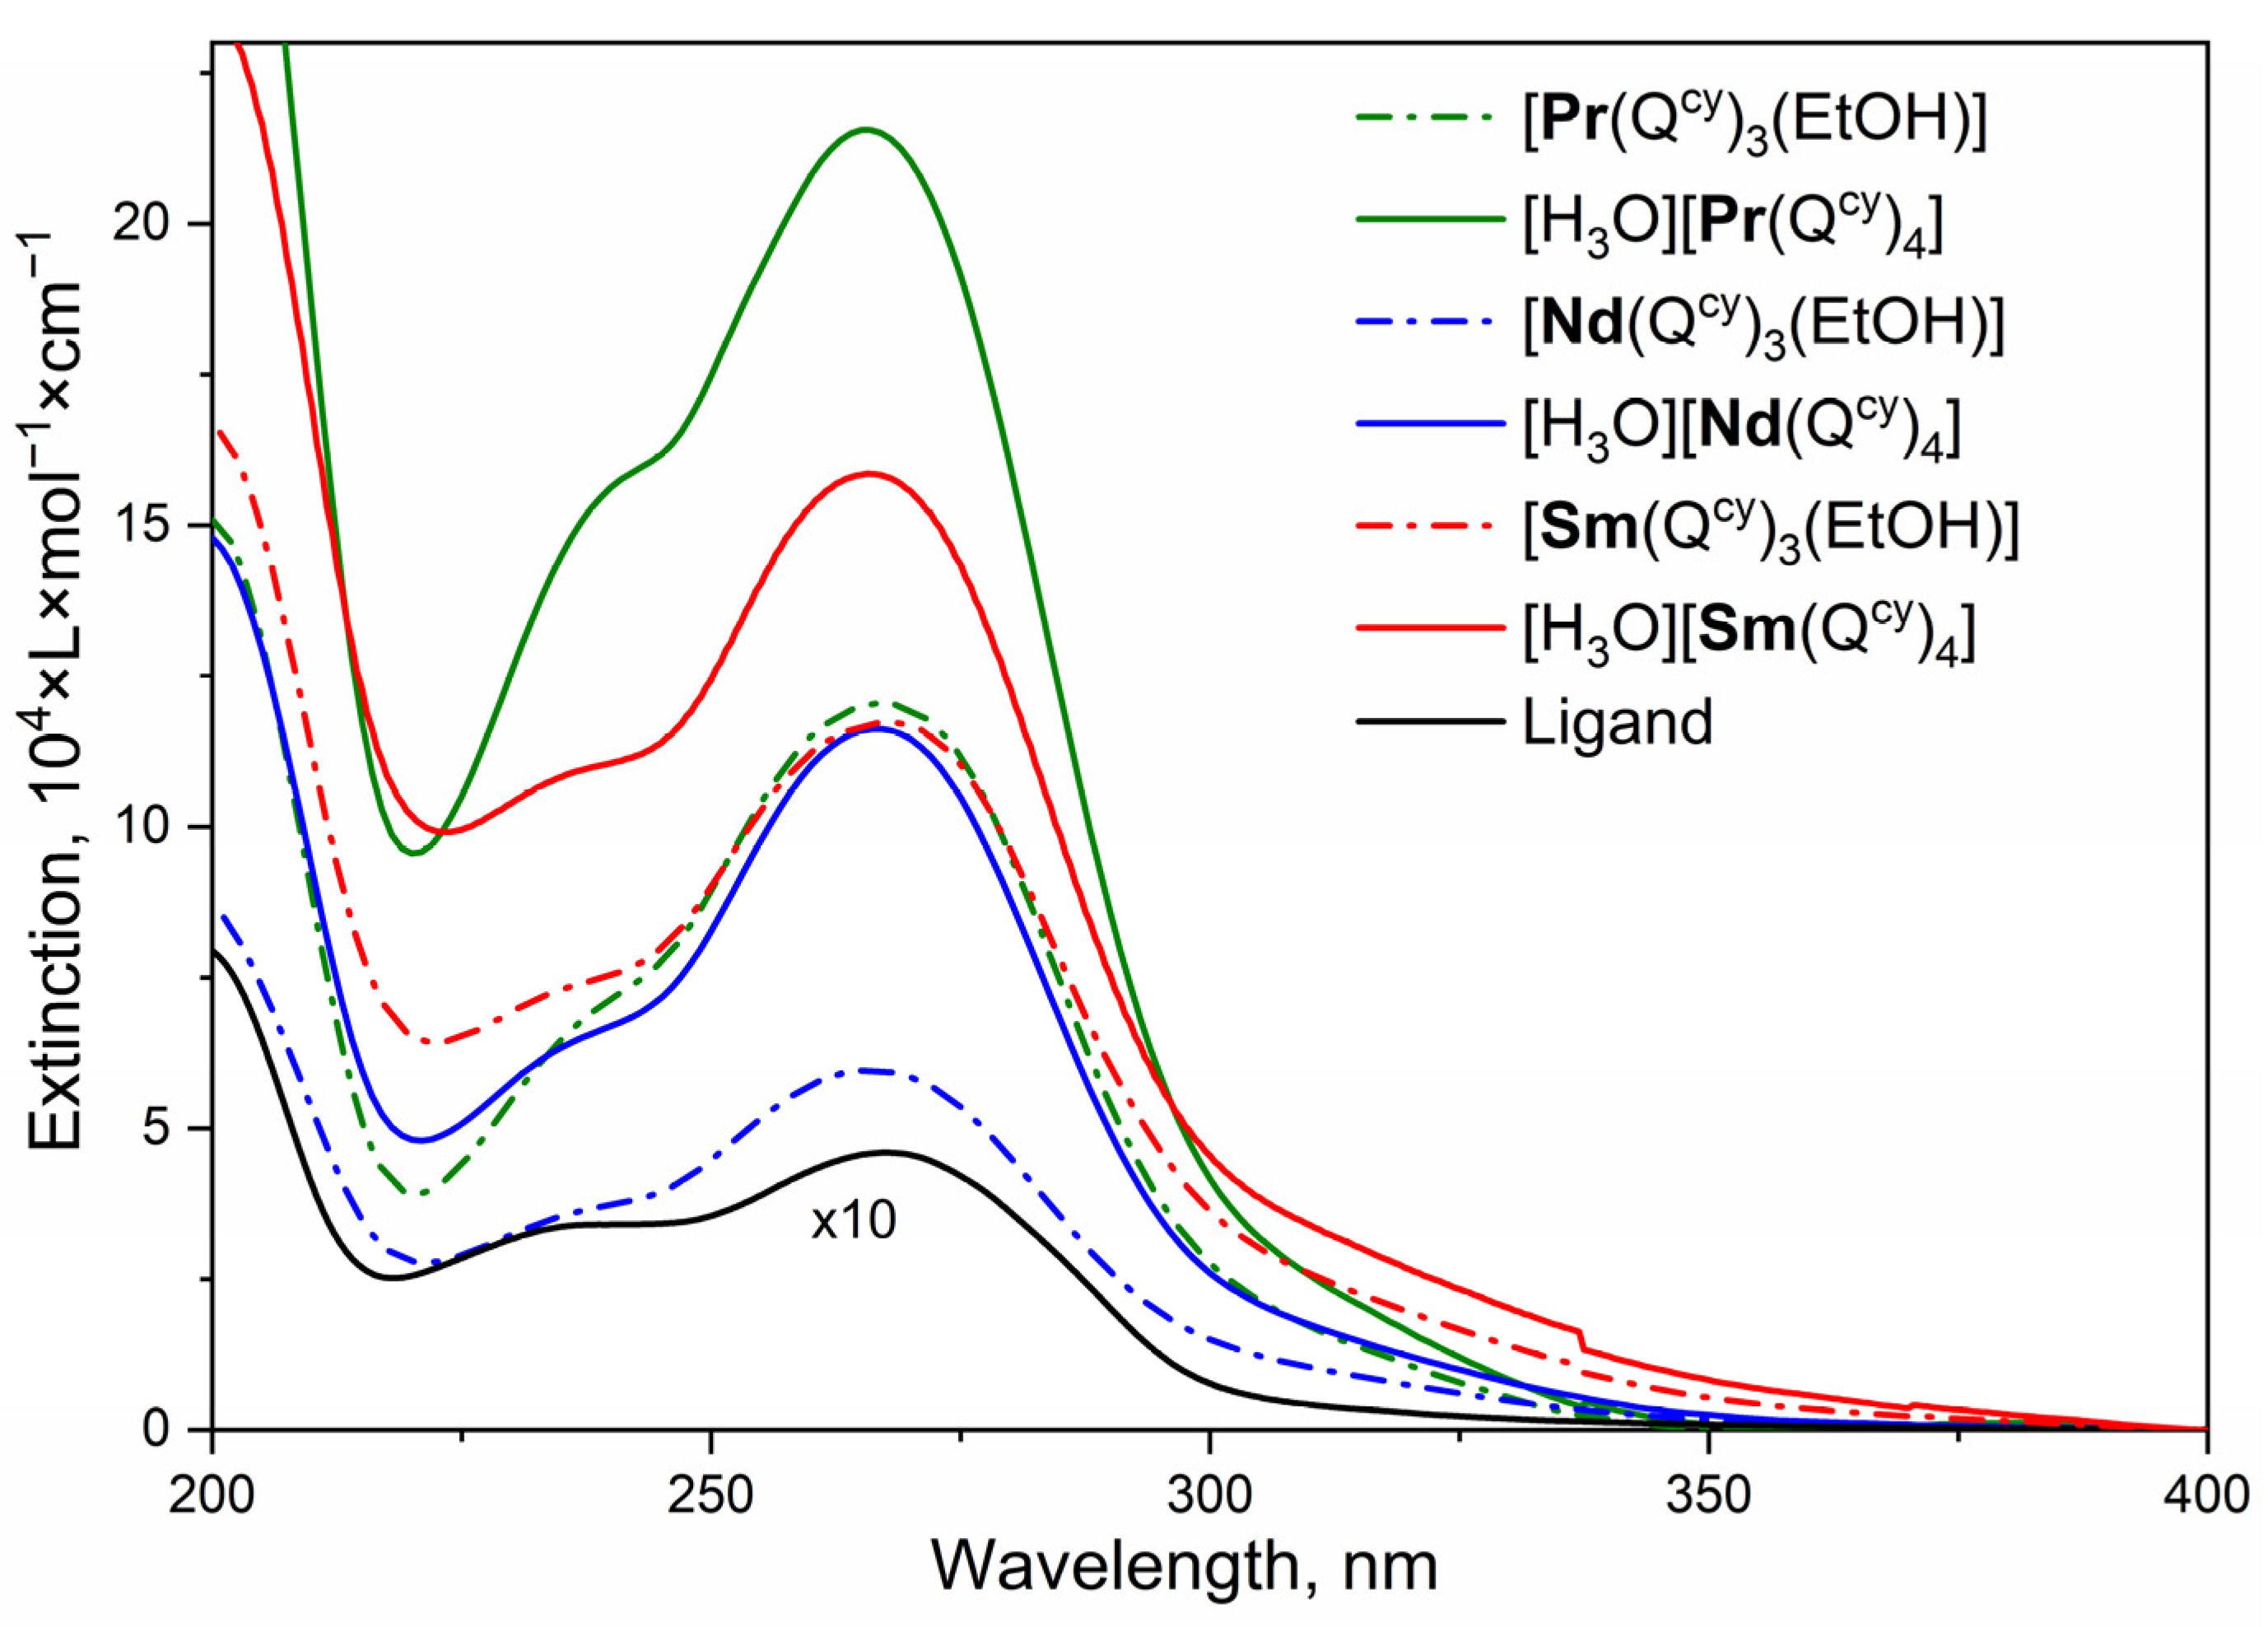
Optical absorption spectra, obtained for HL and complexes [Pr(Qcy)3(H2O)(EtOH)]∙(EtOH), [H3O][Pr(Qcy)4], [Nd(Qcy)3(H2O)(EtOH)]∙(EtOH), [H3O][Nd(Qcy)4], [Sm(Qcy)3(H2O)(EtOH)]∙(EtOH) and [H3O][Sm(Qcy)4] dissolved in MeCN, are shown in Figure 5. All the spectra qualitatively resemble each other. A pronounced maximum is observed at 268 nm. It was found that the coordination of lanthanide ions by this ligand leads to a significant increase in the molar extinction of the ligand environment of 40 times in comparison with the free HL ligand. Energies of the first excited singlet states were estimated as the edge of the low-energy band of the absorption spectra by a well-known tangent method [30]. For this purpose, the spectra were deconvoluted on Gaussian components. The S1 energy values for all the compounds are similar and oscillate about 28,500 cm−1. The increase in molar extinction is explained by an increase in the oscillator strength value of S0 ⟶ S1 transition due to the influence of heavy ions on ligand wave functions for the ground and excited states.
Additionally, as the spectra obtained for tris and tetrakis complexes are qualitatively similar, it is clear that the optical absorption of complexes is related to ligand absorption. Notably, adding an additional organic ligand molecule leads to an increase in molar extinction by a factor of two for [Nd(Qcy)3(H2O)(EtOH)]∙(EtOH) and [H3O][Nd(Qcy)4] complexes, 1.4 for [Sm(Qcy)3(H2O)(EtOH)]∙(EtOH) and [H3O][Sm(Qcy)4], and by almost two for [Pr(Qcy)3(H2O)(EtOH)]∙(EtOH) and [H3O][Pr(Qcy)4] complexes.

2.3. Photoluminescence

Photoluminescence (PL) spectra for all the compounds were recorded under CW excitation at 340 nm. The spectra reveal numerous narrow emission bands, originated by f ⟶ f* transitions in ions. The interrelation of the following spectral bands with transitions was established according to the literature [44].
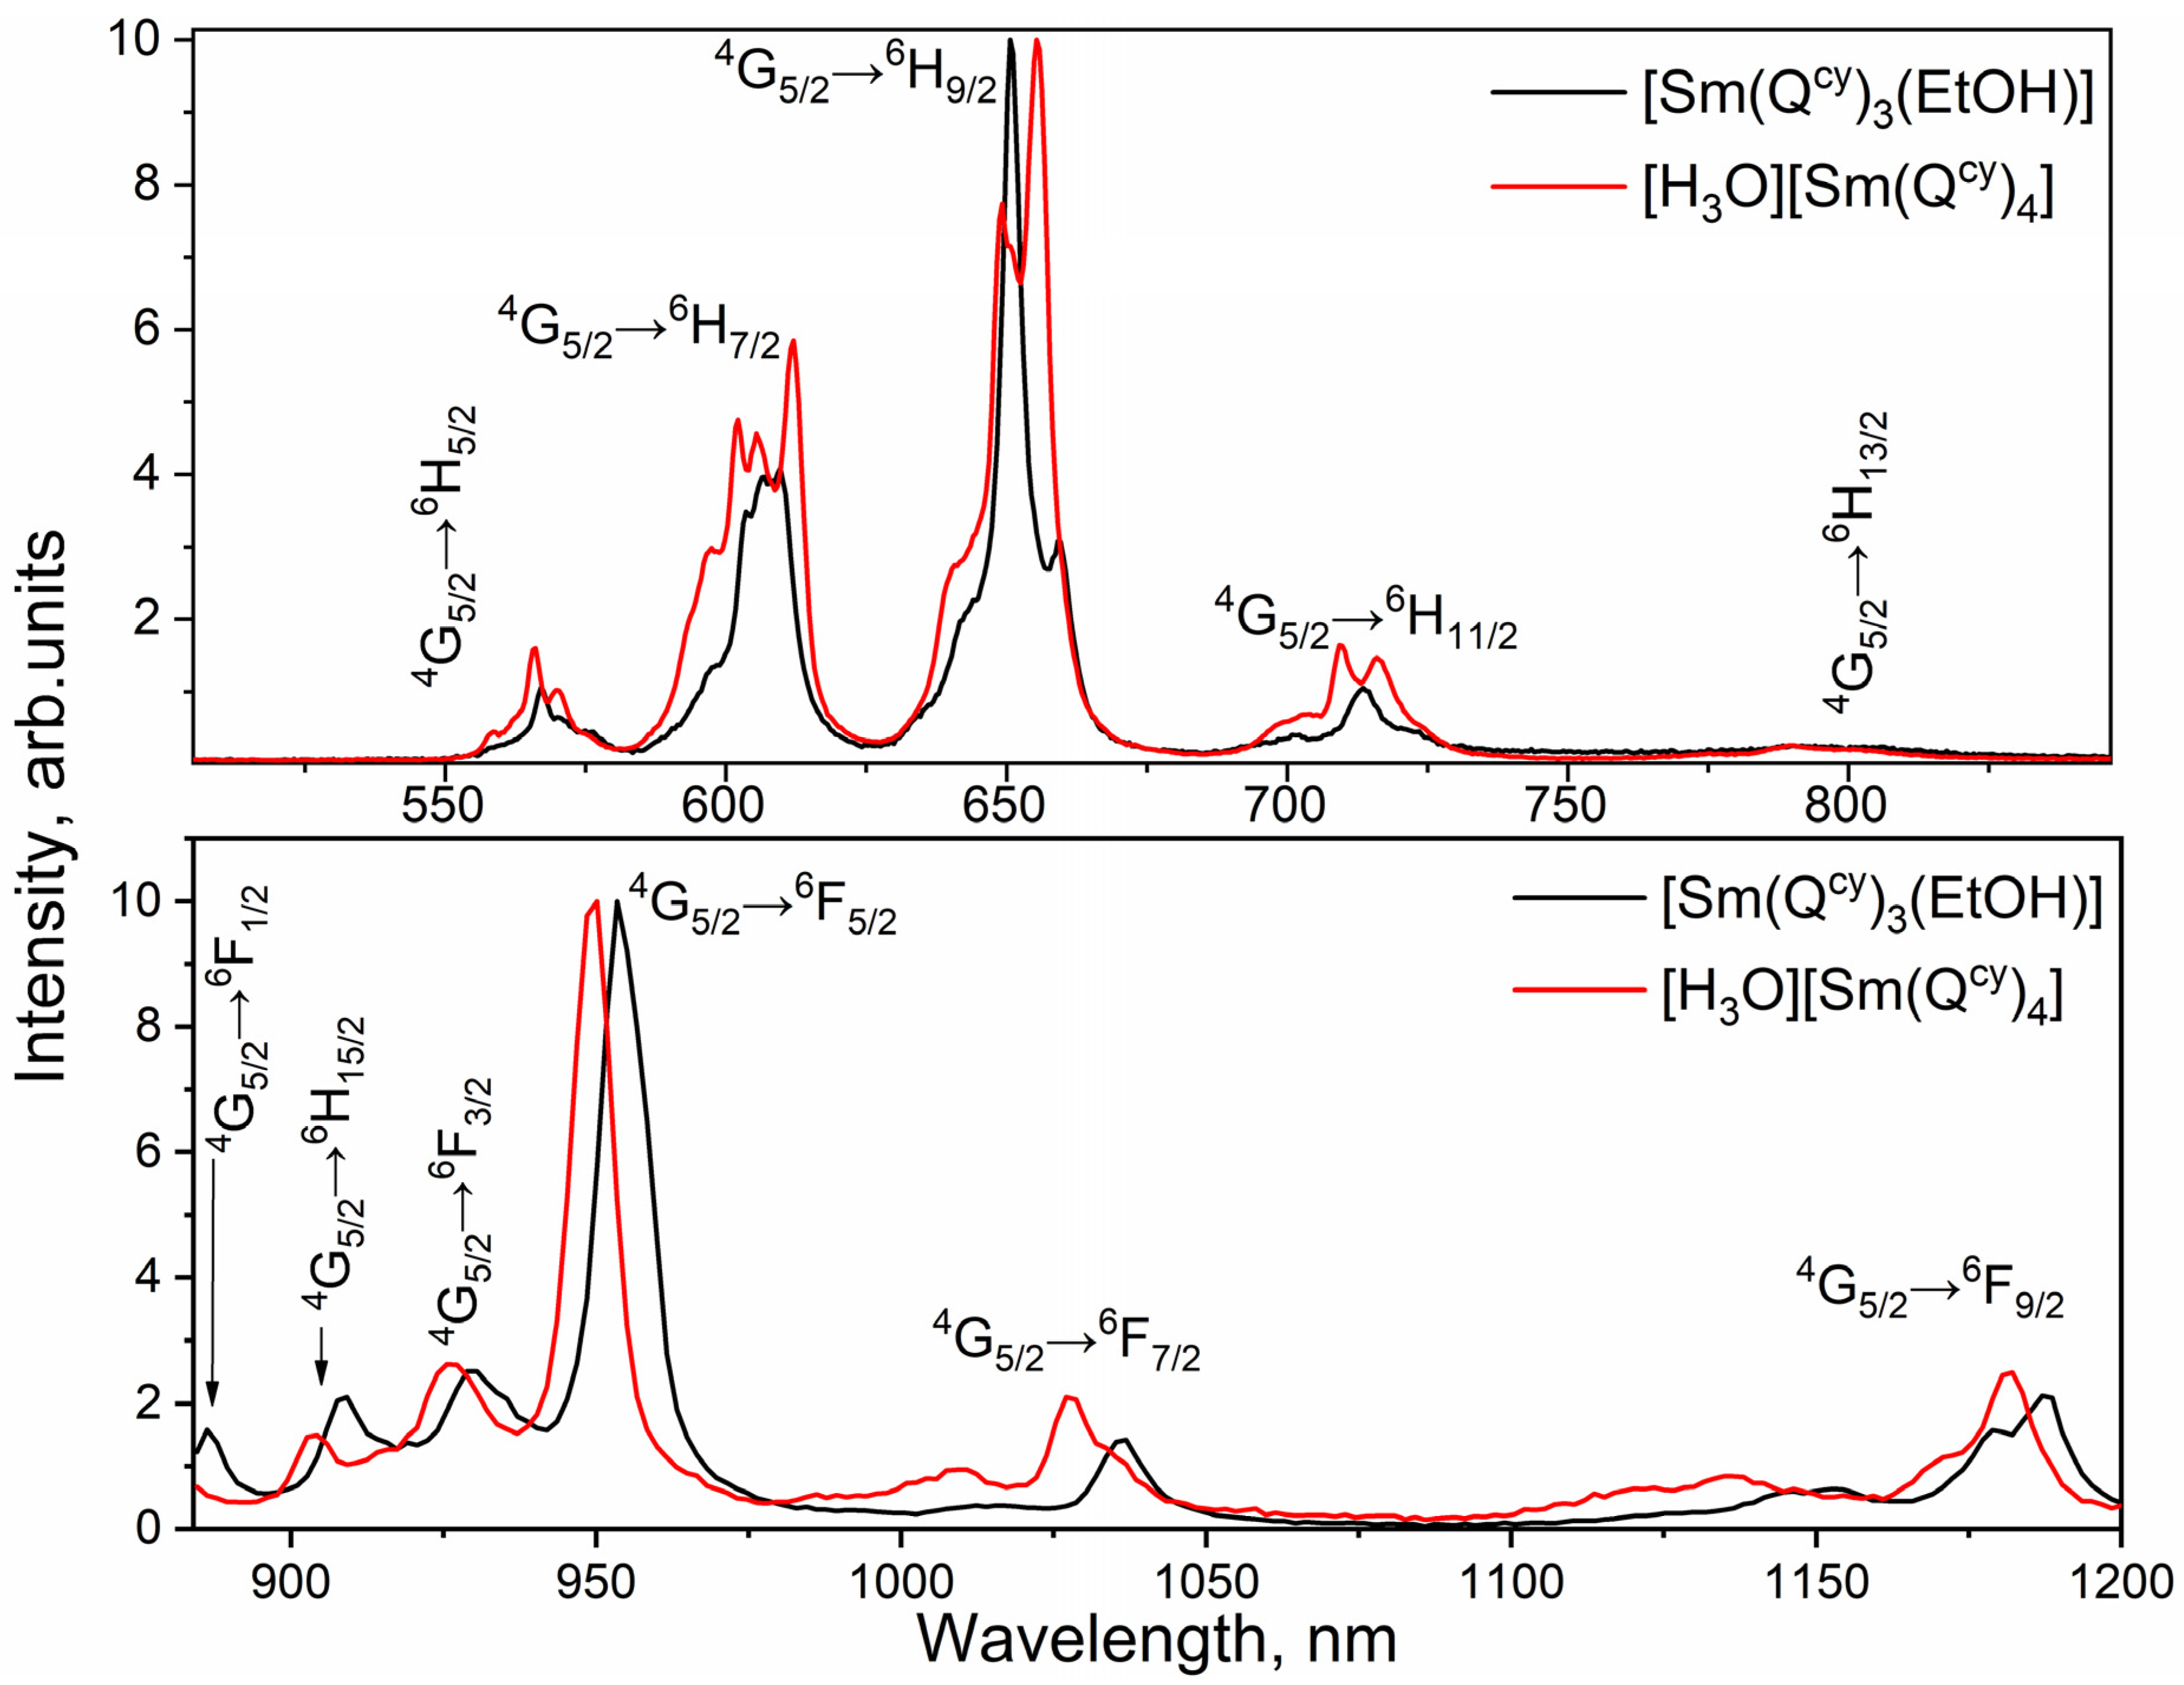
Photoluminescence (PL) spectra of [Sm(Qcy)3(H2O)(EtOH)]∙(EtOH) and [H3O][Sm(Qcy)4] complexes in the visible and near-IR regions are shown in Figure 6. We observed narrow spectral bands, typical for f ⟶ f* transitions of the Sm3+ ion:   G 5 / 2   4 H 5 / 2   6   ( 555 620   n m ) ,   G 5 / 2   4 H 7 / 2   ( 620 625   n m ) ,   6 G 5 / 2   4 H 9 / 2   ( 625 670   n m ) ,   6 G 5 / 2   4 H 11 / 2   ( 690 730   n m ) ,   6 G 5 / 2   4 H 13 / 2   ( 780 800   n m ) ,   6 G 5 / 2   4 F 1 / 2   ( 880 895   n m ) ,   6 G 5 / 2   4 H 15 / 2   ( 895 920   n m ) ,   6 G 5 / 2   4 F 3 / 2   ( 920 940   n m ) ,   6 G 5 / 2   4 F 5 / 2   ( 940 975   n m ) ,   6 G 5 / 2   4 F 7 / 2   ( 975 1050   n m ) ,   6 G 5 / 2   4 F 9 / 2   ( 1100 1200   n m )   6 . There was no ligand fluorescence in the PL spectra of both complexes, which evidences the high efficiency of energy transfer from the ligand to the ion. In addition, the observed emission bands are strongly split into several sub-bands due to the Stark effect [45]. The spectra of [H3O][Sm(Qcy)4] reveal more sub-bands than the spectra of [Sm(Qcy)3(H2O)(EtOH)]∙(EtOH), which may indicate that the tetrakis complex has lower coordination polyhedron symmetry in comparison with the tris complex [20]. However, as calculated by the Shape software (https://shapesoftware.com, accessed on 1 July 2023) [46], the symmetry point group of the coordination polyhedron {MO7} is a square antiprism (D4d) in both cases.
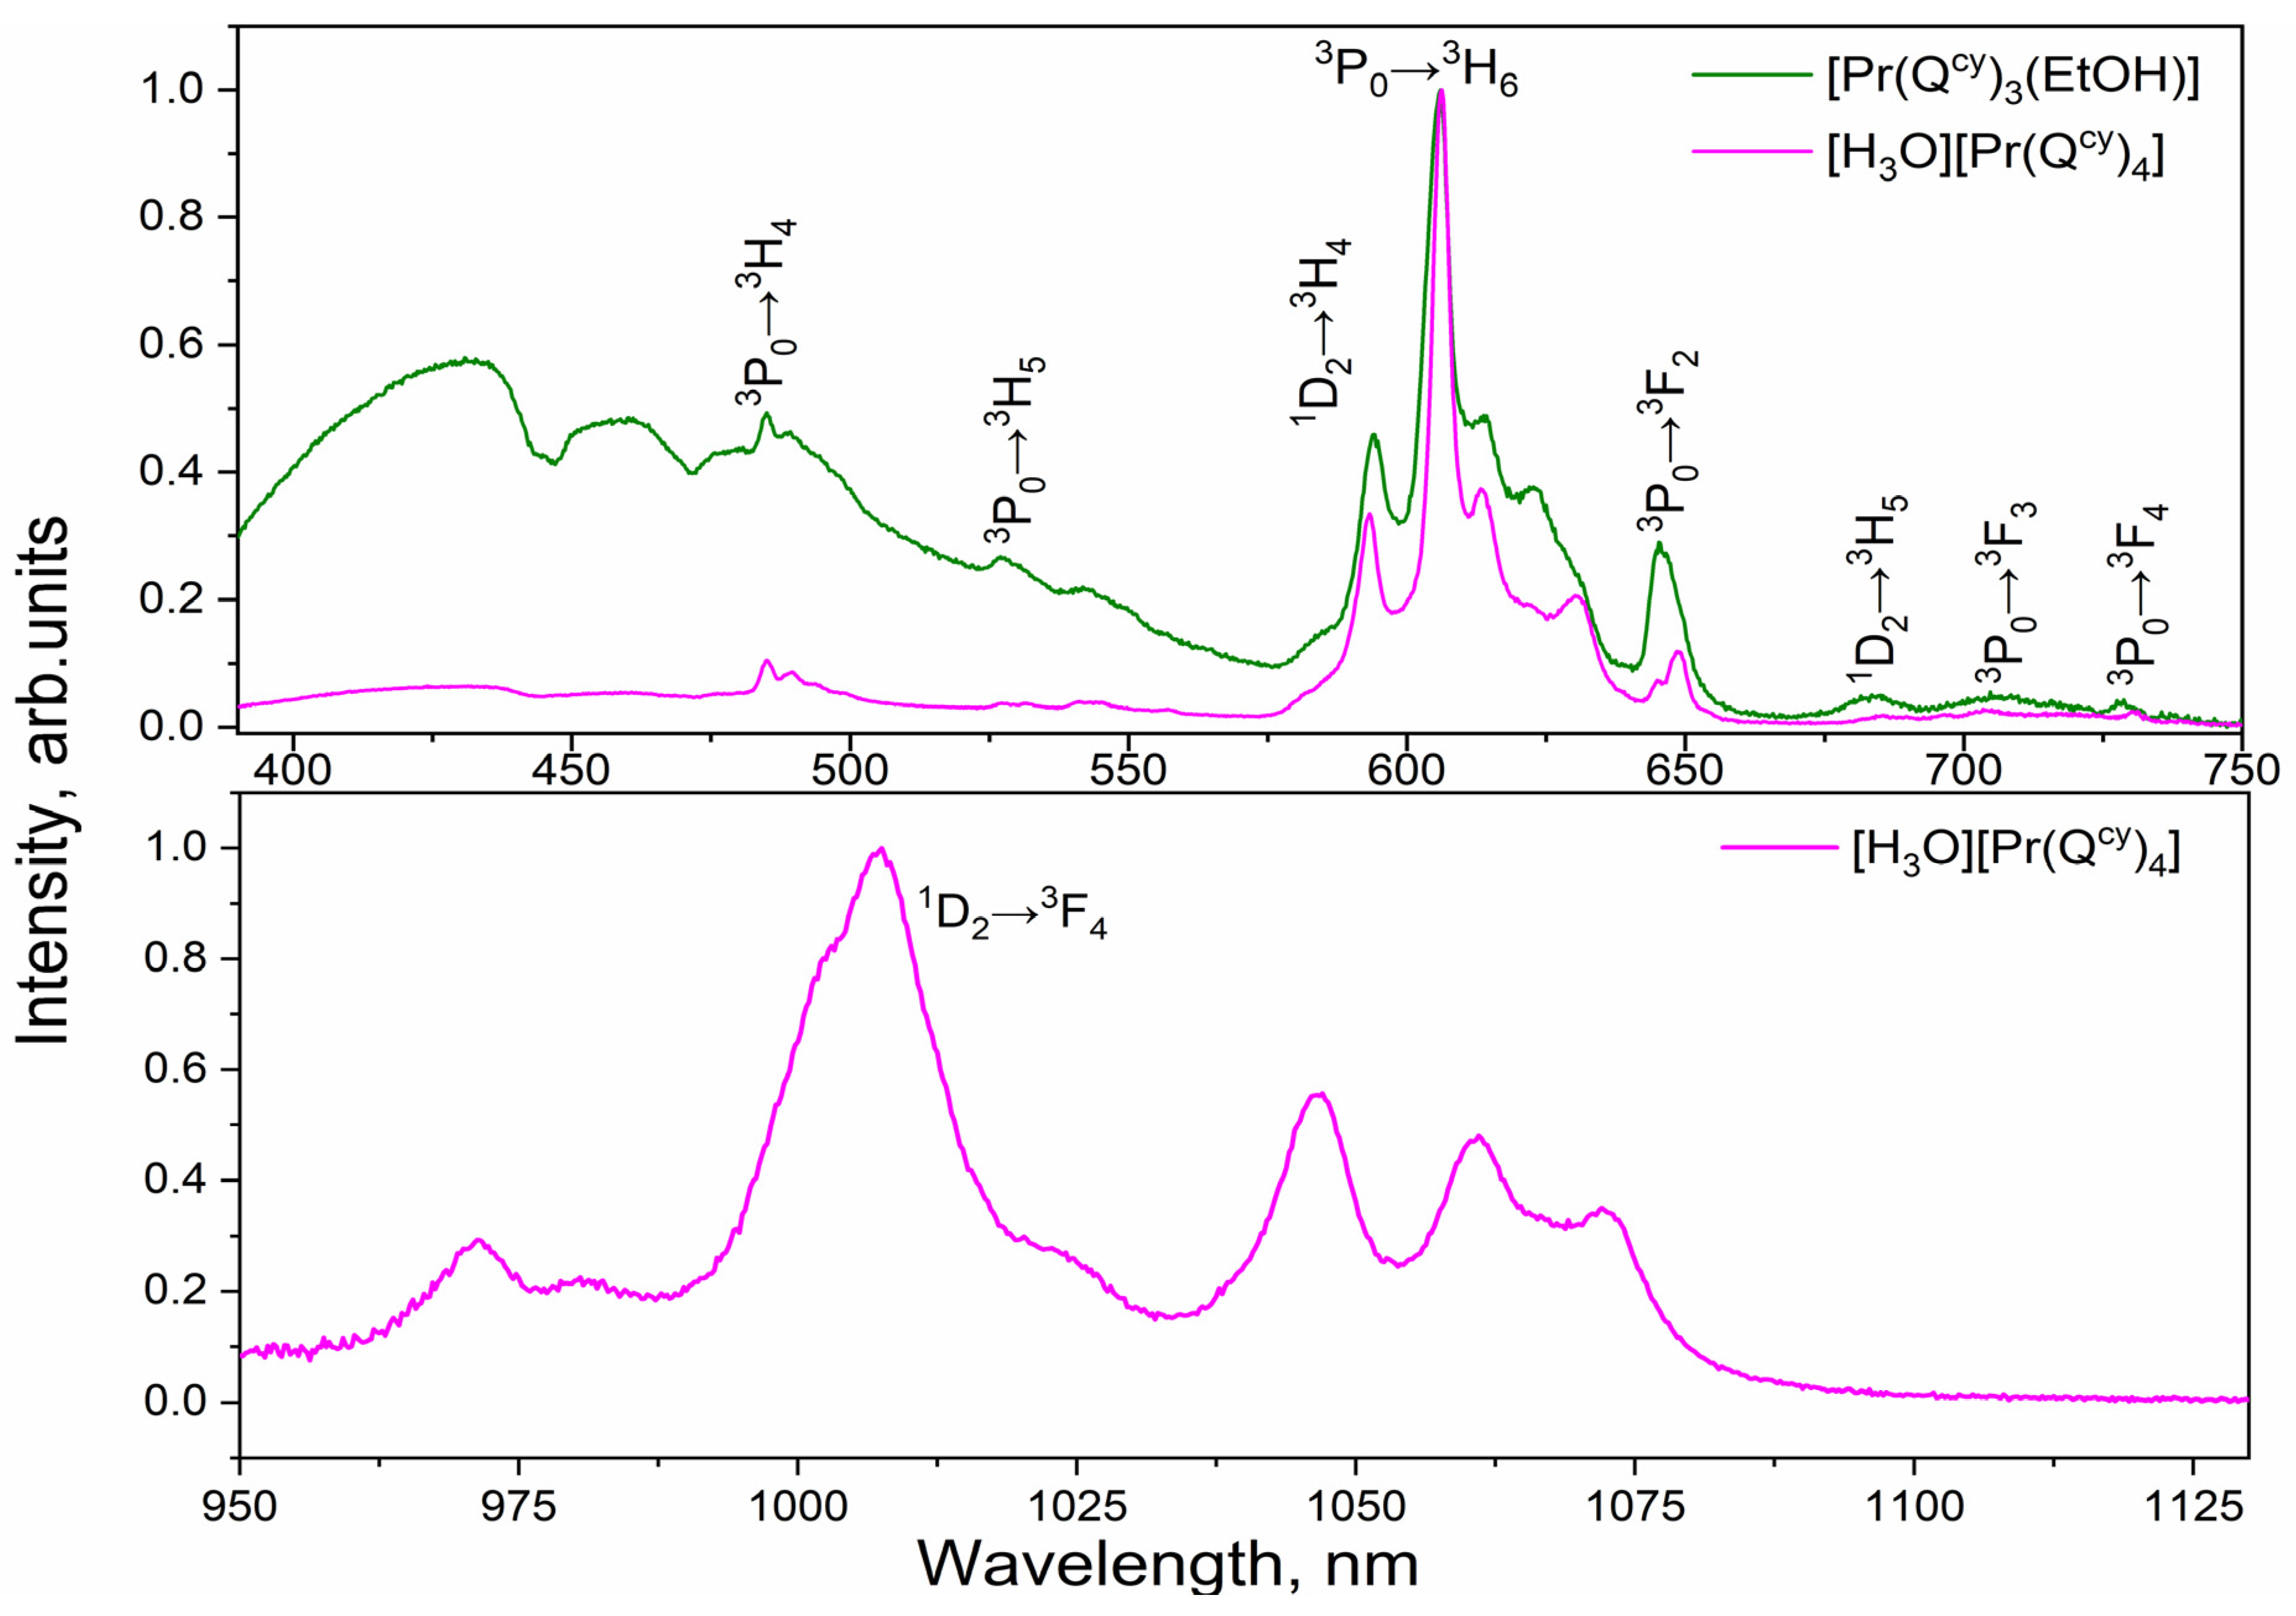
The PL spectra of the [Pr(Qcy)3(H2O)(EtOH)]∙(EtOH) and [H3O][Pr(Qcy)4] complexes are shown in Figure 7. There are narrow spectral emission bands of the Pr3+ ion detected in the visible region of the luminescence spectra of complexes, as well as wide ligand luminescence bands in the blue-green region of the spectrum. The observed narrow emission bands centered at 485 nm, 527 nm, 594 nm, 606 nm, 645 nm, 684 nm, 706 nm and 628 nm originate from P 0   3 H 4   3 ,   P 0   3 H 5   3 ,   D 2   1 H 4   3 ,   P 0   3 H 6   3 ,   P 0   3 F 2   3 ,   D 2   1 H 5   3 ,   P 0   3 F 3   3   и   P 0   3 F 4   3 transitions of the Pr3+ ion, respectively. The presence of highly intensive ligand fluorescence in the tris complex spectrum indicates an incomplete transfer of energy to the excited states of the ion. Notably, there is a decrease in the relative intensity of the luminescence of the ligand for the tetrakis complex in comparison with the tris complex.
The spectra of both complexes of the Pr3+ ion are similarly split by the Stark effect, suggesting the same polyhedron symmetry for both compounds. This conclusion was supported by the X-ray single crystal structure analysis (D4d group). Unfortunately, we could not obtain the spectrum in the NIR region for the tris complex due to intensive vibration quenching on the OH groups.
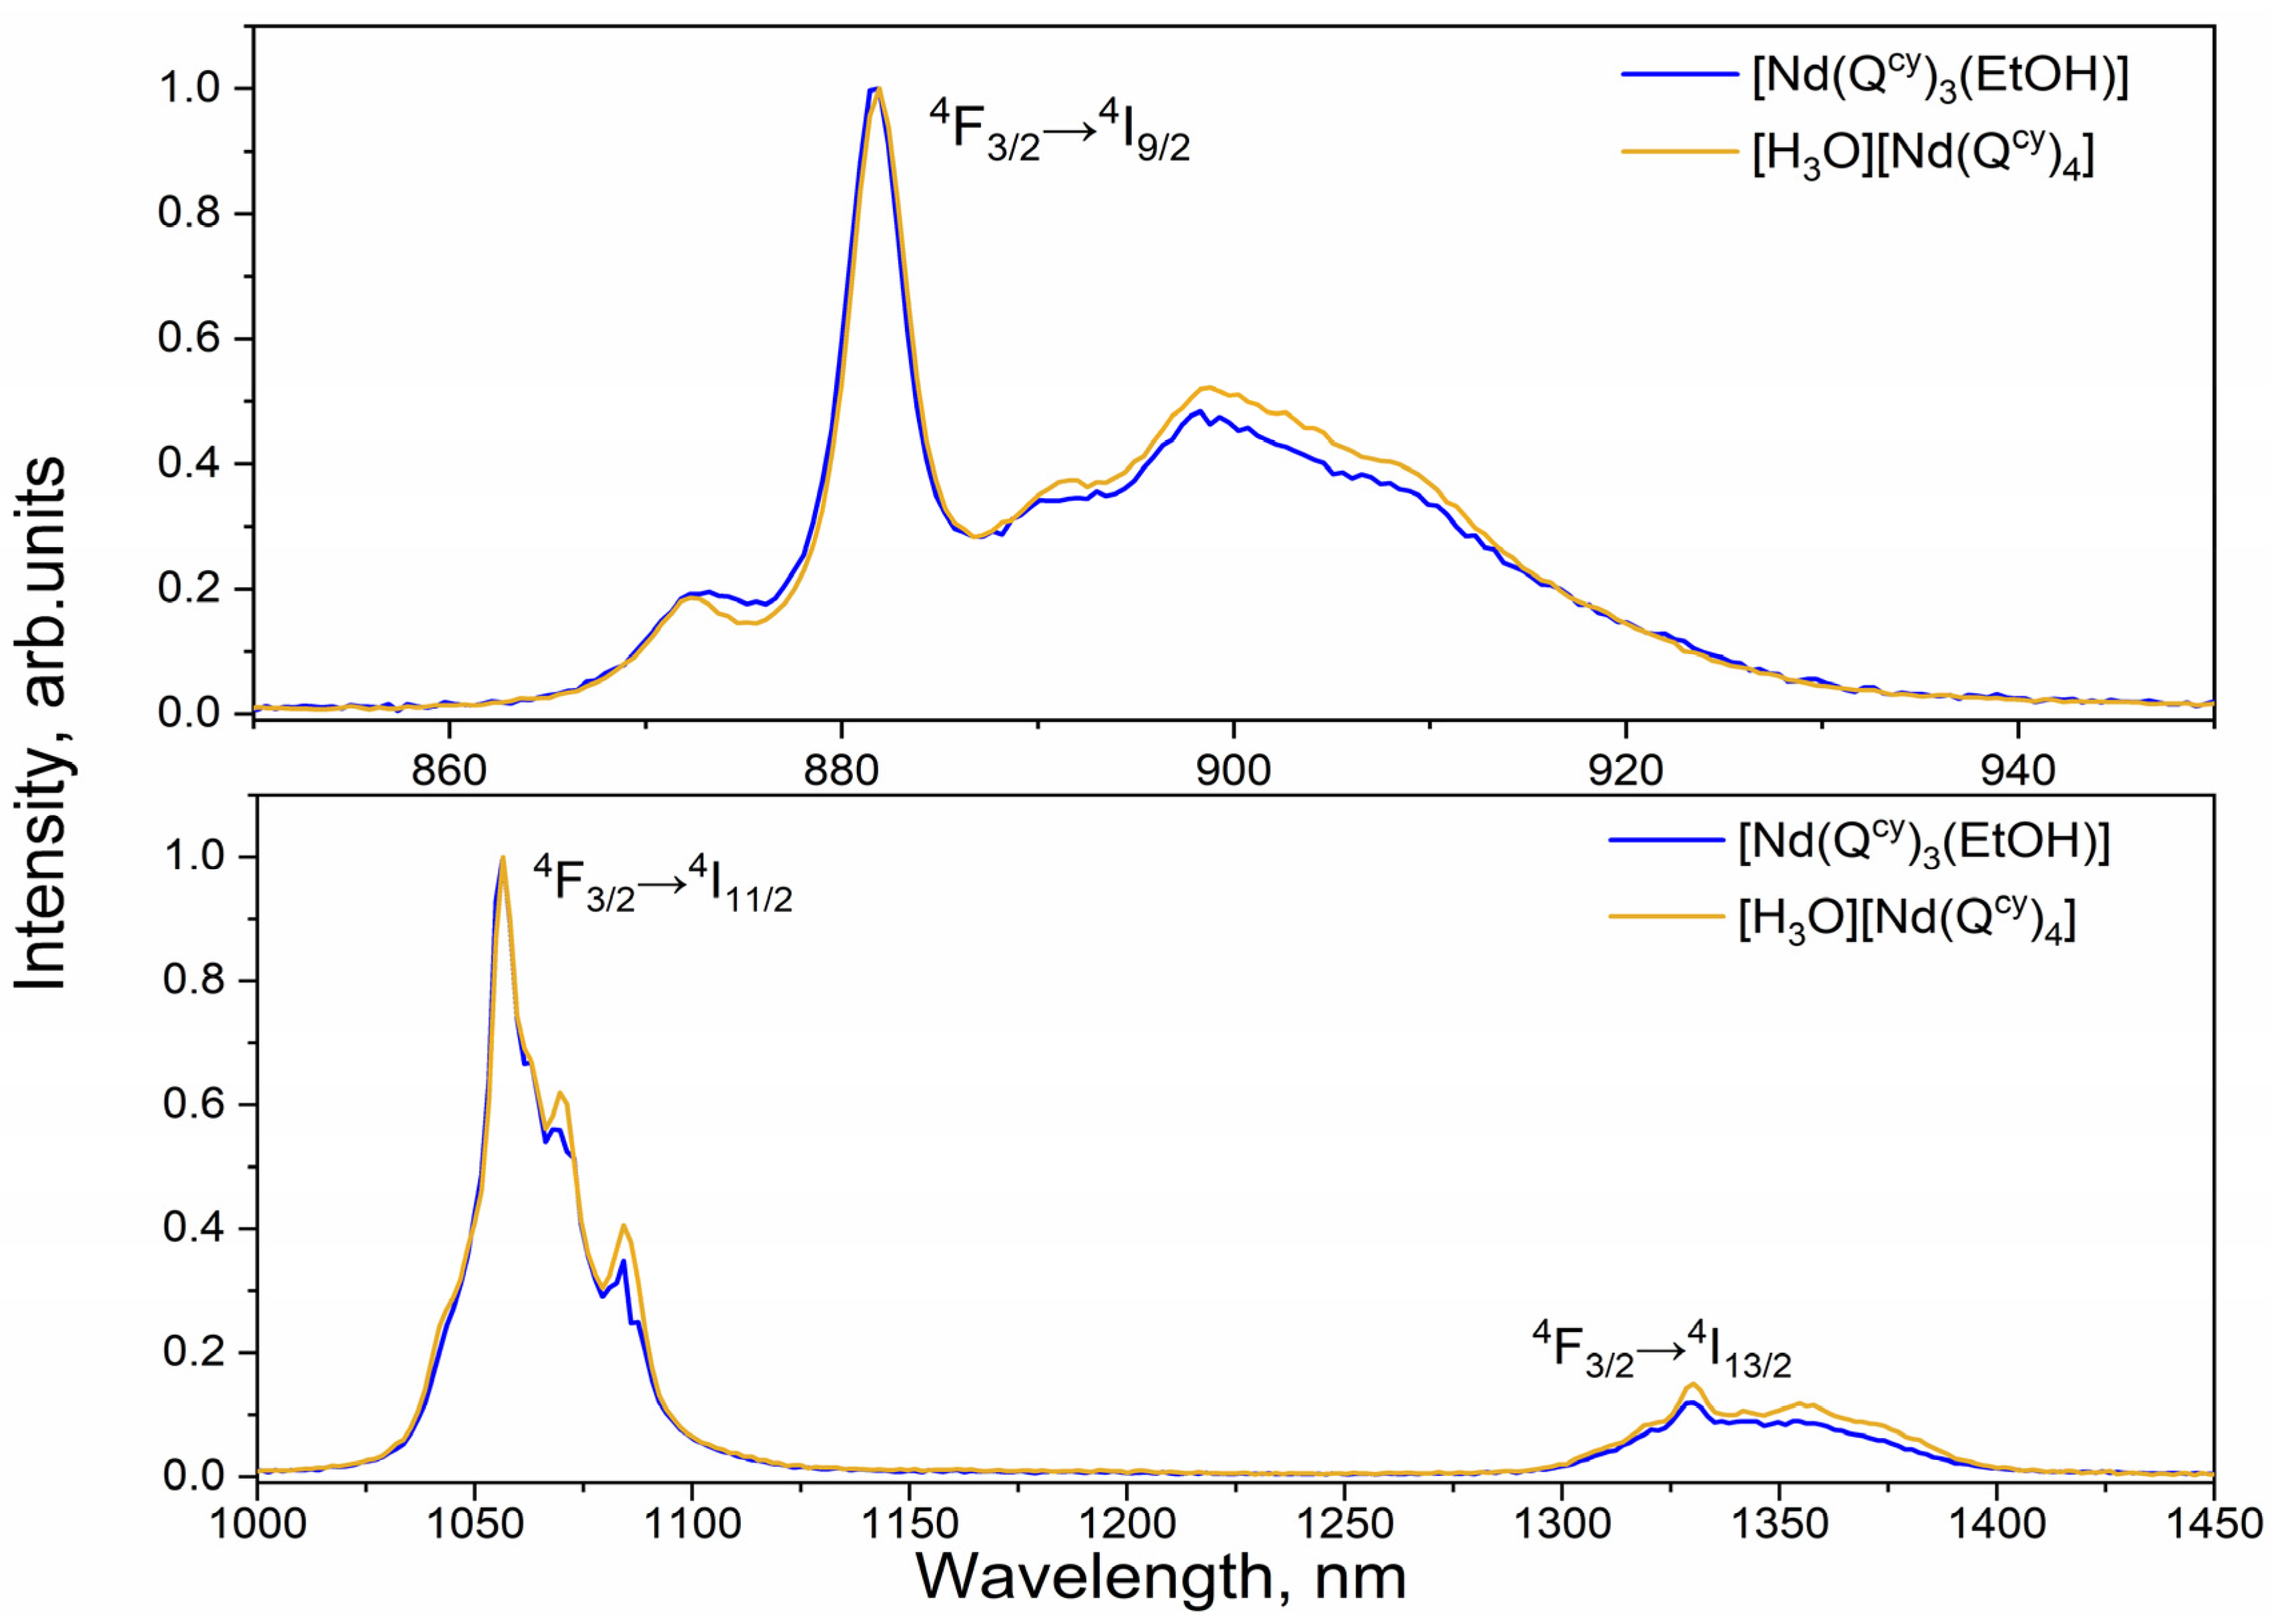
The photoluminescence spectra of [Nd(Qcy)3(H2O)(EtOH)]∙(EtOH) and [H3O][Nd(Qcy)4] complexes are shown in Figure 8. The typical spectral bands for Nd3+ ions are observed in the spectra:   F 3 / 2 4 I 9 / 2   4   880   n m ,   F 3 / 2 4 I 11 / 2   4   1056   n m   и   F 3 / 2 4 I 13 / 2   4   1330   n m . The emission bands related to F 3 / 2 4 I 9 / 2   4   880   n m , and F 3 / 2 4 I 11 / 2   4 electronic transitions are split by several Stark components centered at the same wavelengths for both the compounds. Therefore, there is no coordination polyhedron symmetry difference for these complexes.

2.4. Photoluminescence Excitation

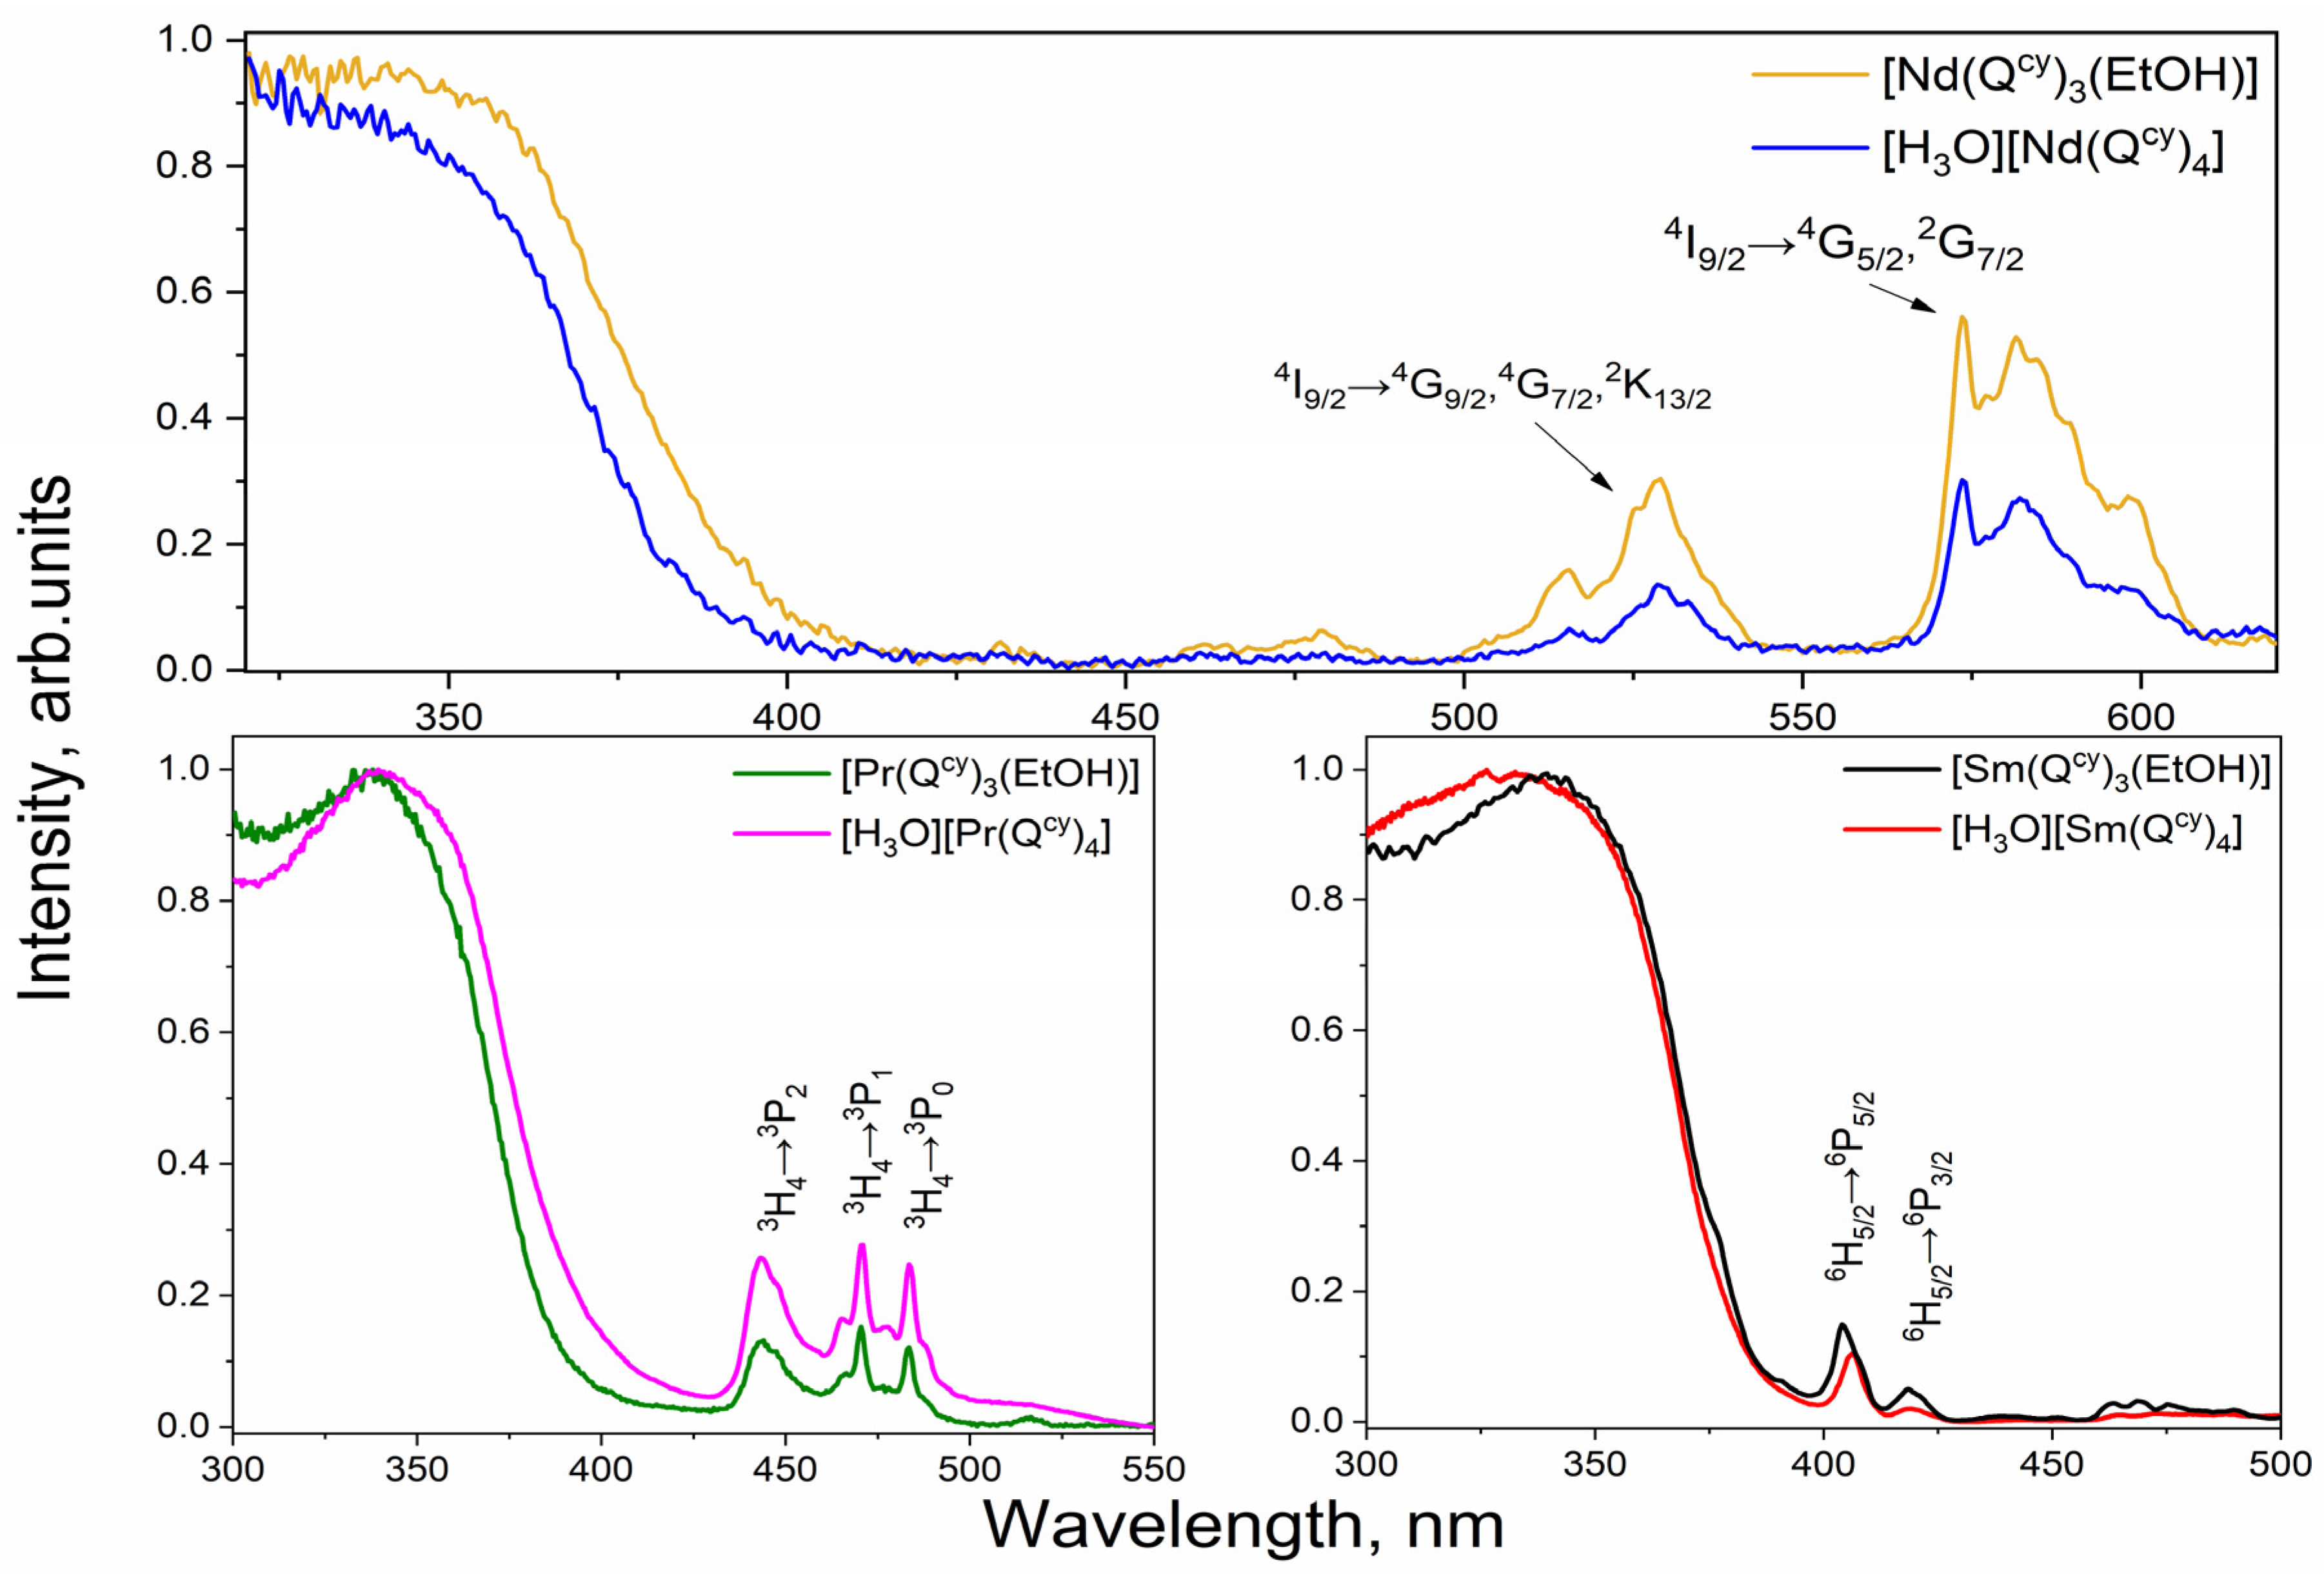
The photoluminescence excitation spectra were obtained for all the investigated complexes with the registration wavelength of 1064 nm for Nd3+ ion complexes, 650 nm for Sm3+ ion complexes and 605 nm for Pr3+ ion complexes. The excitation spectra for tris and tetrakis complexes qualitatively resemble each other pairwise (See Figure 9). The most intensive excitation for all the complexes can be achieved via the ligand excited states with the maximum located at 340 nm. However, we also observed narrow excitation bands corresponding to resonant excitation of the ions through f-f* electronic transitions. Notably, the [Nd(Qcy)3(H2O)(EtOH)]∙(EtOH) complex has more intensive bands related to excitation through the ion than [H3O][Nd(Qcy)4], while for Pr3+ ion complexes, tetrakis one has more intensive bands related to excitation through the ion.

2.5. Judd–Ofelt Analysis

All the complexes were successfully investigated in terms of the Judd–Ofelt theory [47,48] and their Ωt (t = 2, 4, 6) intensity parameters as well as the trad radiative lifetimes of the emission states of the ions are presented in Table 1, Table 2 and Table 3 and Tables S3–S5. The general procedure for Nd3+ and Sm3+ complexes was the same as in [2,20,49]. The calculations included in the transition bands are labeled in the absorption spectra of the complexes according to [44,50], see Figures S1–S3. The refractive index was set as 1.47 [51]. Notably, we carried out an analysis for praseodymium complexes via the standard JO theory with physically valid intensity parameters. The set of transitions used for the calculations was mostly chosen to minimize the root-mean-square deviation, see Tables S3–S5.
Radiative lifetimes have an increasing trend for the samarium and praseodymium tetraxis complexes. The strongest effect observed for the samarium complexes since trad for [H3O][Sm(Qcy)4] is 6 times higher than that for [Sm(Qcy)3(EtOH)]. Increasing of the radiative lifetime generally and mostly resulted from the stronger mixing of the 4f-states with the opposite parity states from configurations with higher energies [47]. Additionally, it is commonly considered that the parameter Ω2 is strongly enhanced by covalent bonding and depends on the degree of symmetry of the ligand environment. Relative to the analysis of the Stark splitting and X-ray analysis for these complexes (see one for the tris complex here [20]), we hardly observed any significant changes in symmetry or coordination number, but the maxima of the NIR-luminescent bands were slightly shifted for [Sm(Qcy)3(H2O)(EtOH)]∙(EtOH) indicating the so-called “nephelauxetic effect” [52]. This peculiarity is possibly related ton the five-times-greater value of Ω2 for the tris complex. Additionally, to the luminescent spectra of the complexes, evaluated branching ratio values for 4G5/2-6H9/2 transition are higher than 50% for both complexes, allowing us to consider them potentially suitable for lasing.
As for the praseodymium complexes, we conclude that the radiative lifetime trad increased by about twice for tetraxis for all discussed emission layers, viz. 3P0, 3P1 and 1D2. Since transitions from different emission layers are overlapped and strong ligand-centered luminescence occurs, we can hardly distinguish the experimental branching ratios; however, the calculated ones show a change, with branching ratios increasing for transitions of higher energies for the [H3O][Pr(Qcy)4] complex.
The analysis of the neodymium complexes reveals a 22% decrease in lifetime from 255 to 198 µs for tetraxis complexes, and no changes in Ω2 parameters. Thus, the symmetry state for both complexes is the same or very close. We suppose that this behavior results from changes in the delocalization of the outer d-orbitals of ions caused by the ligand field (this is the nephelauxetic effect).

2.6. Luminescent Decays and Quantum Yields

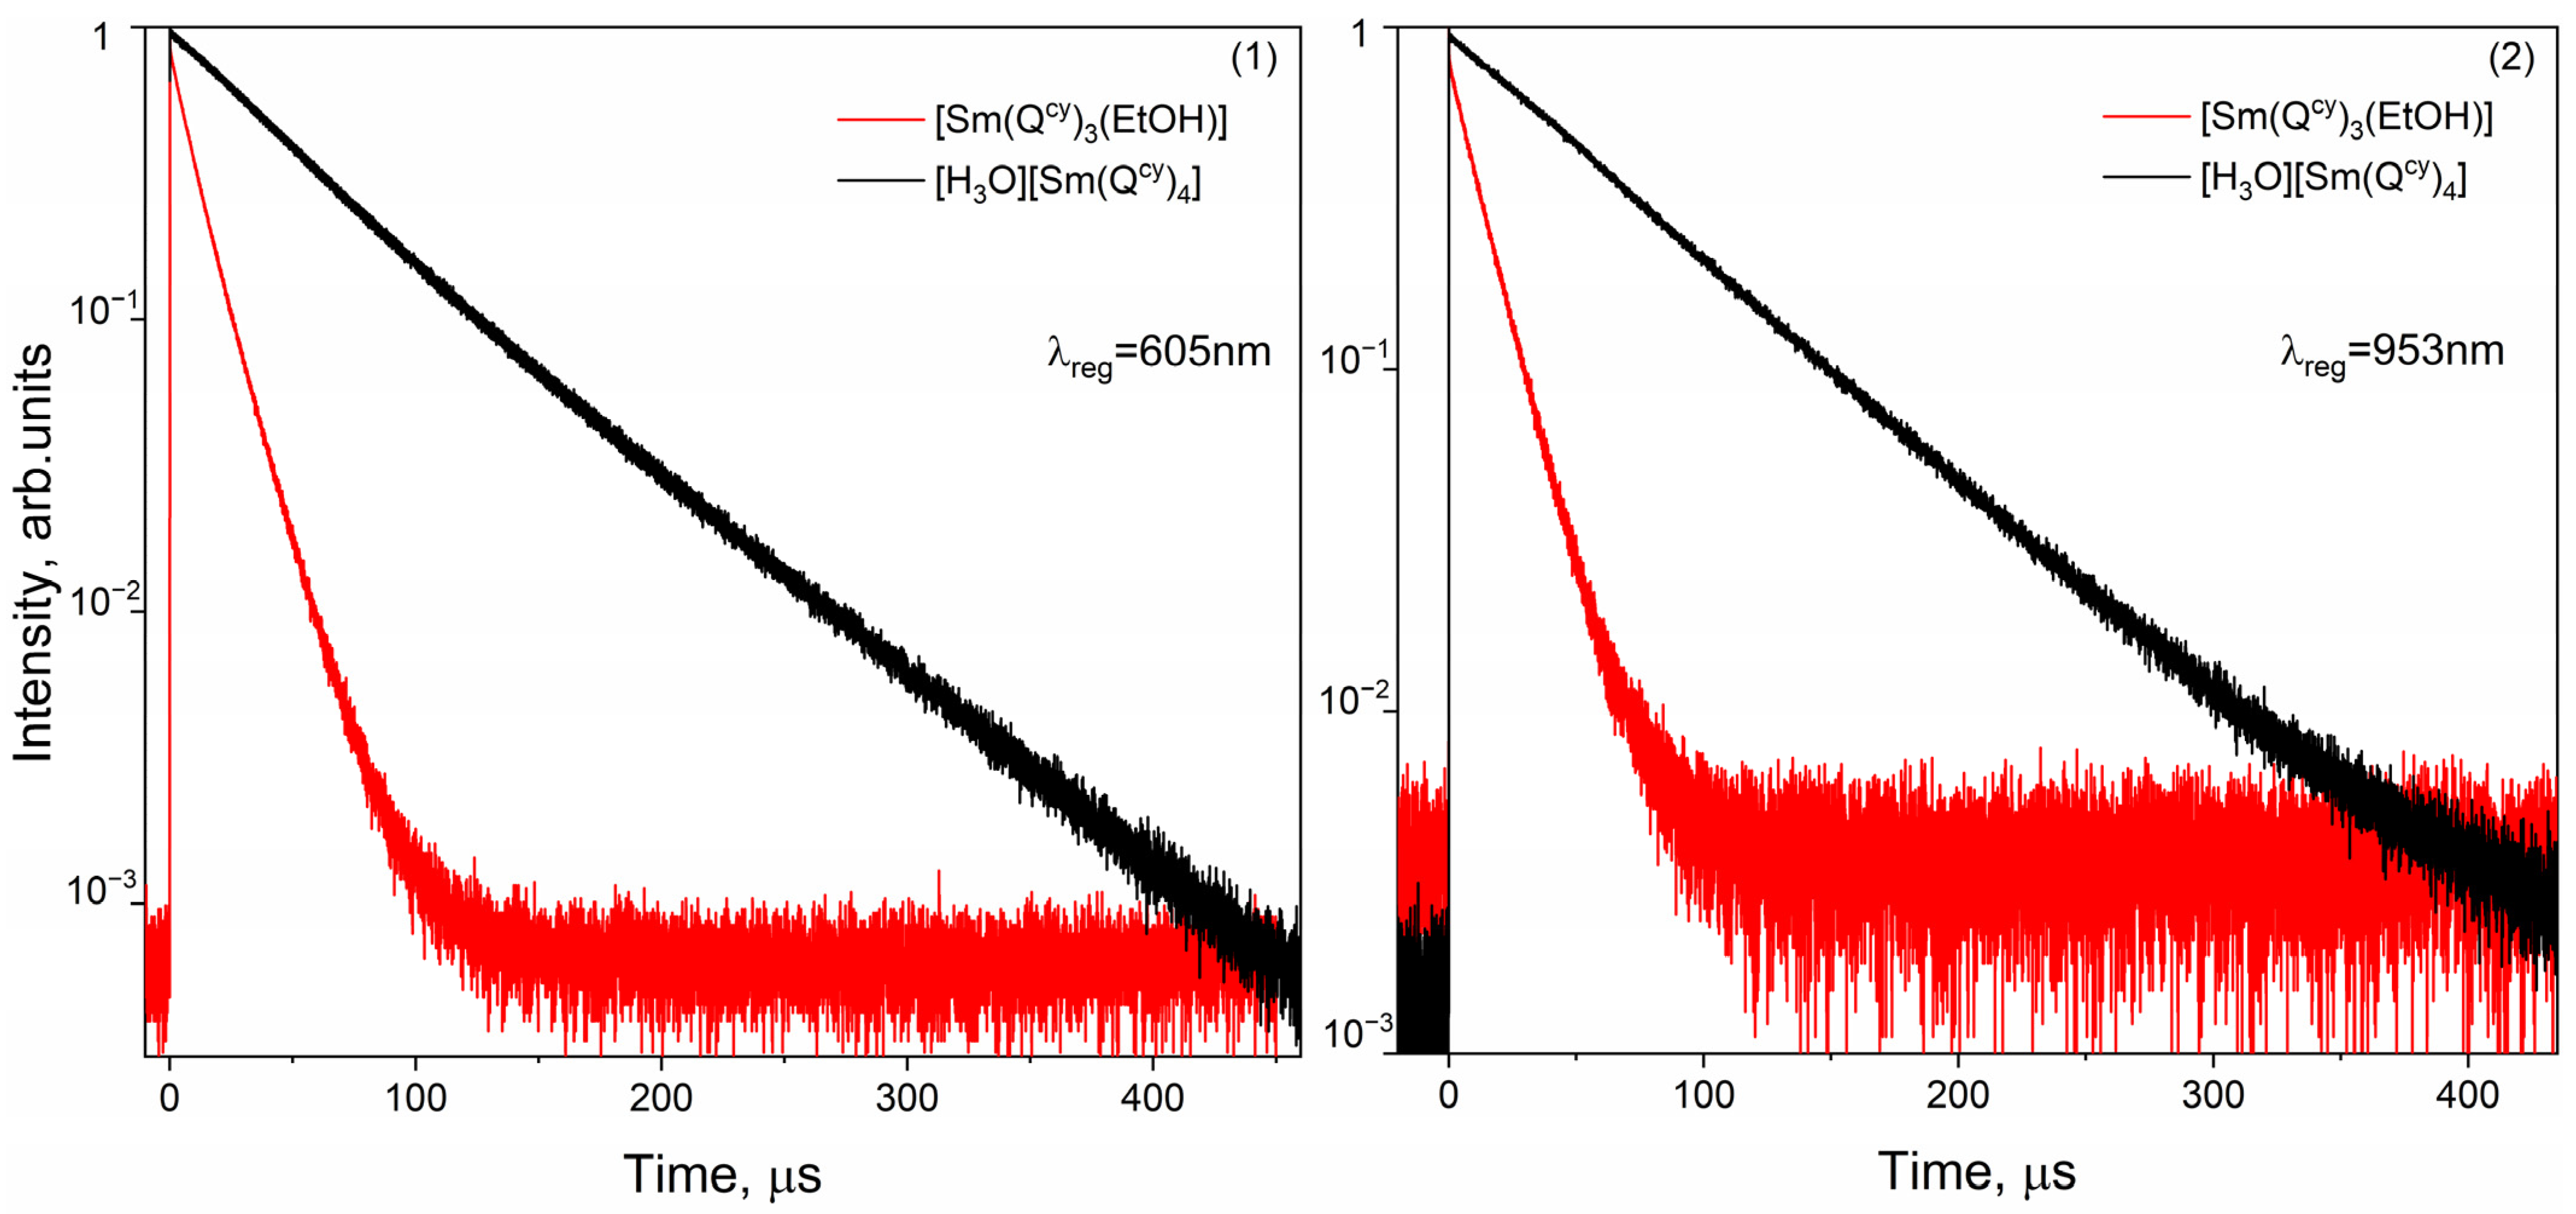
For a better understanding of electronic excitation and relaxation processes in the investigated compounds, luminescence decays were recorded. As seen in Figure 10, the tetrakis Sm3+ complex had a longer lifetime compared to the tris Sm3+ complex. In particular, characteristic lifetime measured at the registration wavelength of 650 nm for [H3O][Sm(Qcy)4] was 55 μs, which is four times greater than the lifetime of 13 μs recorded for [Sm(Qcy)3(H2O)(EtOH)]∙(EtOH). Similarly, an increase in the luminescence lifetime was observed in the NIR region with the registration at 953 nm ( G 5 / 2   4 F 5 / 2   6 ) from 14 to 66 μs for tris and tetrakis compounds. Both complexes show monoexponential behavior at visible and NIR regions, which evidences that there is only one emission center.
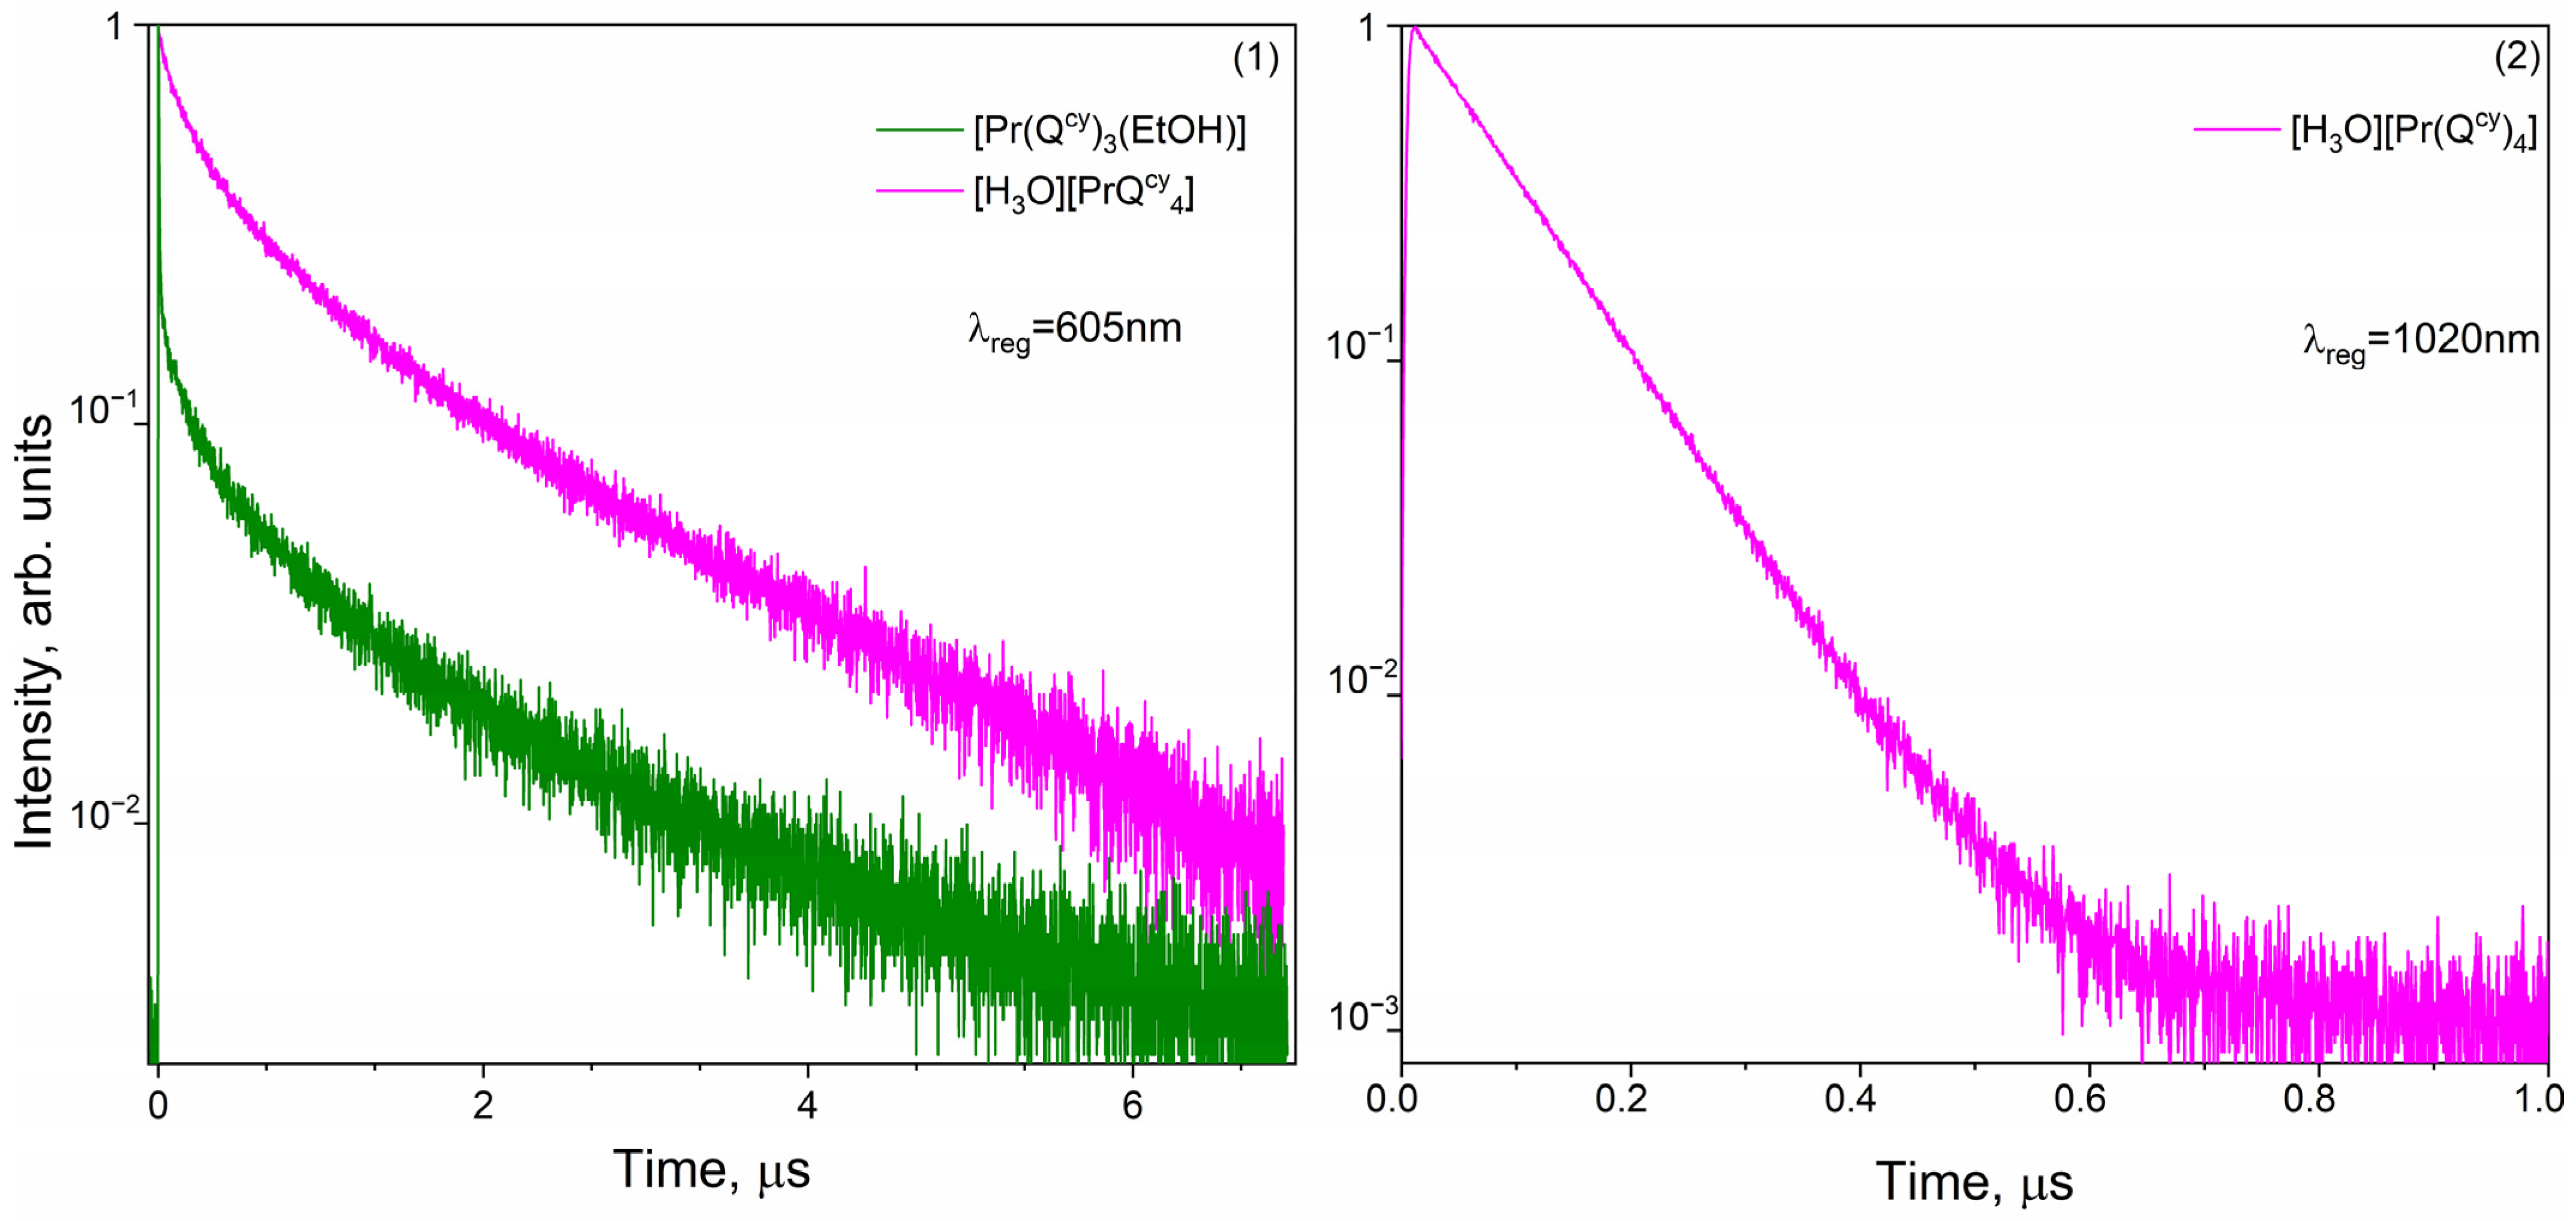
Luminescent decays for [Pr(Qcy)3(H2O)(EtOH)]∙(EtOH) and [H3O][Pr(Qcy)4] complexes are shown in Figure 11. Herein, the decays have a more complicated behavior than Sm3+ complexes and can be fitted by a multiexponential law:
I t h t = i = 1 n A i e t τ i ,
where τi and Ai are lifetimes and corresponding amplitudes, respectively. The measured luminescence decay is determined by
I e x p t = 0 I i r f t I t h t t d t ,
where I i r f t is the instrument response function (IRF), which can be described as a double-Gaussian function with the characteristic time τirf = 0.5 ns for the measurements in the NIR region of the spectrum and an exponential function with the characteristic time τirf =1 ns (see Figure S1 in Supplementary Material).
The Pr3+ ion complex decays obey a three-exponential law with characteristic lifetimes of several nanoseconds ( τ 1 ) , hundreds of nanoseconds ( τ 2 ) , and microseconds ( τ 3 ) (See Table 4). The longest lifetime τ 3 was 1278 ns for [Pr(Qcy)3(H2O)(EtOH)]∙(EtOH) and 1693 ns for [H3O][Pr(Qcy)4], and is related to ligand phosphorescence, which was observed in PL spectra (See Figure 11). We could not measure the NIR tetrakis complex decay due to the extremely low luminescence intensity.
Specifically, the lifetimes obtained for [Pr(Qcy)3(H2O)(EtOH)]∙(EtOH) with registration at the visible spectral region are several times higher than the lifetimes at the NIR spectral region. This phenomenon can be explained by the fact that the radiative transition D 2   1 F 4   3 (1020 nm) is more susceptible to non-radiative relaxation on the O-H vibrations of water molecules than the transition P 0   3 H 6   3 (606 nm) due to a small energy difference. Shorter lifetimes were observed for tris compounds ( 606   n m :   τ 1 = 5   n s ,   τ 2 = 382   n s ; 1020   n m : τ 1 = 5   n s ,   τ 2 = 58   n s ), compared to tetrakis compounds ( 606   n m :   τ 1 = 86   n s ,   τ 2 = 183   n s ; 1020   n m : τ 1 = 85   n s ). Notably, the [H3O][Pr(Qcy)4] complex had a monoexponential decay at the NIR spectral region, and the long-term decay component vanished, in contrast to [Pr(Qcy)3(H2O)(EtOH)]∙(EtOH) complex, which remained biexponential.
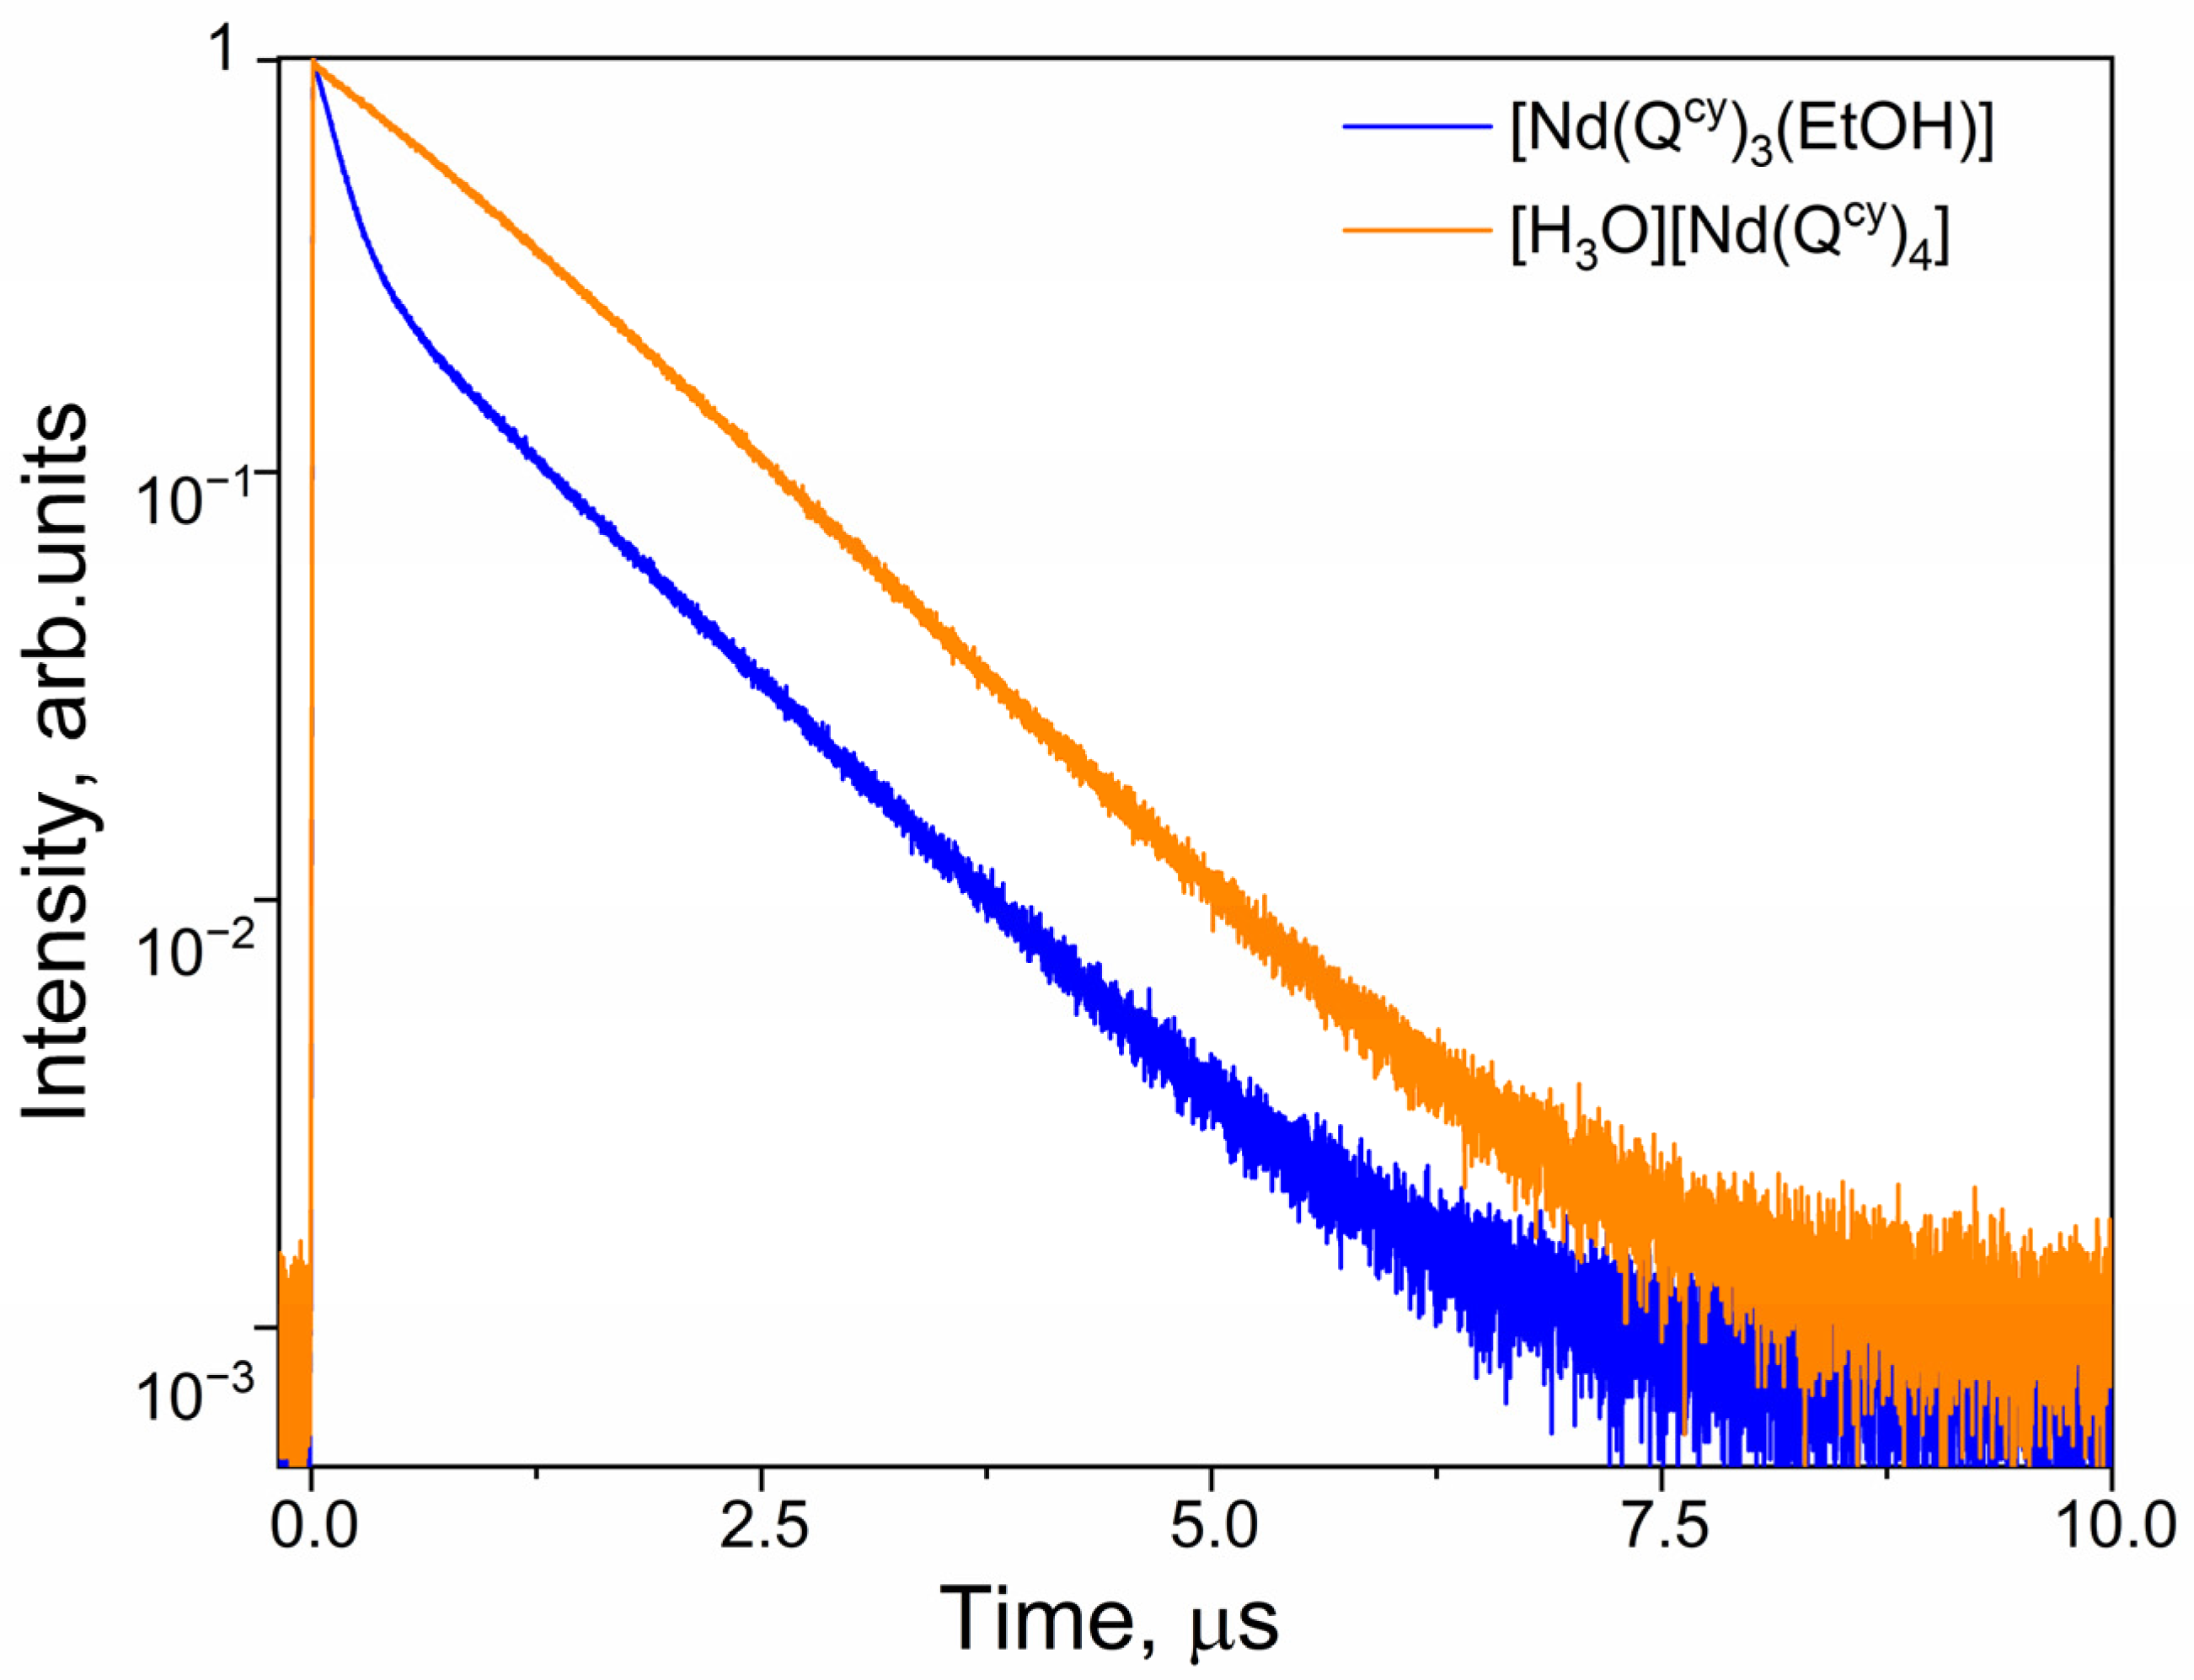
Photoluminescence decays for [Nd(Qcy)3(H2O)(EtOH)]∙(EtOH) and [H3O][Nd(Qcy)4] complexes, with the registration wavelength of 1056 nm, are shown in Figure 12. The tris complex has biexponentially fitted decay with characteristic lifetimes τ 1 = 146 ns and τ 2 = 1046 ns. The tetrakis complex has monoexponential behaviour, and its characteristic lifetime is τ = 1183 ns.
Photoluminescence quantum yield (Φ) values were measured for all the compounds under optical excitation at 365 nm. As seen from Table 4, Nd3+ ion-based complexes have similar values of Φ = 1.3%, and Pr3+ ion based complexes have Φ = 0.4%. However, the [Sm(Qcy)3(H2O)(EtOH)]∙(EtOH) complex has Φ = 0.5% in the NIR spectral area and Φ = 1.3% in the visible spectral area, while [H3O][Sm(Qcy)4] complex has Φ = 0.4% and Φ = 2.0% in the NIR and visible regions, respectively. Therefore, adding the fourth ligand molecule to a compound leads to a significant increase in Φ for visible emissions, while there is no effect in the NIR region.
The 4G5/26H9/2 transition of the Sm3+ ion, which is the most intensive emission band, is an electric dipole transition, while the 4G5/26H5/2 transition is a magnetic dipole transition. On that basis, ligand environment polarizability of Sm3+ ion tris and tetrakis complexes was estimated as the difference between the integrated magnetic dipole and electro dipole transitions. As we observed a bigger value for the tetrakis complex (10.3 for tetrakis against 7.8 for tris), we conclude that it is more polarized, which can explain the increase in the quantum yield in the visible region for the tetrakis complex in comparison with the tris one.

3. Materials and Methods

3.1. Experimental Setups

Single-crystal X-ray diffraction analysis of [Ln(Qcy)3(H2O)(EtOH)]∙(EtOH) (Ln = Sm, Pr, Nd) was carried out on a Bruker D8 Venture diffractometer (MoKα radiation, ω and φ-scan mode), and SCXRD analysis of (H3O)+[Ln(Qcy)4] (Ln = Sm, Pr, Nd) was carried out on a Bruker D8 Quest diffractometer (MoKα radiation, ω and φ-scan mode). The structures were solved with direct methods and refined using the least-squares method in the full-matrix anisotropic approximation on F2. All hydrogen atoms were located in calculated positions and refined within a riding model. All calculations were performed using the SHELXTL [53,54] and Olex2 [55] software packages. Atomic coordinates, bond lengths, angles, and thermal parameters have been deposited at the Cambridge Crystallographic Data Centre with deposition numbers—CCDC 2280580-2280585, which are available free of charge at www.ccdc.cam.ac.uk (accessed on 13 July 2023).
Elemental analysis was performed on an Elementar VarioEL Cube CHNO(S) analyzer (Ele-mentar Analysensysteme GmbH, Langenselbold, Germany). The lanthanide content was determined by complexometric titration with a standard Trilon B (disodium salt of ethylenediaminetetraacetic acid) solution in the presence of Xylenol Orange as an indicator. The sample was decomposed by heating with 70% HNO3 before titration [56].
Visible and NIR absorption spectra for all the complexes and free ligands were recorded on a JASCO V-770 (Jasco, Tokyo, Japan) spectrophotometer operating within 200–3200 nm. Concentrations of the solutions were approximately 10−5 M. For solutions, the measurements were performed using quartz cells with a 1 cm pathlength.
Visible photoluminescence spectra and excitation spectra for the complexes and the free ligand were obtained at room temperature using a Horiba Jobin-Yvon Fluorolog QM-75-22-C spectrofluorimeter with a 75 W xenon arc lamp (PowerArc, HORIBA, Kyoto, Japan). A Hamamatsu R13456 (Hamamatsu Photonics, Hamamatsu, Japan) cooled photomultiplier tube sensitive in the UV–Vis–NIR region (200–950 nm) was used as the detector. For the NIR spectral region measurements, the same setup was used, except for the detector, which was replaced by a Hamamatsu H10330 cooled photomultiplier tube sensitive in NIR region (950–1700 nm). Luminescence decays in the visible region and NIR region of the spectrum for the complexes were obtained in solid state using the same setup equipped with a Xe flash lamp as the excitation source.
Luminescence quantum yields in the visible region were obtained using an absolute method with by a home-made setup based on a MgO-covered integrating sphere with a diameter of 180 mm and FD-10G calibrated germanium photodiode detector; a CW emitting LED (365 nm) was used as an excitation source. Each sample was measured a few times under slightly different experimental conditions, and the results were averaged. The estimated error for the quantum yields was ±10%.
For all optical measurements, the corresponding instrument response functions were taken into account. The experiments were performed in air at atmospheric pressure. Degradation of the optical properties was not observed during the experiments.

3.2. Synthesis

Commercially available reagents and solvents were used for synthesis without further purification unless otherwise stated. The HQcy ligand was synthesized according to the previously described method [57]. Lanthanide chloride crystalline hydrates were obtained by dissolving the corresponding oxides (99.999%, LANHIT, Moscow, Russia) in extra pure hydrochloric acid.
The tetrakis complexes H3O[Ln(Qcy)4] were prepared according to the previously reported procedure [3,20]. For IR spectra see Figure S4. The powder XRD method was used to confirm that the powder phase composition corresponds to a single crystal (see Figure S5).
H3O[Pr(Qcy)4], 1. Green plates, 75%. Anal. Calc. for C68H79N8O9Pr: C, 63.15; H, 6.16; N, 8.65; Pr, 10.89%. Found: C, 62.1; H, 6.4; N, 8.6; Pr, 10.5. IR (cm−1): 3510 VW (ν O–HH3O+), 2927 M, 2851 W (ν C-HCyclohexyl), 1672 W (δ O–HH3O+), 1614 VS (ν C=ODiketone), 1594 S, 1581 M, 1497 VS (ν C–C), 1484 S, 1461 M, 1437 S, 1410 M, 1399 M, 1369 M, 1324 W, 1149 VW, 1124 VW, 1079 M, 1029 W, 1009 W, 999 W, 978 M, 921 W, 906 W, 809 W.
H3O[Nd(Qcy)4], 1. Pale violet plates, 74%. Anal. Calc. for C68H79N8NdO9: C, 62.99; H, 6.14; N, 8.64; Nd, 11.12%. Found: C, 63.1; H, 6.7; N, 8.5; Nd, 10.5. IR (cm−1): 3604 VW (ν O–HH3O+), 2926 S, 2851 S (ν C-HCyclohexyl), 1672 S (δ O–HH3O+), 1615 VS (ν C=ODiketone), 1594 S, 1581 S, 1498 VS (ν C–C), 1484 VS, 1461 S, 1437 VS, 1410 S, 1399 S, 1368 VS, 1324 S, 1234 M, 1149 M, 1079 S, 1029 M, 1009 M, 999 M, 978 S, 920 W, 904 M, 809 S, 691 S.
H3O[Sm(Qcy)4], 1. Pale yellow plates, 78%. Anal. Calc. for C68H79N8O9Sm: C, 62.69; H, 6.11; N, 8.60; Sm, 11.54%. Found: C, 62.0; H, 6.7; N, 8.5; Sm, 11.9. IR (cm−1): 3508 VW (ν O–HH3O+), 2927 M, 2852 M (ν C-HCyclohexyl), 1674 M (δ O–HH3O+), 1616 VS (ν C=ODiketone), 1594 S, 1582 S, 1498 VS (ν C–C), 1486 S, 1461 S, 1411 M, 1399 M, 1370 S, 1324 W, 1234 W, 1150 W, 1125 W, 1080 S, 1029 M, 1009 W, 999 W, 978 M, 921 W, 905 W, 904 W, 810 M.Tris complexes [Ln(Qcy)3(H2O)(EtOH)]∙(EtOH). were synthesized using a modified method [3]. For IR spectra see Figure S4. The powder XRD method was used to confirm that the powder phase composition corresponds to a single crystal (see Figure S6).
[Pr(Qcy)3(H2O)(EtOH)]∙(EtOH) Green needles, 66%. Anal. Calc. for C55H71N6O9Pr: C, 59.99; H, 6.50; N, 7.61; Pr, 12.80%. Found: C, 60.1; H, 6.5; N, 7.6; Pr, 12.8. IR (cm−1): 3590 VW (ν O–H H2O), 2929 M, 2852 W (ν C-HCyclohexyl), 1646 M (δ O–H H2O), 1614 VS (ν C=ODiketone), 1593 S, 1582 S, 1531 M, 1499 S (ν C–C), 1460 S, 1453 M, 1437 S, 1398 M, 1371 M, 1325 W, 1234 W, 1200 VW, 1176 VW, 1156 VW, 1142 VW, 1129 VW, 1079 M, 1027 W, 1010 W, 1000 W, 979 M, 905 VW, 756 M.
[Nd(Qcy)3(H2O)(EtOH)]∙(EtOH) Pale violet needles, 66%. Anal. Calc. for C55H71N6O9Nd: C, 59.81; H, 6.48; N, 7.61; Nd, 13.06%. Found: C, 60.2; H, 6.5; N, 7.6; Nd, 13.1. IR (cm−1): 3632 VW (ν O–H H2O), 2930 M, 2852 W (ν C-HCyclohexyl), 1645 M (δ O–H H2O), 1613 VS (ν C=ODiketone), 1594 S, 1582 S, 1532 M, 1499 S (ν C–C), 1461 S, 1453 M, 1438 S, 1399 M, 1374 M, 1325 W, 1235 W, 1201 VW, 1176 VW, 1157 VW, 1142 VW, 1129 VW, 1079 M, 1028 W, 1010 W, 1000 W, 979 M, 756 M.
[Sm(Qcy)3(H2O)(EtOH)]∙(EtOH) Pale yellow needles, 62%. Anal. Calc. for C55H71N6O9Sm: C, 59.48; H, 6.44; N, 7.57; Sm, 13.54%. Found: C, 59.7; H, 6.5; N, 7.6; Sm, 13.7. IR (cm−1): 3627 VW (ν O–HH3O+), 2930 M, 2852 W (ν C-HCyclohexyl), 1672 VW (δ O–HH3O+), 1614 VS (ν C=ODiketone), 1594 S, 1582 M, 1532 M, 1501 VS (ν C–C), 1487 S, 1461 M, 1451 S, 1437 S, 1398 M, 1373 M, 1324 W, 1234 W, 1176 W, 1157 W, 1129 W, 1079 M, 1027 W, 1010 W, 1000 W, 979 M, 921 W, 755 W.

4. Conclusions

Tris and tetrakis coordination compounds of Sm3+, Nd3+ and Pr3+ ions were investigated pairwise in the present work. We found that adding an additional ligand molecule significantly increases the molar extinction by up to two times. In addition, it slightly changes the shapes of the Pr3+ and Sm3+ complexes’ PL spectra in the visible region and strongly affects the shape of the Pr3+ ion tetrakis complex PL spectrum in the NIR region. However, the polyhedron symmetry does not alter as a result of adding a fourth ligand molecule, except for Sm3+ complexes, where we observe lower symmetry for the tetrakis complex than for the tris complex. We also report a significant difference in luminescence lifetime for tris and tetrakis complexes of Sm3+ and Nd3 ions. Notably, Sm3+ tris and tetrakis complexes have similar luminescence decay behavior in the visible and NIR regions pairwise. Conversely, the short-time component disappears for the tetrakis Pr3+ complex in the NIR region.
While Nd3+ and Pr3+ ions complexes have the same quantum yield values of 1.3% and 0.4% (in visible region), respectively, we observed a huge increase in quantum yield for the Sm3+ tetrakis complex in the visible region in comparison with the tris complex (from 1.3% to 2.0%), although their quantum yield values in NIR region are practically equal (0.4–0.5%). We consider that the luminescence quantum yield increase in the Sm3+ ion complexes is related not only to the substitution of water molecules by a ligand molecule, but also to the polyhedron symmetry change.
The findings of this study may have significant implications in optoelectronics, telecommunication, and bioimaging, where the utilization of luminescence in the NIR region of the spectrum can lead to advancements in sensing, imaging, and other cutting-edge technologies.

Supplementary Materials

The following supporting information can be downloaded at https://www.mdpi.com/article/10.3390/molecules28155892/s1, Figure S1: Absorption spectra for praseodymium complexes in DMSO solvent with concentration of 3 × 10⁻³ M.; Figure S2: Absorption spectra for neodymium complexes in DMSO solvent with concentration of 3 × 10⁻³ M.; Figure S3: Absorption spectra for samarium complexes in DMSO solvent with concentration of 3 × 10⁻³ M.; Figure S4: IR transmittance spectra of complexes (KBr pellets, 298K).; Figure S5: PXRD patterns of tetrakis-complexes of Pr, Nd and Sm and simulated from single crystal data of Sm complex. Figure S6: PXRD patterns of tris-complexes of Pr, Nd and Sm and simulated from single crystal data of Pr complex. Table S1: Crystal data and refinement parameters for [Sc(Qcy)3(DMSO)], [La(Qcy)3(H2O)(EtOH)]∙(EtOH), [Gd(Qcy)3(H2O)] and [Lu(Qcy)3(DMSO)]; Table S2: C–O and C–C bond lengths of the diketone fragment in (H3O)+[Sm(Qcy)4]; Table S3: Experimental fexp and calculated fcalc oscillator strengths, Judd–Ofelt parameters Ωt (t = 2, 4, 6), and root-mean-squared deviation RMS for praseodymium complexes; Table S4: Experimental fexp and calculated fcalc oscillator strengths, Judd–Ofelt parameters Ωt (t = 2, 4, 6), and root-mean-squared deviation RMS for neodymium complexes; Table S5: Experimental fexp and calculated fcalc oscillator strengths, Judd–Ofelt parameters Ωt (t = 2, 4, 6), and root-mean-squared deviation RMS for samarium complexes.

Author Contributions

T.P.: writing—original draft preparation, investigation; V.K.: writing—original draft preparation, investigation, formal analysis; M.M.: investigation; V.G.: investigation; D.M.: investigation; N.D.: investigation; M.K.: investigation; Y.B.: writing—review and editing; A.T.: investigation; I.T.: resources, conceptualization. All authors have read and agreed to the published version of the manuscript.

Funding

The work was supported by the Russian Science Foundation under project #23-23-00393.

Informed Consent Statement

Not applicable.

Data Availability Statement

Data available upon request.

Acknowledgments

The X-ray study was supported by the Lomonosov Moscow State University Program of Development.

Conflicts of Interest

The authors declare no conflict of interest.

Sample Availability

Not Applicable.

References

  1. Metlin, M.T.; Goryachii, D.O.; Aminev, D.F.; Datskevich, N.P.; Korshunov, V.M.; Metlina, D.A.; Pavlov, A.A.; Mikhalchenko, L.V.; Kiskin, M.A.; Garaeva, V.V.; et al. Bright Yb3+ Complexes for Efficient Pure Near-Infrared OLEDs. Dye. Pigment. 2021, 195, 109701. [Google Scholar] [CrossRef]
  2. Sizov, V.S.; Komissar, D.A.; Metlina, D.A.; Aminev, D.F.; Ambrozevich, S.A.; Nefedov, S.E.; Varaksina, E.A.; Metlin, M.T.; Mislavskií, V.V.; Taydakov, I.V. Effect of Ancillary Ligands on Visible and NIR Luminescence of Sm3+ β-Diketonate Complexes. Spectrochim. Acta Part A Mol. Biomol. Spectrosc. 2020, 225, 117503. [Google Scholar] [CrossRef] [PubMed]
  3. Belousov, Y.A.; Korshunov, V.M.; Metlin, M.T.; Metlina, D.A.; Kiskin, M.A.; Aminev, D.F.; Datskevich, N.P.; Drozdov, A.A.; Pettinari, C.; Marchetti, F.; et al. Towards Bright Dysprosium Emitters: Single and Combined Effects of Environmental Symmetry, Deuteration, and Gadolinium Dilution. Dye. Pigment. 2022, 199, 110078. [Google Scholar] [CrossRef]
  4. Metlin, M.T.; Ambrozevich, S.A.; Metlina, D.A.; Vitukhnovsky, A.G.; Taydakov, I.V. Luminescence of Pyrazolic 1,3-Diketone Pr3+ Complex with 1,10-Phenanthroline. J. Lumin. 2017, 188, 365–370. [Google Scholar] [CrossRef]
  5. Lustig, W.P.; Li, J. Luminescent Metal–Organic Frameworks and Coordination Polymers as Alternative Phosphors for Energy Efficient Lighting Devices. Coord. Chem. Rev. 2018, 373, 116–147. [Google Scholar] [CrossRef]
  6. Cariati, E.; Lucenti, E.; Botta, C.; Giovanella, U.; Marinotto, D.; Righetto, S. Cu(I) Hybrid Inorganic–Organic Materials with Intriguing Stimuli Responsive and Optoelectronic Properties. Coord. Chem. Rev. 2016, 306, 566–614. [Google Scholar] [CrossRef]
  7. Xu, H.; Sun, Q.; An, Z.; Wei, Y.; Liu, X. Electroluminescence from Europium(III) Complexes. Coord. Chem. Rev. 2015, 293–294, 228–249. [Google Scholar] [CrossRef]
  8. Dalal, A.; Nehra, K.; Hooda, A.; Singh, D.; Kumar, P.; Kumar, S.; Malik, R.S.; Rathi, B. Luminous Lanthanide Diketonates: Review on Synthesis and Optoelectronic Characterizations. Inorg. Chim. Acta 2023, 550, 121406. [Google Scholar] [CrossRef]
  9. Bünzli, J.-C.G. Lanthanide Luminescence for Biomedical Analyses and Imaging. Chem. Rev. 2010, 110, 2729–2755. [Google Scholar] [CrossRef]
  10. Bünzli, J.-C.G.; Eliseeva, S.V. Lanthanide NIR Luminescence for Telecommunications, Bioanalyses and Solar Energy Conversion. J. Rare Earths 2010, 28, 824–842. [Google Scholar] [CrossRef]
  11. Eliseeva, S.V.; Bünzli, J.-C.G. Lanthanide Luminescence for Functional Materials and Bio-Sciences. Chem. Soc. Rev. 2010, 39, 189–227. [Google Scholar] [CrossRef]
  12. Mason, S.F. Mechanisms for F-f Transition Probabilities in Lanthanide Coordination Compounds. Inorg. Chim. Acta 1984, 94, 88. [Google Scholar] [CrossRef]
  13. Weissman, S.I. Intramolecular Energy Transfer The Fluorescence of Complexes of Europium. J. Chem. Phys. 1942, 10, 214–217. [Google Scholar] [CrossRef]
  14. Kettle, S.F.A. Physical Inorganic Chemistry; Springer Berlin Heidelberg: Berlin, Heidelberg, 1996; ISBN 978-0-7167-4514-3. [Google Scholar]
  15. Girotto, E.; Pereira, A.; Arantes, C.; Cremona, M.; Bortoluzzi, A.J.; Salla, C.A.M.; Bechtold, I.H.; Gallardo, H. Efficient Terbium Complex Based on a Novel Pyrazolone Derivative Ligand Used in Solution-Processed OLEDs. J. Lumin. 2019, 208, 57–62. [Google Scholar] [CrossRef]
  16. Chen, Z.; Ding, F.; Hao, F.; Bian, Z.; Ding, B.; Zhu, Y.; Chen, F.; Huang, C. A Highly Efficient OLED Based on Terbium Complexes. Org. Electron. 2009, 10, 939–947. [Google Scholar] [CrossRef]
  17. Thorne, J.R.G.; Rey, J.M.; Denning, R.G.; Watkins, S.E.; Etchells, M.; Green, M.; Christou, V. Excited State Dynamics of Organo-Lanthanide Electroluminescent Phosphors: The Properties of Tb(Tb-Pmp) 3 and Gd(Tb-Pmp) 3. J. Phys. Chem. A 2002, 106, 4014–4021. [Google Scholar] [CrossRef]
  18. Li, Z.-F.; Zhou, L.; Yu, J.-B.; Zhang, H.-J.; Deng, R.-P.; Peng, Z.-P.; Guo, Z.-Y. Synthesis, Structure, Photoluminescence, and Electroluminescence Properties of a New Dysprosium Complex. J. Phys. Chem. C 2007, 111, 2295–2300. [Google Scholar] [CrossRef]
  19. Li, X.-L.; Li, J.; Zhu, C.; Han, B.; Liu, Y.; Yin, Z.; Li, F.; Liu, C.-M. An Intense Luminescent Dy(iii) Single-Ion Magnet with the Acylpyrazolonate Ligand Showing Two Slow Magnetic Relaxation Processes. New J. Chem. 2018, 42, 16992–16998. [Google Scholar] [CrossRef]
  20. Belousov, Y.A.; Metlin, M.T.; Metlina, D.A.; Kiskin, M.A.; Yakushev, I.A.; Polikovskiy, T.A.; Taydakov, I.V.; Drozdov, A.A.; Marchetti, F.; Pettinari, C. Self-Assembly of a Two-Dimensional Coordination Polymer Based on Silver and Lanthanide Tetrakis-Acylpyrazolonates: An Efficient New Strategy for Suppressing Ligand-to-Metal Charge Transfer Quenching of Europium Luminescence. Polymers 2023, 15, 867. [Google Scholar] [CrossRef]
  21. Taydakov, I.V.; Belousov, Y.A.; Lyssenko, K.A.; Varaksina, E.; Drozdov, A.A.; Marchetti, F.; Pettinari, R.; Pettinari, C. Synthesis, Phosphorescence and Luminescence Properties of Novel Europium and Gadolinium Tris-Acylpyrazolonate Complexes. Inorg. Chim. Acta 2020, 502, 119279. [Google Scholar] [CrossRef]
  22. Korshunov, V.M.; Tsorieva, A.V.; Gontcharenko, V.E.; Zanizdra, S.R.; Metlin, M.T.; Polikovskiy, T.A.; Taydakov, I.V. Photophysical Properties of Eu3+ β-Diketonates with Extended π-Conjugation in the Aromatic Moiety. Inorganics 2022, 11, 15. [Google Scholar] [CrossRef]
  23. Varaksina, E.A.; Kiskin, M.A.; Lyssenko, K.A.; Puntus, L.N.; Korshunov, V.M.; Silva, G.S.; Freire, R.O.; Taydakov, I.V. Tuning the Luminescence Efficiency by Perfluorination of Side Chains in Eu3+ Complexes with β-Diketones of the Thiophene Series. Phys. Chem. Chem. Phys. 2021, 23, 25748–25760. [Google Scholar] [CrossRef]
  24. Li, J.; Zhang, L.; Liu, L.; Liu, G.; Jia, D.; Xu, G. A Series of Pyrazolone Lanthanide (III) Complexes: Synthesis, Crystal Structures and Fluorescence. Inorg. Chim. Acta 2007, 360, 1995–2001. [Google Scholar] [CrossRef]
  25. Pettinari, C.; Marchetti, F.; Pettinari, R.; Drozdov, A.; Troyanov, S.; Voloshin, A.I.; Shavaleev, N.M. Synthesis, Structure and Luminescence Properties of New Rare Earth Metal Complexes with 1-Phenyl-3-Methyl-4-Acylpyrazol-5-Ones. J. Chem. Soc. Dalton Trans. 2002, 1409. [Google Scholar] [CrossRef]
  26. Korshunov, V.M.; Metlin, M.T.; Ambrozevich, S.A.; Golovanov, I.S.; Gontcharenko, V.E.; Selyukov, A.S.; Taydakov, I.V. Impact of Ligand-Centered Excited States on Luminescence Sensitization in Pr 3 + Complexes with β -Diketones. Spectrochim. Acta Part A Mol. Biomol. Spectrosc. 2021, 260, 119863. [Google Scholar] [CrossRef] [PubMed]
  27. Liu, J.; Shi, Q.; He, Y.; Fu, G.; Li, W.; Miao, T.; Lü, X. Single-Molecule White-Light of Tris-Pyrazolonate-Dy3+ Complexes. Inorg. Chem. Commun. 2019, 109, 107573. [Google Scholar] [CrossRef]
  28. Xin, H.; Shi, M.; Zhang, X.M.; Li, F.Y.; Bian, Z.Q.; Ibrahim, K.; Liu, F.Q.; Huang, C.H. Carrier-Transport, Photoluminescence, and Electroluminescence Properties Comparison of a Series of Terbium Complexes with Different Structures. Chem. Mater. 2003, 15, 3728–3733. [Google Scholar] [CrossRef]
  29. Zhang, D.; Shi, M.; Liu, Z.; Li, F.; Yi, T.; Huang, C. Luminescence Modulation of a Terbium Complex with Anions and Its Application as a Reagent. Eur. J. Inorg. Chem. 2006, 2006, 2277–2284. [Google Scholar] [CrossRef]
  30. Polikovskiy, T.; Korshunov, V.; Gontcharenko, V.; Kiskin, M.; Belousov, Y.; Pettinari, C.; Taydakov, I. Dynamics of the Ligand Excited States Relaxation in Novel β-Diketonates of Non-Luminescent Trivalent Metal Ions. IJMS 2023, 24, 8131. [Google Scholar] [CrossRef]
  31. Shen, L.; Shi, M.; Li, F.; Zhang, D.; Li, X.; Shi, E.; Yi, T.; Du, Y.; Huang, C. Polyaryl Ether Dendrimer with a 4-Phenylacetyl-5-Pyrazolone-Based Terbium(III) Complex as Core: Synthesis and Photopysical Properties. Inorg. Chem. 2006, 45, 6188–6197. [Google Scholar] [CrossRef]
  32. Safronova, A.V.; Bochkarev, L.N.; Baranov, E.V. Synthesis of Lanthanide Pyrazolonate Complexes by the Reactions of 1-Phenyl-3-Methyl-4-(2,2-Dimethylpropan-1-Oyl)Pyrazol-5-One with Metallic Lanthanides. Crystal Structures of [Ln(Bu t -PMP)3]2 (Ln = Gd, Tb, and Tm). Russ J Coord Chem 2013, 39, 537–543. [Google Scholar] [CrossRef]
  33. Safronova, A.V.; Bochkarev, L.N.; Malysheva, I.P.; Baranov, E.V. Facile Synthesis of Rare-Earth Pyrazolonates by the Reaction of Rare-Earth Metals with 1-Phenyl-3-Methyl-4-Isobutyryl-5-Pyrazolone. Crystal Structures of [Ln(PMIP)3]2 (Ln=Y, Gd, Tb, Er, Tm). Inorg. Chim. Acta 2012, 392, 454–458. [Google Scholar] [CrossRef]
  34. Pettinari, C.; Marchetti, F.; Pettinari, R.; Drozdov, A.; Semenov, S.; Troyanov, S.I.; Zolin, V. A New Rare-Earth Metal Acylpyrazolonate Containing the Zundel Ion Stabilized by Strong Hydrogen Bonding. Inorg. Chem. Commun. 2006, 9, 634–637. [Google Scholar] [CrossRef]
  35. Pettinari, C.; Marchetti, F.; Pettinari, R.; Natanti, P.; Drozdov, A.; Semenov, S.; Troyanov, S.I.; Zolin, V. Syntheses, Spectroscopic Characterization and X-Ray Structural Studies of Lanthanide Complexes with Adamantyl Substituted 4-Acylpyrazol-5-One. Inorg. Chim. Acta 2006, 359, 4063–4070. [Google Scholar] [CrossRef]
  36. Pettinari, C.; Marchetti, F.; Cingolani, A.; Drozdov, A.; Timokhin, I.; Troyanov, S.I.; Tsaryuk, V.; Zolin, V. Syntheses, Structural and Spectroscopic Investigation (IR, NMR and Luminescence) of New Terbium and Europium Acylpyrazolonates. Inorg. Chim. Acta 2004, 357, 4181–4190. [Google Scholar] [CrossRef]
  37. Belousov, Y.A.; Drozdov, A.A. Lanthanide Acylpyrazolonates: Synthesis, Properties and Structural Features. Russ. Chem. Rev. 2012, 81, 1159–1169. [Google Scholar] [CrossRef]
  38. Bai, H.-Y.; Ma, J.-F.; Yang, J.; Liu, Y.-Y.; Ma, J.-C. Effect of Anions on the Self-Assembly of Cd(II)-Containing Coordination Polymers Based on a Novel Flexible Tetrakis (Imidazole) Ligand. Cryst. Growth Des. 2010, 10, 995–1016. [Google Scholar] [CrossRef]
  39. Mara, D.; Artizzu, F.; Laforce, B.; Vincze, L.; Van Hecke, K.; Van Deun, R.; Kaczmarek, A.M. Novel Tetrakis Lanthanide β-Diketonate Complexes: Structural Study, Luminescence Properties and Temperature Sensing. J. Lumin. 2019, 213, 343–355. [Google Scholar] [CrossRef]
  40. Arppe, R.; Hyppänen, I.; Perälä, N.; Peltomaa, R.; Kaiser, M.; Würth, C.; Christ, S.; Resch-Genger, U.; Schäferling, M.; Soukka, T. Quenching of the Upconversion Luminescence of NaYF 4: Yb3+, Er3+ and NaYF4: Yb3+,Tm3+ Nanophosphors by Water: The Role of the Sensitizer Yb3+ in Non-Radiative Relaxation. Nanoscale 2015, 7, 11746–11757. [Google Scholar] [CrossRef] [Green Version]
  41. Wang, Y.; Darapaneni, P.; Kizilkaya, O.; Dorman, J.A. Role of Ce in Manipulating the Photoluminescence of Tb Doped Y2Zr2O7. Inorg. Chem. 2020, 59, 2358–2366. [Google Scholar] [CrossRef]
  42. Wang, Y.; Darapaneni, P.; Ofoegbuna, T.; Gupta, S.K.; Kizilkaya, O.; Mao, Y.; Dorman, J.A. Effect of Oxide Ion Distribution on a Uranium Structure in Highly U-Doped RE 2 Hf 2 O 7 (RE = La and Gd) Nanoparticles. Inorg. Chem. 2020, 59, 14070–14077. [Google Scholar] [CrossRef]
  43. R Bajgiran, K.; Darapaneni, P.; Melvin, A.T.; Dorman, J.A. Effects of Weak Electric Field on the Photoluminescence Behavior of Bi3+ -Doped YVO 4: Eu3+ Core–Shell Nanoparticles. J. Phys. Chem. C 2019, 123, 13027–13035. [Google Scholar] [CrossRef]
  44. Carnall, W.T.; Fields, P.R.; Rajnak, K. Electronic Energy Levels in the Trivalent Lanthanide Aquo Ions. I. Pr3+, Nd3+, Pm3+, Sm3+, Dy3+, Ho3+, Er3+, and Tm3+. J. Chem. Phys. 1968, 49, 4424–4442. [Google Scholar] [CrossRef]
  45. Bünzli, J.-C.G.; Eliseeva, S.V. Basics of Lanthanide Photophysics. In Lanthanide Luminescence; Hänninen, P., Härmä, H., Eds.; Springer Series on Fluorescence; Springer Berlin Heidelberg: Berlin, Heidelberg, 2010; Volume 7, pp. 1–45. ISBN 978-3-642-21022-8. [Google Scholar]
  46. Pinsky, M.; Avnir, D. Continuous Symmetry Measures. 5. The Classical Polyhedra. Inorg. Chem. 1998, 37, 5575–5582. [Google Scholar] [CrossRef] [PubMed]
  47. Judd, B.R. Optical Absorption Intensities of Rare-Earth Ions. Phys. Rev. 1962, 127, 750–761. [Google Scholar] [CrossRef]
  48. Ofelt, G.S. Intensities of Crystal Spectra of Rare-Earth Ions. J. Chem. Phys. 1962, 37, 511–520. [Google Scholar] [CrossRef]
  49. Metlina, D.A.; Metlin, M.T.; Ambrozevich, S.A.; Selyukov, A.S.; Datskevich, N.P.; Aminev, D.F.; Goryachii, D.O.; Lyssenko, K.A.; Pavlov, A.A.; Dmitrienko, A.O.; et al. Bright NIR-Luminescent Nd 3 + Complexes with Pyrazole-Substituted 1,3-Diketones Demonstrated an Unusual Spectral Lines Branching Ratios. Dye. Pigment. 2020, 181, 108558. [Google Scholar] [CrossRef]
  50. Carnall, W.T.; Fields, P.R.; Rajnak, K. Spectral Intensities of the Trivalent Lanthanides and Actinides in Solution. II. Pm3+, Sm3+, Eu3+, Gd3+, Tb3+, Dy3+, and Ho3+. J. Chem. Phys. 1968, 49, 4412–4423. [Google Scholar] [CrossRef]
  51. Kozma, I.Z.; Krok, P.; Riedle, E. Direct Measurement of the Group-Velocity Mismatch and Derivation of the Refractive-Index Dispersion for a Variety of Solvents in the Ultraviolet. J. Opt. Soc. Am. B 2005, 22, 1479. [Google Scholar] [CrossRef]
  52. Jørgensen, C.K.; Reisfeld, R. Judd-Ofelt Parameters and Chemical Bonding. J. Less Common Met. 1983, 93, 107–112. [Google Scholar] [CrossRef]
  53. Sheldrick, G.M. Crystal Structure Refinement with SHELXL. Acta Crystallogr. C Struct Chem. 2015, 71, 3–8. [Google Scholar] [CrossRef] [PubMed] [Green Version]
  54. Sheldrick, G.M. SHELXT—Integrated Space-Group and Crystal-Structure Determination. Acta Crystallogr. A Found Adv. 2015, 71, 3–8. [Google Scholar] [CrossRef] [PubMed] [Green Version]
  55. Dolomanov, O.V.; Bourhis, L.J.; Gildea, R.J.; Howard, J.A.K.; Puschmann, H. OLEX2: A Complete Structure Solution, Refinement and Analysis Program. J. Appl. Crystallogr. 2009, 42, 339–341. [Google Scholar] [CrossRef]
  56. Lyle, S.J.; Rahman, M.M. Complexometric Titration of Yttrium and the Lanthanons—IA Comparison of Direct Methods. Talanta 1963, 10, 1177–1182. [Google Scholar] [CrossRef]
  57. Marchetti, F.; Pettinari, C.; Pizzabiocca, A.; Drozdov, A.A.; Troyanov, S.I.; Zhuravlev, C.O.; Semenov, S.N.; Belousov, Y.A.; Timokhin, I.G. Syntheses, Structures, and Spectroscopy of Mono- and Polynuclear Lanthanide Complexes Containing 4-Acyl-Pyrazolones and Diphosphineoxide. Inorg. Chim. Acta 2010, 363, 4038–4047. [Google Scholar] [CrossRef]
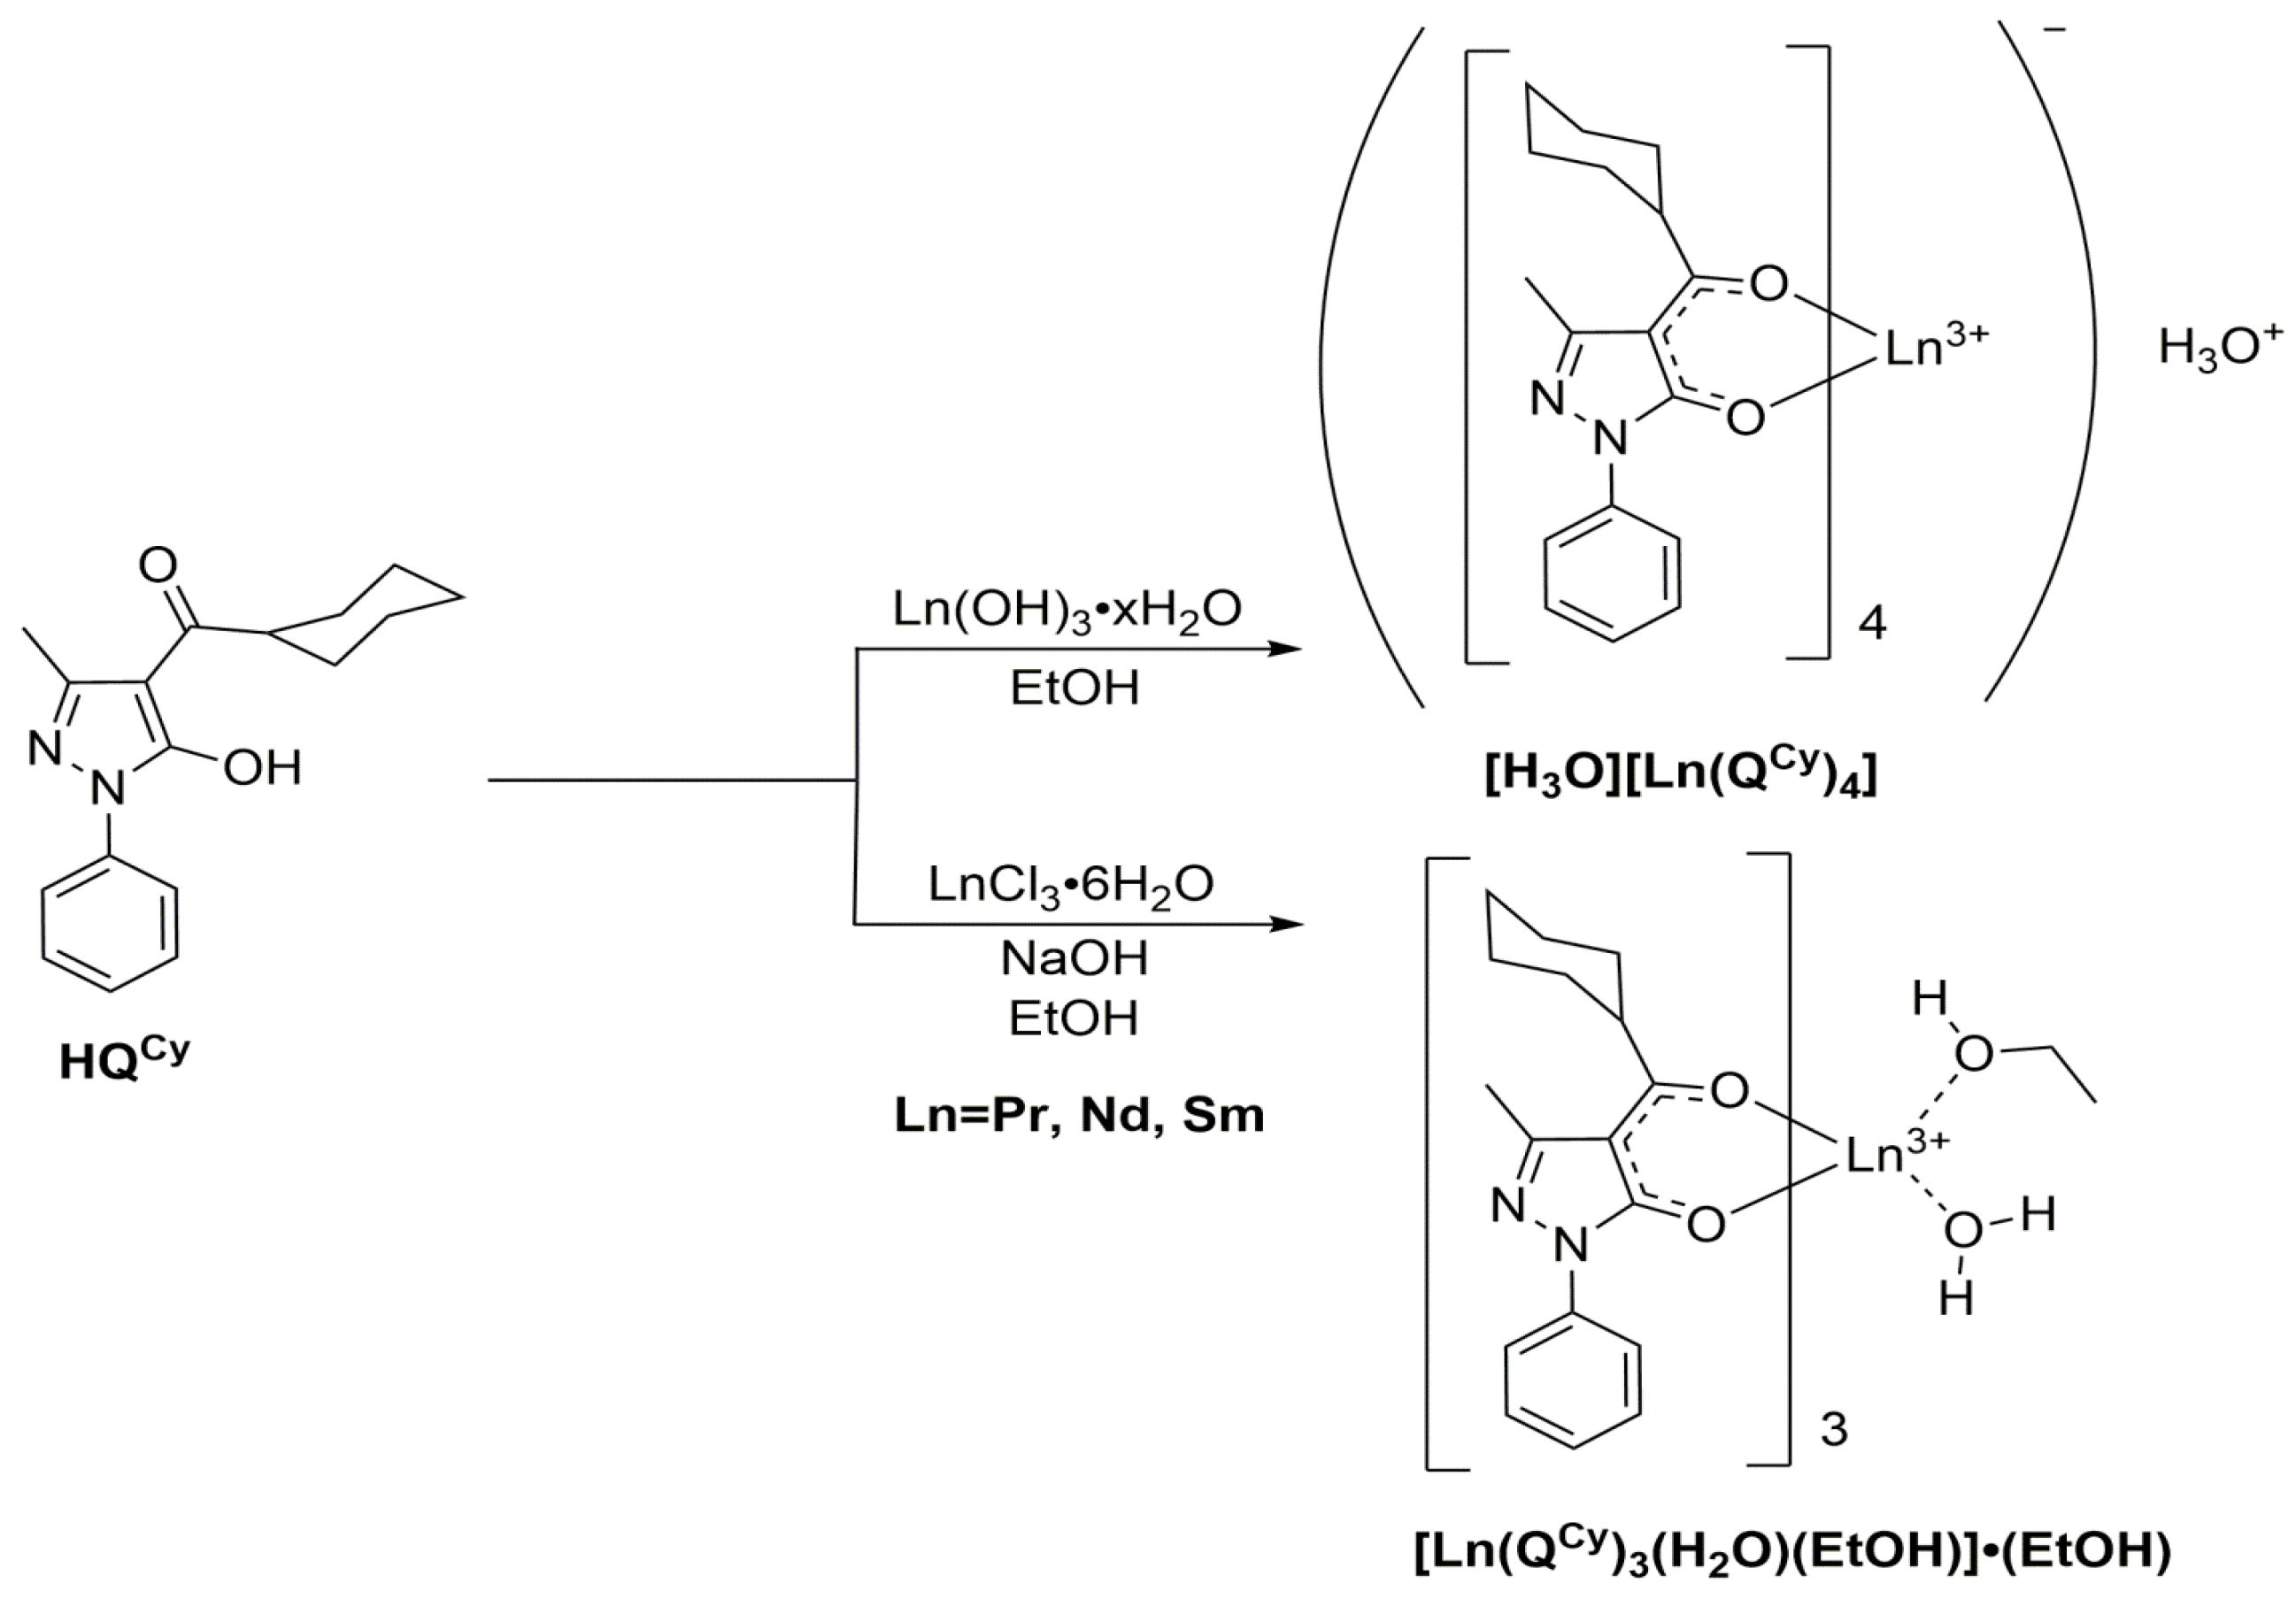
Scheme 1. Synthesis of complexes.
Molecules 28 05892 sch001
Figure 1. View of the asymmetric unit of [Sm(Qcy)3(H2O)(EtOH)]∙(EtOH). Hydrogen atoms and solvent ethanol molecule are not shown for clarity; thermal ellipsoids are illustrated at 50% probability. Central metal atom and oxygen atoms of ligands are labeled.
Molecules 28 05892 g001
Figure 2. View of the crystal packing of [Sm(Qcy)3(H2O)(EtOH)]∙(EtOH). Hydrogen atoms not involved in intermolecular interactions are not shown for clarity; solvent ethanol molecules as well as thermal ellipsoids are not illustrated. Hydrogen bonds are shown with dotted lines.
Molecules 28 05892 g002
Figure 3. General view of [H3O][Sm(Qcy)4]. Hydrogen atoms at carbon atoms and disordered cyclohexyl fragments are not shown for clarity; thermal ellipsoids are illustrated at 50% probability. Central metal atom and oxygen atoms of ligands are labelled.
Molecules 28 05892 g003
Figure 4. View of the crystal packing of [H3O][Sm(Qcy)4]. Hydrogen atoms not involved in intermolecular interactions are not shown for clarity; disordered cyclohexyl fragments as well as thermal ellipsoids are not illustrated. Hydrogen bonds are shown with dotted lines.
Molecules 28 05892 g004
Figure 5. UV–VIS absorption spectra for the compounds in MeCN.
Molecules 28 05892 g005
Figure 6. Photoluminescence spectra for the Sm3+ ion compounds in solid state under CW excitation at 340 nm.
Molecules 28 05892 g006
Figure 7. Photoluminescence spectra for the Pr3+ ion compounds in solid state under CW excitation at 340 nm.
Molecules 28 05892 g007
Figure 8. Photoluminescence spectra for the Nd3+ ion compounds in solid state under CW excitation at 340 nm.
Molecules 28 05892 g008
Figure 9. PL excitation spectra for compounds at solid state with registration wavelengths at PL intensity maxima.
Molecules 28 05892 g009
Figure 10. PL decays for the Sm3+ ion compounds in solid state under pulsed excitation of 355 nm monitored at the 650 nm (1) and 953 nm (2).
Molecules 28 05892 g010
Figure 11. PL decays for the Pr3+ ion compounds in solid state under pulsed excitation of 355 nm monitored at 605 nm (1) and 1020 nm (2).
Molecules 28 05892 g011
Figure 12. PL decays for the Nd3+ ion compounds in solid state under pulsed excitation of 355 nm monitored at the 1064 nm.
Molecules 28 05892 g012
Table 1. Calculated electric-dipole transition probabilities Arad, branching ratios bcalc, and radiative lifetime trad for praseodymium complexes.
[Pr(Qcy)3(H2O)(EtOH)]∙(EtOH)[H3O][Pr(Qcy)4]
3P02S+1LJWavelength, nmArad, s−1bcalc, %Arad, s−1bcalc, %
1D2305126.40.038.50.02
3F46971165.51.61996.75.4
3F263556,964.581.118,349.549.7
3H66086415.19.16886.318.6
3H44825656.88.19690.426.2
trad = 14.2 µs; trad = 27.1 µs;
3P12S+1LJWavelength, nmArad, s−1bcalc, %Arad, s−1bcalc, %
1D22223359.70.2115.90.1
3F46882973.21.55093.234.7
3F366997,011.649.234,600.831.8
3F261158,151.729.518,731.917.3
3H658612,305.96.213,209.912.2
3H552020,134.510.226,390.424.3
3H44686083.73.0810,421.89.6
trad = 5.1 µs; trad = 9.2 µs;
1D22S+1LJWavelength, nmArad, s−1bcalc, %Arad, s−1bcalc, %
3F499530,580.574.610,155.651.9
3F39561880.14.6708.93.6
3F28431685.34.11279.66.5
3H6796757.81.81131.95.8
3H567847.90.165.70.3
3H45926048.314.86206.931.8
trad = 24.3 µs; trad = 51.2 µs;
Table 2. Calculated electric-dipole transition probabilities Arad, branching ratios bcalc, and radiative lifetime trad for neodymium complexes.
[Nd(Qcy)3(H2O)(EtOH)]∙(EtOH)[H3O][Nd(Qcy)4]
4F3/22S+1LJWavelength, nmArad, s−1bcalc, %Arad, s−1bcalc, %
4I15/28801890.248.22951.652.6
4I13/210601717.743.82056.540.8
4I11/21330295.97.5314.96.2
4I9/2183015.20.416.20.3
trad = 255.2 µs;trad = 198.5 µs;
Table 3. Calculated electric-dipole transition probabilities Arad, branching ratios bcalc, and radiative lifetime trad for samarium complexes.
[Sm(Qcy)3(H2O)(EtOH)]∙(EtOH)[H3O][Sm(Qcy)4] *
4G5/22S+1LJWavelength, nmArad, s−1bcalc, %Arad, s−1bcalc, %
6H5/256542.42.58.62.7
6H7/2610201.412.146.214.9
6H9/26501006.760.4178.757.6
6H11/271557.13.414.34.6
6H13/28005.80.30.80.3
6F3/293636.32.26.11.9
6F5/2949202.812.134.911.2
6F7/210365.50.31.50.5
6F9/21180108.26.418.76.0
trad = 0.6 ms;trad = 3.2 ms;
* Data were revealed previously in [20].
Table 4. Comparison of characteristic lifetimes of coordination compounds on different registration wavelengths.
Complex λ , nm τ 1 , ns τ 2 , ns Φ, %
[Nd(Qcy)3(H2O)(EtOH)]∙(EtOH)105614610461.3
H 3 O N d Q c y 4 105611831.3
[Pr(Qcy)3(H2O)(EtOH)]∙(EtOH)60551840.4
1020558
H 3 O P r Q c y 4 605813920.4
102085
[Sm(Qcy)3(H2O)(EtOH)]∙(EtOH)65013 × 1031.3
95314 × 1030.5
H 3 O S m Q c y 4 65055 × 1032.0
95366 × 1030.4
Disclaimer/Publisher’s Note: The statements, opinions and data contained in all publications are solely those of the individual author(s) and contributor(s) and not of MDPI and/or the editor(s). MDPI and/or the editor(s) disclaim responsibility for any injury to people or property resulting from any ideas, methods, instructions or products referred to in the content.