

Characterization of Activated Carbon from Rice Husk for Enhanced Energy Storage Devices

 ,
,
Abstract

1. Introduction
2. Results and Discussion
2.1. Analysis of Material Morphologies, Structures and Chemical States
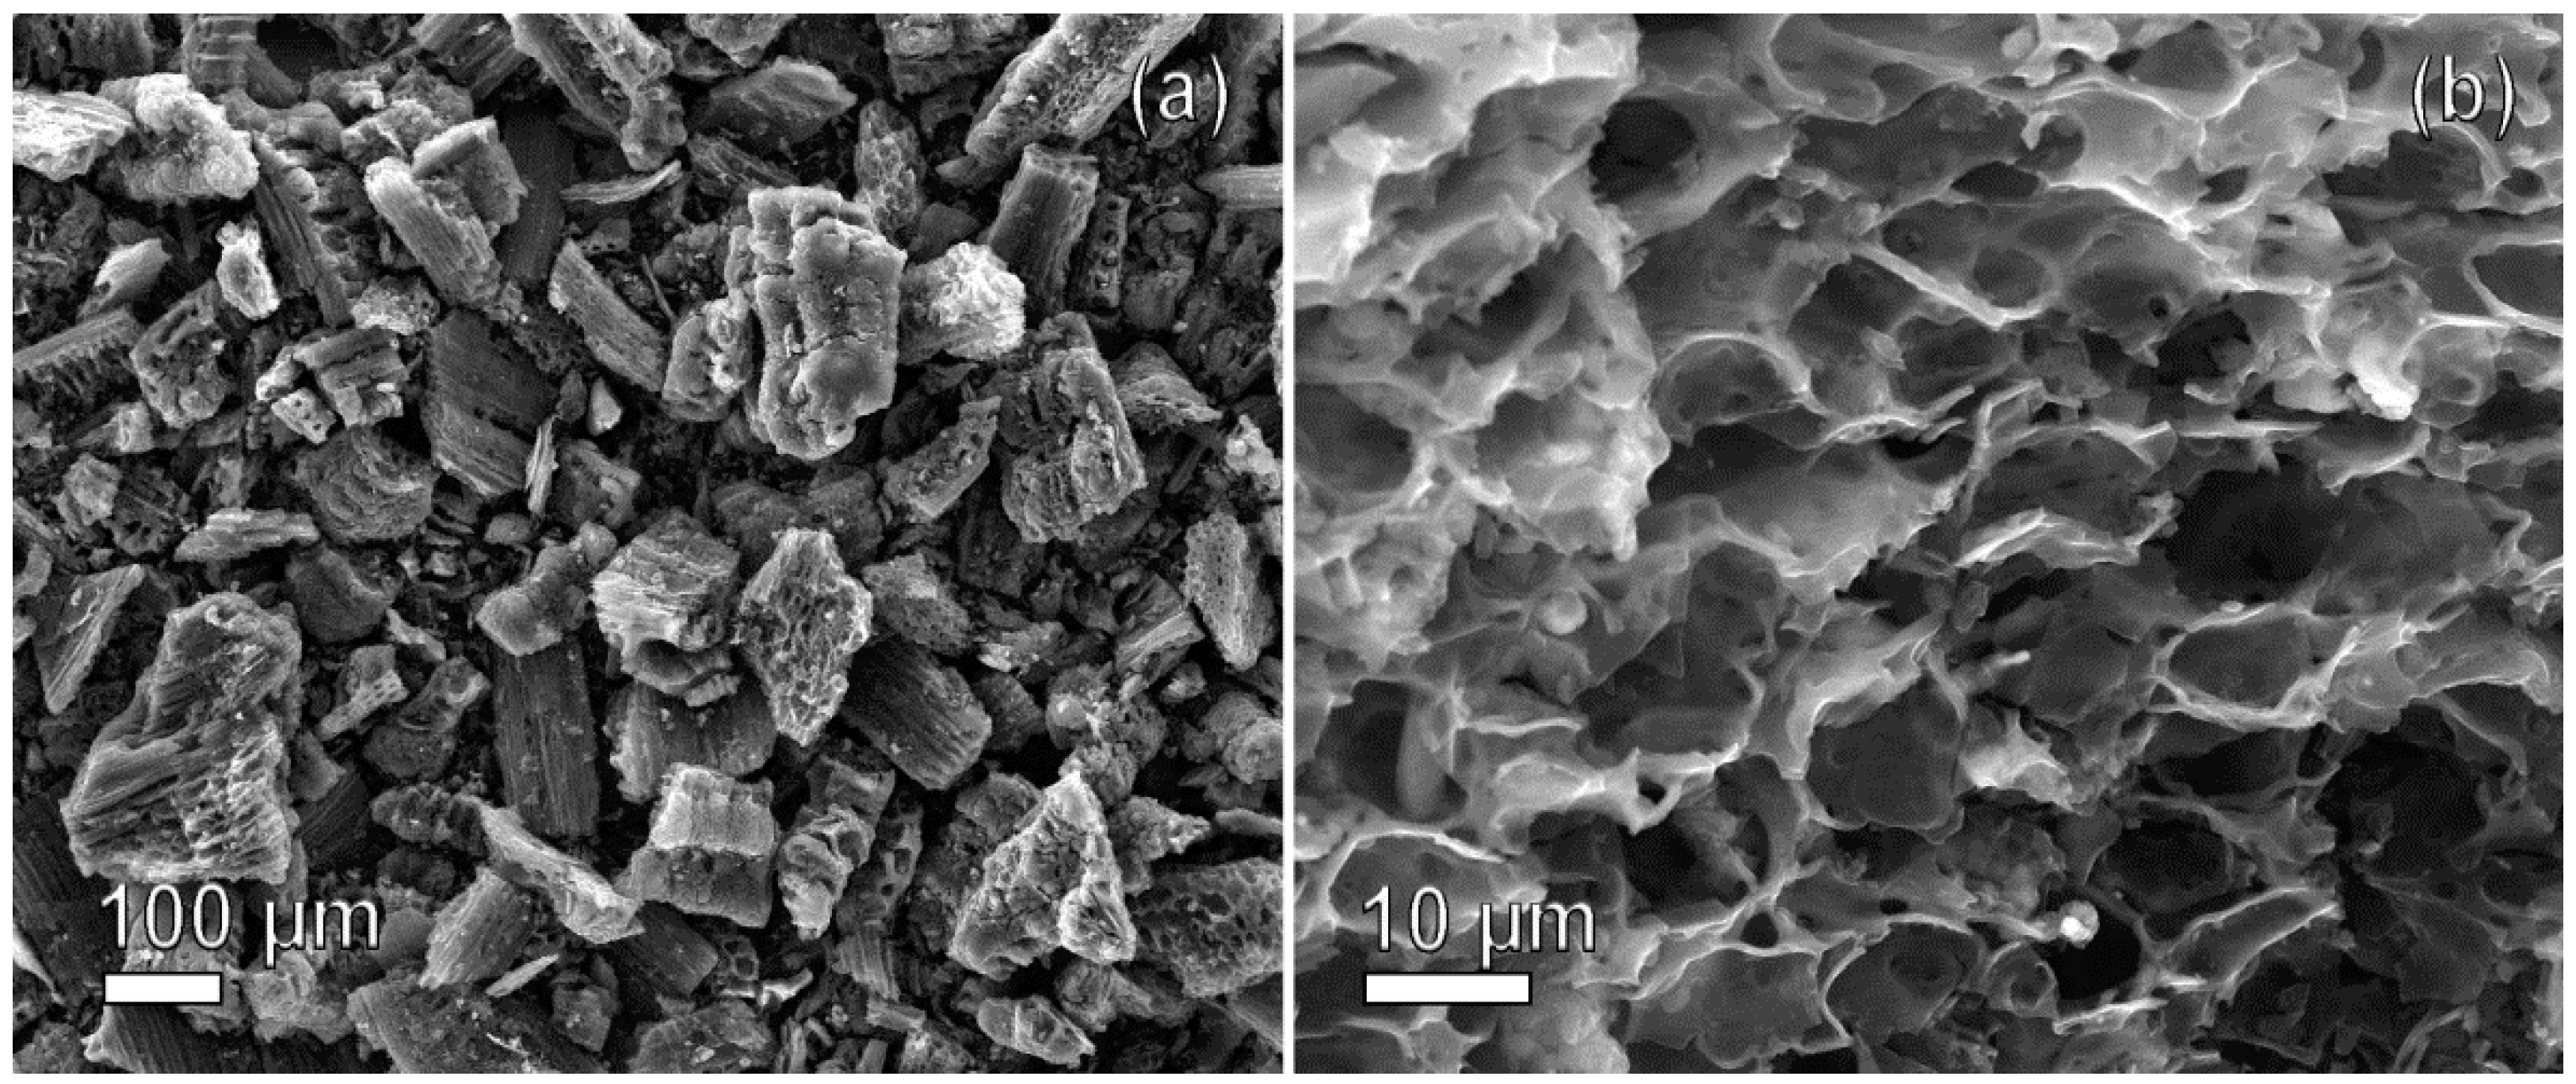
2.1.1. SEM
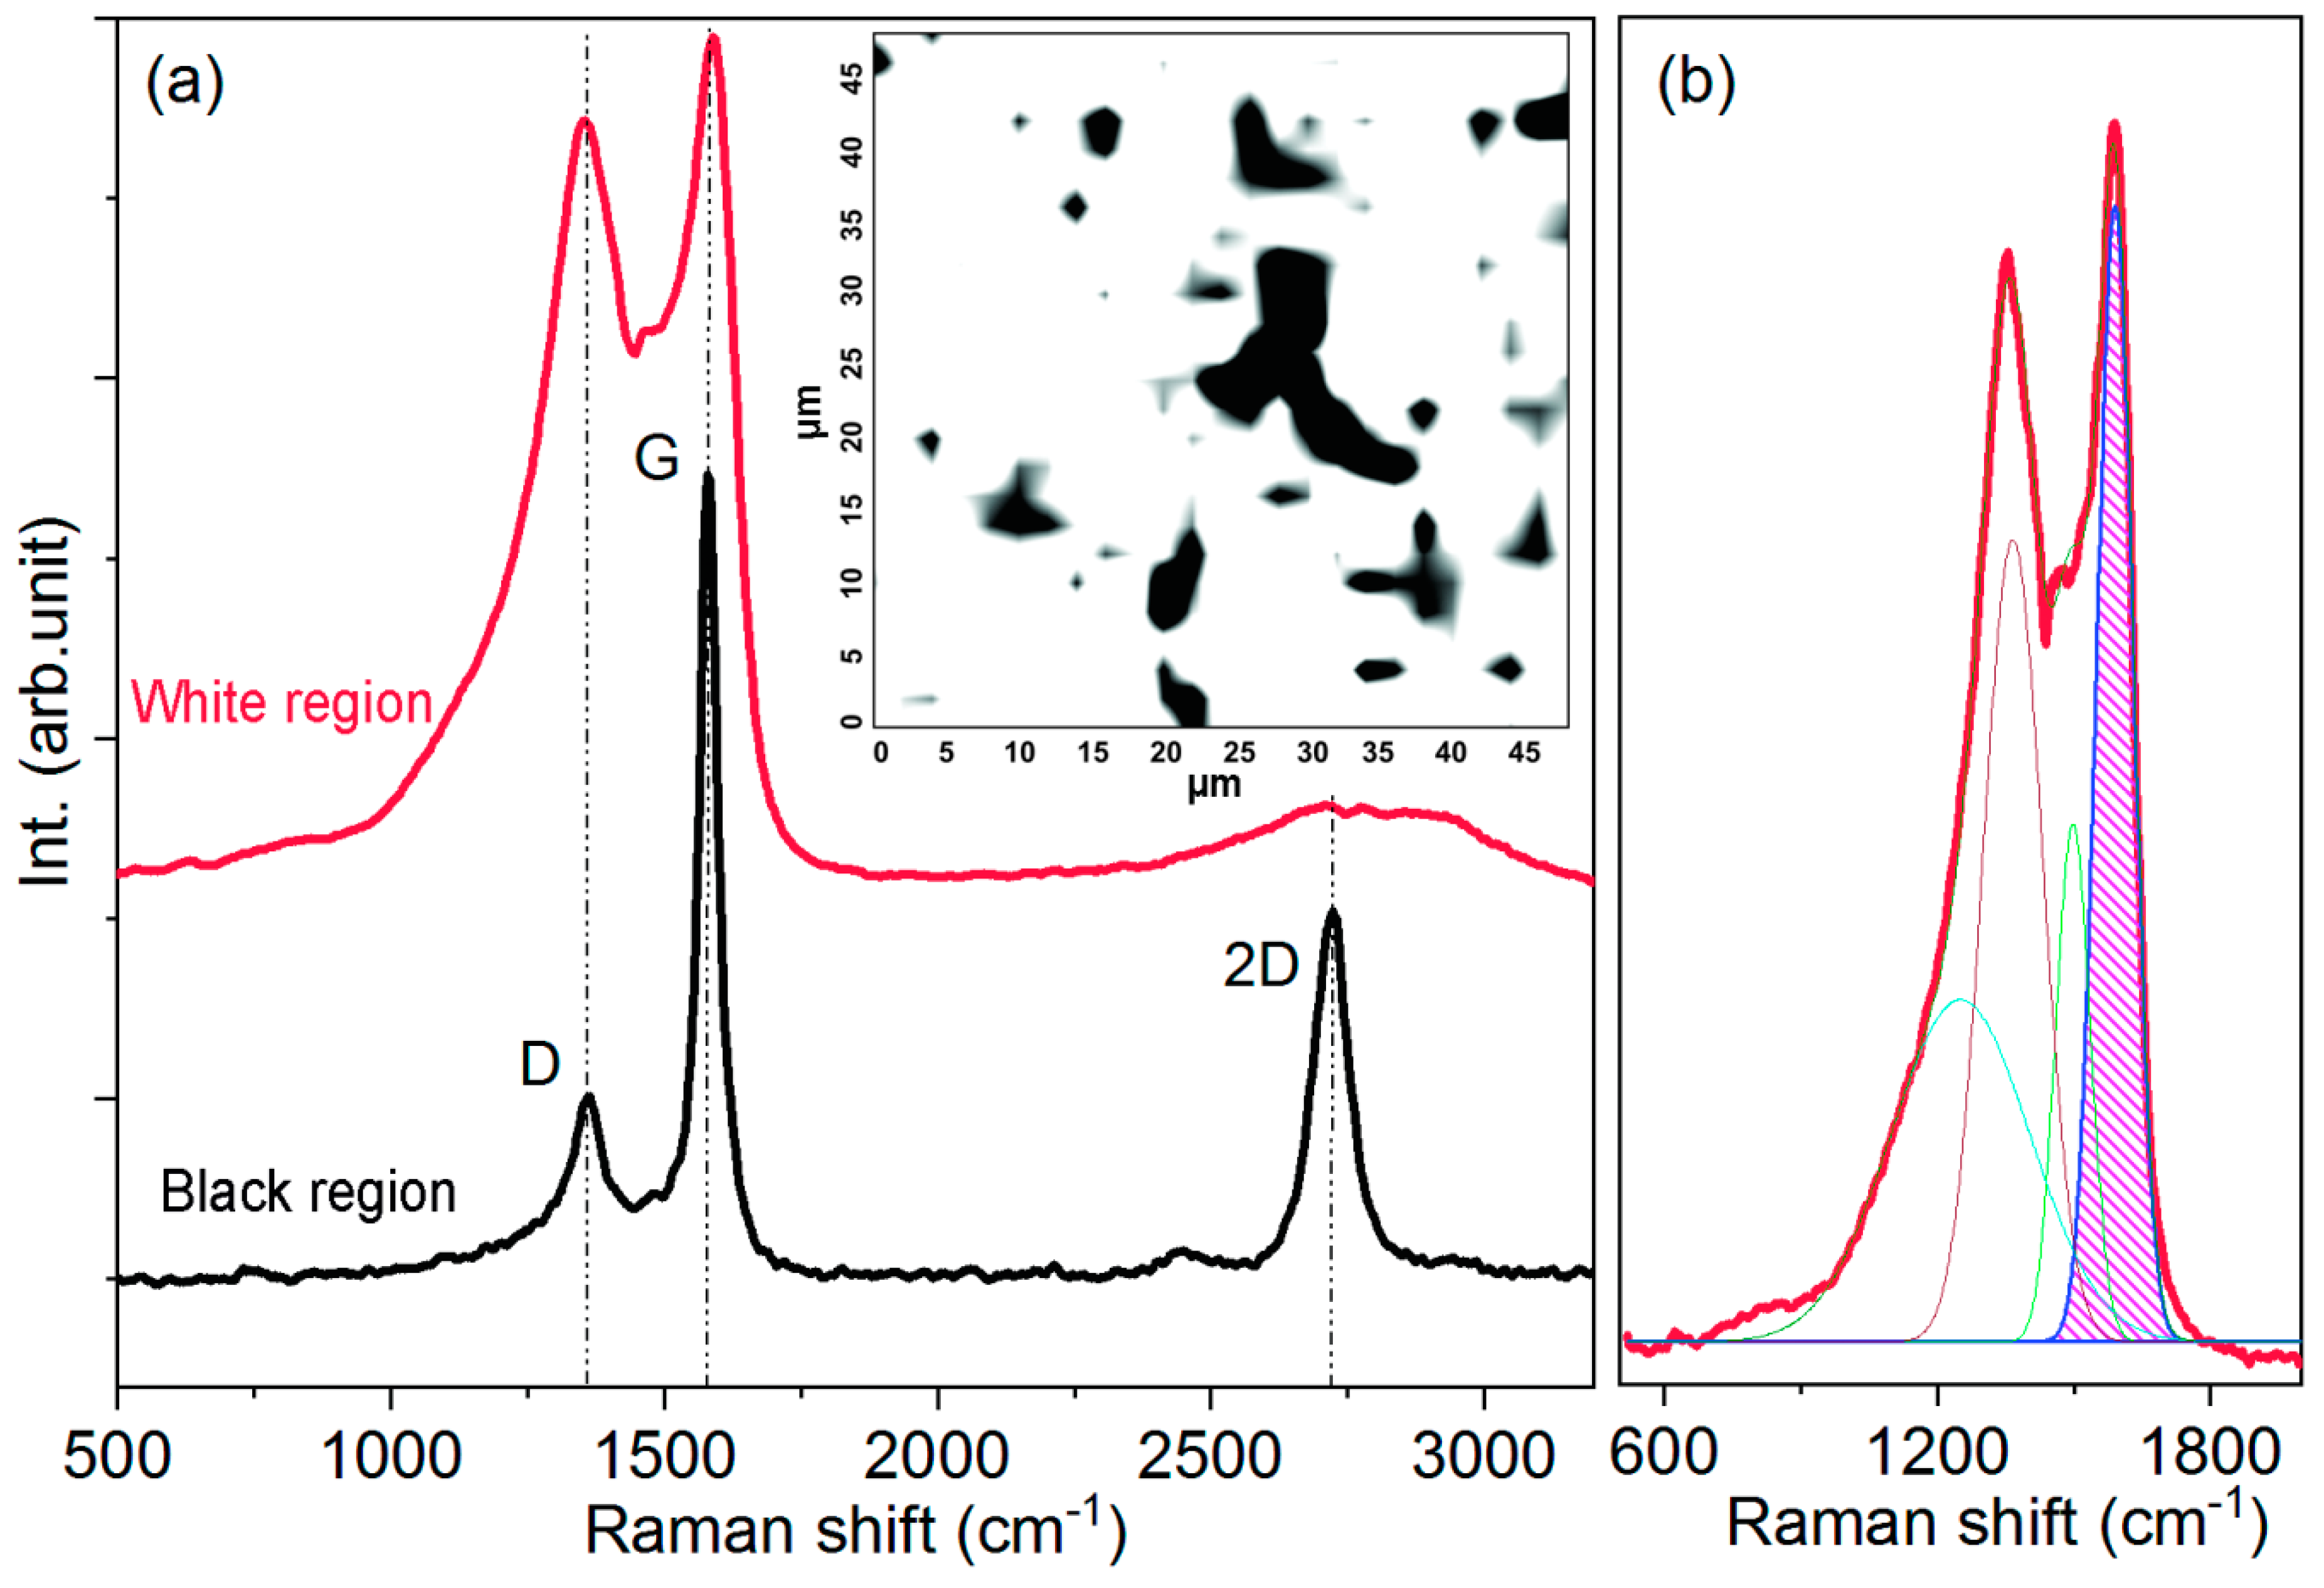
2.1.2. Raman Spectral Mapping of the Activated Rice Husk
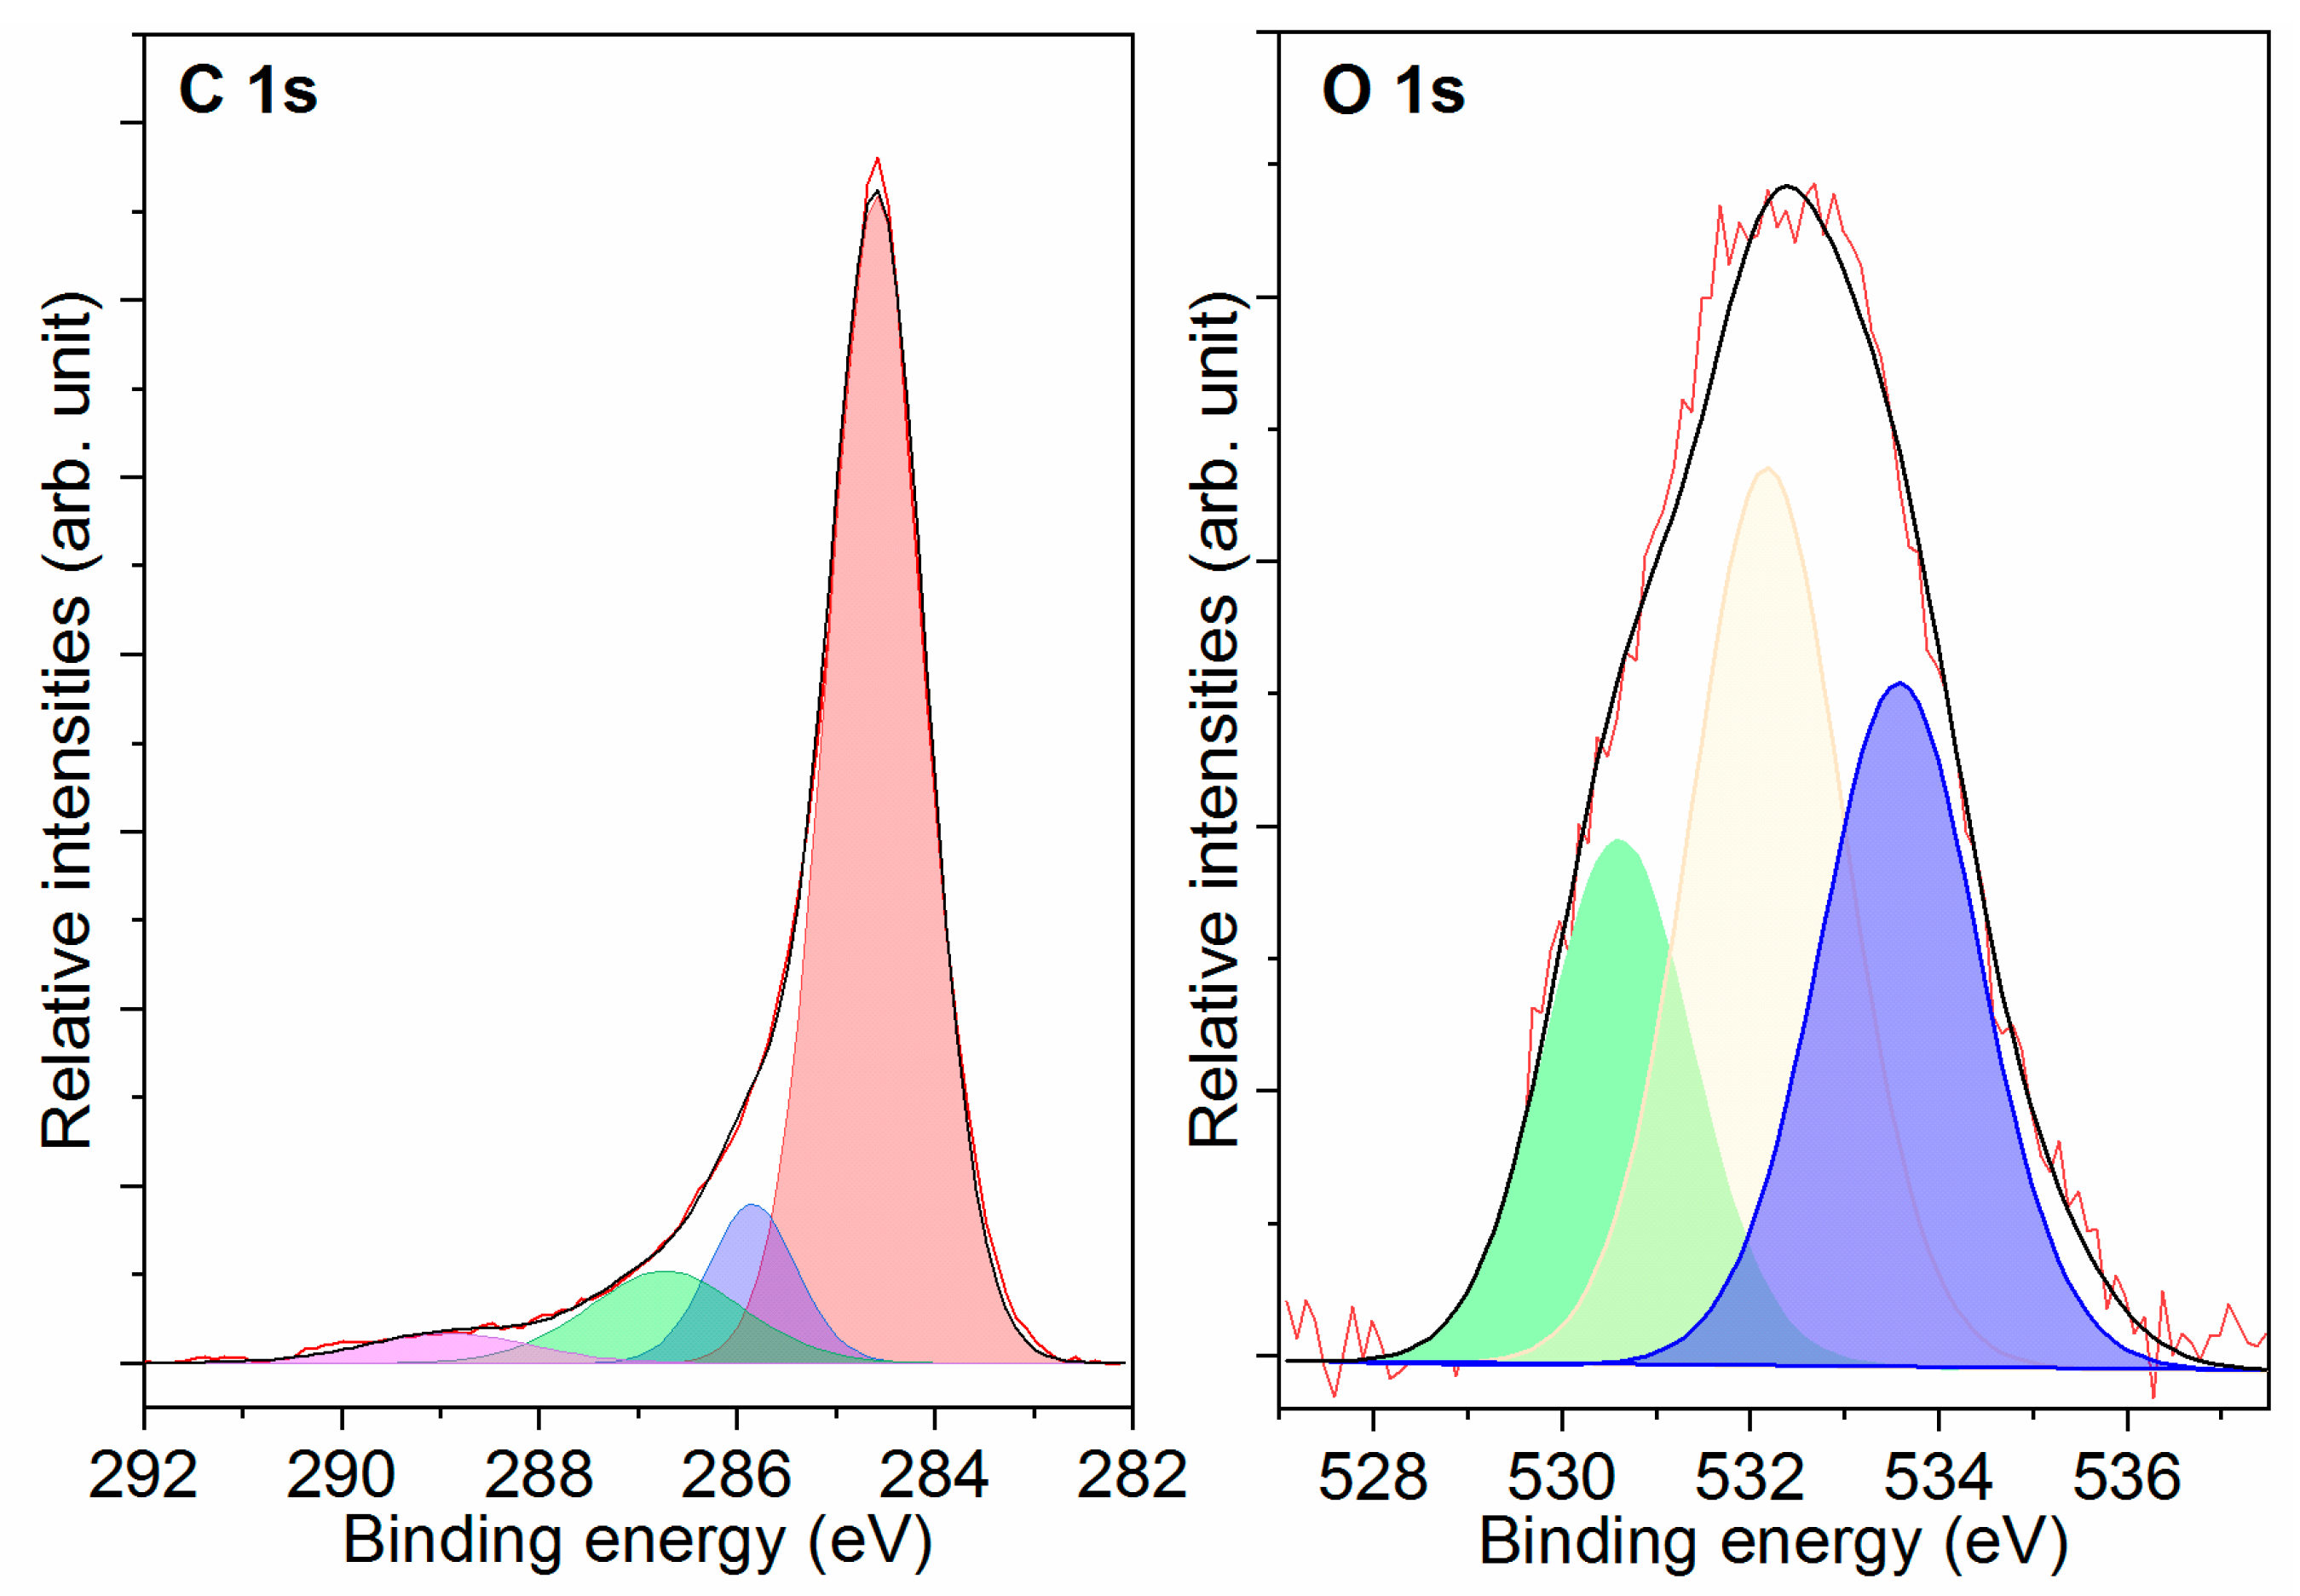
2.1.3. XPS
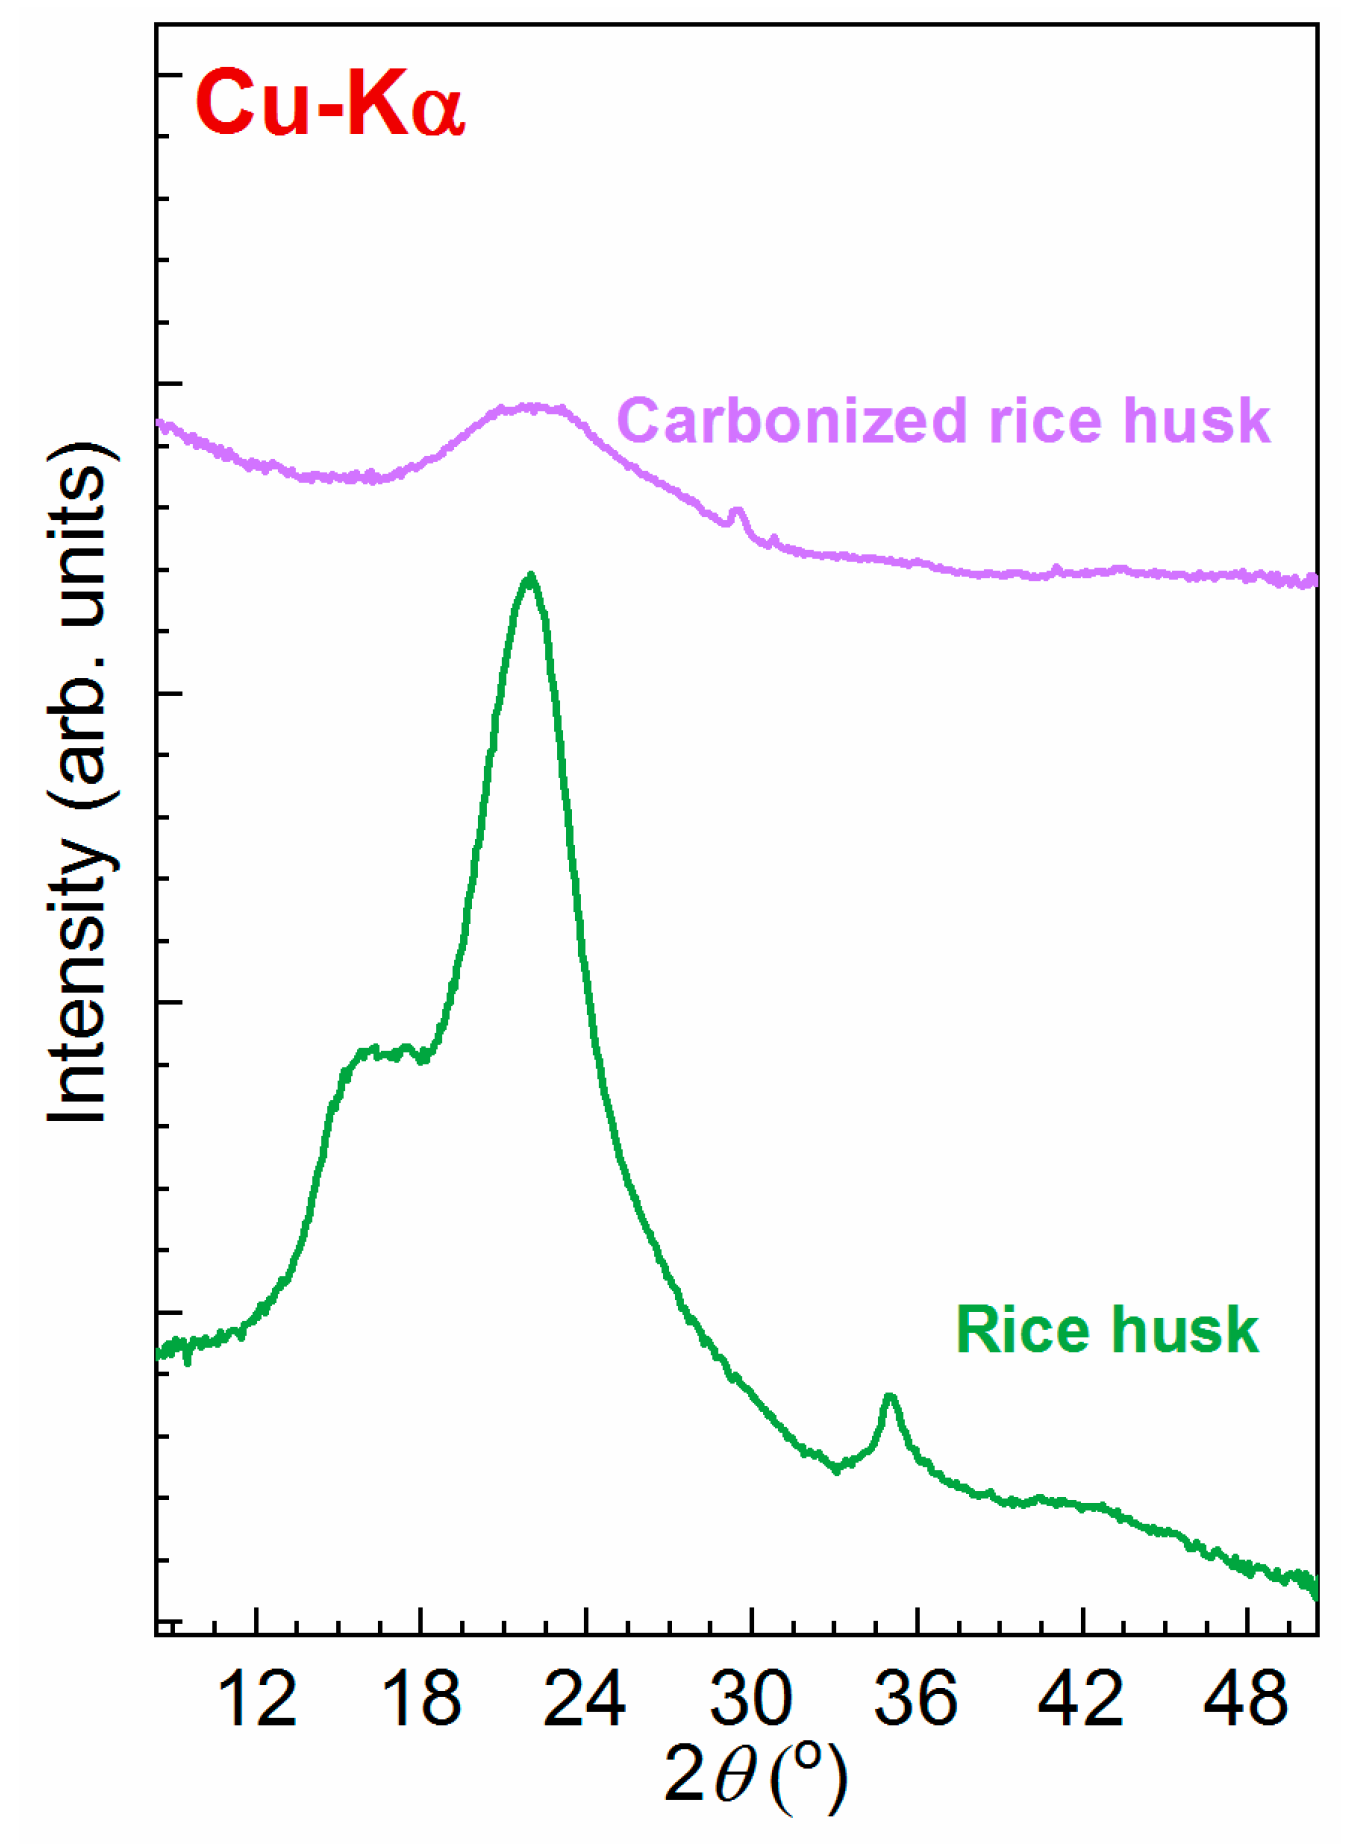
2.1.4. XRD
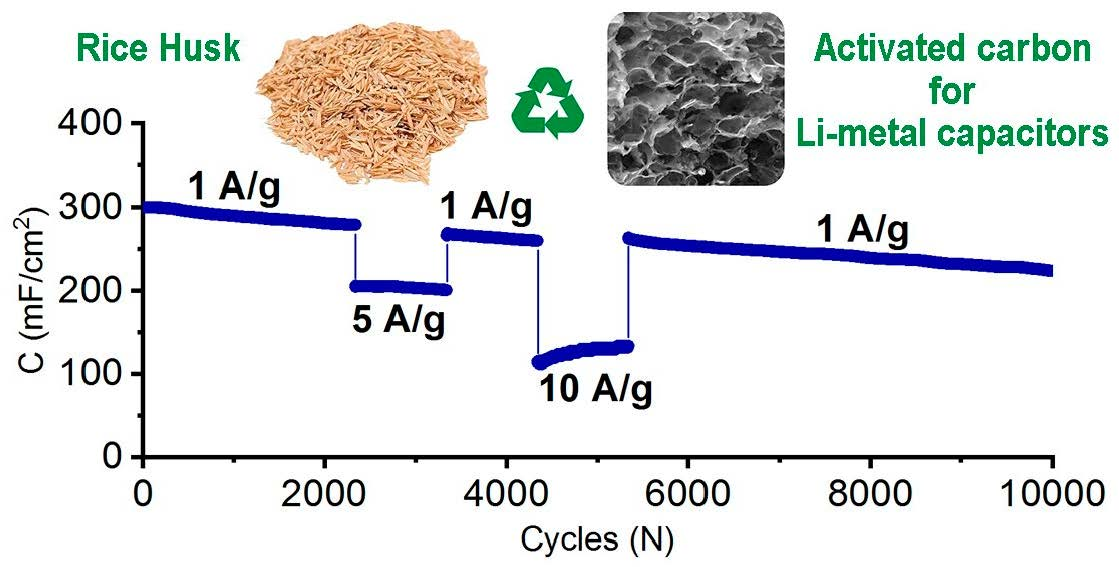
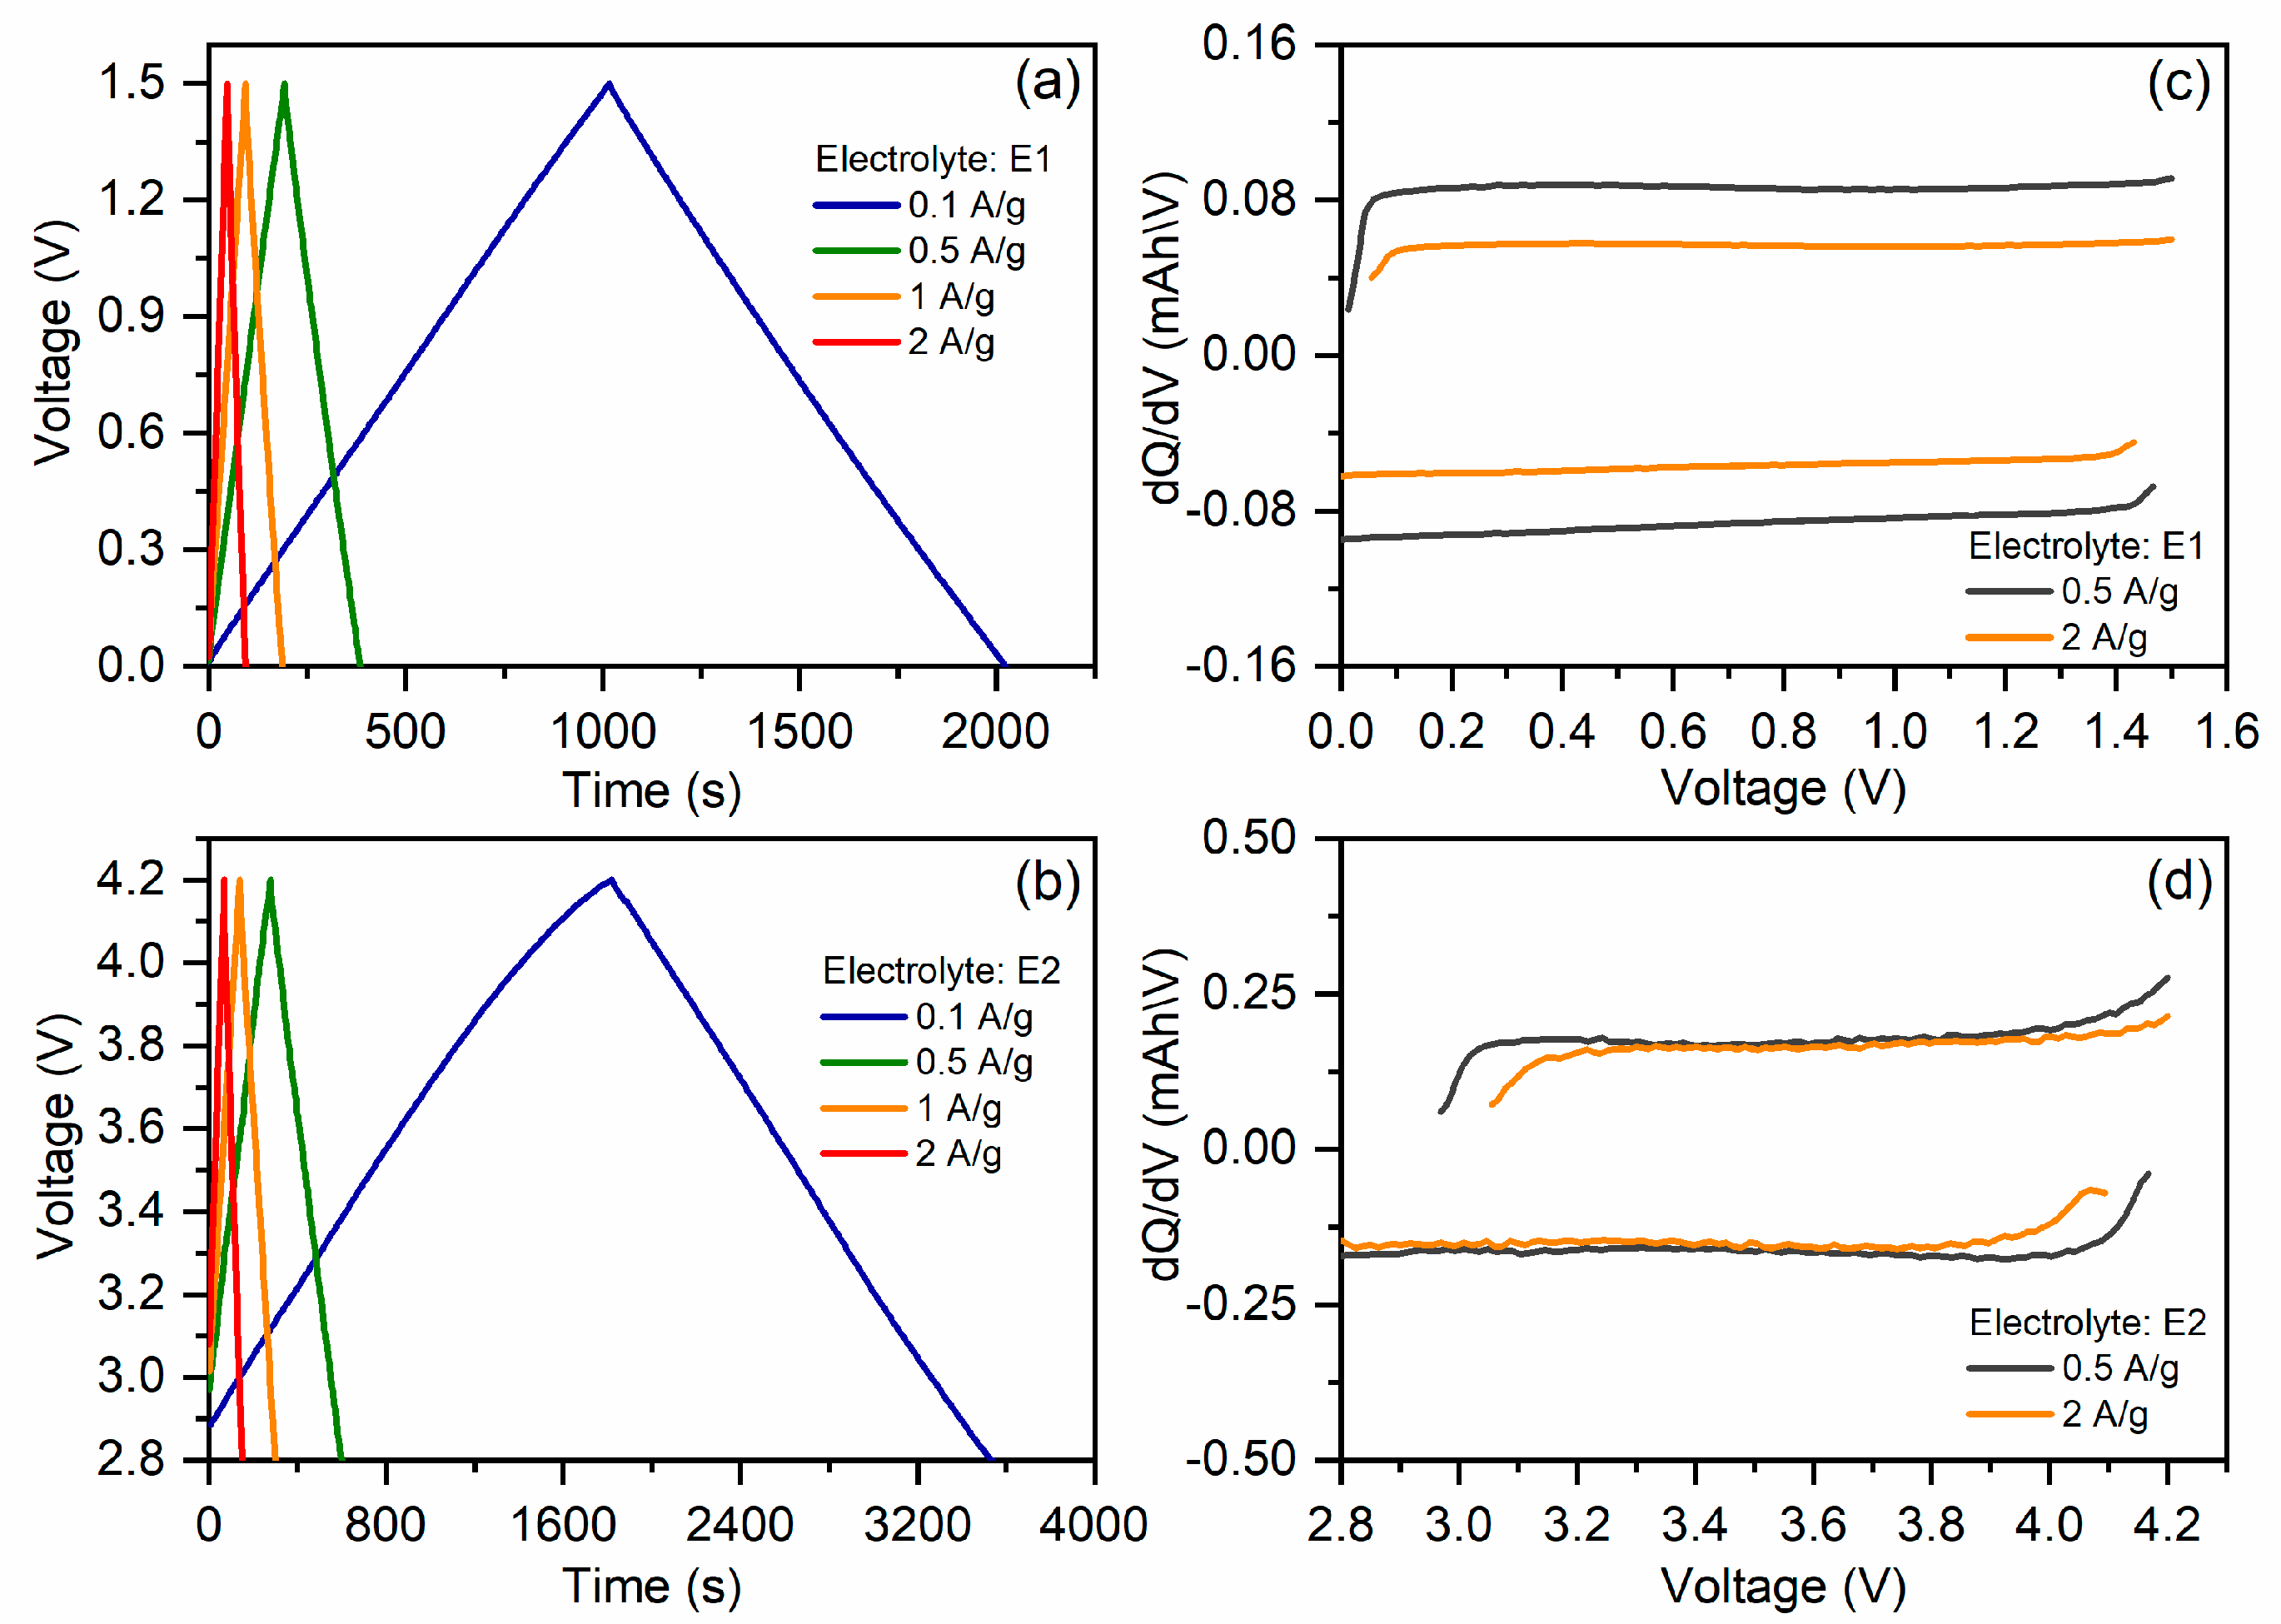
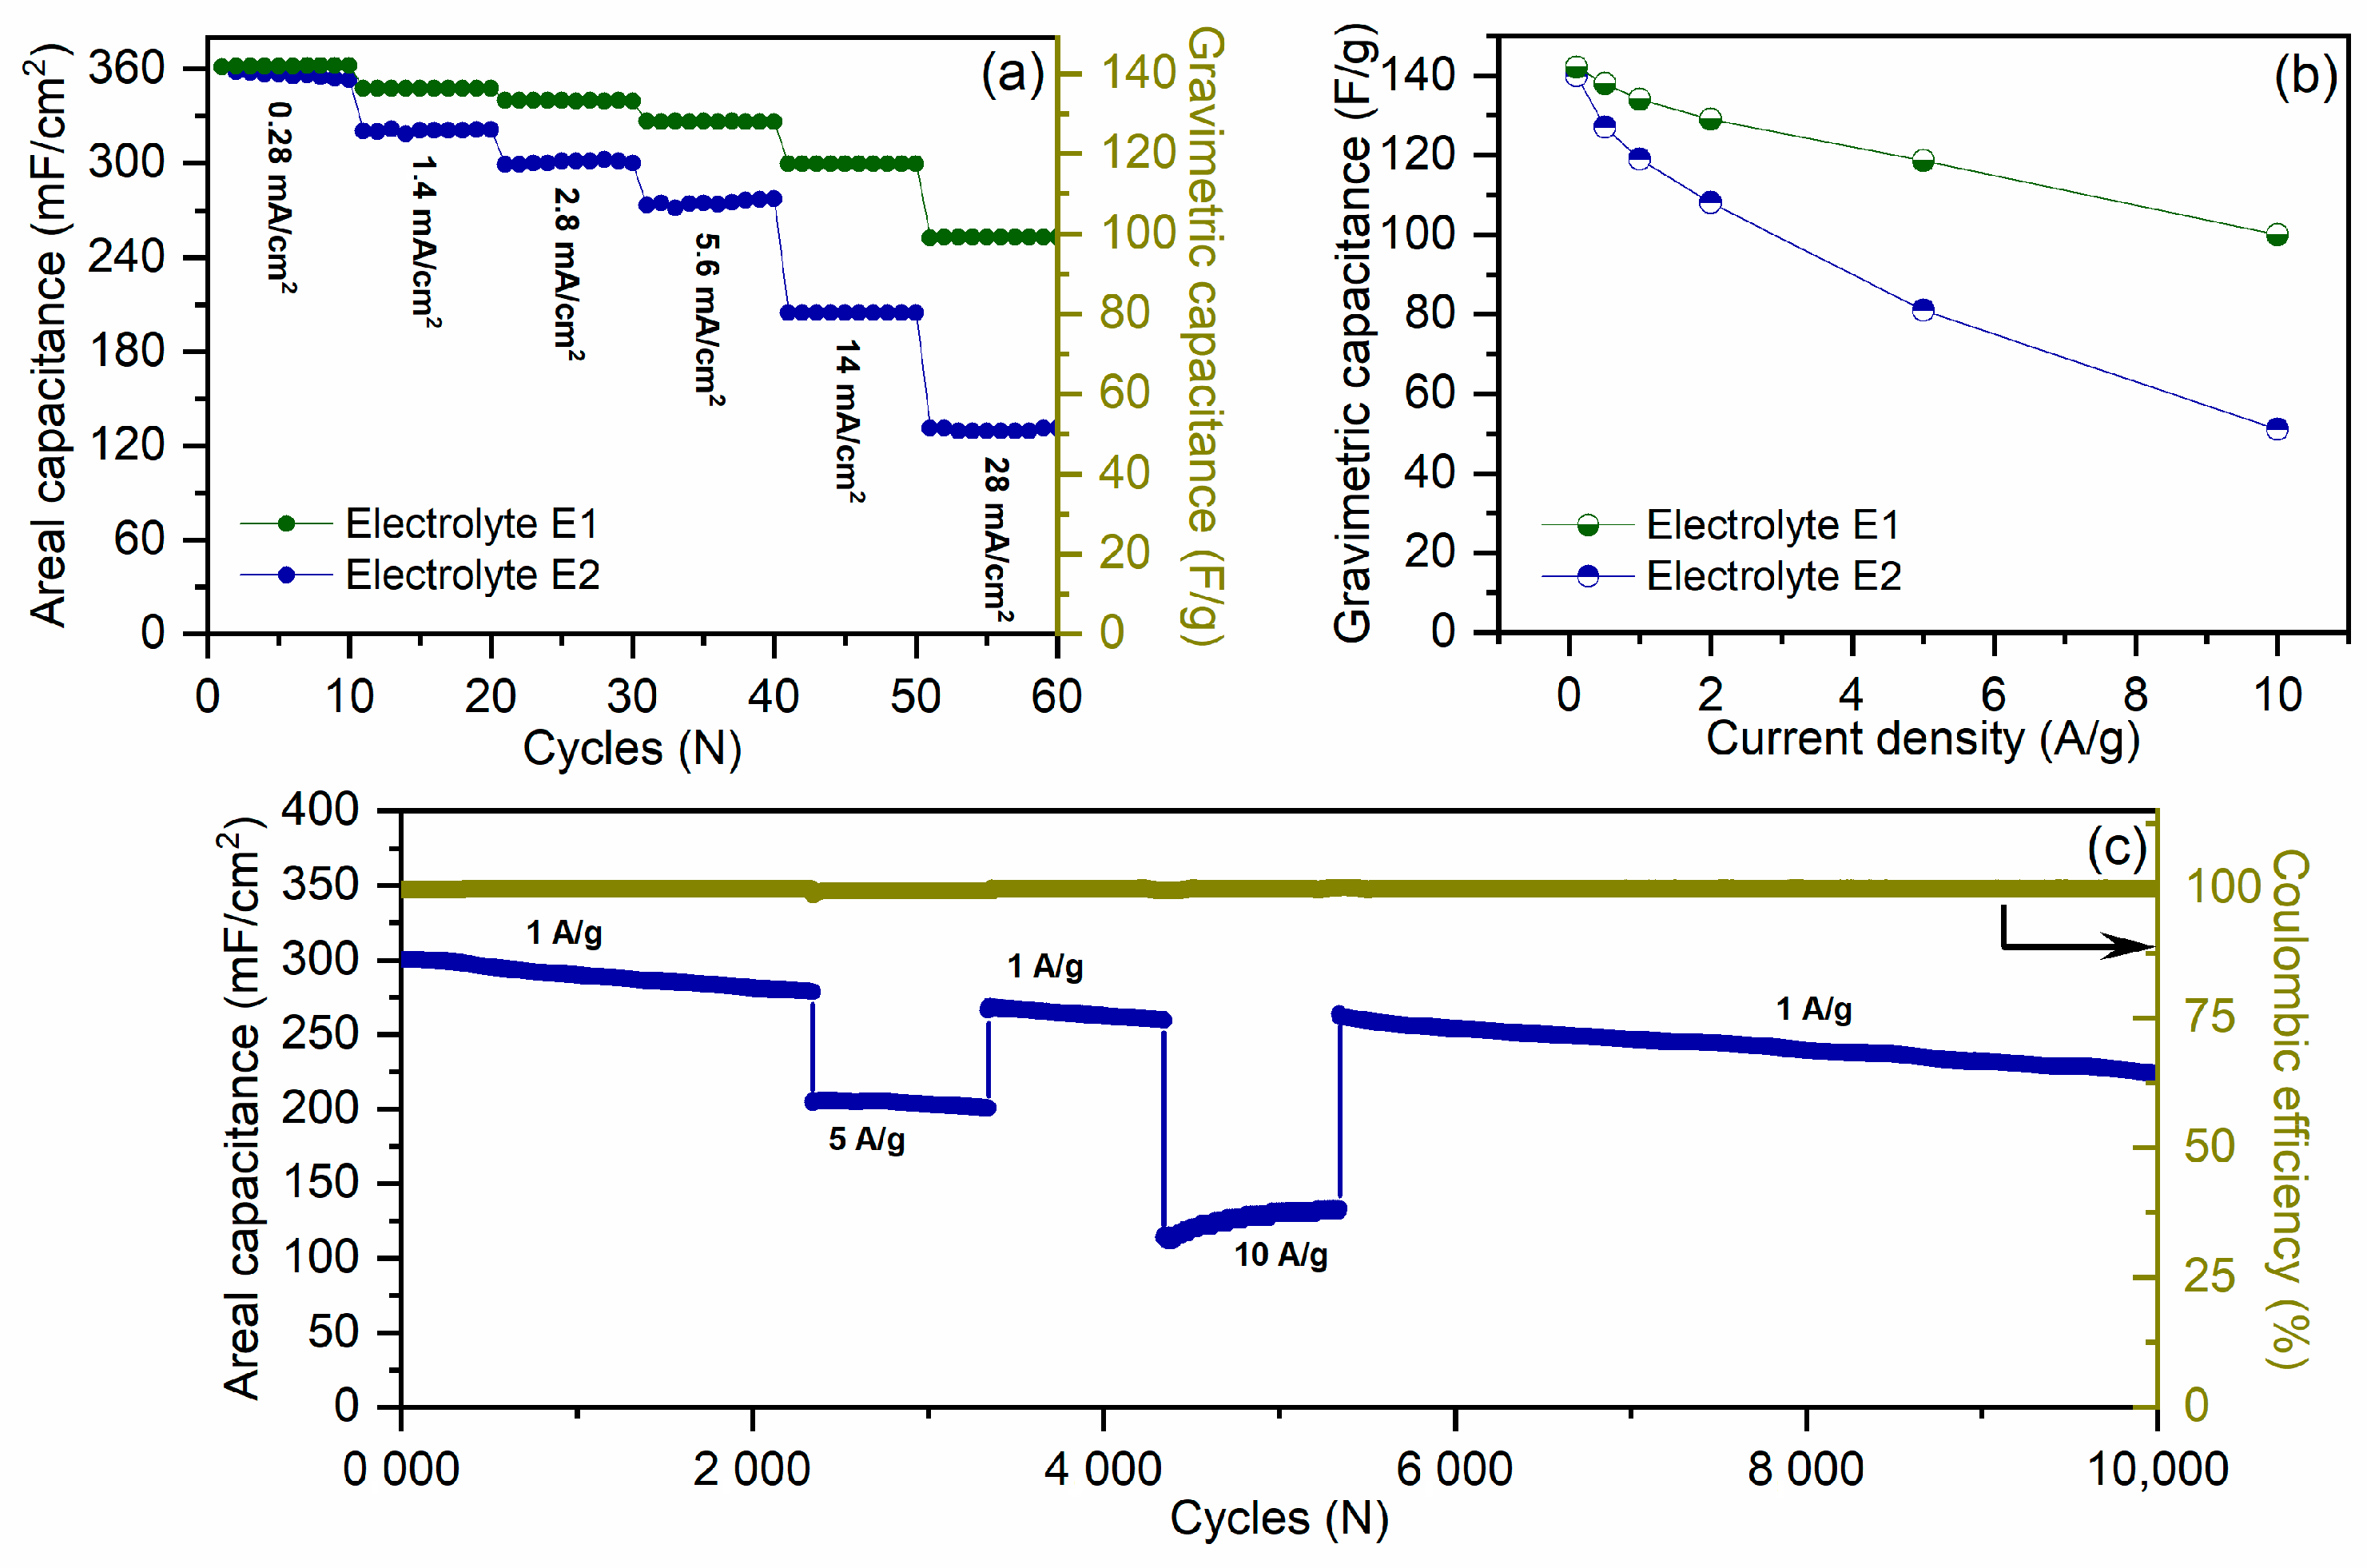
2.2. Analysis of Electrochemistry
3. Materials and Experimental Methods
3.1. Synthesis of Activated Carbon from Rice Husk
3.2. Characterization Methods
3.3. Electrochemical Tests
4. Conclusions
Supplementary Materials
Author Contributions
Funding
Institutional Review Board Statement
Informed Consent Statement
Data Availability Statement
Acknowledgments
Conflicts of Interest
Sample Availability
References
- Satayeva, A.; Baimenov, A.S.; Zhantikeyev, U.; Seisenova, A.; Tauanov, Z.A. Review on Coal Fly Ash Generation and Utilization for Resolving Mercury Contamination Issues in Central Asia: Kazakhstan. Environ. Rev. 2022, 30, 418–437. [Google Scholar] [CrossRef]
- Neme, I.; Gonfa, G.; Masi, C. Activated Carbon from Biomass Precursors Using Phosphoric Acid: A Review. Heliyon 2022, 8, e11940. [Google Scholar] [CrossRef] [PubMed]
- Azat, S.; Arkhangelsky, E.; Papathanasiou, T.; Zorpas, A.A.; Abirov, A.; Inglezakis, V.J. Synthesis of Biosourced Silica–Ag Nanocomposites and Amalgamation Reaction with Mercury in Aqueous Solutions. Comptes Rendus Chim. 2020, 23, 77–92. [Google Scholar] [CrossRef]
- Tauanov, Z.; Azat, S.; Baibatyrova, A. A Mini-Review on Coal Fly Ash Properties, Utilization and Synthesis of Zeolites. Int. J. Coal Prep. Util. 2022, 42, 1968–1990. [Google Scholar] [CrossRef]
- Gorbounov, M.; Petrovic, B.; Ozmen, S.; Clough, P.; Masoudi Soltani, S. Activated Carbon Derived from Biomass Combustion Bottom Ash as Solid Sorbent for CO2 Adsorption. Chem. Eng. Res. Des. 2023, 194, 325–343. [Google Scholar] [CrossRef]
- Luo, L.; Lan, Y.; Zhang, Q.; Deng, J.; Luo, L.; Zeng, Q.; Gao, H.; Zhao, W. A Review on Biomass-Derived Activated Carbon as Electrode Materials for Energy Storage Supercapacitors. J. Energy Storage 2022, 55, 105839. [Google Scholar] [CrossRef]
- Beutier, C.; Serghei, A.; Cassagnau, P.; Heuillet, P.; Cantaloube, B.; Selles, N.; Morfin, I.; Sudre, G.; David, L. In Situ Coupled Mechanical/Electrical/WAXS/SAXS Investigations on Ethylene Propylene Diene Monomer Resin/Carbon Black Nanocomposites. Polymer 2022, 254, 125077. [Google Scholar] [CrossRef]
- László, K.; Geissler, E. Surface Chemistry and Contrast-Modified SAXS in Polymer-Based Activated Carbons. Carbon 2006, 44, 2437–2444. [Google Scholar] [CrossRef]
- Askaruly, K.; Yeleuov, M.; Taurbekov, A.; Sarsembayeva, B.; Tolynbekov, A.; Zhylybayeva, N.; Azat, S.; Abdisattar, A.; Daulbayev, C. A Facile Synthesis of Graphite-Coated Amorphous SiO2 from Biosources as Anode Material for Libs. Mater. Today Commun. 2023, 34, 105136. [Google Scholar] [CrossRef]
- Nazhipkyzy, M.; Yeleuov, M.; Sultakhan, S.T.; Maltay, A.B.; Zhaparova, A.A.; Assylkhanova, D.D.; Nemkayeva, R.R. Electrochemical Performance of Chemically Activated Carbons from Sawdust as Supercapacitor Electrodes. Nanomaterials 2022, 12, 3391. [Google Scholar] [CrossRef]
- Lesbayev, B.; Auyelkhankyzy, M.; Ustayeva, G.; Yeleuov, M.; Rakhymzhan, N.; Maral, Y.; Tolynbekov, A. Modification of Biomass-Derived Nanoporous Carbon with Nickel Oxide Nanoparticles for Supercapacitor Application. J. Compos. Sci. 2023, 7, 20. [Google Scholar] [CrossRef]
- Abdisattar, A.; Yeleuov, M.; Daulbayev, C.; Askaruly, K.; Tolynbekov, A.; Taurbekov, A.; Prikhodko, N. Recent Advances and Challenges of Current Collectors for Supercapacitors. Electrochem. Commun. 2022, 142, 107373. [Google Scholar] [CrossRef]
- Askaruly, K.; Korobeinyk, A.V.; Azat, S.; Yeleuov, M.; Taurbekov, A.; Toshtay, K.; Tauanov, Z.; Su, X. The Electrochemical Behavior of Silica and Activated Carbon Materials Derived from the Rice Husk Waste for Li-Ion Cells. Diam. Relat. Mater. 2023, 133, 109759. [Google Scholar] [CrossRef]
- Jung, H.-G.; Venugopal, N.; Scrosati, B.; Sun, Y.-K. A high energy and power density hybrid supercapacitor based on an advanced carbon-coated Li4Ti5O12 electrode. J. Power Sources 2013, 221, 266e271. [Google Scholar] [CrossRef]
- Liang, J.; Wang, D. Design Rationale and Device Configuration of Lithium-Ion Capacitors. Adv. Energy Mater. 2022, 12, 2200920. [Google Scholar] [CrossRef]
- Thapliyal, V.; Alabduikarim, M.E.; Whelah, D.R.; Mainali, B.; Maxwell, J.L. A concise review of the Raman spectra of carbon allotropes. Diam. Relat. Mater. 2022, 127, 109180. [Google Scholar] [CrossRef]
- Ferrari, A.C.; Basko, D.M. Raman spectroscopy as a versatile tool for studying the properties of grapheme. Nat. Nanotechnol. 2013, 8, 235–246. [Google Scholar] [CrossRef]
- Eckmann, A.; Felten, A.; Mischenko, A.; Britnell, L.; Krupke, R.; Novoselov, K.S.; Casiraghi, C. Probing the Nature of Defects in Graphene by Raman Spectroscopy. Nano Lett. 2012, 12, 3925–3930. [Google Scholar] [CrossRef]
- Eckmann, A.; Felten, A.; Verzhbitskiy, I.; Davey, R.; Casiraghi, C. Raman study on defective graphene: Effect of the excitation energy, type, and amount of defects. Phys. Rev. B 2013, 88, 035426. [Google Scholar] [CrossRef]
- Wang, J.; Tu, J.; Lei, H.; Zhu, H. The effect of graphitization degree of carbonaceous material on the electrochemical performance for aluminum-ion batteries. RSC Adv. 2019, 9, 38990–38997. [Google Scholar] [CrossRef]
- Hardwick, L.J.; Hahn, M.; Ruch, P.; Holzapfel, M.; Scheifele, W.; Buqa, H.; Krumeich, F.; Novak, P.; Kotz, R. An in situ Raman study of the intercalation of supercapacitor-type electrolyte into microcrystalline graphite. Electrochim. Acta 2006, 52, 675–680. [Google Scholar] [CrossRef]
- Dassanayake, A.C.; Goncalves, A.A.S.; Fox, J.; Jaroniec, M. One-pot synthesis of activated porous graphitic carbon spheres with cobalt nanoparticles. Colloids Surf. A Physicochem. Eng. Asp. 2019, 582, 123884. [Google Scholar] [CrossRef]
- Zavidovskiy, I.A.; Streletskiy, O.A.; Nishchak, O.Y.; Haidarov, A.A.; Pavlikov, A.V. The influence of ion assistance energy on structural and optical properties of carbon-silver nanocomposites. Thin Solid Film. 2021, 738, 138966. [Google Scholar] [CrossRef]
- Gyergyek, S.; Chernyshova, E.; Böor, K.; Necemer, M.; Makovec, D. Magnetic carbon nanocomposites via the graphitization of glucose and their induction heating. J. Alloys Compd. 2023, 953, 170139. [Google Scholar] [CrossRef]
- Boudou, J.P.; Parent, P.; Suárez-García, F.; Villar-Rodil, S.; Martínez-Alonso, A.; Tascón, J.M.D. Nitrogen in Aramid-Based Activated Carbon Fibers by TPD, XPS and XANES. Carbon 2006, 44, 2452–2462. [Google Scholar] [CrossRef]
- Zhang, S.; Li, X.; Chen, J.P. An XPS Study for Mechanisms of Arsenate Adsorption onto a Magnetite-Doped Activated Carbon Fiber. J. Colloid Interface Sci. 2010, 343, 232–238. [Google Scholar] [CrossRef]
- Pietrzak, R. XPS Study and Physico-Chemical Properties of Nitrogen-Enriched Microporous Activated Carbon from High Volatile Bituminous Coal. Fuel 2009, 88, 1871–1877. [Google Scholar] [CrossRef]
- Shrestha, D.; Maensiri, S.; Wongpratat, U.; Lee, S.W.; Nyachhyon, A.R. Shorea robusta derived activated carbon decorated with manganese dioxide hybrid composite for improved capacitive behaviors. J. Environ. Chem. Eng. 2019, 7, 103227. [Google Scholar] [CrossRef]
- Saygili, H.; Guzel, F. Usability of activated carbon with well-developed mesoporous structure for the decontamination of malachite green from aquatic environments: Kinetic, equilibrium and regeneration studies. J. Porous Mater. 2018, 25, 477–488. [Google Scholar] [CrossRef]
- Lillo-Rodenas, M.A.; Cazorla-Amoros, D.; Linares-Solano, A. Understanding chemical reactions between carbons and NaOH and KOH: An insight into the chemical activation mechanism. Carbon 2003, 41, 267–275. [Google Scholar] [CrossRef]
- Caballero, A.; Hernán, L.; Morales, J. Limitations of Disordered Carbons Obtained from Biomass as Anodes for Real Lithium-Ion Batteries. ChemSusChem 2011, 4, 658–663. [Google Scholar] [CrossRef]
- Rong, C.; Chen, S.; Han, J.; Zhang, K.; Wang, D.; Mi, X.; Wei, X. Hybrid supercapacitors integrated rice husk based activated carbon with LiMn2O4. J. Renew. Sustain. Energy 2015, 7, 023104. [Google Scholar] [CrossRef]
- Barpanda, P.; Fanchini, G.; Amatucci, G.G. Structure, surface morphology and electrochemical properties of brominated activated carbons. Carbon 2011, 49, 2538–2548. [Google Scholar] [CrossRef]
- Lamb, J.J.; Burheim, O.S. Lithium-Ion Capacitors: A Review of Design and Active Materials. Energies 2021, 14, 979. [Google Scholar] [CrossRef]
- Liu, B.; Chen, J.; Yang, B.; Liu, L.; Sun, Y.; Hou, R.; Lin, Z.; Yan, Z. Boosting the performance of lithium metal capacitors with a Li composite anode. J. Mater. Chem. A 2021, 9, 10722–10730. [Google Scholar] [CrossRef]
- Zhang, X.Q.; Chen, X.; Cheng, X.-B.; Li, B.-Q.; Shen, X.; Yan, C.; Huang, J.-Q.; Zhang, Q. Highly Stable Lithium Metal Batteries Enabled by Regulating the Solvation of Lithium Ions in Nonaqueous Electrolytes. Angew. Chem. 2018, 57, 5301–5305. [Google Scholar] [CrossRef]
- Liu, S.; Ji, X.; Piao, N.; Chen, J.; Eidson, N.; Xu, J.; Wang, P.; Chen, L.; Zhang, J.; Deng, T.; et al. An Inorganic-Rich Solid Electrolyte Interphase for Advanced Lithium-Metal Batteries in Carbonate Electrolytes. Angew. Chem. 2021, 60, 3661–3671. [Google Scholar] [CrossRef]
- Piao, N.; Liu, S.; Zhang, B.; Ji, X.; Fan, X.; Wang, L.; Wang, P.-F.; Jin, T.; Liu, S.; Yang, H.; et al. Lithium Metal Batteries Enabled by Synergetic Additives in Commercial Carbonate Electrolytes. ACS Energy Lett. 2021, 6, 1839–1848. [Google Scholar] [CrossRef]
- Markevich, E.; Salitra, G.; Chesneau, F.; Schmidt, M.; Aurbach, D. Very Stable Lithium Metal Stripping–Plating at a High Rate and High Areal Capacity in Fluoroethylene Carbonate-Based Organic Electrolyte Solution. ACS Energy Lett. 2017, 2, 1321–1326. [Google Scholar] [CrossRef]
- Zhang, X.-Q.; Cheng, X.-B.; Chen, X.; Yan, C.; Zhang, Q. Fluoroethylene Carbonate Additives to Render Uniform Li Deposits in Lithium Metal Batteries. Adv. Funct. Mater. 2017, 27, 1605989. [Google Scholar] [CrossRef]
- Weber, R.; Genovese, M.; Louli, A.J.; Hames, S.; Martin, C.; Hill, I.G.; Dahn, J.R. Long cycle life and dendrite-free lithium morphology in anode-free lithium pouch cells enabled by a dual-salt liquid electrolyte. Nat. Energy 2019, 4, 683–689. [Google Scholar] [CrossRef]
- Kato, K.; Rodrigues, M.-T.F.; Babu, G.; Ajayan, P.M. Revealing anion chemistry above 3V in Li-ion capacitors. Electrochim. Acta 2019, 324, 134871. [Google Scholar] [CrossRef]
- Zhang, W.; Zhang, F.; Zhang, P.; Liang, S.; Shi, Z. N-Propyl-N-Methylpyrrolidinium Difluoro(oxalato)borate as a Novel Electrolyte for High-Voltage Supercapacitor. Front. Chem. 2019, 7, 664. [Google Scholar] [CrossRef] [PubMed]
- Yeleuov, M.; Seidl, C.; Temirgaliyeva, T.; Taurbekov, A.; Prikhodko, N.; Lesbayev, B.; Sultanov, F.; Daulbayev, C.; Kumekov, S. Modified Activated Graphene-Based Carbon Electrodes from Rice Husk for Supercapacitor Applications. Energies 2020, 13, 4943. [Google Scholar] [CrossRef]
- Yeleuov, M.; Daulbayev, C.; Taurbekov, A.; Abdisattar, A.; Ebrahim, R.; Kumekov, S.; Prikhodko, N.; Lesbayev, B.; Batyrzhan, K. Synthesis of Graphene-like Porous Carbon from Biomass for Electrochemical Energy Storage Applications. Diam. Relat. Mater. 2021, 119, 108560. [Google Scholar] [CrossRef]
- Askaruly, K.; Azat, S.; Sartova, Z.; Yeleuov, M.; Kerimkulova, A.; Bekseitova, K. Obtaining And Characterization Of Amorphous Silica From Rice Husk. J. Chem. Technol. Metall. 2020, 55, 88–97. [Google Scholar]
- Sani, N.S.A.; Ang, W.L.; Mohammad, A.W.; Nouri, A.; Mahmoudi, E. Sustainable synthesis of graphene sand composite from waste cooking oil for dye removal. Sci. Rep. 2023, 13, 1931. [Google Scholar] [CrossRef]
- Gupta, S.S.; Sreeprasad, T.S.; Maliyekkal, S.M.; Das, S.K.; Pradeep, T. Graphene from Sugar and its Application in Water Purification. CS Appl. Mater. Interfaces 2012, 4, 4156–4163. [Google Scholar] [CrossRef]
- Daulbayev, C.; Sultanov, F.; Korobeinyk, A.V.; Yeleuov, M.; Taurbekov, A.; Bakbolat, B.; Umirzakov, A.; Baimenov, A.; Daulbayev, O. Effect of Graphene Oxide/Hydroxyapatite Nanocomposite on Osteogenic Differentiation and Antimicrobial Activity. Surf. Interfaces 2022, 28, 101683. [Google Scholar] [CrossRef]
- Daulbayev, C.; Sultanov, F.; Korobeinyk, A.V.; Yeleuov, M.; Azat, S.; Bakbolat, B.; Umirzakov, A.; Mansurov, Z. Bio-Waste-Derived Few-Layered Graphene/SrTiO3/PAN as Efficient Photocatalytic System for Water Splitting. Appl. Surf. Sci. 2021, 549, 149176. [Google Scholar] [CrossRef]


Disclaimer/Publisher’s Note: The statements, opinions and data contained in all publications are solely those of the individual author(s) and contributor(s) and not of MDPI and/or the editor(s). MDPI and/or the editor(s) disclaim responsibility for any injury to people or property resulting from any ideas, methods, instructions or products referred to in the content. |
© 2023 by the authors. Licensee MDPI, Basel, Switzerland. This article is an open access article distributed under the terms and conditions of the Creative Commons Attribution (CC BY) license (https://creativecommons.org/licenses/by/4.0/).
Share and Cite
Yerdauletov, M.S.; Nazarov, K.; Mukhametuly, B.; Yeleuov, M.A.; Daulbayev, C.; Abdulkarimova, R.; Yskakov, A.; Napolskiy, F.; Krivchenko, V. Characterization of Activated Carbon from Rice Husk for Enhanced Energy Storage Devices. Molecules 2023, 28, 5818. https://doi.org/10.3390/molecules28155818
Yerdauletov MS, Nazarov K, Mukhametuly B, Yeleuov MA, Daulbayev C, Abdulkarimova R, Yskakov A, Napolskiy F, Krivchenko V. Characterization of Activated Carbon from Rice Husk for Enhanced Energy Storage Devices. Molecules. 2023; 28(15):5818. https://doi.org/10.3390/molecules28155818
Chicago/Turabian StyleYerdauletov, Meir S., Kuanysh Nazarov, Bagdaulet Mukhametuly, Mukhtar A. Yeleuov, Chingis Daulbayev, Roza Abdulkarimova, Almas Yskakov, Filipp Napolskiy, and Victor Krivchenko. 2023. "Characterization of Activated Carbon from Rice Husk for Enhanced Energy Storage Devices" Molecules 28, no. 15: 5818. https://doi.org/10.3390/molecules28155818
APA StyleYerdauletov, M. S., Nazarov, K., Mukhametuly, B., Yeleuov, M. A., Daulbayev, C., Abdulkarimova, R., Yskakov, A., Napolskiy, F., & Krivchenko, V. (2023). Characterization of Activated Carbon from Rice Husk for Enhanced Energy Storage Devices. Molecules, 28(15), 5818. https://doi.org/10.3390/molecules28155818