
(1-(4-(5-Phenyl-1,3,4-oxadiazol-2-yl)phenyl)-1H-1,2,3-triazol-4-yl)-methylenyls α,ω-Bisfunctionalized 3- and 4-PEG: Synthesis and Photophysical Studies

 , , , ,
  , and
, and
Abstract
1. Introduction
2. Results
2.1. Synthesis
2.2. Photophysical Studies

| Probes | λabsmax, nm (εM, 105 M−1 cm−1) 1 | λemmax, nm 2 | Stokes Shift, nm | τav, ns 3 | Φf, % 4 |
|---|---|---|---|---|---|
| 3a | 216 (0.308) 299 (0.915) | 335, 350, 364 | 51 | 1.08 | 61.7 |
| 3b | 216 (0.360) 300 (0.835) | 335, 350, 364 | 50 | 1.29 | 86.6 |
| POPOP 5 | 348, 361, 379 | 393, 416, 438 | - | - | 96.0 |
2.3. DFT Calculations
2.4. Recognition of Hg2+ via Fluorescence “Turn Off” Process
3. Materials and Methods
Chemical Experiment
4. Conclusions
Supplementary Materials
Author Contributions
Funding
Institutional Review Board Statement
Informed Consent Statement
Data Availability Statement
Acknowledgments
Conflicts of Interest
Sample Availability
References
- Escamilla, G.H.; Newkome, G.R. Bolaamphiphiles: Golf balls to fibers. In Organic Synthesis Highlights III; John Wiley & Sons, Inc.: Hoboken, NJ, USA, 2008; pp. 382–390. [Google Scholar] [CrossRef]
- Smith, T.J.; Wang, C.; Abbott, N.L. Redox-triggered mixing and demixing of surfactants within assemblies formed in solution and at surfaces. J. Colloid Interface Sci. 2017, 502, 122–133. [Google Scholar] [CrossRef] [PubMed]
- Van Bogaert, I.N.A.; Buyst, D.; Martins, J.C.; Roelants, S.L.K.W.; Soetaert, W.K. Synthesis of bolaform biosurfactants by an engineered Starmerella bombicola yeast. Biotechnol. Bioeng. 2016, 113, 2644–2651. [Google Scholar] [CrossRef]
- Kang, Y.; Cai, Z.; Tang, X.; Liu, K.; Wang, G.; Zhang, X. An Amylase-Responsive Bolaform Supra-Amphiphile. ACS Appl. Mater. Interfaces 2016, 8, 4927–4933. [Google Scholar] [CrossRef]
- Cuvier, A.-S.; Berton, J.; Stevens, C.V.; Fadda, G.C.; Babonneau, F.; Van Bogaert, I.N.A.; Soetaert, W.; Pehau-Arnaudet, G.; Baccile, N. pH-triggered formation of nanoribbons from yeast-derived glycolipid biosurfactants. Soft Matter 2014, 10, 3950–3959. [Google Scholar] [CrossRef]
- Yao, Y.; Chi, X.; Zhou, Y.; Huang, F. A bola-type supra-amphiphile constructed from a water-soluble pillar [5]arene and a rod–coil molecule for dual fluorescent sensing. Chem. Sci. 2014, 5, 2778–2782. [Google Scholar] [CrossRef]
- Matsui, H.; Pan, S.; Douberly, G.E. Fabrication of Nanocrystal Tube Using Peptide Tubule as Template and Its Application as Signal-Enhancing Cuvette. J. Phys. Chem. B 2001, 105, 1683–1686. [Google Scholar] [CrossRef]
- Liu, B.; Gaylord, B.S.; Wang, S.; Bazan, G.C. Effect of chromophore-charge distance on the energy transfer properties of water-soluble conjugated oligomers. J. Am. Chem. Soc. 2003, 125, 6705–6714. [Google Scholar] [CrossRef]
- Mathis, J.A.; McCord, B.R. The analysis of high explosives by liquid chromatography/electrospray ionization mass spectrometry: Multiplexed detection of negative ion adducts. Rapid Commun. Mass Spectrom. 2005, 19, 99–104. [Google Scholar] [CrossRef]
- Krull, I.S.; Davis, E.A.; Santasania, C.; Kraus, S.; Basch, A.; Bamberger, Y. Trace Analysis of Explosives by HPLC-Electron Capture Detection (HPLC-ECD) 18. Anal. Lett. 1981, 14, 1363–1376. [Google Scholar] [CrossRef]
- Forbes, T.P.; Sisco, E. Recent advances in ambient mass spectrometry of trace explosives. Analyst 2018, 143, 1948–1969. [Google Scholar] [CrossRef]
- Yinon, J. Detection of explosives by mass spectrometry. In Counterterrorist Detection Techniques of Explosives; Elsevier: Amsterdam, The Netherlands, 2007; pp. 41–59. ISBN 9780444522047. [Google Scholar]
- Pellegrino, P.M.; Holthoff, E.L.; Marcus, L.S. Standoff Photoacoustic Spectroscopy of Explosives. Appl. Spectrosc. 2017, 71, 833–838. [Google Scholar]
- O’Mahony, A.M.; Wang, J. Nanomaterial-based electrochemical detection of explosives: A review of recent developments. Anal. Methods 2013, 5, 4296–4309. [Google Scholar] [CrossRef]
- Dettlaff, A.; Jakóbczyk, P.; Ficek, M.; Wilk, B.; Szala, M.; Wojtas, J.; Ossowski, T.; Bogdanowicz, R. Electrochemical determination of nitroaromatic explosives at boron-doped diamond/graphene nanowall electrodes: 2,4,6-trinitrotoluene and 2,4,6-trinitroanisole in liquid effluents. J. Hazard. Mater. 2020, 387, 121672. [Google Scholar] [CrossRef] [PubMed]
- Yang, Y.; Mori, A.; Hashidzume, A. Emission properties of diblock copolymers composed of poly(ethylene glycol) and dense 1,2,3-triazole blocks. Polymers 2019, 11, 1086. [Google Scholar] [CrossRef] [PubMed]
- Mandal, A.; Patel, B.K. Molecular structures and fluorescence property of Zn(II), Cd(II) complexes of 3-pyridyl-5-aryl-(1H)-1,2,4-triazoles. Polyhedron 2017, 132, 112–122. [Google Scholar] [CrossRef]
- Behl, G.; Sikka, M.; Chhikara, A.; Chopra, M. PEG-coumarin based biocompatible self-assembled fluorescent nanoaggregates synthesized via click reactions and studies of aggregation behavior. J. Colloid Interface Sci. 2014, 416, 151–160. [Google Scholar] [CrossRef]
- Östmark, H.; Wallin, S.; Ang, H.G. Vapor pressure of explosives: A critical review. Propellants Explos. Pyrotech. 2012, 37, 12–23. [Google Scholar] [CrossRef]
- Salinas, Y.; Mañez, R.M.; Marcos, M.D.; Sancenón, F.; Costero, A.M.; Parra, M.; Gil, S. Optical chemosensors and reagents to detect explosives. Chem. Soc. Rev. 2012, 41, 1261–1296. [Google Scholar] [CrossRef]
- Kutonova, K.V.; Trusova, M.E.; Postnikov, P.; Filimonov, V.D.; Parello, J. A Simple and Effective Synthesis of Aryl Azides via Arenediazonium Tosylates. Synthesis 2013, 45, 2706–2710. [Google Scholar] [CrossRef]
- Mohammed, M.S.; Kovalev, I.S.; Slovesnova, N.V.; Sadieva, L.K.; Platonov, V.A.; Novikov, A.S.; Santra, S.; Morozova, J.E.; Zyryanov, G.V.; Charushin, V.N.; et al. Polyaromatic Hydrocarbon (PAH)-Based Aza-POPOPs: Synthesis, Photophysical Studies, and Nitroanalyte Sensing Abilities. Int. J. Mol. Sci. 2023, 24, 10084. [Google Scholar] [CrossRef]
- Deraedt, C.; Salmon, L.; Ruiz, J.; Astruc, D. Efficient click-polymer-stabilized palladium nanoparticle catalysts for Suzuki-Miyaura reactions of bromoarenes and reduction of 4-nitrophenol in aqueous solvents. Adv. Synth. Catal. 2013, 355, 2992–3001. [Google Scholar] [CrossRef]
- Lakowicz, J.R. Principles of Fluorescence Spectroscopy; Springer: Boston, MA, USA, 2006; ISBN 978-0-387-31278-1. [Google Scholar]
- El-Daly, S.A.; El-Azim, S.A.; Elmekawey, F.M.; Elbaradei, B.Y.; Shama, S.A.; Asiri, A.M. Photophysical Parameters, Excitation Energy Transfer, and Photoreactivity of 1,4-Bis(5-phenyl-2-oxazolyl)benzene (POPOP) Laser Dye. Int. J. Photoenergy 2012, 2012, 458126. [Google Scholar] [CrossRef]
- Zyryanov, G.V.; Kopchuk, D.S.; Kovalev, I.S.; Nosova, E.V.; Rusinov, V.L.; Chupakhin, O.N. Chemosensors for detection of nitroaromatic compounds (explosives). Russ. Chem. Rev. 2014, 83, 783–819. [Google Scholar] [CrossRef]
- Shrivastava, A.; Gupta, V. Methods for the determination of limit of detection and limit of quantitation of the analytical methods. Chron. Young Sci. 2011, 2, 21. [Google Scholar] [CrossRef]
- Sun, X.; Wang, Y.; Lei, Y. Fluorescence based explosive detection: From mechanisms to sensory materials. Chem. Soc. Rev. 2015, 44, 8019–8061. [Google Scholar] [CrossRef]
- De Silva, A.P.; Moody, T.S.; Wright, G.D. Fluorescent PET (Photoinduced Electron Transfer) sensors as potent analytical tools. Analyst 2009, 134, 2385–2393. [Google Scholar] [CrossRef]
- Genovese, D.; Cingolani, M.; Rampazzo, E.; Prodi, L.; Zaccheroni, N. Static quenching upon adduct formation: A treatment without shortcuts and approximations. Chem. Soc. Rev. 2021, 50, 8414–8427. [Google Scholar] [CrossRef]
- Agudelo-Morales, C.E.; Silva, O.F.; Galian, R.E.; Pérez-Prieto, J. Nitroanilines as quenchers of pyrene fluorescence. ChemPhysChem 2012, 13, 4195–4201. [Google Scholar] [CrossRef]
- Frisch, M.J.; Trucks, G.W.; Schlegel, H.B.; Scuseria, G.E.; Robb, M.A.; Cheeseman, J.R.; Scalmani, G.; Barone, V.; Mennucci, B.; Petersson, G.A.; et al. Gaussian 09, Revision C.01; Gaussian Inc.: Wallingford, CT, USA, 2010. [Google Scholar]
- Marenich, A.V.; Cramer, C.J.; Truhlar, D.G. Universal solvation model based on solute electron density and on a continuum model of the solvent defined by the bulk dielectric constant and atomic surface tensions. J. Phys. Chem. B 2009, 113, 6378–6396. [Google Scholar] [CrossRef]
- Lu, T.; Chen, F. Multiwfn: A multifunctional wavefunction analyzer. J. Comput. Chem. 2012, 33, 580–592. [Google Scholar] [CrossRef]
- Lu, T.; Wen, Z.; Wang, L.; He, X.; Yuan, Y.; Wang, M.; Zhao, Y.; Li, M.; Pu, X.; Xu, T. Quantitative determination on binary-component polymer bonded explosives: A joint study of ultraviolet spectrophotometry and multivariate calibration methods. Chemom. Intell. Lab. Syst. 2015, 147, 131–138. [Google Scholar] [CrossRef]
- Abel, A.S.; Averin, A.D.; Cheprakov, A.V.; Roznyatovsky, V.A.; Denat, F.; Bessmertnykh-Lemeune, A.; Beletskaya, I.P. 6-Polyamino-substituted quinolines: Synthesis and multiple metal (CuII, HgII and ZnII) monitoring in aqueous media. Org. Biomol. Chem. 2019, 17, 4243–4260. [Google Scholar] [CrossRef] [PubMed]
- Argent, S.P.; Adams, H.; Riis-Johannessen, T.; Jeffery, J.C.; Harding, L.P.; Clegg, W.; Harrington, R.W.; Ward, M.D. Complexes of Ag(I), Hg(I) and Hg(II) with multidentate pyrazolyl-pyridine ligands: From mononuclear complexes to coordination polymers via helicates, a mesocate, a cage and a catenate. Dalton Trans. 2006, 42, 4996–5013. [Google Scholar] [CrossRef] [PubMed]
- Zapata, F.; Caballero, A.; Espinosa, A.; Tárraga, A.; Molina, P. A Selective Redox and Chromogenic Probe for Hg(II) in Aqueous Environment Based on a Ferrocene−Azaquinoxaline Dyad. Inorg. Chem. 2009, 48, 11566–11575. [Google Scholar] [CrossRef]
- Costero, A.M.; Andreu, C.; Monrabal, E.; Tortajada, A.; Ochando, L.E.; Amigó, J.M. Bis-cyclic Crown Ether Derived from Biphenyl. Different Behaviour in Complexing Hg(SCN) 2 and Hg(CN) 2. Supramol. Chem. 1998, 9, 211–219. [Google Scholar] [CrossRef]
- Williams, N.J.; Hancock, R.D.; Riebenspies, J.H.; Fernandes, M.; De Sousa, A.S. Complexation of mercury(I) and mercury(ii) by 18-crown-6: Hydrothermal synthesis of the mercuric nitrite complex. Inorg. Chem. 2009, 48, 11724–11733. [Google Scholar] [CrossRef]
- Mostafa, M.M.; Gomaa, E.A.H.; Mostafa, M.A.; El-Dossouki, F.I. Complexes of Some Crown Ethers with Hg(II) Chloride, Bromide, Iodide and Cyanide. Sythesis React. Inorg. Met. Chem. 2000, 30, 157–174. [Google Scholar] [CrossRef]


| Probes | Analyte | KSV, M−1 | R2 | LOD × 10−7, M |
|---|---|---|---|---|
| 3a | DNT | 0.597 × 10⁴ | 0.984 | 13.37 |
| TNT | 0.712 × 10⁴ | 0.995 | 10.46 | |
| PETN | 0.418 × 10⁴ | 0.973 | 4.16 | |
| 3b | DNT | 0.772 × 10⁴ | 0.992 | 15.46 |
| TNT | 0.767 × 10⁴ | 0.995 | 10.97 | |
| PETN | 0.468 × 10⁴ | 0.992 | 3.04 |
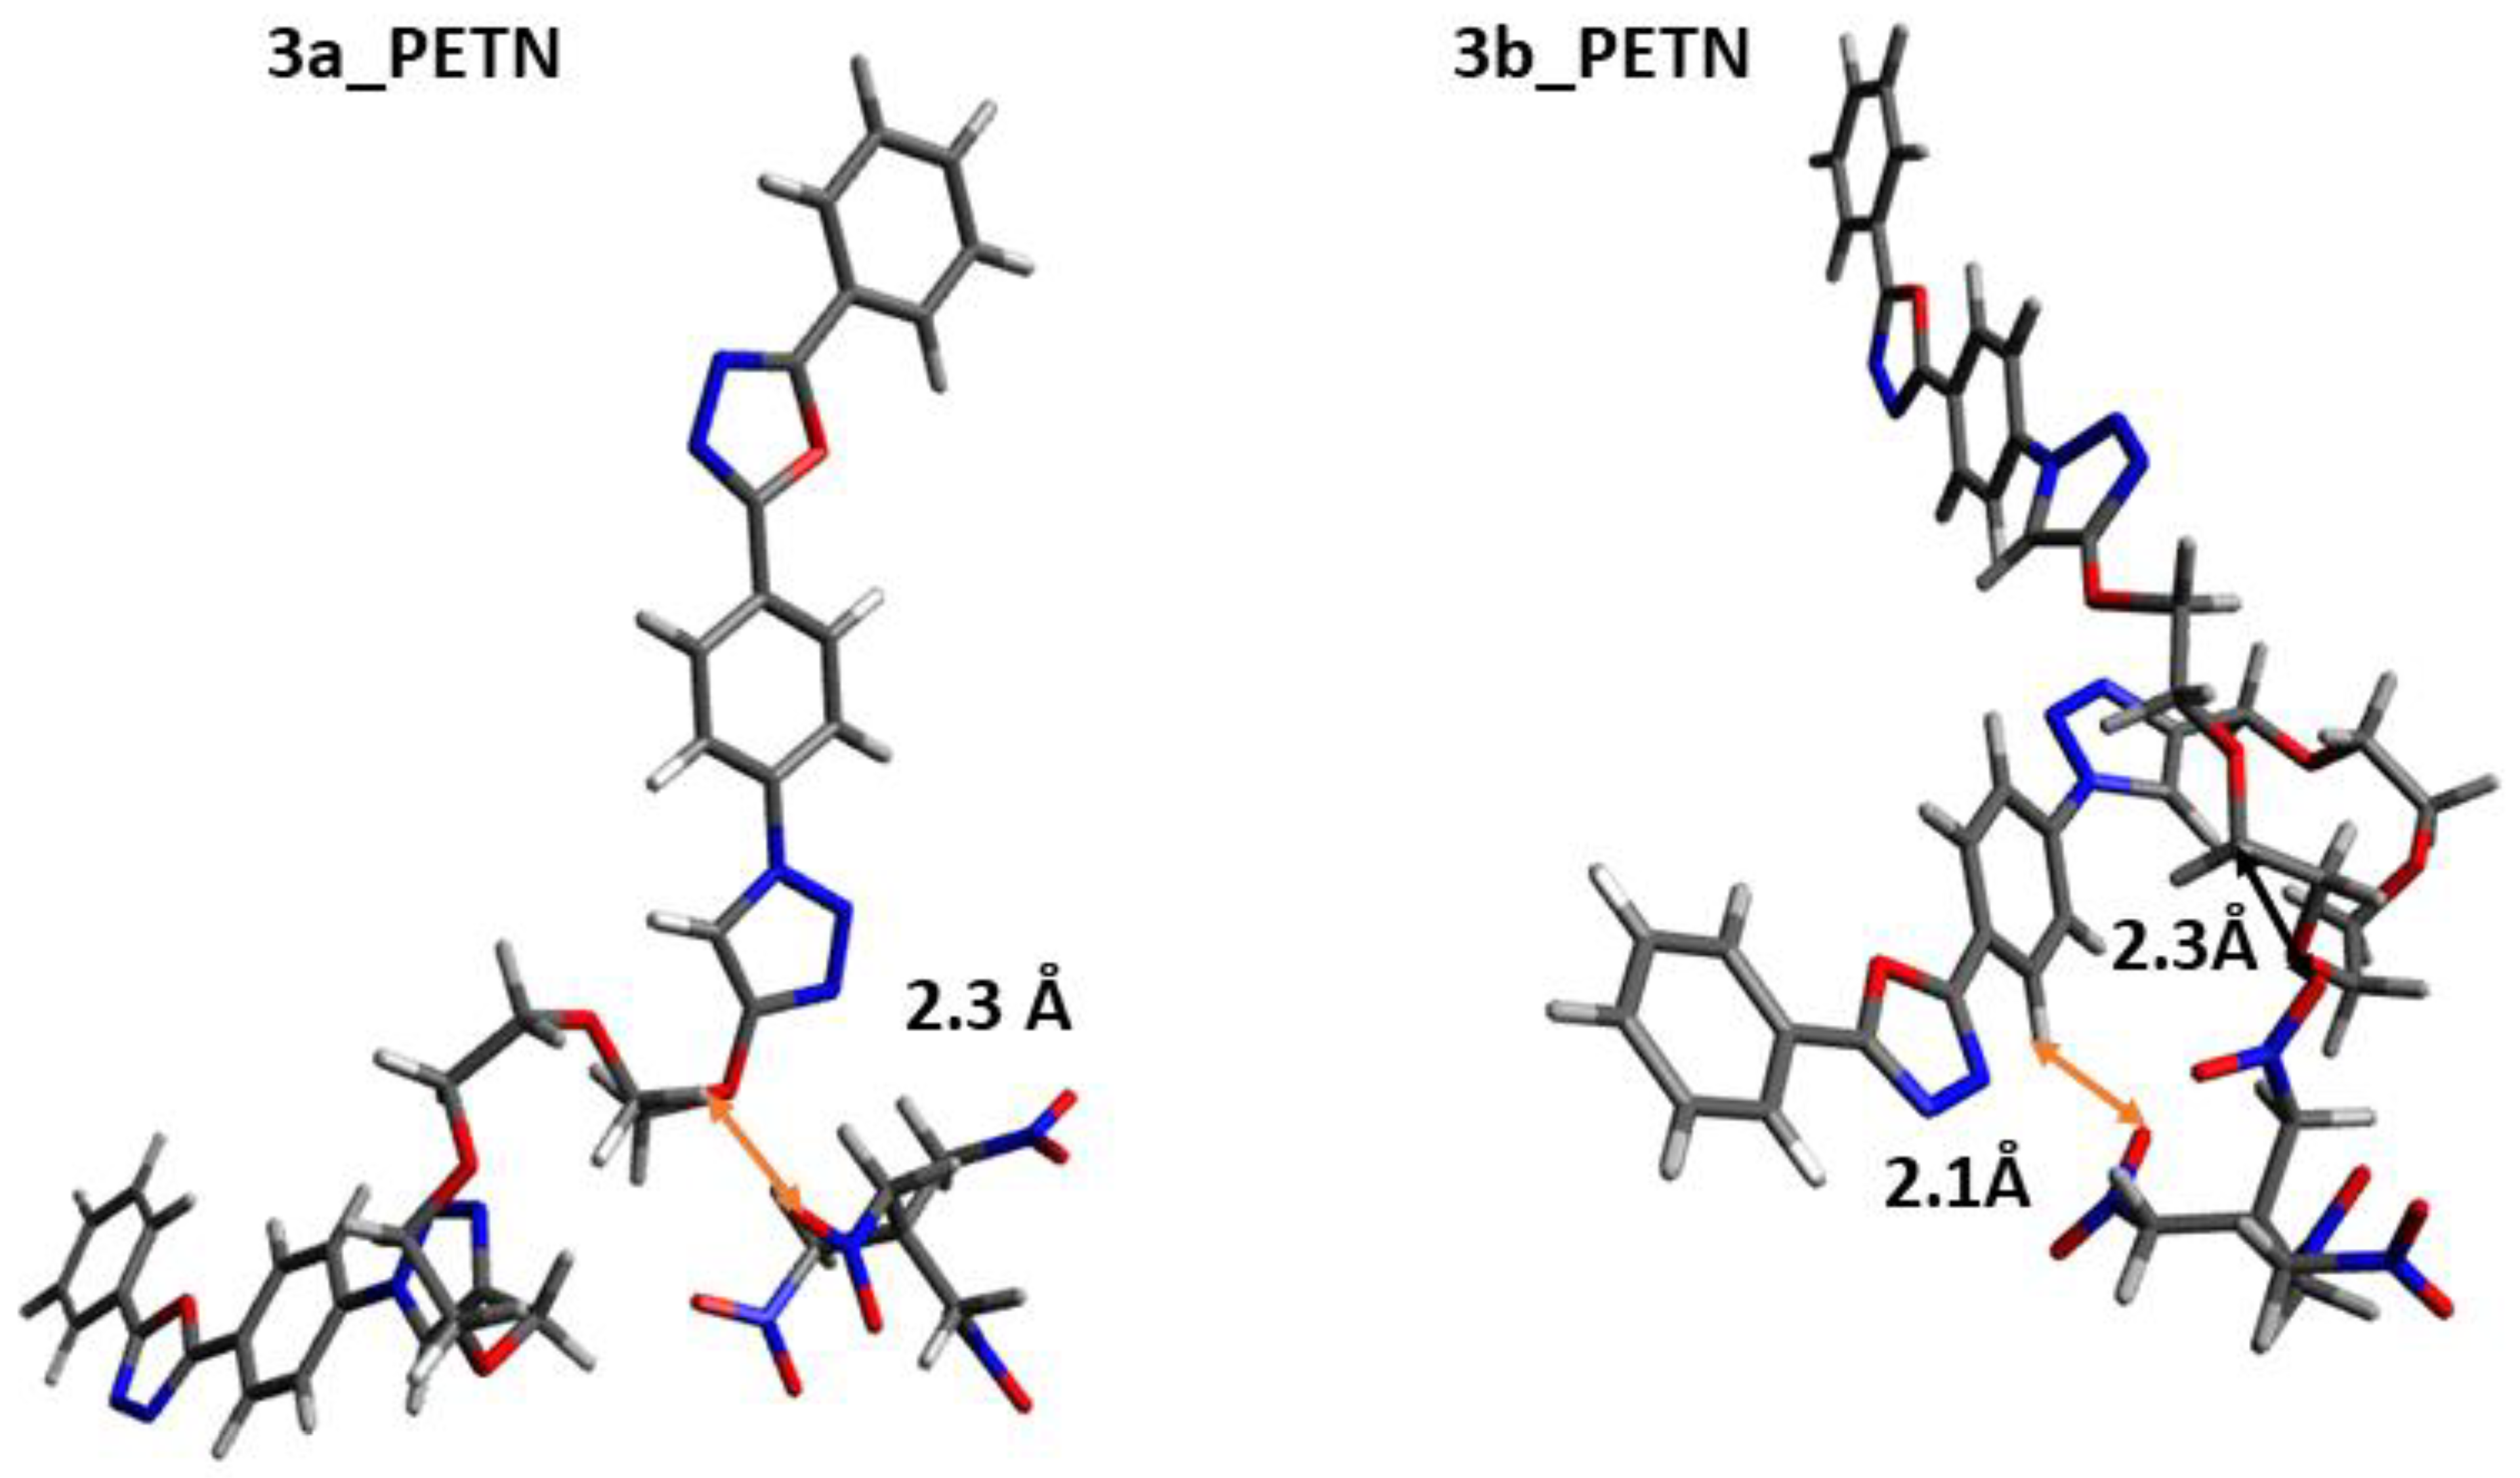
| Probes | Distance, Å | DNT | TNT | PETN |
|---|---|---|---|---|
| 3a | d1H–O | 2.3 | 2.5 | 2.3 |
| 3b | d2H–O | 3.5 | 2.2 | - |
| d3H–O | 2.2 | 3.5 | 2.1 | |
| d1H–O | - | - | 2.3 |
| Model Structure | G, Hartree |
|---|---|
| TNT | −884.593347 |
| DNT | −680.175562 |
| PETN | −1015.221999 |
| 3a | −2503.482074 |
| 3b | −2657.178013 |
| 3a···TNT | −3388.042003 |
| 3a···DNT | −3183.635874 |
| 3a···PETN | −3518.681266 |
| 3b···TNT | −3541.754970 |
| 3b···DNT | −3337.325579 |
| 3b···PETN | −3672.378507 |
| Compound | HOMO, eV | LUMO, eV | ΔE, eV | µ0, D |
|---|---|---|---|---|
| 3a | −6.15 | −2.35 | 3.80 | 3.00 |
| 3b | −6.16 | −2.36 | 3.80 | 3.06 |
| DNT | −7.80 | −3.00 | 4.80 | 3.08 |
| TNT | −8.31 | −3.39 | 4.92 | 1.76 |
| PETN | −8.73 | −2.91 | 5.82 | 0.0033 |
| Probes | KSV, M−1 | R2 | LOD, M |
|---|---|---|---|
| 3a | 0.771 × 10⁴ | 0.966 | 2.59 × 10⁻⁶ |
| 3b | 0.155 × 10⁴ | 0.991 | 1.86 × 10⁻⁴ |
Disclaimer/Publisher’s Note: The statements, opinions and data contained in all publications are solely those of the individual author(s) and contributor(s) and not of MDPI and/or the editor(s). MDPI and/or the editor(s) disclaim responsibility for any injury to people or property resulting from any ideas, methods, instructions or products referred to in the content. |
© 2023 by the authors. Licensee MDPI, Basel, Switzerland. This article is an open access article distributed under the terms and conditions of the Creative Commons Attribution (CC BY) license (https://creativecommons.org/licenses/by/4.0/).
Share and Cite
Mohammed, M.S.; Kovalev, I.S.; Slovesnova, N.V.; Sadieva, L.K.; Platonov, V.A.; Kim, G.A.; Aluru, R.; Novikov, A.S.; Taniya, O.S.; Charushin, V.N. (1-(4-(5-Phenyl-1,3,4-oxadiazol-2-yl)phenyl)-1H-1,2,3-triazol-4-yl)-methylenyls α,ω-Bisfunctionalized 3- and 4-PEG: Synthesis and Photophysical Studies. Molecules 2023, 28, 5256. https://doi.org/10.3390/molecules28135256
Mohammed MS, Kovalev IS, Slovesnova NV, Sadieva LK, Platonov VA, Kim GA, Aluru R, Novikov AS, Taniya OS, Charushin VN. (1-(4-(5-Phenyl-1,3,4-oxadiazol-2-yl)phenyl)-1H-1,2,3-triazol-4-yl)-methylenyls α,ω-Bisfunctionalized 3- and 4-PEG: Synthesis and Photophysical Studies. Molecules. 2023; 28(13):5256. https://doi.org/10.3390/molecules28135256
Chicago/Turabian StyleMohammed, Mohammed S., Igor S. Kovalev, Natalya V. Slovesnova, Leila K. Sadieva, Vadim A. Platonov, Grigory A. Kim, Rammohan Aluru, Alexander S. Novikov, Olga S. Taniya, and Valery N. Charushin. 2023. "(1-(4-(5-Phenyl-1,3,4-oxadiazol-2-yl)phenyl)-1H-1,2,3-triazol-4-yl)-methylenyls α,ω-Bisfunctionalized 3- and 4-PEG: Synthesis and Photophysical Studies" Molecules 28, no. 13: 5256. https://doi.org/10.3390/molecules28135256
APA StyleMohammed, M. S., Kovalev, I. S., Slovesnova, N. V., Sadieva, L. K., Platonov, V. A., Kim, G. A., Aluru, R., Novikov, A. S., Taniya, O. S., & Charushin, V. N. (2023). (1-(4-(5-Phenyl-1,3,4-oxadiazol-2-yl)phenyl)-1H-1,2,3-triazol-4-yl)-methylenyls α,ω-Bisfunctionalized 3- and 4-PEG: Synthesis and Photophysical Studies. Molecules, 28(13), 5256. https://doi.org/10.3390/molecules28135256