Abstract
The incorporation of graphene with metal oxide has been widely explored in various fields, including energy storage devices, optical applications, biomedical applications, and water remediation. This research aimed to assess the impact of reduced graphene oxide (RGO) doping on the photocatalytic and anticancer properties of In2O3 nanoparticles. Pure and In2O3/RGO nanocomposites were effectively synthesized using the single-step microwave hydrothermal process. XRD, TEM, SEM, EDX, XPS, Raman, UV–Vis, and PL spectroscopy were carefully utilized to characterize the prepared samples. XRD data showed that synthesized In2O3 nanoparticles had high crystallinity with a decreased crystal size after RGO doping. TEM and SEM images revealed that the In2O3 NPs were spherical and uniformly embedded onto the surface of RGO sheets. Elemental analysis of In2O3/RGO NC confirmed the presence of In, O, and C without impurities. Raman analysis indicated the successful fabrication of In2O3 onto the RGO surface. Uv–Vis analysis showed that the band gap energy was changed with RGO addition. Raman spectra confirmed that In2O3 nanoparticles were successfully anchored onto the RGO sheet. PL results indicated that the prepared In2O3/RGO NCs can be applied to enhance photocatalytic activity and biomedical applications. In the degradation experiment, In2O3/RGO NCs exhibited superior photocatalytic activity compared to that of pure In2O3. The degradation efficiency of In2O3/RGO NCs for MB dye was up to 90%. Biological data revealed that the cytotoxicity effect of In2O3/RGO NCs was higher than In2O3 NPs in human colorectal (HCT116) and liver (HepG2) cancer cells. Importantly, the In2O3/RGO NCs exhibited better biocompatibility against human normal peripheral blood mononuclear cells (PBMCs). All the results suggest that RGO addition improves the photocatalytic and anticancer activity of In2O3 NPs. This study highlights the potential of In2O3/RGO NCs as an efficient photocatalyst and therapeutic material for water remediation and biomedicine.
1. Introduction
Nanocomposites (NCs) have shown promising potential in medical applications, including antibacterial, cancer diagnostics, and therapy [1,2,3,4]. Among these nanocomposites (NCs), nanomaterials based on metal oxide nanoparticles (NPs) are attracting interest in a number of areas of science and technology due to their desirable properties, such as being low-cost, non-toxic, renewable, and excellent semiconductors [5,6]. Furthermore, graphene is a sp2-bonded hexagonal network of carbon atoms [7]. It has excellent properties such as a high specific surface area, favorable electron transportation, tunable band gap, good thermal and electrical conductivity, and biocompatibility [8,9]. On the other hand, graphene oxide (GO) and reduced oxide (RGO) have attracted significant attention due to their unique properties, such as high surface area, good electrical conductivity, and excellent chemical stability [10,11].
Several studies have investigated the photocatalytic degradation of methylene blue using metal oxide nanoparticles (NPs). For instance, [12] reported a significant degradation of MB under visible light irradiation using TiO2 NPs. Similarly, other metal oxide nanoparticles, such as ZnO NPs have also exhibited promising photocatalytic properties for MB degradation [13]. The cytotoxicity of metal oxide NPs towards various cancer cell lines, including breast, lung, prostate, and liver cancer have been reported in numerous studies. For example, Kokila et al. [14] showed that silver oxide (Ag2O) NPs exhibited strong anti-cancer effects on lung cancer cells.
The incorporation of metal oxide NPs into graphene has been achieved through various approaches to synthesize novel nanocomposites (NCs), which solve certain challenges associated with pure metal oxide NPs [15,16]. For example, ZnO/RGO NCs [17], ZnO-MoS2/RGO NCs [18], MoS2-Fe2O3/RGO NCs [19], Ag/ZnO/RGO NCs [20], and Ce/ZnO/RGO NCs [21] have been successfully prepared and have potential in biomedicine and environmental remediation applications. Different approaches including chemical, physical, and biological methods have been used to synthesize metal oxide NPs with RGO as NCs [22,23,24]. Bibi et al. [25] reported the synthesis of Fe2O3-TiO2/RGO NCs through a hydrothermal approach, which demonstrated remarkable methyl blue degradation capabilities due to the synergistic effect between Fe2O3-TiO2NPs and RGO. Indium oxide nanoparticles (In2O3 NPs) based on graphene have been extensively studied for potential applications such as high-performance supercapacitors [26,27], gas sensing [28], energy storage devices [29], biomedicine [30], and water remediation [31]. For example, Devi and Singh [32] reported that doping RGO in In2O3 plays a role in improving the photocatalytic performance due to its surface area and improved charge separation.
This study aimed to enhance the properties of In2O3 NPs by RGO doping on their photocatalytic and anticancer performance. XRD, SEM, TEM, EDX, XPS, Raman scattering, UV–Vis, and PL spectroscopy were used to characterize the synthesized samples. The results show that In2O3/RGO NCs exhibited superior photocatalytic activity compared to pure In2O3 NPs. Cytotoxicity assessment demonstrated that In2O3/RGO NCs displayed increased cytotoxicity against human colorectal (HCT116) and liver (HepG2) cancer cells compared to In2O3 NPs. These results indicate that In2O3/RGO NCs exhibit improved photocatalytic and anticancer properties.
2. Results and Discussion
2.1. Structural Study
The crystal structure and phase composition of prepared samples were analyzed by X-ray diffraction (XRD). Figure 1A shows XRD spectra of RGO, pure In2O3 NPs, and In2O3/RGO NCs. As depicted in Figure 1Aa, XRD spectra of RGO demonstrate a characteristic peak of graphene at 26.1° to (002) plane [33]. It can be seen in Figure 1Ac that the main diffraction peaks of pure In2O3 NPs are assigned at 30.3°, 35.2°, 51.7°, and 58.3° indexed to the (222), (400), (440), and (622) planes of cubic In2O3, respectively. However, the peaks of XRD spectra of pure In2O3 NPs were matched with the standard diffraction pattern (Figure 1Ac) of In2O3 (JCPDS card No:01–089-4595). XRD spectra of In2O3/RGO NCs (Figure 1Ad) showed that the diffraction peaks at 30.1°, 35°, 51.2°, and 58.2° can be indexed to the ((222), (400), (440), and (622) planes. This phenomenon indicates that they were slightly shifting to a low angle (Figure 1B). Results indicated that In2O3/RGO NCs were further crystallized due to their high peak intensity and sharp peak width, which were matched with earlier studies [34,35,36]. The average crystal sizes of pure In2O3 NPs and In2O3/RGO NCs were 17 nm and 13 nm (estimated by the Debye Scherrer formula), respectively. It was observed that the average crystal sizes were decreased with RGO doping. XRD results show that the In2O3 NPs were anchored on the surface of RGO due to the change in the intensities of peaks [28]. Obtained results agree with previous studies [36,37].
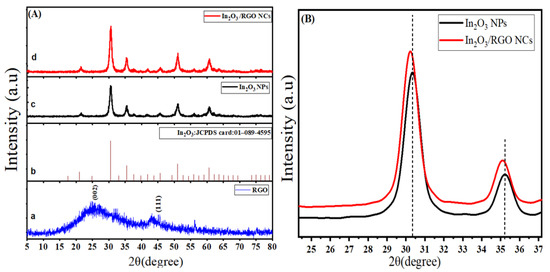
Figure 1.
XRD Spectra of RGO (a), the standard pattern of monoclinic In2O3 (JCPDS card: 01-089-4595) (b), In2O3 NPs (c), and In2O3/RGO NCs (d) (A) and high-resolution XRD spectra of In2O3 NPs, and In2O3/RGO NCs (B).
2.2. Morphological Study
TEM analysis was further applied to characterize the morphologies and particle sizes of prepared nanocomposites (NCs). Figure 2A–D presents the TEM images and a selected area electron diffraction (SEAD) pattern of RGO, pure In2O3 NPs, and In2O3/RGO NCs. It can be seen in Figure 2A that the TEM image of RGO was shown as thin and transparent sheets with wrinkles and folds. Thus, the thickness of the RGO sheets cannot be accurately determined from the TEM image [38]. We observe that the TEM image (Figure 2B) of pure In2O3 NPs was uniformly distributed spherically as found in an earlier investigation [39]. As shown in Figure 2C, the In2O3 NPs were anchored onto the surface of the RGO sheets with a homogeneous dispersion owing to the interaction between RGO and In2O3 NPs [23,24,32,40]. Table 1 shows the average particle sizes of In2O3NPs and In2O3/RGO NCs, which were 12 nm and 10 nm, respectively. The crystal structure and orientation of the In2O3/RGO NCs are shown in the SEAD pattern (Figure 2D). However, the SEAD pattern shows a series of diffraction rings and spots, which correspond to the planes and directions of the In2O3 and RGO crystals. The diffraction spots are indexed to the (222), (400), (440), (622), and (444) planes of In2O3, which agree with the standard JCPDS data (No. 01–089-4595). TEM results revealed that the In2O3 NPs were successfully attached to the surface of the RGO sheet as novel In2O3/RGO NCs.
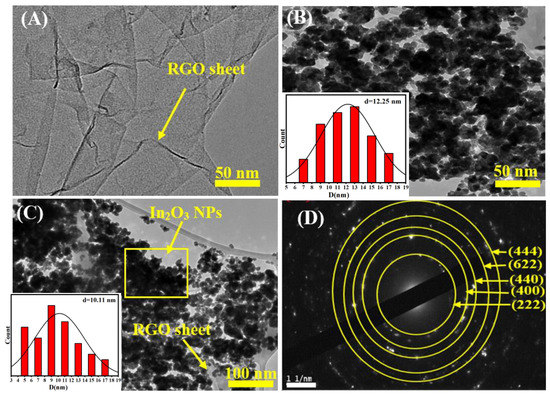
Figure 2.
TEM image of RGO (A), TEM image of pure In2O3 NPs (B), TEM image of In2O3/RGO NCs (C), and selected area electron diffraction (SAED) pattern of In2O3/RGO NCs (D).

Table 1.
Comprehensive Characterization of the Structural and Optical Properties of In2O3NPs and In2O3/RGO NCs.
Figure 3A–D shows the SEM images with EDX spectra of pure In2O3 NPs and In2O3/RGO NCs. As displayed in Figure 3A, the pure In2O3 NPs were spherically shaped and uniformly distributed. EDX spectra (Figure 3B) shows that the chemical element indium (In) and oxygen(O) were present in pure In2O3 NPs without any impurities. It can be seen in Figure 3C that the In2O3 NPs were distributed and attached to the RGO surface. Similarly, the elemental compositions (In, O, and C) in In2O3/RGO NCs were confirmed in Figure 3D. These percentages are in excellent agreement with the starting precursor. Additionally, Figure 4A–D shows the uniform distribution of the presence of In, O, and C elements in In2O3/RGO NCs, which further supports the EDX results obtained. All results suggest that the In2O3/RGO NCs were successfully prepared, which agrees with earlier studies [7,32,41,42].
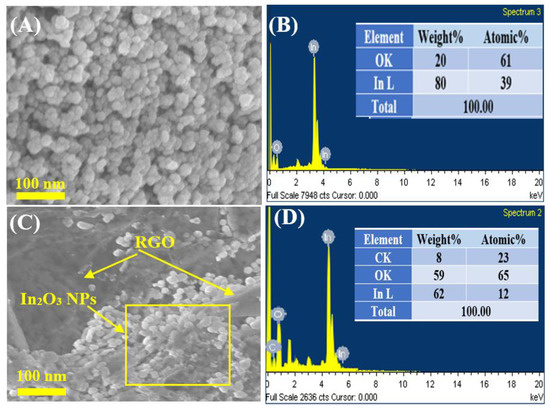
Figure 3.
SEM image of pure In2O3 NPs (A), EDX spectra of pure In2O3 NPs (B), SEM image of In2O3/RGO NCs (C), and EDX spectra of In2O3/RGO NCs (D).
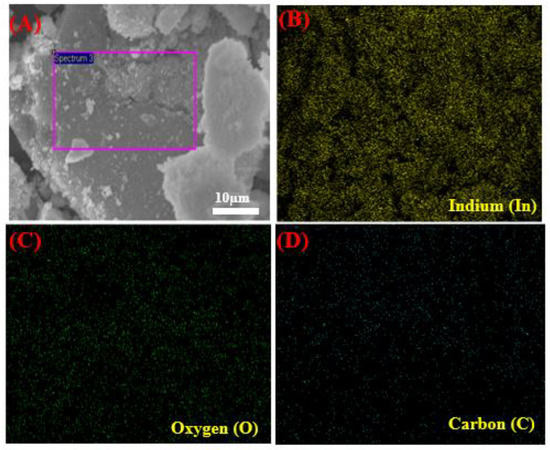
Figure 4.
Elemental mapping of In2O3/RGO NCs: electronic image (A), Indium (B), Oxygen (C), and Carbon (D).
2.3. XPS Analysis
Figure 5A–D illustrates the XPS spectra of synthesized In2O3/RGO NCs. All elemental compositions (In, O, and C) of the In2O3/RGO NCs were shown in the surveyed XPS spectra (Figure 5A). These results were supported by EDX and mapping results (Figure 3 and Figure 4). Therefore, XPS spectra of In 3d are presented in Figure 5B, which shows the chemical states of indium (In) in the In2O3/RGO NCs. Hence, the two peaks were observed at 444 and 451.5 eV for In 3d5/2 and In3d3/2, respectively [36,43]. Earlier studies reported that these peaks are distinctive properties of indium (In) in the +3-oxidation state (In3+) within In2O3 [44]. The multiple peaks of O 1s XPS spectra (Figure 5C) were observed owing to different oxygen species, such as metal oxide (O2−) and adsorbed oxygen (O) [45]. The peak centered around 529.4 eV was assigned to the O2− species in In2O3. Other peaks are located at higher binding energies, around 530–533 eV. These peaks are attributed to the presence of oxygen-containing functional groups on the RGO in the In2O3/RGO NCs, as reported in previous studies [46,47]. Similarly, the XPS spectra of C 1s (Figure 5D) exhibit three peaks, which are assigned at 284.3, 285.9, and 288.4 eV to different carbon species, graphitic carbon (C=C/C-C), oxygenated carbon (C-O/C=O), and carboxyl groups (O-C=O), respectively [48]. XPS results reveal that the In2O3/RGO NCs were successfully prepared.
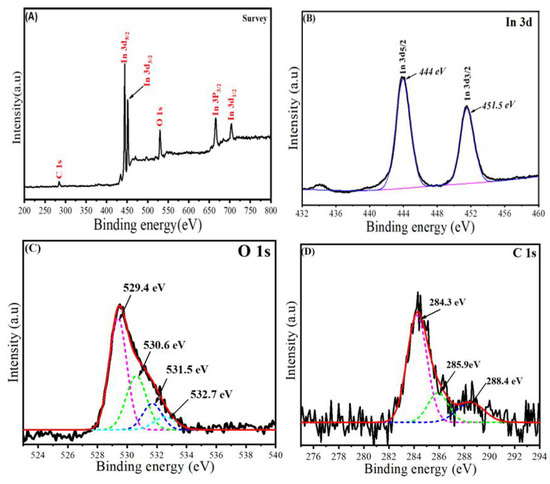
Figure 5.
The survey of XPS spectra of In2O3/RGO NCs (A), high-resolution XPS of In 3d (B), high-resolution XPS of O 1s (C), and high-resolution XPS of C 1s (D) in In2O3/RGO NCs.
2.4. Raman Analysis
Raman spectroscopy is a powerful analytical technique that was applied to investigate the vibrational properties of synthesized samples. Figure 6a–c illustrates the Raman spectra of RGO, pure In2O3 NPs, and In2O3/RGO NCs. It can be seen in Figure 6a that the Raman spectra of RGOs have two distinct peaks, which are the D-band (1350 cm−1) and G-band (1595 cm−1). Moreover, the D-band is associated with the presence of defects or disorders in the graphene structure, while the G-band corresponds to the E2g vibrational mode of sp2 hybridized carbon atoms [49]. However, the ratio of the intensities of the D-band and G-band (ID/IG) indicates the degree of disorder in the graphene structure [50]. We observed that the Raman spectra (Figure 6c) of In2O3 NPs exhibit a sharp and intense peak at around 558 cm−1, which corresponds to the Eg mode of In2O3 [51]. An additional peak in the Raman spectra of In2O3 NPs was assigned at 287 cm−1 due to the E2g mode [52]. Hence, the Raman spectra (Figure 6b) of In2O3/RGO NCs show a combination of the RGO and In2O3 NPs. In comparison with pure In2O3 NPs, the D-band and G-band peaks of RGO were still present in the spectra [40,53]. Importantly, these peaks were further associated with Raman spectra of In2O3 NPs as supported by this study [16]. Obtained results show that the In2O3/RGO NCs were successfully synthesized due to the strong interaction between the RGO and In2O3 NPs.
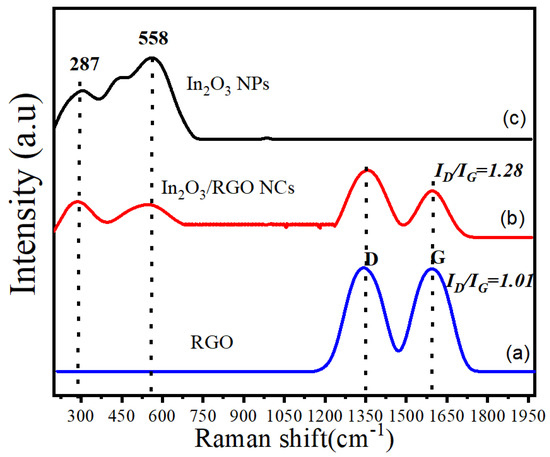
Figure 6.
Raman spectra of RGO (a), In2O3/RGO NCs (b), and pure In2O3 NPs (c).
2.5. UV Analysis
Investigation of the optical absorption of prepared samples was further performed using UV–Vis spectroscopy. Figure 7A,B depict the peak absorption of pure In2O3 NPs and In2O3/RGO NCs. UV–Vis spectra of pure In2O3 NPs (Figure 7A) exhibit a sharp absorption edge at 392 nm, while the absorption peaks (Figure 7B) of In2O3 /RGO NCs were also associated at 405 nm. These values indicated that the absorption edge of In2O3 /RGO NCs is shifting to a higher wavelength compared to pure In2O3 NPs. Thus, the phenomena shows a reduction in the bandgap energy of the In2O3 /RGO due to the presence of RGO in pure In2O3 NPs as reported by these investigators [32,54]. As depicted in Table 1, the band gap energies of In2O3 NPs and In2O3/RGO NPs were 11.17 eV and 3.22 eV, respectively. Owing to the strong interaction between pure In2O3 and RGO nanosheet, the band gap energy increased with the dopant of RGO. UV–Vis results indicated that RGO doping plays a role in improving the optical properties of In2O3 for photocatalytic and biomedicine applications.
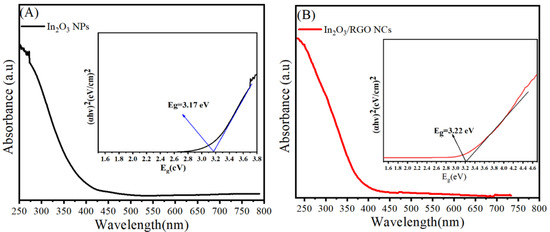
Figure 7.
UV–Vis spectra with bandgap energy calculations of pure In2O3 NPs (A) and In2O3/RGO NPs (B).
2.6. PL Analysis
Photoluminescence (PL) analysis was employed to ascertain the segregation of photo-generated electrons and holes within the synthesized samples. Figure 8 presents the room-temperature photoluminescence (PL) spectra of pure In2O3 NPs and In2O3/RGO NCs. Excitation was achieved using a 320 nm wavelength. The PL spectra show an emission peak at 391.11 nm for all the prepared NPs as reported in a previous study [55]. After the dopant of the RGO sheet, the emission peak of In2O33/RGO NCs was highly decreased compared with pure In2O3 NPs. It was noticed that the PL intensity of the In2O3/RGO NCs (indicated by the red line) was lower compared to pure In2O3 NPs. This could be attributed to enhanced charge separation, lifespan of the electron-hole pair, and charge efficiency [56]. PL results indicate that the prepared In2O3/RGO NCs can be applied to enhance photocatalytic activity and biomedical applications.
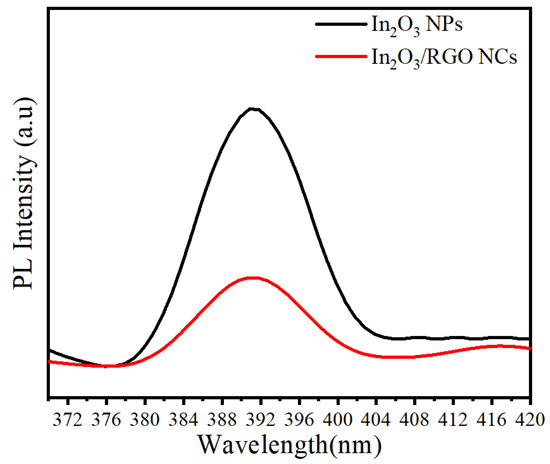
Figure 8.
PL spectra of pure In2O3 NPs and In2O3/RGO NCs.
2.7. Photocatalytic Performance
The photocatalytic performance of synthesized samples was assessed by the degradation of MB dye under UV light irradiation. Figure 9A–D shows the results of the photocatalytic pure In2O3 NPs and In2O3/RGO NCs under UV light irradiation by degradation of MB dye. As shown in Figure 9A, the In2O3/RGO NCs exhibited significantly higher photocatalytic activity than pure In2O3 NPs. Furthermore, the absorption peak (Figure 9B) of MB at 664 nm was gradually decreased through the degradation time (120 min) of In2O3/RGO NCs. The linear relationship between the natural logarithm of the ratio of the initial (ln(C0/Ct)) and the degradation time (min) is shown in Figure 9C. The high linearity of the plot indicates that the photocatalytic degradation of MB of In2O3/RGO NCs follows a first-order kinetics reaction. However, the rate constant (K) values of pure In2O3 NPs and In2O3/RGO NCs were 0.00248 min−1 and 0.01526 min−1, respectively [32]. It can be seen in Figure 9D that the degradation efficiencies of the MB solution of pure In2O3 NPs and In2O3/RGO NCs under the same conditions were 40% and 90 % after 120 min, respectively. Results showed that the In2O3/RGO NCs have superior photocatalytic activity towards the degradation of MB under UV light irradiation compared to pure In2O3 NPs. This enhanced photocatalytic activity of In2O3/RGO NCs could be attributed to increasing the surface area and enhancing the light absorption capability of the NCs by RGO doping into the In2O3 NPs [57]. A comparison of In2O3/RGO NCs with several studies in the degradation of methylene blue (MB) dye is shown in Table 2. All results suggest that the In2O3/RGO NCs can be applied to wastewater and cancer treatment.
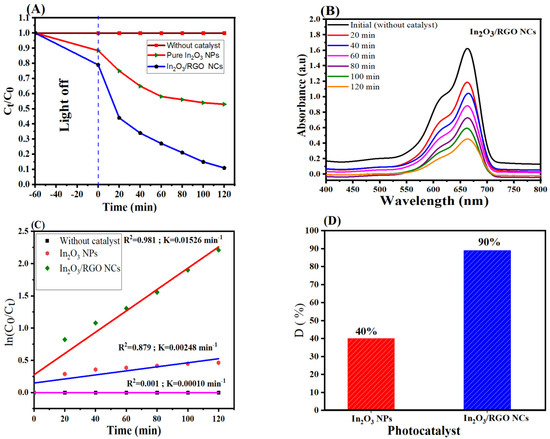
Figure 9.
Photocatalytic degradation of MB dye by pure In2O3 NPs and In2O3 /RGO NCs under UV light irradiation (A), UV–Vis spectra of MB in aqueous solution (B), linear relationship between ln(Ct/C0) and irradiation time (min) (C), and Degradation efficiency of MB of pure In2O3 NPs and In2O3 /RGO NCs (D).

Table 2.
Comparison of degradation of methylene blue (MB) dye using In2O3/RGO NCs and previously reported samples.
2.8. Potential Photocatalytic Mechanism
Figure 10 interprets the photocatalytic mechanism used by In2O3/RGO NCs for the degradation of MB dye. Particularly, the mechanism begins with the absorption of UV light by In2O3/RGO NCs, which promotes the generation of electron(e−)-hole (h+) pairs. The excited electrons in the valance band (VB) move to the conduction band (CB) which produces holes (h+) in the VB. These excited electrons are transferred from the conduction band (CB) of In2O3 to the surface of the RGO sheet. Furthermore, these electrons reacted with oxygen and water to produce hydroxyl radicals (•OH) and oxygen radicals. Then, these radicals degraded MB to produce intermediate products (H2O and CO2).
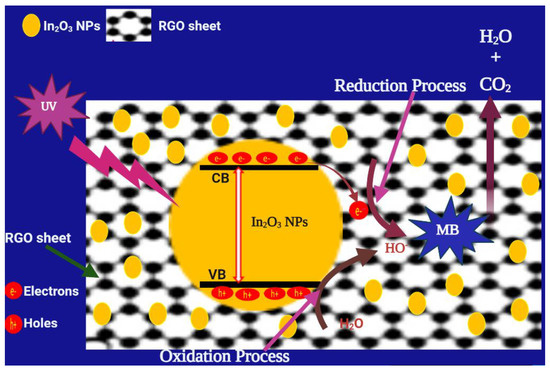
Figure 10.
The possible mechanism of MB degradation of In2O3/RGO NCs under UV light irradiation.
2.9. Cytotoxicity and Compatibility Investigations
Different studies have examined the anticancer potential of graphene nanocomposites (NCs) based on metal oxides against various types of cancer cells [62,63,64]. Cytotoxicity and cytocompatibility of prepared samples at different concentrations against (HC116 and HepG2) as well as in normal PBMCs were illustrated in Figure 11A–C. As depicted in Figure 11A, the cell viability of the HC116 cell lines decreased with increasing concentrations of the prepared samples. Similarly, the cytotoxicity effects of both the prepared samples against the HepG2 cell line were increased with increasing concentrations. These Results show that the In2O3/RGO NCs have higher cytotoxicity toward HC116 and HepG2 cancer cells in comparison with pure In2O3 NPs. Significantly, Figure 11C shows the cytocompatibility of the prepared samples against normal human PBMCs. It is observed that the percentage of cell viability remained relatively constant across all concentrations of the prepared samples. The collected results suggest that the addition of RGO to pure In2O3 NPs enhances anticancer efficacy. IC50 values of synthesized samples are presented in Table 3.
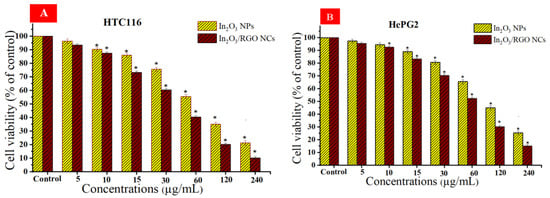
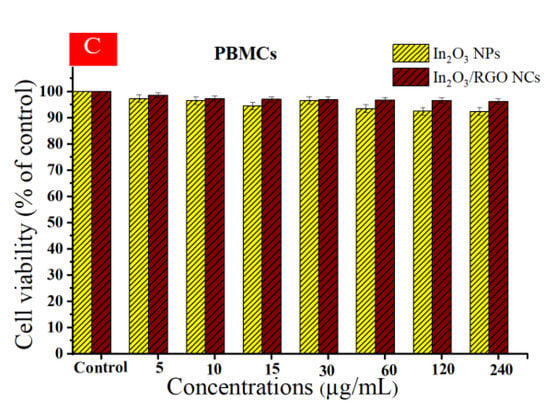
Figure 11.
Cell viability after 24 h of incubation with prepared samples at concentrations (5–240 μg/mL), HC116 cell line (A), HepG2 cells (B), and the cytocompatibility of prepared samples in human peripheral blood mononuclear cells (PBMCs) by using the MTT assay (C). * Significantly different from control (p < 0.05).

Table 3.
IC50 Values of Synthesized Compounds in HC116 and HepG2Cancer Cell Lines IC50.
3. Experimental Section
3.1. Materials and Cells
Indium nitrate hydrate (In(NO3)3. xH2O) (99.99% trace metals basis), reduced graphene oxide (RGO), ethylene glycol (EG)(anhydrous,99.8%), and sodium hydroxide (NaOH) (reagent grade,98%), methylene blue (MB) dye (≥97.0% (calc. based on dry substance, AT)) were purchased from Sigma-Aldrich (Millipore-Sigma, St Louis, MO, USA). Human colorectal (HCT116) and liver (HepG2) cancer cells were purchased from American Type Culture Collection (ATTC, Manassas, WV, USA). Additionally, human normal peripheral blood mononuclear cells (PBMCs) were obtained from the microbiological Lab at KSU as shown in this study [65]. All chemicals were used as received without further purification. Ethanol (EtOH, 99.9%) and deionized water (DI water) were used as solvents.
3.2. Synthesis of Pure In2O3 NPs and In2O3/RGO NCs
The preparation of pure In2O3 NPs and In2O3/RGO NCs were carried out via the microwave hydrothermal method [24]. A sample of 50 mg of RGO nanosheet was dissolved in 20 mL of deionized water with magnetic stirring to get an homogeneous GO suspension as the first solution. Similarly, the 0.5 g of In (NO3)3. xH2O was also dispersed in 40 mL of deionized water with magnetic stirring as a second solution. Subsequently, the first and second solutions were mixed with magnetic stirring. Then, NaOH (1 M) and EG (5 mL) were added to the mixture under vigorous stirring for 2 h. The mixture solution was transferred to a Teflon-lined stainless-steel autoclave (100 mL). After that, the autoclave was sealed and subjected to microwave treatment in a microwave oven (2450 MHz) at 160 °C for 1 h. After the microwave hydrothermal reaction, the vessel was removed from the microwave reactor. After cooling to room temperature, the obtained precipitates were collected by centrifugation, washed with deionized water and ethanol, and dried at 60 °C for 12 h. The pure In2O3 NPs were further synthesized by the same method but without adding RGO. The synthesis protocol for In2O3/RGO nanocomposites is depicted in Scheme 1.
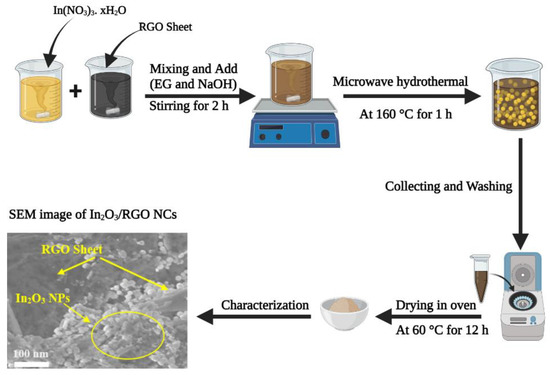
Scheme 1.
Synthesis protocol for preparation of In2O3/RGO NCs.
3.3. Characterization
Measurements of the crystallinity and purity and crystal size of synthesized samples were carried out using X-ray diffractometer (XRD) analysis (PanAnalytic X’Pert Pro, Malvern Instruments, Malvern, UK). Transmission electron microscopy (TEM) (200 kV,2100F, JEOL, Inc., Tokyo, Japan) and scanning electron microscopy (SEM) (SEM, JSM-7600F, JEOL, Inc. Tokyo, Japan) (JSM-7600F, JEOL, Inc.) were further employed to assess the morphologies and the distribution of prepared samples. Energy dispersive X-ray spectroscopy (EDX) (SEM, JSM-7600F, JEOL, Inc. Tokyo, Japan) (JSM-7600F, JEOL, Inc.) was also used to confirm the presence of elements in synthesized samples. Furthermore, the chemical state and elemental composition of obtained samples were determined by X-ray photoelectron spectroscopy (XPS) (PHI-5300 ESCA PerkinElmer, Boston, MA, USA). Additionally, Raman spectroscopy was used to study the vibrational modes of the synthesized samples. The optical properties of synthesized samples were assayed using UV–Vis (Hitachi U-2600) and Photoluminescence (PL) (Hitachi F-4600) spectroscopy.
3.4. Photocatalytic Experiment
The degradation of MB dye solution under UV light irradiation (300 W xenon lamp) was carefully used to evaluate the photocatalytic properties of prepared samples. The 20 mg of pure In2O3 NPs and 10 mg/L of MB dye solution were added to a 250 mL beaker of deionized water. Then, the solution suspension was further stirred in the dark for 30 min to achieve an adsorption–desorption equilibrium between the samples and the MB solution. Subsequently, this solution was irradiated under UV light irradiation with magnetic stirring. At 20 min intervals, 3 mL of the solution suspension was taken during the photocatalytic reaction. Then, the concentration of the photodegraded MB solution was further measured by a UV–Visible spectrophotometer after removing the photocatalyst of this solution. The photocatalytic actvity of the In2O3/RGO NCs was also evaluated under the same experimental conditions. The degradation efficiency of MB dye was calculated using the following formula of . Where C0 represents the dye concentration at the beginning, while Ct refers to the dye concentration after a certain time ‘t’ (measured in min). To test the stability, the catalysts were centrifuged, washed with deionized water and ethanol, and dried at 60 °C for 12 h. Hence, centrifuged catalysts were used several times after drying at 70 °C for 10 h.
3.5. Cytotoxicity Assessment
The cytotoxicity of synthesized In2O3 NPs and In2O3/RGO NCs was further assessed using human colorectal (HCT116) and liver (HepG2) cancer cells by using the MTT assay. Importantly, the biocompatibility of prepared samples was tested agonist human normal peripheral blood mononuclear cells (PBMCs). Cells were cultured in Dulbecco’s Modified Eagle’s Medium (DMEM) containing 10% fetal bovine serum (FBS) and 1% penicillin-streptomycin at 37 °C in a humidified atmosphere of 5% CO2. Thus, cells were seeded in a 96-well plate at a density of 5 × 10³ cells/well and incubated for 24 h. Then, the cells were treated with various concentrations (5–240 μg/mL) of pure In2O3 NPs and In2O3/RGO NCs with incubation for 24 h. The cell viability was measured using absorbance at 570 nm using a microplate reader.
3.6. Statistical Analysis
The statistical analysis was performed using a one-way analysis of variance (ANOVA) followed by the multiple comparison test of Tukey. A value of p < 0.05 was considered statistically significant.
4. Conclusions
In the present study, we used a single-step microwave hydrothermal method for the fabrication of In2O3 on the surface of RGO. The prepared samples have been analyzed using XRD, TEM, SEM, EDX, XPS, Raman spectroscopy, UV–Vis, and PL spectroscopy. XRD data show that the synthesized samples exhibited high crystallinity with reduced crystal size after RGO addition. TEM and SEM images showed that In2O3 NPs were spherically shaped and uniformly embedded on RGO sheets. EDX and XPS analysis confirmed the elemental composition without impurities. The PL study suggests a hindrance in the recombination rate of electron-holes of In2O3/RGO NCs in comparison to pure In2O3 NPs. Raman analysis further confirmed the successful fabrication of In2O3 on the RGO surface. In the degradation experiment, it was observed that the In2O3/RGO NCs display better photocatalytic performance as compared to pure In2O3NPs. The biological data revealed that In2O3/RGO NCs have higher anticancer activity in human colorectal (HCT116) and liver (HepG2) cancer cells than those of In2O3NPs. Moreover, In2O3/RGO NCs demonstrated higher cytocompatibility with human normal peripheral blood mononuclear cells (PBMCs) compared to pure In2O3 NPs. These results indicate that incorporating RGO enhances the photocatalytic and anticancer properties of In2O3 NPs. This research emphasizes the promising capabilities of In2O3/RGO NCs as highly effective photocatalysts and therapeutic materials.
Author Contributions
Conceptualization, Z.M.A. and M.A; Investigation and methodology, Z.M.A., H.A.A., S.A., M.J.A., A.A.A. and M.A.; Writing—original draft preparation, Z.M.A. and M.A.; Writing—review and editing, Z.M.A., H.A.A., S.A., A.A.A. and M.A. All authors have read and agreed to the published version of the manuscript.
Funding
The authors extend their sincere appreciation to researchers supporting project number (RSPD2023R813), King Saud University, Riyadh, Saudi Arabia for funding this research.
Institutional Review Board Statement
Not applicable.
Informed Consent Statement
Not applicable.
Data Availability Statement
Not applicable.
Conflicts of Interest
The authors declare no conflict of interest.
Sample Availability
Samples of the compounds in this study are available from the authors.
References
- Cheng, L.; Wang, X.; Gong, F.; Liu, T.; Liu, Z. 2D Nanomaterials for Cancer Theranostic Applications. Adv. Mater. 2020, 32, 1902333. [Google Scholar] [CrossRef] [PubMed]
- Chen, Y.W.; Su, Y.L.; Hu, S.H.; Chen, S.Y. Functionalized Graphene Nanocomposites for Enhancing Photothermal Therapy in Tumor Treatment. Adv. Drug Deliv. Rev. 2016, 105, 190–204. [Google Scholar] [CrossRef] [PubMed]
- Xia, M.Y.; Xie, Y.; Yu, C.H.; Chen, G.Y.; Li, Y.H.; Zhang, T.; Peng, Q. Graphene-Based Nanomaterials: The Promising Active Agents for Antibiotics-Independent Antibacterial Applications. J. Control. Release 2019, 307, 16–31. [Google Scholar] [CrossRef] [PubMed]
- Pourmadadi, M.; Rajabzadeh-Khosroshahi, M.; Eshaghi, M.M.; Rahmani, E.; Motasadizadeh, H.; Arshad, R.; Rahdar, A.; Pandey, S. TiO2-Based Nanocomposites for Cancer Diagnosis and Therapy: A Comprehensive Review. J. Drug Deliv. Sci. Technol. 2023, 82, 104370. [Google Scholar] [CrossRef]
- Akgöl, S.; Ulucan-Karnak, F.; Kuru, C.İ.; Kuşat, K. The Usage of Composite Nanomaterials in Biomedical Engineering Applications. Biotechnol. Bioeng. 2021, 118, 2906–2922. [Google Scholar] [CrossRef]
- Oun, A.A.; Shankar, S.; Rhim, J.W. Multifunctional Nanocellulose/Metal and Metal Oxide Nanoparticle Hybrid Nanomaterials. Crit. Rev. Food Sci. Nutr. 2019, 60, 435–460. [Google Scholar] [CrossRef]
- Zhang, Y.; Hu, T.; Hu, R.; Jiang, S.; Zhang, C.; Hou, H. Thermal, Mechanical and Dielectric Properties of Polyimide Composite Films by In-Situ Reduction of Fluorinated Graphene. Molecules 2022, 27, 8896. [Google Scholar] [CrossRef]
- Murali, A.; Lokhande, G.; Deo, K.A.; Brokesh, A.; Gaharwar, A.K. Emerging 2D Nanomaterials for Biomedical Applications. Mater. Today 2021, 50, 276–302. [Google Scholar] [CrossRef]
- Hu, Z.; Chen, L.; Zhu, Y.; Zhang, C.; Jiang, S.; Hou, H. In Situ Fabrication of High Dielectric Constant Composite Films with Good Mechanical and Thermal Properties by Controlled Reduction. Molecules 2023, 28, 2535. [Google Scholar] [CrossRef]
- Salman, O.N. The Antibacterial Activity of Indium Oxide Thin Film Prepared by Thermal Deposition. Iraqi J. Phys. 2018, 16, 46–51. [Google Scholar] [CrossRef]
- Zhou, X.; Ding, C.; Cheng, C.; Liu, S.; Duan, G.; Xu, W.; Liu, K.; Hou, H. Mechanical and Thermal Properties of Electrospun Polyimide/RGO Composite Nanofibers via in-Situ Polymerization and in-situ Thermal Conversion. Eur. Polym. J. 2020, 141, 110083. [Google Scholar] [CrossRef]
- Somwanshi, S.B.; Somvanshi, S.B.; Kharat, P.B. Visible Light Driven Photocatalytic Activity of TiO2 Nanoparticles Prepared via Gel-Combustion Process. J. Phys. Conf. Ser. 2020, 1644, 012042. [Google Scholar] [CrossRef]
- Sun, J.H.; Dong, S.Y.; Wang, Y.K.; Sun, S.P. Preparation and Photocatalytic Property of a Novel Dumbbell-Shaped ZnO Microcrystal Photocatalyst. J. Hazard. Mater. 2009, 172, 1520–1526. [Google Scholar] [CrossRef] [PubMed]
- Kokila, N.R.; Mahesh, B.; Roopa, K.P.; Prasad, B.D.; Raj, K.; Manjula, S.N.; Mruthunjaya, K.; Ramu, R. Thunbergia Mysorensis Mediated Nano Silver Oxide for Enhanced Antibacterial, Antioxidant, Anticancer Potential and in Vitro Hemolysis Evaluation. J. Mol. Struct. 2022, 1255, 132455. [Google Scholar] [CrossRef]
- Rakhi, R.B.; Chen, W.; Cha, D.; Alshareef, H.N. High Performance Supercapacitors Using Metal Oxide Anchored Graphene Nanosheet Electrodes. J. Mater. Chem. 2011, 21, 16197–16204. [Google Scholar] [CrossRef]
- Zhang, J.; Ding, E.; Xu, S.; Li, Z.; Fakhri, A.; Gupta, V.K. Production of Metal Oxides Nanoparticles Based on Poly-Alanine/Chitosan/Reduced Graphene Oxide for Photocatalysis Degradation, Anti-Pathogenic Bacterial and Antioxidant Studies. Int. J. Biol. Macromol. 2020, 164, 1584–1591. [Google Scholar] [CrossRef]
- Ong, C.B.; Mohammad, A.W.; Ng, L.Y.; Mahmoudi, E.; Azizkhani, S.; Hairom, N.H.H. Solar Photocatalytic and Surface Enhancement of ZnO/RGO Nanocomposite: Degradation of Perfluorooctanoic Acid and Dye. Process Saf. Environ. Prot. 2017, 112, 298–307. [Google Scholar] [CrossRef]
- Priyadharsan, A.; Shanavas, S.; Vasanthakumar, V.; Balamuralikrishnan, B.; Anbarasan, P.M. Synthesis and Investigation on Synergetic Effect of RGO-ZnO Decorated MoS2 Microflowers with Enhanced Photocatalytic and Antibacterial Activity. Colloids Surf. A Physicochem. Eng. Asp. 2018, 559, 43–53. [Google Scholar] [CrossRef]
- Chen, L.; He, F.; Zhao, N.; Guo, R. Fabrication of 3D Quasi-Hierarchical Z-Scheme RGO-Fe2O3-MoS2 Nanoheterostructures for Highly Enhanced Visible-Light-Driven Photocatalytic Degradation. Appl. Surf. Sci. 2017, 420, 669–680. [Google Scholar] [CrossRef]
- Pant, H.R.; Pant, B.; Kim, H.J.; Amarjargal, A.; Park, C.H.; Tijing, L.D.; Kim, E.K.; Kim, C.S. A Green and Facile One-Pot Synthesis of Ag–ZnO/RGO Nanocomposite with Effective Photocatalytic Activity for Removal of Organic Pollutants. Ceram. Int. 2013, 39, 5083–5091. [Google Scholar] [CrossRef]
- Gang, R.; Xu, L.; Xia, Y.; Zhang, L.; Wang, S.; Li, R. Facile One-Step Production of 2D/2D ZnO/RGO Nanocomposites under Microwave Irradiation for Photocatalytic Removal of Tetracycline. ACS Omega 2021, 6, 3831–3839. [Google Scholar] [CrossRef] [PubMed]
- Krishnan, S.; Murugesan, S.; Vasanthakumar, V.; Priyadharsan, A.; Alsawalha, M.; Alomayri, T.; Yuan, B. Facile Green Synthesis of ZnFe2O4/RGO Nanohybrids and Evaluation of Its Photocatalytic Degradation of Organic Pollutant, Photo Antibacterial and Cytotoxicity Activities. Colloids Surf. A Physicochem. Eng. Asp. 2021, 611, 125835. [Google Scholar] [CrossRef]
- Gu, F.; Nie, R.; Han, D.; Wang, Z. In2O3-Graphene Nanocomposite Based Gas Sensor for Selective Detection of NO2 at Room Temperature. Sens. Actuators B Chem. 2015, 219, 94–99. [Google Scholar] [CrossRef]
- Wang, P.; Li, Q.; Cheng, Y.; Chu, K. In2O3 Nanoparticle-Reduced Graphene Oxide Hybrid for Electrocatalytic Nitrogen Fixation: Computational and Experimental Studies. J. Mater. Sci. 2020, 55, 4624–4632. [Google Scholar] [CrossRef]
- Bibi, S.; Ahmad, A.; Anjum, M.A.R.; Haleem, A.; Siddiq, M.; Shah, S.S.; Kahtani, A. Al Photocatalytic Degradation of Malachite Green and Methylene Blue over Reduced Graphene Oxide (RGO) Based Metal Oxides (RGO-Fe3O4/TiO2) Nanocomposite under UV-Visible Light Irradiation. J. Environ. Chem. Eng. 2021, 9, 105580. [Google Scholar] [CrossRef]
- Balsamo, S.A.; Fiorenza, R.; Condorelli, M.; Pecoraro, R.; Brundo, M.V.; Presti, F.L.; Scir, S. One-Pot Synthesis of TiO2-rGO Photocatalysts for the Degradation of Groundwater Pollutants. Materials 2021, 14, 5938. [Google Scholar] [CrossRef]
- Farbod, F.; Mazloum-Ardakani, M.; Naderi, H.R.; Mirvakili, A.; Wang, M.; Shinde, D.V.; Dante, S.; Salimi, P.; Lauciello, S.; Prato, M. Indium Based Metal-Organic Framework/Carbon Nanotubes Composite as a Template for In2O3 Porous Hexagonal Prisms/Carbon Nanotubes Hybrid Structure and Their Application as Promising Super-Capacitive Electrodes. J. Energy Storage 2022, 51, 104238. [Google Scholar] [CrossRef]
- Amarnath, M.; Gurunathan, K. Highly Selective CO2 Gas Sensor Using Stabilized NiO-In2O3 Nanospheres Coated Reduced Graphene Oxide Sensing Electrodes at Room Temperature. J. Alloys Compd. 2021, 857, 157584. [Google Scholar] [CrossRef]
- Zou, K.; Chen, X.; Jing, W.; Dai, X.; Wang, P.; Liu, Y.; Qiao, R.; Shi, M.; Chen, Y.; Sun, J.; et al. Facilitating Catalytic Activity of Indium Oxide in Lithium-Sulfur Batteries by Controlling Oxygen Vacancies. Energy Storage Mater. 2022, 48, 133–144. [Google Scholar] [CrossRef]
- Srivastava, M.; Singh, N. Metal Oxide Nanostructures for Gas Sensing Applications. In Nanomaterials-Based Sensing Platforms; Apple Academic Press: Palm Bay, FL, USA, 2022; pp. 117–153. [Google Scholar] [CrossRef]
- Na, C.W.; Kim, J.-H.; Kim, H.-J.; Woo, H.-S.; Gupta, A.; Kim, H.-K.; Lee, J.-H. Highly Selective and Sensitive Detection of NO2 Using RGO-In2O3 Structure on Flexible Substrate at Low Temperature. Sens. Actuators B Chem. 2018, 255, 1671–1679. [Google Scholar] [CrossRef]
- Devi, P.; Singh, J.P. Visible Light Induced Selective Photocatalytic Reduction of CO2 to CH4 on In2O3-RGO Nanocomposites. J. CO2 Util. 2021, 43, 101376. [Google Scholar] [CrossRef]
- Mikhaylov, P.A.; Vinogradov, M.I.; Levin, I.S.; Shandryuk, G.A.; Lubenchenko, A.V.; Kulichikhin, V.G. Synthesis and Characterization of Polyethylene Terephthalate-Reduced Graphene Oxide Composites. IOP Conf. Ser. Mater. Sci. Eng. 2019, 693, 012036. [Google Scholar] [CrossRef]
- Wu, Z.; Zhong, Y.; Wang, Z.; Li, L.; Liu, X. PdPbAg Alloy NPs Immobilized on Reduced Graphene Oxide/In2O3 Composites as Highly Active Electrocatalysts for Direct Ethylene Glycol Fuel Cells. RSC Adv. 2022, 12, 19929–19935. [Google Scholar] [CrossRef]
- de Lima, B.S.; Komorizono, A.A.; Ndiaye, A.L.; Bernardi, M.I.B.; Brunet, J.; Mastelaro, V.R. Tunning the Gas Sensing Properties of RGO with In2O3 Nanoparticles. Surfaces 2022, 5, 127–142. [Google Scholar] [CrossRef]
- Zhao, C.; Huang, B.; Xie, E.; Zhou, J.; Zhang, Z. Improving Gas-Sensing Properties of Electrospun In2O3 Nanotubes by Mg Acceptor Doping. Sens. Actuators B Chem. 2015, 207, 313–320. [Google Scholar] [CrossRef]
- Liang, T.T.; Kim, D.S.; Yoon, J.W.; Yu, Y.T. Rapid Synthesis of Rhombohedral In2O3 Nanoparticles via a Microwave-Assisted Hydrothermal Pathway and Their Application for Conductometric Ethanol Sensing. Sens. Actuators B Chem. 2021, 346, 130578. [Google Scholar] [CrossRef]
- Kumar, R.; Youssry, S.M.; Joanni, E.; Sahoo, S.; Kawamura, G.; Matsuda, A. Microwave-Assisted Synthesis of Iron Oxide Homogeneously Dispersed on Reduced Graphene Oxide for High-Performance Supercapacitor Electrodes. J. Energy Storage 2022, 56, 105896. [Google Scholar] [CrossRef]
- Wang, C.; Guo, G.; Zhu, C.; Li, Y.; Jin, Y.; Zou, B.; He, H.; Wang, A. Facile Synthesis, Characterization, and Photocatalytic Evaluation of In2O3/SnO2 Microsphere Photocatalyst for Efficient Degradation of Rhodamine B. Nanomaterials 2022, 12, 3151. [Google Scholar] [CrossRef]
- Bhargava, R.; Khan, S. Effect of Reduced Graphene Oxide (RGO) on Structural, Optical, and Dielectric Properties of Mg(OH)2/RGO Nanocomposites. Adv. Powder Technol. 2017, 28, 2812–2819. [Google Scholar] [CrossRef]
- Naik, M.Z.; Meena, S.N.; Ghadi, S.C.; Naik, M.M.; Salker, A.V. Evaluation of Silver-Doped Indium Oxide Nanoparticles as in Vitro α-Amylase and α-Glucosidase Inhibitors. Med. Chem. Res. 2016, 25, 381–389. [Google Scholar] [CrossRef]
- Alaizeri, Z.M.; Alhadlaq, H.A.; Aldawood, S.; Javed, M.; Maqusood, A. Photodeposition Mediated Synthesis of Silver-Doped Indium Oxide Nanoparticles for Improved Photocatalytic and Anticancer Performance. Environ. Sci. Pollut. Res. 2022, 30, 6055–6067. [Google Scholar] [CrossRef]
- Sun, L.; Li, R.; Zhan, W.; Yuan, Y.; Wang, X.; Han, X.; Zhao, Y. Double-Shelled Hollow Rods Assembled from Nitrogen/Sulfur-Codoped Carbon Coated Indium Oxide Nanoparticles as Excellent Photocatalysts. Nat. Commun. 2019, 10, 2270. [Google Scholar] [CrossRef]
- Zhao, J.; Ge, S.; Pan, D.; Pan, Y.; Murugadoss, V.; Li, R.; Xie, W.; Lu, Y.; Wu, T.; Wujcik, E.K.; et al. Microwave Hydrothermal Synthesis of In2O3-ZnO Nanocomposites and Their Enhanced Photoelectrochemical Properties. J. Electrochem. Soc. 2019, 166, H3074–H3083. [Google Scholar] [CrossRef]
- Al Shboul, A.M.; Izquierdo, R. Printed Chemiresistive In2O3 Nanoparticle-Based Sensors with Ppb Detection of H2S Gas for Food Packaging. ACS Appl. Nano Mater. 2021, 4, 9508–9517. [Google Scholar] [CrossRef]
- Shen, C.; Wang, L.; Zhou, A.; Wang, B.; Wang, X.; Lian, W.; Hu, Q.; Qin, G.; Liu, X. Synthesis and Electrochemical Properties of Two-Dimensional RGO/Ti3C2Tx Nanocomposites. Nanomaterials 2018, 8, 80. [Google Scholar] [CrossRef]
- Zhang, J.; Xu, Y.; Liu, Z.; Yang, W.; Liu, J. A Highly Conductive Porous Graphene Electrode Prepared via in situ Reduction of Graphene Oxide Using Cu Nanoparticles for the Fabrication of High Performance Supercapacitors. RSC Adv. 2015, 5, 54275–54282. [Google Scholar] [CrossRef]
- Gengenbach, T.R.; Major, G.H.; Linford, M.R.; Easton, C.D. Practical Guides for X-ray Photoelectron Spectroscopy (XPS): Interpreting the Carbon 1s Spectrum. J. Vac. Sci. Technol. A 2021, 39, 013204. [Google Scholar] [CrossRef]
- Yavuz, S.; Bandaru, P.R. Ag Nanowire Coated Reduced Graphene Oxide/n-Silicon Schottky Junction Based Solar Cell. In Proceedings of the 2016 IEEE Conference on Technologies for Sustainability (SusTech), Phoenix, AZ, USA, 9–11 October 2016; pp. 265–269. [Google Scholar] [CrossRef]
- King, A.A.K.; Davies, B.R.; Noorbehesht, N.; Newman, P.; Church, T.L.; Harris, A.T.; Razal, J.M.; Minett, A.I. A New Raman Metric for the Characterisation of Graphene Oxide and Its Derivatives. Sci. Rep. 2016, 6, 19491. [Google Scholar] [CrossRef]
- Ullah, H.; Yamani, Z.H.; Qurashi, A.; Iqbal, J.; Safeen, K. Study of the Optical and Gas Sensing Properties of In2O3 Nanoparticles Synthesized by Rapid Sonochemical Method. J. Mater. Sci. Mater. Electron. 2020, 31, 17474–17481. [Google Scholar] [CrossRef]
- Nguyen, T.T.D.; Choi, H.N.; Ahemad, M.J.; Van Dao, D.; Lee, I.H.; Yu, Y.T. Hydrothermal Synthesis of In2O3 Nanocubes for Highly Responsive and Selective Ethanol Gas Sensing. J. Alloys Compd. 2020, 820, 153133. [Google Scholar] [CrossRef]
- Cao, L.; Li, H.; Liu, X.; Liu, S.; Zhang, L.; Xu, W.; Yang, H.; Hou, H.; He, S.; Zhao, Y.; et al. Nitrogen, Sulfur Co-Doped Hierarchical Carbon Encapsulated in Graphene with “Sphere-in-Layer” Interconnection for High-Performance Supercapacitor. J. Colloid Interface Sci. 2021, 599, 443–452. [Google Scholar] [CrossRef]
- Jabeen, S.; Iqbal, J.; Arshad, A.; Awan, M.S.; Warsi, M.F. (In1−xFex)2O3 Nanostructures for Photocatalytic Degradation of Various Dyes. Mater. Chem. Phys. 2020, 243, 122516. [Google Scholar] [CrossRef]
- Uma, K.; Chong, S.; Mohan, S.C.; Jothivenkatachalam, K.; Yang, T.C.K.; Lin, J.H. Multi-Functional RGO-Supported α-Fe2O3 Nanocomposites for High-Performance Pseudocapacitors and Visible Light–Driven Photocatalytic Applications. Ionics 2020, 26, 3491–3500. [Google Scholar] [CrossRef]
- Xie, R.; Fang, K.; Liu, Y.; Chen, W.; Fan, J.; Wang, X.; Ren, Y.; Song, Y. Z-Scheme In2O3/WO3 Heterogeneous Photocatalysts with Enhanced Visible-Light-Driven Photocatalytic Activity toward Degradation of Organic Dyes. J. Mater. Sci. 2020, 55, 11919–11937. [Google Scholar] [CrossRef]
- Zhang, Y.; Fu, F.; Zhou, F.; Yang, X.; Zhang, D.; Chen, Y. Synergistic Effect of RGO/TiO2 Nanosheets with Exposed (0 0 1) Facets for Boosting Visible Light Photocatalytic Activity. Appl. Surf. Sci. 2020, 510, 145451. [Google Scholar] [CrossRef]
- Khan, M.A.M.; Siwach, R.; Kumar, S.; Ahmed, J.; Ahamed, M. Hydrothermal Preparation of Zn-Doped In2O3 Nanostructure and Its Microstructural, Optical, Magnetic, Photocatalytic and Dielectric Behaviour. J. Alloys Compd. 2020, 846, 156479. [Google Scholar] [CrossRef]
- Lu, Y.; Shao, L.; Deng, S.; Lu, Z.; Yan, R.; Ren, D.; Huang, Y.; Liu, H. Synthesis of C-In2O3/BiOI Composite and Its Enhanced Photocatalytic Degradation for Methyl Blue. Inorg. Chem. Commun. 2019, 100, 56–59. [Google Scholar] [CrossRef]
- Smok, W.; Zaborowska, M.; Tański, T.; Radoń, A. Novel In2O3/SnO2 Heterojunction 1D Nanostructure Photocatalyst for MB Degradation. Opt. Mater. 2023, 139, 113757. [Google Scholar] [CrossRef]
- Lu, H.; Sha, S.; Li, T.; Wen, Q.; Yang, S.; Wu, J.; Wang, K.; Sheng, Z.; Ma, J. One-Step Electrodeposition of ZnO/Graphene Composites with Enhanced Capability for Photocatalytic Degradation of Organic Dyes. Front. Chem. 2022, 10, 1–12. [Google Scholar] [CrossRef]
- Alaizeri, Z.M.; Alhadlaq, H.A. One-Pot Synthesis of SnO2-RGO Nanocomposite for Enhanced Photocatalytic and Anticancer Activity. Polymers 2022, 14, 2036. [Google Scholar] [CrossRef]
- Ahamed, M.; Akhtar, M.J.; Khan, M.A.M.; Alhadlaq, H.A. SnO2-Doped Zno/Reduced Graphene Oxide Nanocomposites: Synthesis, Characterization, and Improved Anticancer Activity via Oxidative Stress Pathway. Int. J. Nanomed. 2021, 16, 89–104. [Google Scholar] [CrossRef]
- Saranya, J.; Saminathan, P.; Ankireddy, S.R.; Shaik, M.R.; Khan, M.; Khan, M.; Shaik, B. Cerium Oxide/Graphene Oxide Hybrid: Synthesis, Characterization, and Evaluation of Anticancer Activity in a Breast Cancer Cell Line (MCF-7). Biomedicines 2023, 11, 531. [Google Scholar] [CrossRef]
- Aziz, I.M.; Bhat, R.; Farrag, M.A.; Almajhdi, F.N. Oncolytic Activity of Human Orthopneumovirus in Cancer Cell Lines. Exp. Oncol. 2022, 44, 113–120. [Google Scholar] [CrossRef]
Disclaimer/Publisher’s Note: The statements, opinions and data contained in all publications are solely those of the individual author(s) and contributor(s) and not of MDPI and/or the editor(s). MDPI and/or the editor(s) disclaim responsibility for any injury to people or property resulting from any ideas, methods, instructions or products referred to in the content. |
© 2023 by the authors. Licensee MDPI, Basel, Switzerland. This article is an open access article distributed under the terms and conditions of the Creative Commons Attribution (CC BY) license (https://creativecommons.org/licenses/by/4.0/).