Article

Effect of Cosolvent on the Vesicle Formation Pathways under Solvent Exchange Process: A Dissipative Particle Dynamics Simulation

Jiangsu Key Laboratory of Environmentally Friendly Polymeric Materials, Jiangsu Collaborative Innovation Center of Photovolatic Science and Engineering, National Experimental Demonstration Center for Materials Science and Engineering, School of Materials Science and Engineering, Changzhou University, Changzhou 213164, China
*
Authors to whom correspondence should be addressed.
Molecules 2023, 28(13), 5113; https://doi.org/10.3390/molecules28135113
Submission received: 6 June 2023 / Revised: 21 June 2023 / Accepted: 23 June 2023 / Published: 29 June 2023
(This article belongs to the Section Computational and Theoretical Chemistry)

Abstract

:
The effective control over the vesicle formation pathways is vital for tuning its function. Recently, a liquid–liquid phase-separated intermediate (LLPS) is observed before a vesicular structure during the solvent exchange self-assembly of block copolymers. Though the understanding of polymer structures and chemical compositions on the competition between LLPS and micellization has made some progress, little is known about the role of cosolvent on it. In this study, the influence of cosolvent on the vesicle formation pathways is investigated by using dissipative particle dynamics. The results show that the range of water fraction within which the LLPS is favored will be highly dependent on the affinity difference of cosolvent to water and to polymer repeat units. The change of the cosolvent–water interaction and the water fraction impact the distribution of cosolvent in the polymer domain, the miscibility between the components in the system as well as the chain conformations, which finally induce different self-assembly behaviors. Our findings would be helpful for understanding the LLPS and controlling the morphologies of diblock polymers in solutions for further applications.

Graphical Abstract

1. Introduction

The amphiphilic block copolymers form various structures in solution, such as spherical micelles, cylindrical micelles, vesicles, and so on [1,2]. Among them, the vesicular structures have attracted special and continuous attentions in the last few decades because of their great potential applications of drug delivery [3,4,5], nanoreactors [6], mimics of cells or organelles [7,8], and so on [9]. For achieving these functions, the rigorous control over the morphology evolution of the vesicle is critical. With this in mind, scientists from various backgrounds have make great efforts to investigate the self-assembly behaviors of diverse systems and to explore the physicochemical principles behind them.
Despite many documents focused on the subject, it has been generally recognized that there are only two fundamental ways for vesicle formation described as Mechanism I (by bilayer-closing) [10] and Mechanism II (via semi-vesicle intermediate) [11,12]. In the former pathway, the bilayer membrane structures, such as rod-like, disk-like, or sheet-like intermediates are observed first and then the bilayer membranes bend and close to form the vesicles. This mechanism is frequently reported in experimental and theoretical studies [13,14,15]. In the second pathway, a spherical semi-vesicle intermediate with a small hollow cavity is formed by the diffusion of hydrophilic blocks as well as solvent molecules towards the center of the spherical micelle, and then the full vesicle grows up gradually. This mechanism is initially proposed by using a field-based simulation method, and also observed by some experimental studies [16]. It is usually agreed that the second pathway is preferential when the polymer concentration is much lower and the hydrophobic property of the block copolymer is higher [12,17].
Recently, based on the observation of the phase separation of polymer-rich liquid droplets by time-resolved in situ monitoring technique and the self-consistent mean field (SCF) theory, another mechanism is proposed that the vesicle evolves from the growth and internal phase separation of a polymer-rich liquid droplet precursor in the liquid–liquid phase-separated state [18]. It is thought that in a liquid mixture with a specific composition of cosolvent (good solvent for all blocks) and water, the polymer-rich liquid droplet (LL) is more thermodynamically favorable than dissolution or self-assembly [19,20]. Though the LL is also reproduced in simulations [21,22], as we know, it still lacks the direct observation of how the phase separation within the LL develops into a full vesicular structure by particle simulations. Moreover, most works are concerned about the influences of polymer structures and chemical compositions on the formation and stability of the liquid–liquid phase separation (LLPS) [19,23], but no research examines the role of the cosolvent during this process.
For a long period of time, the observation of a self-assembly process of amphiphilic block copolymers in simulations is often performed by using a single-component solvent which is supposed as having the averaged property of the binary mixture [24,25,26]. However, experimental evidence suggests that the choice of different cosolvents influences nanoparticle sizes [27,28] as well as structures [29,30], the cosolvent/selective solvent ratio impacts chain conformation [31,32], and the distribution of the cosolvent in the polymer domain is distinguished from that in the bulk solution [33]; moreover, the cosolvent dispersed in the core and the corona also may be much different [29,30,32]. All of the phenomena indicate the important role of the cosolvent in the self-assembly process and should be considered individually [21,34,35].
In this study, dissipative particle dynamic (DPD) simulation is used to investigate the vesicle formation process of the model amphiphilic diblock copolymer under solvent exchange. We show that the distribution of cosolvent and water in the polymer domain is strongly dependent on the affinity difference of cosolvent to water and to the polymer segments, which further impact the chain conformation and induce different self-assembly behaviors. Moreover, a cosolvent-dependent critical water fraction is found for the observation of the LLPS. Our findings would be helpful for the efficient engineering of nanostructures.

2. Results and Discussion

2.1. Direct Self-Assembly of Diblock Copolymer in Water

For comparison with the self-assembly behaviors under solvent exchange, the self-assembly of A2B12 starting from a homogeneous dispersion in pure water is also performed. The typical snapshots as a function of time in two simulation trajectories are shown in Figure 1. In the first trajectory, all chains are aggregated into a disk-like micelle and then a vesicle is formed by bending and closing the bilayer membrane (Figure 1a). The insets clearly show the integral disk-like and bowl-like intermediates. In the second trajectory, a small disk-like structure is observed at the earlier time. To compare with the first trajectory quantitatively, the size of the clusters is characterized by the number of aggregated chains in it (nagg), and the clusters are identified by the contacts between the hydrophobic segments with a distance less than 1.5 rcut. Here, the small disk-like structure has nagg of 511, and it forms a vesicle quickly via the local collapse of the surface (Figure 1b). Clearly, both trajectories follow the “bilayer-closing” mechanism (Mechanism I) [10]. It is reported that vesicles also could form via a semi-vesicle pathway (Mechanism II) [12]. We did not observe this process in our A2B12 system from self-assembly in water; it may be the relative moderate hydrophobic property of aBW = 50 adopted in this study [17].

2.2. Self-Assembly in Liquid Mixture Where Cosolvent and Water Is Attractive

In the case of aWG = 15, the difference between aWG and aAG (aBG) is −10, which means the cosolvent and water is highly attractive. As it is seen in Figure 2a, when the self-assembly starts from ϕ W init = 30%, the randomly dispersed chains gather into many small clusters (the nagg of the largest cluster is 161, the second 90, and others 16~34) after 2 × 10⁶ time steps for equilibrium. With the increase of ϕW, small clusters merge continuously and at ϕW = 36.25%, two big irregular clusters are seen in the simulation box. The section view of the biggest one (seen in the insertion) demonstrates that the hydrophilic and hydrophobic blocks are not segregated. These disordered clusters indicate LLPS [18] and are also observed by other simulations [21,22]. Then a large irregular cluster is formed at ϕW = 37.5%, and the section slide shows several cavities exist in the interior and that the outer hydrophobic membrane has been basically formed. Afterwards, the discrete cavities merge with each other at ϕW = 38.75% and finally, a most matured vesicle is found at ϕW = 40%.
The morphologies at ϕW = 37.5%, 38.75%, and 40% are further characterized by analyzing the profiles of number density of all components (water, cosolvent, block A, and block B) along the long axis of the clusters, respectively (Figure 2b). At ϕW = 37.5%, blocks A and B are almost randomly distributed in the cluster containing a large amount of solvents because of the irregular shapes and dispersion of cavities. It also indicates that the hydrophilic and hydrophobic blocks are not clearly segregated. At ϕW = 38.75%, hydrophobic blocks move away from the center. At ϕW = 40%, the hydrophobic membrane and the interior/exterior shells are clearly seen. Moreover, the solvent molecules are going away from the hydrophobic membrane simultaneously. Therefore, the density profiles shown in Figure 2b further prove the phase separation process (rearrangement) within the polymer-rich liquid droplet. It is noteworthy that, besides the phase separation (or internal rearragment) in the cluster, the size of the cluster shrinks gradually as indicated by the decreased distance of blocks A and B from the center of the aggregates. The formation of LLPS and the subsequent rearrangement is also observed by a long simulation of 4.0 × 10⁶ time steps at a fixed ϕW = 40% (Figure S1).
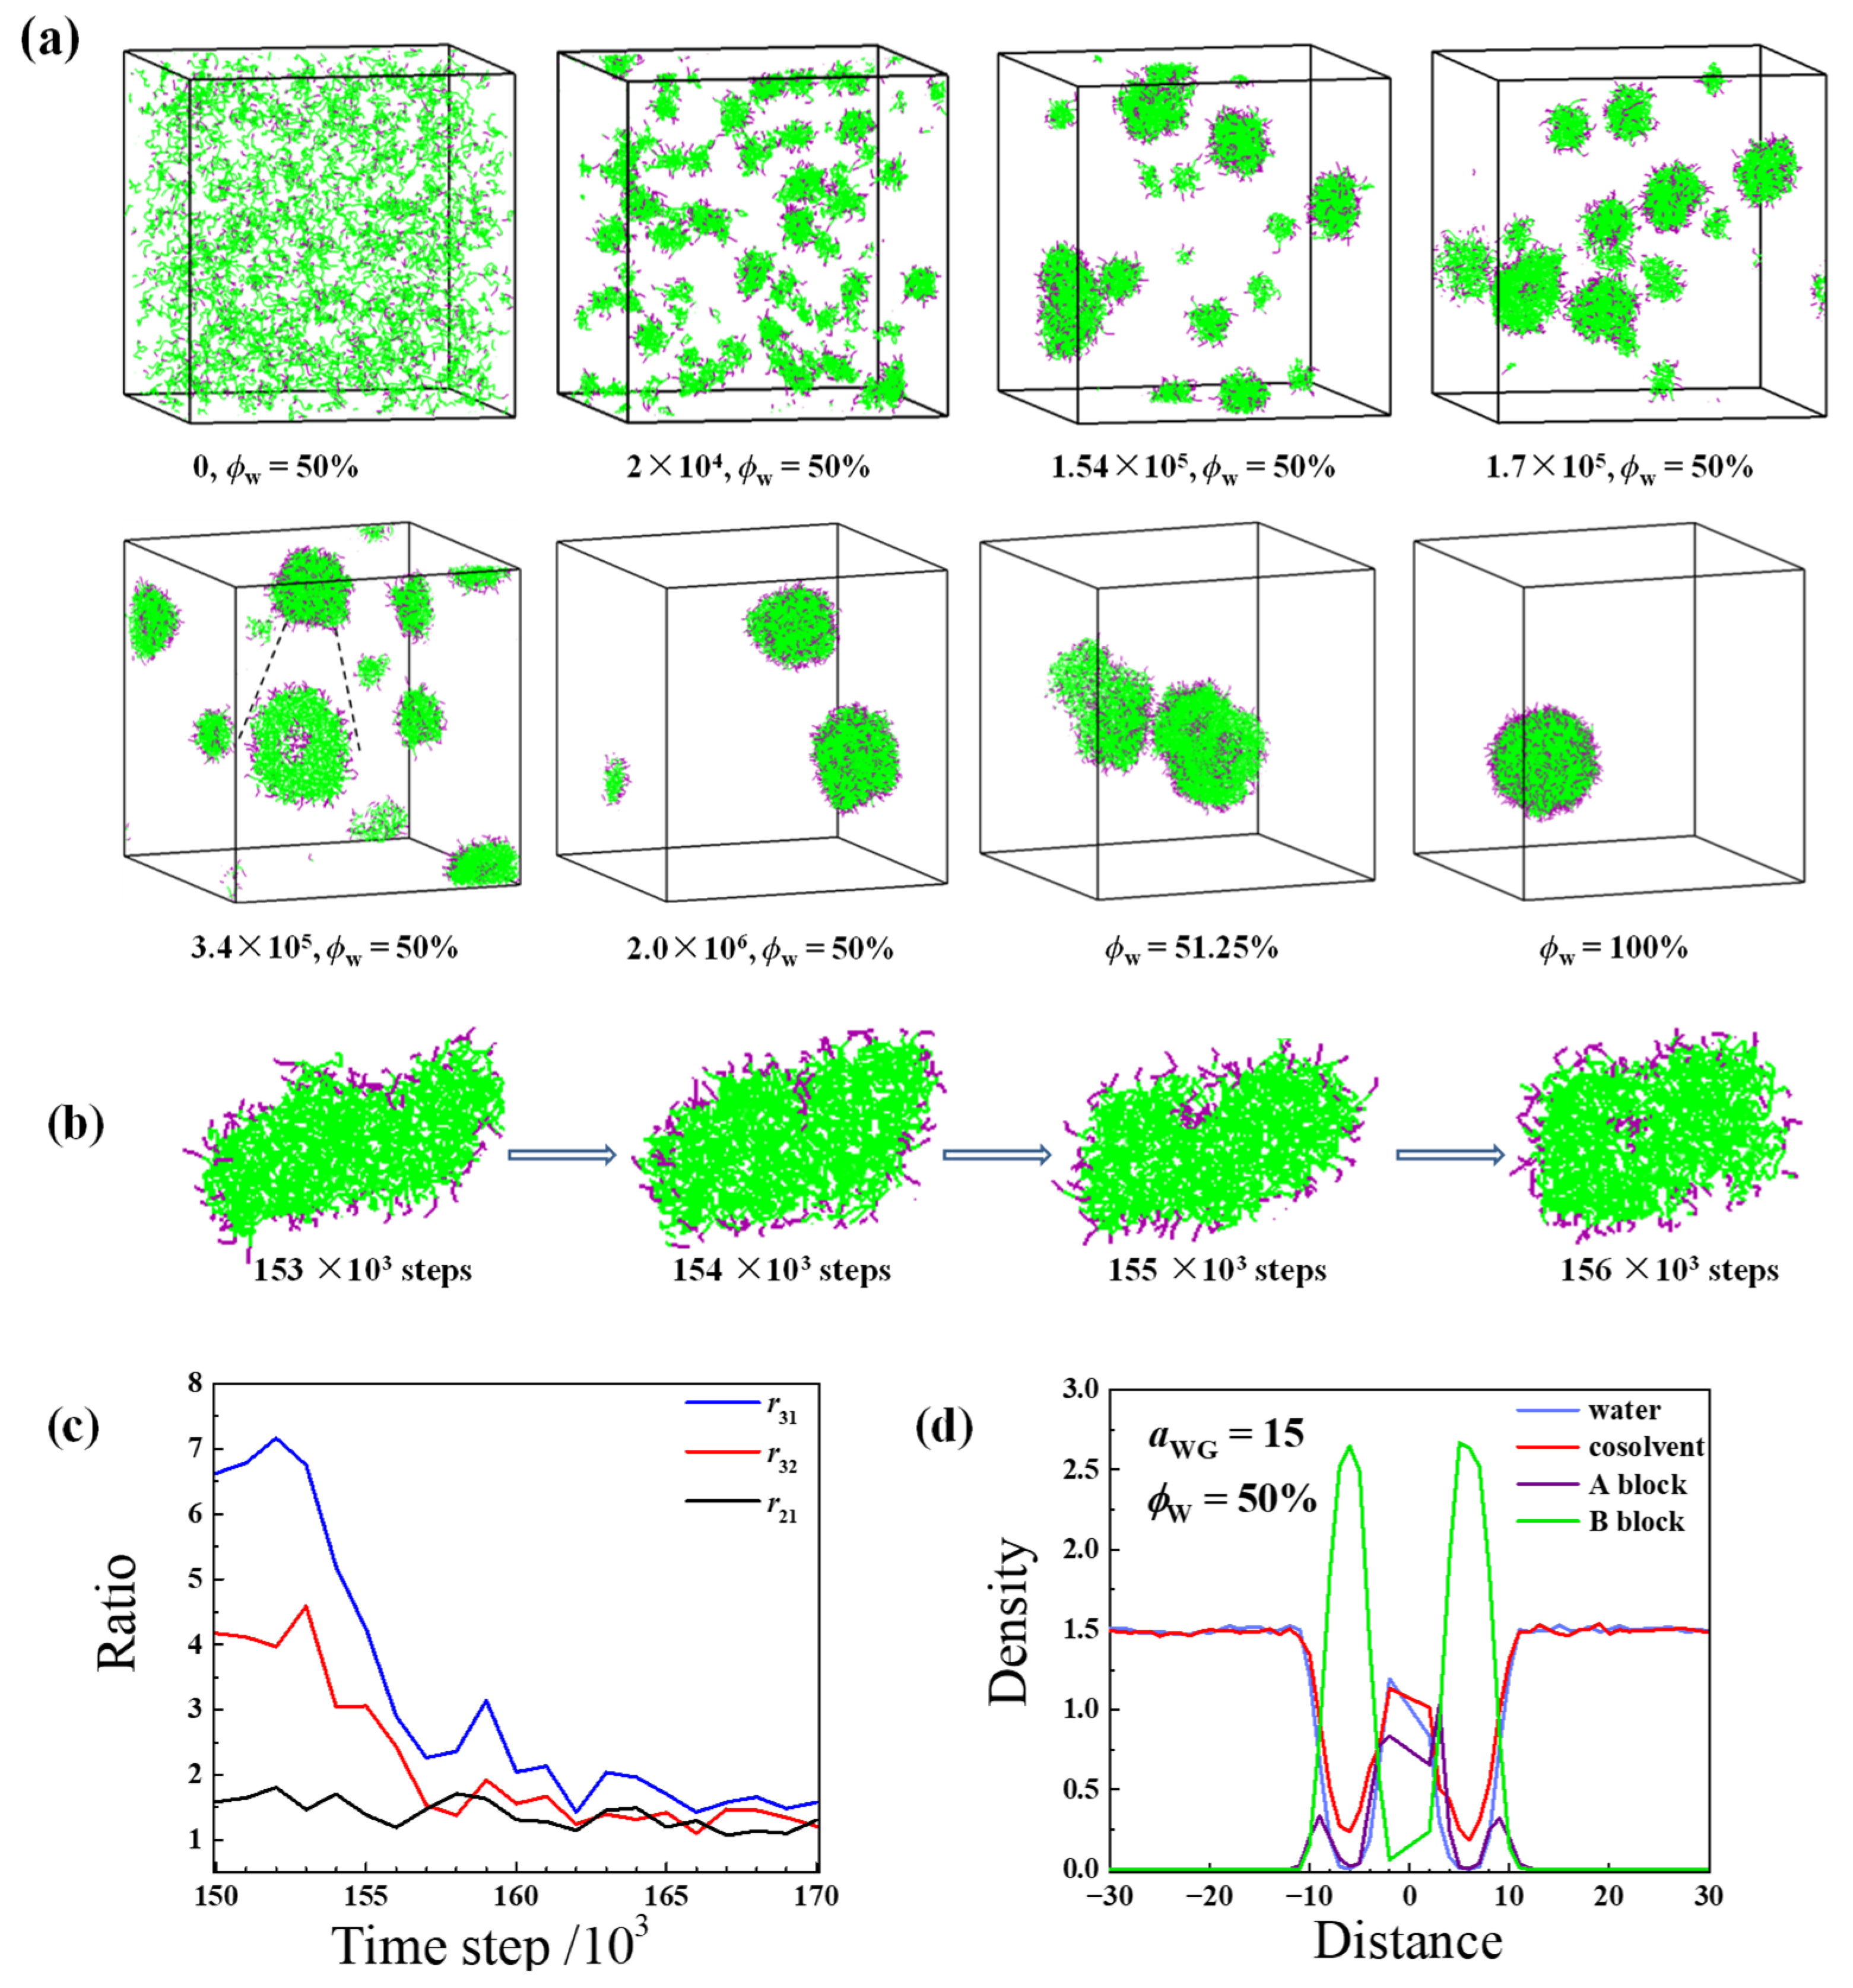
Strikingly, when the self-assembly starts from the solvent composition ϕ W init = 50%, the vesicle formation undergoes a different way. As shown in Figure 3a, during 2.0 × 10⁶ time steps of equilibrium at ϕW = 50%, the randomly dispersed chains are quickly aggregated; tiny irregular micelles, small cylindrical structures, and small vesicles are observed successively, and finally, two vesicles are observed. Afterwards, with the further increase of ϕW, two vesicles fuse into a large one. Careful analysis indicates that some small elongated vesicles are present at the very earlier stage of the self-assembly process. For example, Figure 3b shows the evolution of the largest aggregate (nagg = 267) during 1.53 × 10⁵ to 1.57 × 10⁵ time steps. It is seen that an elongated vesicle is formed by diffusion of the hydrophilic blocks into the center of the small cylinder.
In order to describe the instantaneous shape of the aggregates, we calculate the three eigenvalues λ1, λ2, and λ3 of the radius of the gyration tensor, which is defined as [34]:
A = S x x S x y S x z S y x S y y S y z S z x S z y S z z
and:
S a b = 1 n i = 1 n a i a cm b i b cm
where a and b denote x, y, or z components of the bead’s coordinates, ai and acm for the ith-bead and center-of-mass of the aggregate, respectively, and n is the total number of beads in the aggregate. In the following, we sort the three eigenvalues of the matrix of Equation (3) as λ1λ2λ3. It is expected that Rg2 = λ1 + λ2 + λ3. Then, the ratios of the three eigenvalues are presented by r31 =λ3/λ1, r32 =λ3/λ2, and r21 =λ2/λ1, respectively. Here, r31 is the ratio of the long axis to the short axis, and the r21 is the ratio of the long axis to the middle axis. The larger the value of the two, the closer the shape of the aggregate is to the cylinder-like; r32 is the ratio of the middle axis to the short axis. Its value is close to 1 and indicates that the cross-section of the aggregate is circular.
As shown in Figure 3c, at 1.5 × 10⁵ time steps, r31 is much larger than r32 and r21, and r21 is around 1.5. Therefore, the aggregate is flat cylinder-like with a long axis. With the time increases, r31 and r32 decrease quickly and the three ratios become very close after 1.62 × 10⁵ time steps, indicating the subsequent structural transformation from the elongated semi-vesicle into a spherical vesicle. This process is very similar to an in-between pathway between Mechanism I (by bilayer-closing) and Mechanism II (via semi-vesicle intermediate) reported in the literature [17]. The density profile of the largest aggregate at 3.4 × 10⁵ time steps is shown in Figure 3d. We can see that the vesicle is well organized and the hydrophobic membane is dense with only a few of the cosolvent beads within it.
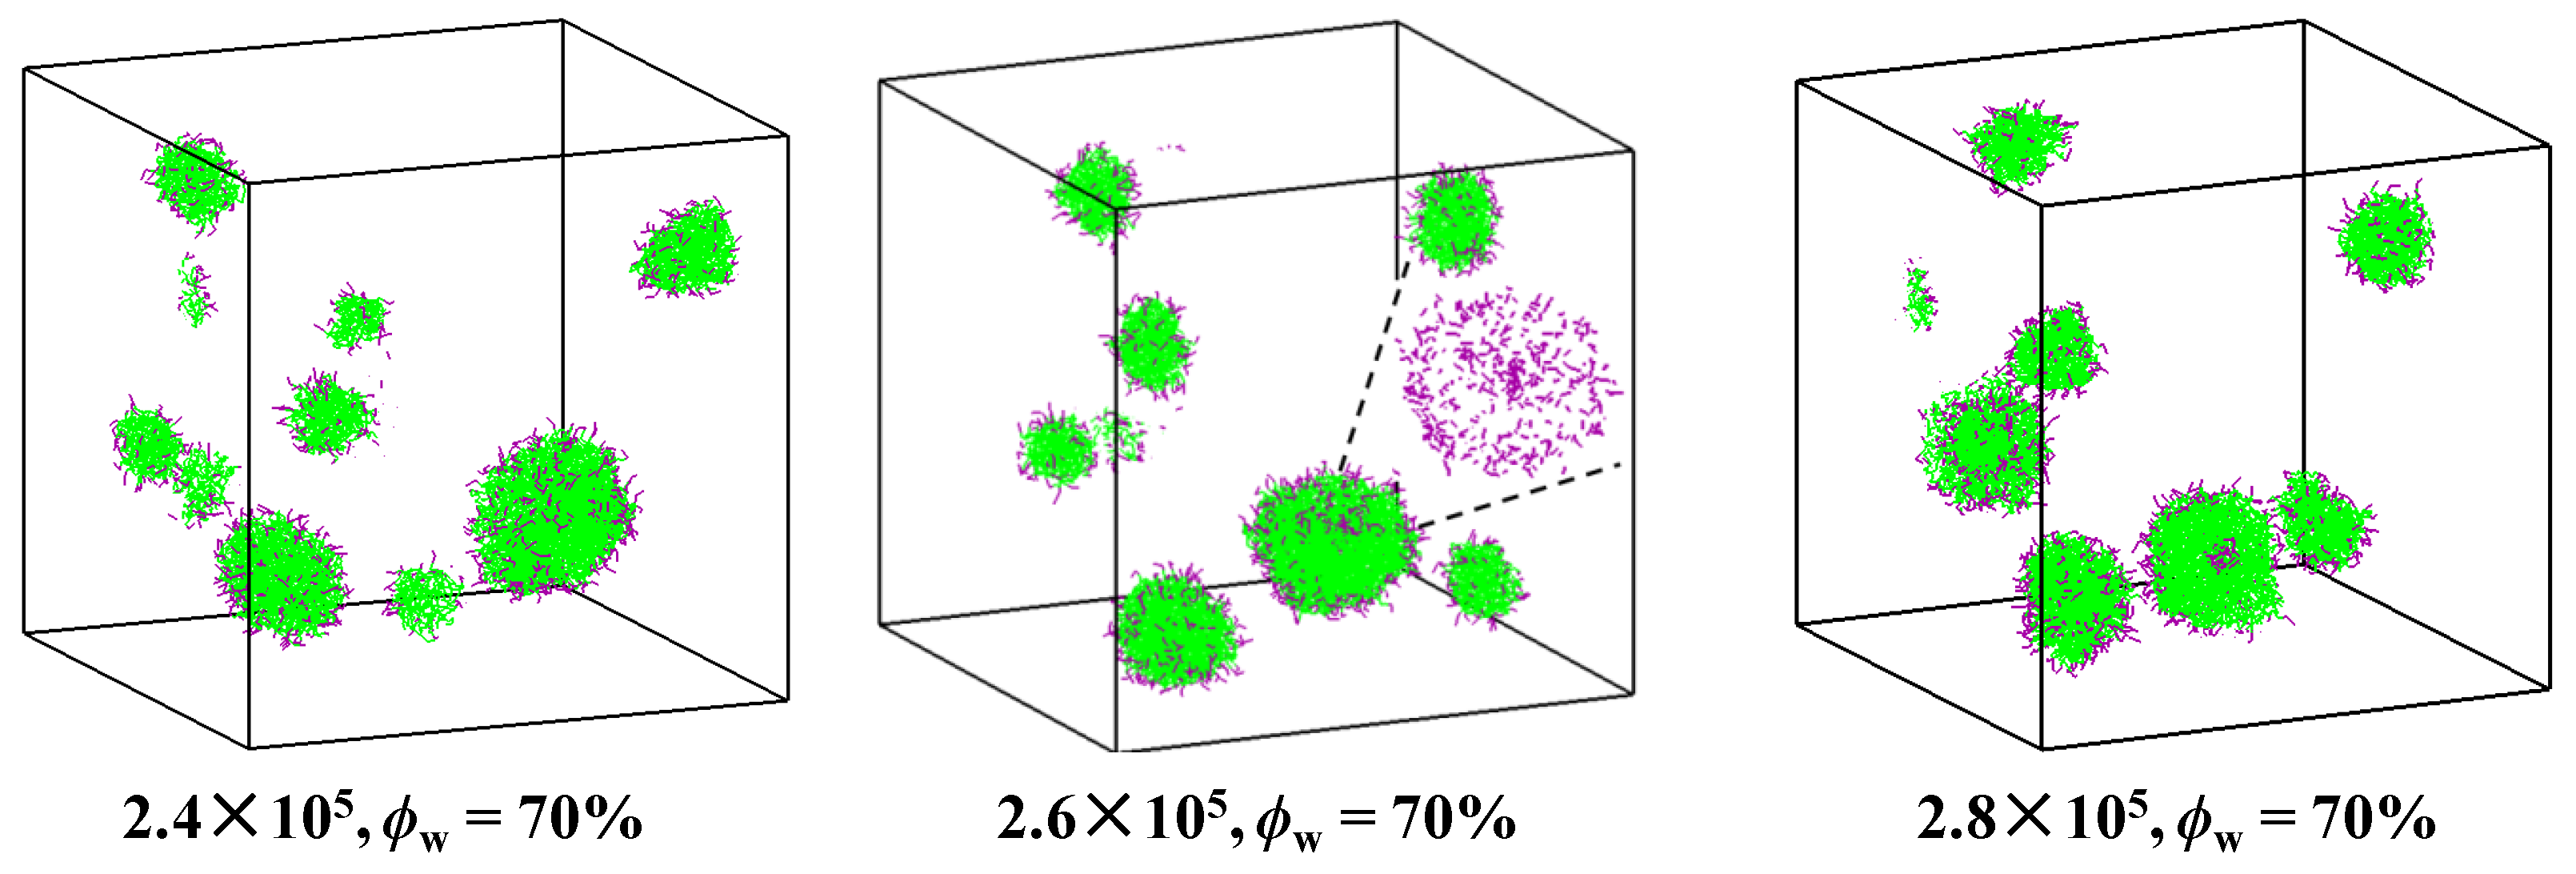
When the self-assembly starts from ϕ W init = 70%, a typical dense disk-like intermediate with nagg = 476 is found at 2.4 × 10⁵ time steps, as shown in Figure 4. After the local collapse of the disk surface at 2.6 × 10⁵ time steps (seen in the inset of Figure 4), a small vesicle is seen. This process undergoes very quickly at ϕW = 70%. To verify the self-assembly behavior, five independent simulations are carried out. Small and dense vesicles are formed first by the local collapse of the disk surface in all five simulations, and the average nagg of the first observed vesicles is 407 ± 52.

2.3. Self-Assembly in Liquid Mixture Where Cosolvent and Water Is Repulsive

In the case of aWG = 30, the difference between aWG and aAG (aBG) is 5, which means the cosolvent and water is repulsive but marginally misicible. The self-assembly of A2B12 starting from ϕ W init = 30% is shown in Figure 5. After equilibrium for 2.0 × 10⁶ time steps, only very tiny aggegates are seen, which means the polymer chains are more soluble when the cosolvent and water is weakly repulsive. Therefore, a slow exchange frequency of teq = 6 × 10⁵ time steps is adopted at each solvent switch step for cluster coalescence.
As shown in Figure 5, most chains are free in the solvent mixture at ϕW = 30%. With the increase of ϕW, some small cottony aggregates with nagg = 20~32 are formed at ϕW = 35%. The snapshot and density profile of the largest cluster (nagg = 32) indicate that those small cottony aggregates are LLPS intermediates (Figure S2). These aggregates fuse continuously and at ϕW = 55%, most polymer chains are involved into a big irregular cluster. The section slide of the cluster indicates that the polymer chains are loosely agglomerated and the hydrophilic and hydrophobic blocks are not segregated. Afterwards, phase separation in the cluster takes place gradually, the closed aqueous cavities form and join together, and finally, a most matured vesicle is seen at ϕW = 70%. Therefore, the self-assembly progress starting from ϕ W init = 30% in the case of aWG = 30 is similar to that in the case of aWG = 15, but the evolution from LLPS to vescile occurs later and the LLPS could be observed starting from a broader ϕ W init range. Moreover, lots of cosolvents adsorbed on the vesicle membrane, and the membrane is wide and loose, as demonstrated by the density profile analysis.
The self-assembly of A2B12 starting from ϕ W init = 60% is shown in Figure S3; with the time increases, cottony structures composed of loosely gathered micro-domains are seen during the equilibrium process. They develop into a large quasi-spherical aggregate at 2.0 × 10⁶ time steps without obvious segregated hydrophobic and hydrophilic domains. With the cosolvent gradually exchanged to water, internal phase separation continues and finally, a most matured vesicle is seen at ϕW = 70%. Afterwards, the vesicle membrane becomes dense, and the vesicle and the internal cavity shrink gradually. Therefore, the vesicle formation also obeys the phase separation mechanism.
When ϕ W init is 70%, though some small aggregates with local collapses on the surface are found at a very early stage, they could not develop into spherical vesicles because of the small sizes (with nagg = 200~250). When time increases, a sheet-like intermediate with nagg = 483 is seen at 4.2 × 10⁵ time steps after mergence of the small aggregates, which then bends and closes into a vesicle at 4.6 × 10⁵ time steps (Figure 6). Compared with the vesicle observed in Figure 4, the formed structure is highly swelling and the apparent size is much larger. Finally, two vesicles are observed after 2 × 10⁶ equilibrium time steps. They fuse into a big one with the further increase of ϕW. Therefore, when ϕ W init = 70%, the vesicle formation obeys a typical Mechanism I pathway. We also ran five simulations starting from ϕ W init = 70%, the average nagg of the first observed vesicles is 426 ± 54, which is a bit less than the value in the case of aWG = 15. However, the apparent sizes of these vesicles are much larger. Moreover, all trajectories show the typical bilayer bending process.

2.4. The Physiochemical Principles behind the Different Self-Assembly Behaviors

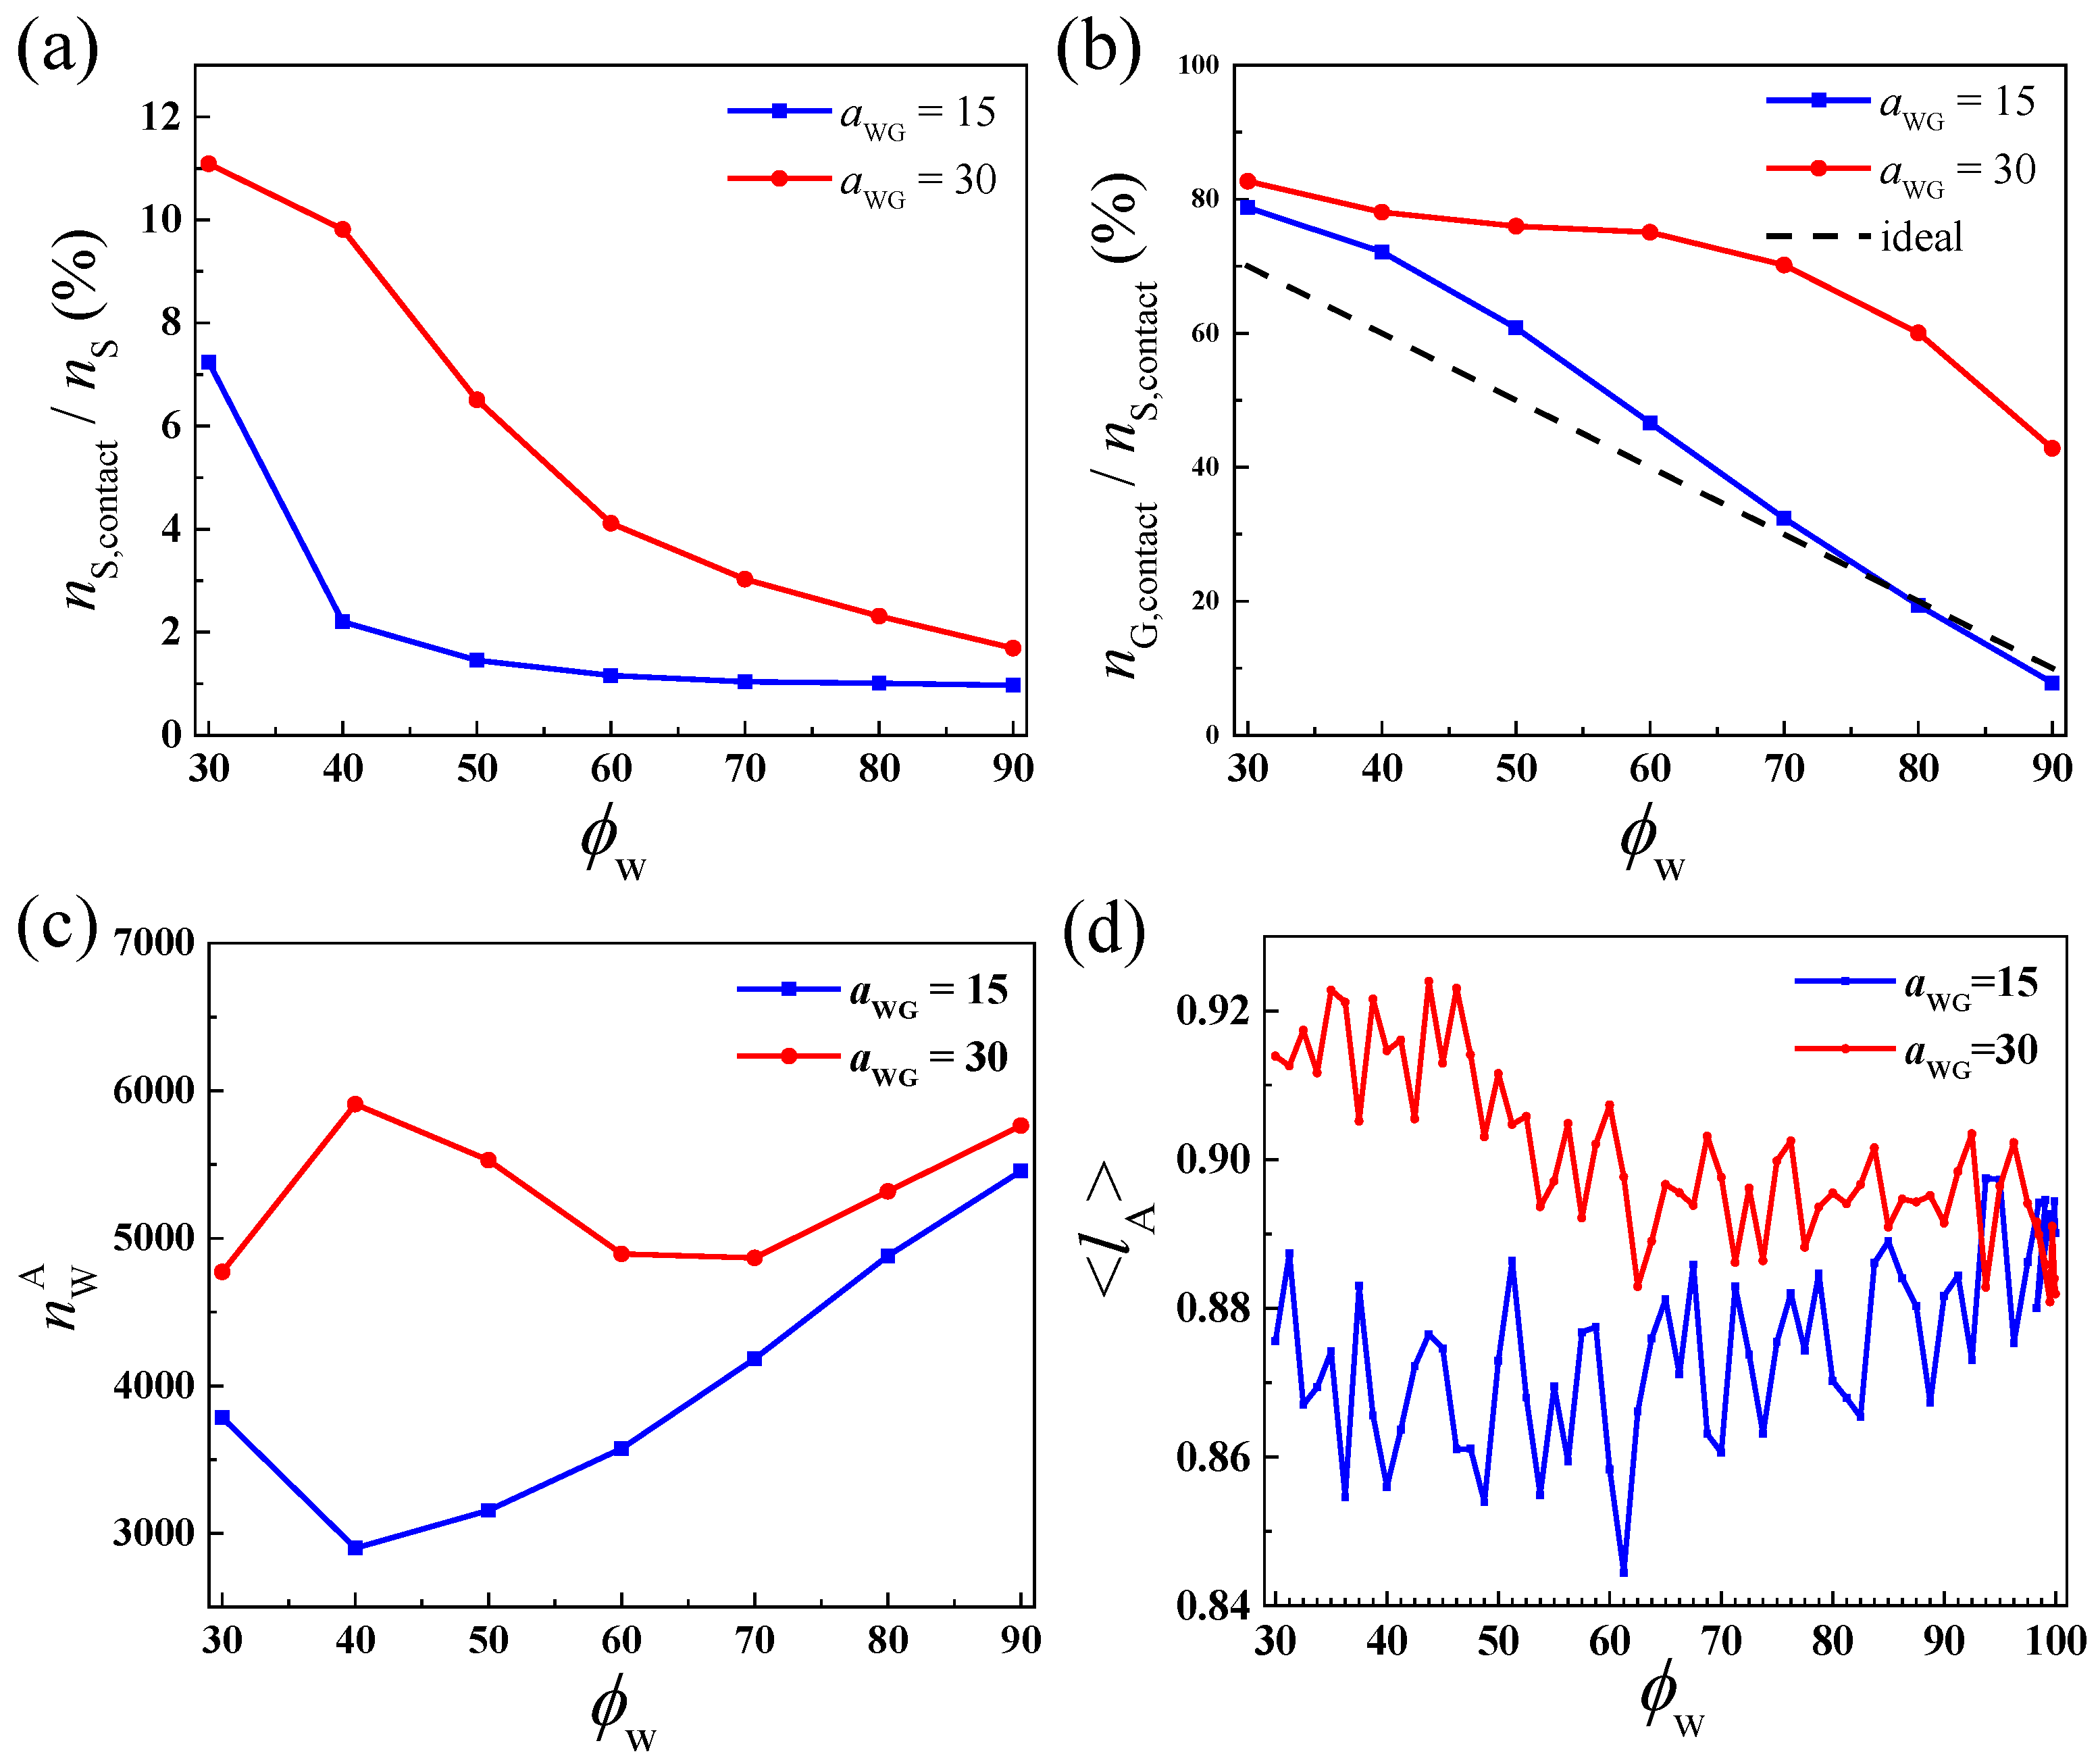
To understand the phys-chemical basis behind the behaviors in the different solvent mixtures, the fractions of solvent beads (both cosolvent and water) which contact with polymers (distance to polymer beads r ≤ 1.0) and the percentages of the cosolvent beads in the contacted solvent beads are shown in Figure 7a,b. Both values are higher in the case of aWG = 30, which indicates that the cosolvent is preferentially adsorbed in the polymer phase when the cosolvent and water are weakly repulsive. The high cosolvent content in the clusters would weaken the repulsion interactions of aAB and aBW. Therefore, when aWG is higher, there are more free chains in the system, the LLPS could be observed starting from a broader ϕ W init range, and the formed clusters swell highly. Moreover, in the case of aWG = 15, the percentage of cosolvent in the contacted solvents is higher than the average ϕG (= 1 − ϕW) if ϕW < 80%, which means that the cosolvent is also slightly enriched in the polymer phase even in a strongly attractive liquid mixture.
The number of water beads which contact with block A ( n W A ) is further calculated. Interestly, in the case of aWG = 15, n W A shows the lowest value at about ϕW = 40% (Figure 7c), and the values at ϕW = 40% and 50% are obviously less than that at ϕW = 30%. It means the addition of water, a second good solvent to hydrophobic blocks, induces the depletion of both solvents. Therefore, the hydrophilic blocks collapse in the liquid mixture composed of two good solvents, which is called the cononsolvency phenomenon [36,37,38]. As shown in Figure 7d, the average bond length of hydrophilic blocks shrinks in the case of aWG = 15 while it is stretched in the case of aWG = 30 when ϕW < 60%. The hydrophobic blocks agglomerate quickly in the former to avoid exposing to water. The collapsed hydrophilic chains also indicate that the high affinity between cosolvent and water would promote the immiscibility of the copolymer chains in the solvent mixture, thus, the apparent hydrophobic property of the copolymers seems improved and it explains why the small elongated semi-vesicles are observed before vesicle formation at ϕW = 50%.

3. Methods and Parameters

3.1. DPD Simulations

DPD is a mesoscale method for the simulations of coarse-grained systems over long length and time scales. In DPD, a bead having mass m represents a block or a cluster of atoms or molecules moving together in a coherent fashion. In this study, the amphiphilic diblock copolymers are simplified into linear coarse-grained chains composed of hydrophilic A beads and hydrophobic B beads. A model diblock copolymer A2B12 with a short hydrophilic segment is constructed as it is reported that LLPS is preferred over micellization at a weak hydrophilicity of the block copolymer, e.g., 25% or less [18,20]. Two types of solvent beads, beads W which present a selective solvent for A beads (e.g., water) and beads G which means a good solvent for both A and B beads, are considered in the systems. The forces acting on a bead i can be described by:
f i = j i ( F i j C + F i j D + F i j R ) + f i S
where F i j C is a soft conservative repulsive force, F i j D is a dissipative force for viscous drag, and F i j R is a stochastic impulse force [39]. All three forces which act over each bead are within a cutoff radius rcut, beyond which the forces vanish [40]. Specifically, the conservative force F i j C is expressed as:
F i j C = a i j ( 1 r i j / r cut ) ( r i j   <   r cut ) 0   ( r i j   >   r cut )
where aij denotes repulsive parameters between two beads in F i j C and is given in Table 1.
We set aii = ajj = 25 for any two beads of the same kind. As found by Groot and Warren, ∆aij = aijaii is proportional to the Flory–Huggins parameter χij [40]. Specifically, for the system with the reduced number density ρ = 3, χij = (0.286 ± 0.002) × ∆aij. Therefore, aAG = aBG = 25 indicates G is a cosolvent (good solvent) for A and B, while aAW = 25 and aBW = 50 mean W is a selective solvent to A. The strong repulsion aAB = 50 represents that beads A and B are immiscible, which are ubiquitous for polymer components. The solvent–cosolvent interactions aWG is set to 15 or 30. Specifically, aWG < 25 presents an attractive liquid mixture, for example, the dimethyl sulfoxide and water mixture exhibits a negative free energy of mixing throughout the concentration range because of the strong hydrogen bonds [41]. The value of aWG = 30, whose corresponding χWG = 0.286 × (30 − 25) = 1.43 is below the critical value for phase separation of monomer blends (χcrit = 2.0), means the solvent and cosolvent are marginally miscible, for example, the THF and water mixture [42]. It is worth noting that it is the difference between aWG and aAG (=aBG) which determines the relative miscibility among cosolvents, water, and copolymers [34]. For the A2B12 copolymer, the vesicular structure is thermodynamically stable in the final polymer solution (see below). Our preliminary results indicate that the solvent exchange self-assembly behaviors between aWG = 15~30 are in the middle of the two cases. Therefore, in this study, we only discuss the self-assembly processes of A2B12 copolymers under the two extreme and typical instances.
For adjacent bonded beads, a harmonic spring force f i S = j C S r i j is used, where CS is the spring constant. To keep the balance of the accuracy and the efficiency of DPD simulations, the mass, length, and energy presented by m, rcut, and kBT, respectively, are set to m = rcut = kBT = 1, where kB is the Boltzmann constant, T is the temperature, and the time unit τ = rcut (m/kBT)1/2 = 1. The magnitude of spring constant CS and the dissipation parameter are chosen to be 4.0 and 4.5, respectively. The time step is ∆t = 0.05τ.

3.2. Solvent Exchange Method

All the simulations are performed in a 60 × 60 × 60 periodic box containing 6.48 × 10⁵ beads (ρ = 3). Initially, 1000 coarse-grained chains of A2B12, corresponding to the volume fraction of copolymers (fp) about 2.16% are dispersed randomly in a mixed solvent composed of W and G beads. The interaction parameters aij for all bead pairs are set to 25, and after 1.0 × 10⁵ time steps for equilibrium, a homogenous mixture is obtained. Then, the pair interaction parameters shown in Table 1 are imposed to the beads and after 2.0 × 10⁶ time steps of equilibrium, the self-assembly process is monitored by using a solvent exchange strategy to mimic the dialysis process in the experiment.
Especially, in each solvent exchange step, the number of exchanged G beads (nG,ex) is determined by the bead number that is supposed to switch (nG,sup) and the number of beads outside of the polymer aggregates or away from single chains (nG,out). If nG,out > 2 × nG,sup, nG,ex is equal to nG,sup, otherwise, nG,ex is set to 0.5 × nG,out. After each solvent switch, the system is equilibrated with a time duration of teq, then, the next step is performed until less than 200 G beads are left in the system. Finally, the trace amount of G beads is switched and there are only W beads present in the systems.
The relative content of W beads in the mixed solvent (ϕW), defined as [42] nW/(nW + nG) × 100%, is used to describe the solvent composition. Here, nW and nG are the number of W beads and G beads in the simulation box, respectively. The initial water fraction ϕW ( ϕ W init ) is set to 30% because below that concentration, no featured aggregates are found (see the Section 2 Results and Discussion). The supposed exchange quantity at each step nG,sup is equivalent to 1.25% of the total solvent beads, and teq is 2.0 × 10⁵ time steps. As observed in experiments, the morphology of the aggregates could be kinetically trapped by the cosolvent/water ratio; therefore, different ϕ W init values are also adopted to investigate the self-assembly process. All the DPD simulations were conducted using DL_MESO 2.4 software [43].

4. Conclusions

In this study, the influence of cosolvent on the vesicle formation pathways is investigated by using dissipative particle dynamics. It is found that the presence of LLPS will be highly dependent on the affinity difference of cosolvent to water and to polymer repeat units. If the cosolvent and water is strongly attractive, LLPS occurs at the low water fraction, the segregation of polymer segments afterwards is very quick and the membrane of the semi-matured vesicles is dense. If the cosolvent and water is weakly repulsive, LLPS could be observed within a wide range of solvent composition, the evolution of vesicle is relatively slow, and the membrane is loose. Moreover, when the initial water fraction rises, micellization is preferential, and at a specific solvent composition, the use of cosolvent with strong affinity to water would promote to form small vesicles via an elongated semi-vesicle intermediate. With the further increase of water fraction, in both cases, only bilayer bending and closing processes are observed. It is found that the adsorption of the cosolvents in the polymer domains and the resulting hydrophilic chain conformations are critical for the control over the vesicle formation pathway. Our findings would be helpful for molecular engineering of the vesicle structures and for further potential applications. It also should be mentioned, the vesicular structures have been observed within a broad range of hydrophilic content of copolymers, and in experiments the choice of solvents would be subtle on the control over the final morphologies. Therefore, it is worthwhile to investigate the self-assembly of copolymers with the varied hydrophilic-to-hydrophobic balance and to explore the delicate influences of solvents on the formation and mechanisms of different morphologies in future.

Supplementary Materials

The following supporting information can be downloaded at: https://www.mdpi.com/article/10.3390/molecules28135113/s1, Figure S1: The self-assembly of A2B12 during solvent exchange at ϕW = 40% in the case of aWG = 15. Figure S2: (a) The snapshot of an aggregate having nagg = 32 observed at ϕW = 35% in the case of aWG = 30. (b) Density profiles of water, cosolvent and copolymer blocks versus the distance from the mass center of the corresponding morphologies in (a). Figure S3: The self-assembly of A2B12 during solvent exchange in the case of aWG = 30 starting from ϕ W init = 60%. An equilibrium duration of 2.0 × 10⁶ time steps at ϕ W init = 60% and an exchange frequency of teq = 2.0 × 10⁵ time steps are adopted.

Author Contributions

Conceptualization, Z.L. and B.W.; Methodology, Z.L.; Validation, Z.L., Z.S. and B.W.; Formal Analysis, Z.L. and Z.S.; Investigation, Z.S.; Resources, Z.S. and Y.J.; Data Curation, Z.S. and Y.J.; Writing—Original Draft Preparation, Z.L.; Writing—Review and Editing, B.W.; Visualization, Z.S. and Y.J.; Supervision, Z.L.; Project Administration, Z.L.; Funding Acquisition, Z.L. All authors have read and agreed to the published version of the manuscript.

Funding

The work was supported by the Top-notch Academic Programs Project of Jiangsu Higher Education Institutions (TAPP), and the Priority Academic Program Development of Jiangsu Higher Education Institutions (PAPD).

Institutional Review Board Statement

Not applicable.

Informed Consent Statement

Not applicable.

Data Availability Statement

The data presented in this study are available on request from the corresponding author.

Acknowledgments

The authors wish to thank the High Performance Computation Laboratory of Changzhou University for usage of their computing facilities.

Conflicts of Interest

The authors declare no conflict of interest.

Sample Availability

Not applicable.

References

  1. Mai, Y.Y.; Eisenberg, A. Self-assembly of block copolymers. Chem. Soc. Rev. 2012, 41, 5969–5985. [Google Scholar] [CrossRef]
  2. Deng, Z.Y.; Liu, S.Y. Emerging trends in solution self-assembly of block copolymers. Polymer 2020, 207, 122914. [Google Scholar] [CrossRef]
  3. Meng, F.; Zhong, Z.; Feijen, J. Stimuli-responsive polymersomes for programmed drug delivery. Biomacromolecules 2009, 10, 197–209. [Google Scholar] [CrossRef] [PubMed]
  4. Gaurav, I.; Thakur, A.; Iyaswamy, A.; Wang, X.H.; Chen, X.Y.; Yang, Z.J. Factors affecting extracellular vesicles based drug delivery systems. Molecules 2021, 26, 1544. [Google Scholar] [CrossRef] [PubMed]
  5. Han, E.; Kim, D.; Cho, Y.; Lee, S.; Kim, J.; Kim, H. Development of polymersomes co-delivering doxorubicin and melittin to overcome multidrug resistance. Molecules 2023, 28, 1087. [Google Scholar] [CrossRef] [PubMed]
  6. Larrañaga, A.; Lomora, M.; Sarasua, J.R.; Palivan, C.G.; Pandit, A. Polymer capsules as micro-/nanoreactors for therapeutic applications: Current strategies to control membrane permeability. Prog. Mater. Sci. 2017, 90, 325–357. [Google Scholar] [CrossRef]
  7. Tu, Y.F.; Peng, F.; Adawy, A.; Men, Y.J.; Abdelmohsen, L.K.E.A.; Wilson, D.A. Mimicking the cell: Bio-inspired functions of supramolecular assemblies. Chem. Rev. 2016, 116, 2023–2078. [Google Scholar] [CrossRef]
  8. Tanner, P.; Baumann, P.; Enea, R.; Onaca, O.; Palivan, C.; Meier, W. Polymeric vesicles: From drug carriers to nanoreactors and artificial organelles. Acc. Chem. Res. 2011, 44, 1039–1049. [Google Scholar] [CrossRef]
  9. Du, J.Z.; O’Reilly, R.K. Advances and challenges in smart and functional polymer vesicles. Soft Matter 2009, 5, 3544–3561. [Google Scholar] [CrossRef]
  10. Noguchi, H.; Takasu, M. Self-assembly of amphiphiles into vesicles: A Brownian dynamics simulation. Phys. Rev. E 2001, 64, 041913. [Google Scholar] [CrossRef]
  11. He, X.H.; Schmid, F. Spontaneous formation of complex micelles from a homogeneous solution. Phys. Rev. Lett. 2008, 100, 137802. [Google Scholar] [CrossRef] [PubMed] [Green Version]
  12. He, X.H.; Schmid, F. Dynamics of spontaneous vesicle formation in dilute solutions of amphiphilic diblock copolymers. Macromolecules 2006, 39, 2654–2662. [Google Scholar] [CrossRef]
  13. Ji, S.C.; Ding, J.D. Spontaneous formation of vesicles from mixed amphiphiles with dispersed molecular weight: Monte Carlo simulation. Langmuir 2006, 22, 553–559. [Google Scholar] [CrossRef] [PubMed]
  14. Weiss, T.M.; Narayanan, T.; Wolf, C.; Gradzielski, M.; Panine, P.; Finet, S.; Helsby, W.I. Dynamics of the self-assembly of unilamellar vesicles. Phys. Rev. Lett. 2005, 94, 038303. [Google Scholar] [CrossRef]
  15. Guo, Y.; Yang, S. Spontaneous formation and fusion of raspberry vesicle self-assembled from star block terpolymers in aqueous solution. Materials 2021, 14, 7690. [Google Scholar] [CrossRef]
  16. Korchagina, E.V.; Qiu, X.-P.; Winnik, F.M. Effect of heating rate on the pathway for vesicle formation in salt-free aqueous solutions of thermosensitive cationic diblock copolymers. Macromolecules 2013, 46, 2341–2351. [Google Scholar] [CrossRef]
  17. Xiao, M.Y.; Xia, G.J.; Wang, R.; Xie, D.Q. Controlling the self-assembly pathways of amphiphilic block copolymers into vesicles. Soft Matter 2012, 8, 7865–7874. [Google Scholar] [CrossRef]
  18. Ianiro, A.; Wu, H.L.; van Rijt, M.M.J.; Vena, M.P.; Keizer, A.D.A.; Esteves, A.C.C.; Tuinier, R.; Friedrich, H.; Sommerdijk, N.A.J.M.; Patterson, J.P. Liquid-liquid phase separation during amphiphilic self-assembly. Nat. Chem. 2019, 11, 320–328. [Google Scholar] [CrossRef] [Green Version]
  19. Sato, T.; Takahashi, R. Competition between the micellization and the liquid-liquid phase separation in amphiphilic block copolymer solutions. Polym. J. 2017, 49, 273–277. [Google Scholar] [CrossRef]
  20. Rizvi, A.; Patel, U.; Ianiro, A.; Hurst, P.J.; Merham, J.G.; Patterson, J.P. Nonionic block copolymer coacervates. Macromolecules 2020, 53, 6078–6086. [Google Scholar] [CrossRef]
  21. Campos-Villalobos, G.; Siperstein, F.R.; Charles, A.; Patti, A. Solvent-induced morphological transitions in methacrylate-based block-copolymer aggregates. J. Colloid. Interface Sci. 2020, 572, 133–140. [Google Scholar] [CrossRef] [PubMed] [Green Version]
  22. Bai, J.-L.; Liu, D.; Wang, R. Self-assembly of amphiphilic diblock copolymers induced by liquid-liquid phase separation. Chin. J. Polym. Sci. 2021, 39, 1217–1224. [Google Scholar] [CrossRef]
  23. Sato, T. Kinetics of micellization and liquid-liquid phase separation in dilute block copolymer solutions. Polymers 2023, 15, 708. [Google Scholar] [CrossRef] [PubMed]
  24. Han, Y.Y.; Yu, H.Z.; Du, H.B.; Jiang, W. Effect of selective solvent addition rate on the pathways for spontaneous vesicle formation of ABA amphiphilic triblock copolymers. J. Am. Chem. Soc. 2010, 132, 1144–1150. [Google Scholar] [CrossRef] [PubMed]
  25. Keßler, S.; Drese, K.; Schmid, F. Simulating copolymeric nanoparticle assembly in the co-solvent method: How mixing rates control final particle sizes and morphologies. Polymer 2017, 126, 9–18. [Google Scholar] [CrossRef] [Green Version]
  26. Wu, M.; Wang, Y.Y.; Han, Y.Y.; Cui, J.; Jiang, W. A facile method for preparation of uniform polymeric vesicles with tunable size. Nanoscale 2018, 10, 14860–14867. [Google Scholar] [CrossRef]
  27. Bovone, G.; Cousin, L.; Steiner, F.; Tibbitt, M.W. Solvent controls nanoparticle size during nanoprecipitation by limiting block copolymer assembly. Macromolecules 2022, 55, 8040–8048. [Google Scholar] [CrossRef]
  28. Choucair, A.; Lavigueur, C.; Eisenberg, A. Polystyrene-b-poly(acrylic acid) vesicle size control using solution properties and hydrophilic block length. Langmuir 2004, 20, 3894–3900. [Google Scholar] [CrossRef]
  29. Yu, Y.S.; Zhang, L.F.; Eisenberg, A. Morphogenic effect of solvent on crew-cut aggregates of apmphiphilic diblock copolymers. Macromolecules 1998, 31, 1144–1154. [Google Scholar] [CrossRef]
  30. Simonutti, R.; Bertani, D.; Marotta, R.; Ferrario, S.; Manzone, D.; Mauri, M.; Gregori, M.; Orlando, A.; Masserini, M. Morphogenic effect of common solvent in the self-assembly behavior of amphiphilic PEO-b-PLA. Polymer 2021, 218, 123511. [Google Scholar] [CrossRef]
  31. Borsdorf, L.; Herkert, L.; Baeumer, N.; Rubert, L.; Soberats, B.; Korevaar, P.A.; Bourque, C.; Gatsogiannis, C.; Fernandez, G. Pathway-controlled aqueous supramolecular polymerization via solvent-dependent chain conformation effects. J. Am. Chem. Soc. 2023, 145, 8882–8895. [Google Scholar] [CrossRef]
  32. Pijpers, I.A.B.; Meng, F.H.; van Hest, J.C.M.; Abdelmohsen, L.K.E.A. Investigating the self-assembly and shape transformation of poly(ethylene glycol)-b-poly(d,l-lactide) (PEG-PDLLA) polymersomes by tailoring solvent-polymer interactions. Polym. Chem. 2020, 11, 275–280. [Google Scholar] [CrossRef] [Green Version]
  33. Mukherji, D.; Marques, C.M.; Kremer, K. Polymer collapse in miscible good solvents is a generic phenomenon driven by preferential adsorption. Nat. Commun. 2014, 5, 4882. [Google Scholar] [CrossRef] [PubMed] [Green Version]
  34. Li, B.-Y.; Li, Y.-C.; Lu, Z.-Y. The important role of cosolvent in the amphiphilic diblock copolymer self-assembly process. Polymer 2019, 171, 1–7. [Google Scholar] [CrossRef]
  35. Buglakov, A.I.; Vasilevskaya, V.V. Fibrillar gel self-assembly via cononsolvency of amphiphilic polymer. J. Colloid. Interface Sci. 2022, 614, 181–193. [Google Scholar] [CrossRef]
  36. Bharadwaj, S.; van der Vegt, N.F.A. Does preferential adsorption drive cononsolvency? Macromolecules 2019, 52, 4131–4138. [Google Scholar] [CrossRef]
  37. Zuo, T.S.; Ma, C.L.; Jiao, G.S.; Han, Z.H.; Xiao, S.Y.; Liang, H.J.; Hong, L.; Bowron, D.; Soper, A.; Han, C.C.; et al. Water/cosolvent attraction induced phase separation: A molecular picture of cononsolvency. Macromolecules 2019, 52, 457–464. [Google Scholar] [CrossRef]
  38. Dudowicz, J.; Freed, K.F.; Douglas, J.F. Communication: Cosolvency and cononsolvency explained in terms of a Flory-Huggins type theory. J. Chem. Phys. 2015, 143, 131101. [Google Scholar] [CrossRef] [Green Version]
  39. Hoogerbrugge, P.J.; Koelman, J.M.V.A. Simulating microscopic hydrodynamic phenomena with dissipative particle dynamics. Europhys. Lett. 1992, 19, 155–160. [Google Scholar] [CrossRef]
  40. Groot, R.D.; Warren, P.B. Dissipative particle dynamics: Bridging the gap between atomistic and mesoscopic simulation. J. Chem. Phys. 1997, 107, 4423–4435. [Google Scholar] [CrossRef] [Green Version]
  41. Clever, H.L.; Pigott, S.P. Enthalpies of mixing of dimethylsulfoxide with water and with several ketones at 298.15 K. J. Chem. Thermodyn. 1971, 3, 221–225. [Google Scholar] [CrossRef]
  42. Yang, C.; Li, W.; Wu, C. Laser light-scattering study of solution dynamics of water/cycloether mixtures. J. Phys. Chem. B 2004, 108, 11866–11870. [Google Scholar] [CrossRef]
  43. Seaton, M.A.; Anderson, R.L.; Metz, S.; Smith, W. DL_MESO: Highly scalable mesoscale simulations. Mol. Simul. 2013, 39, 796–821. [Google Scholar] [CrossRef]
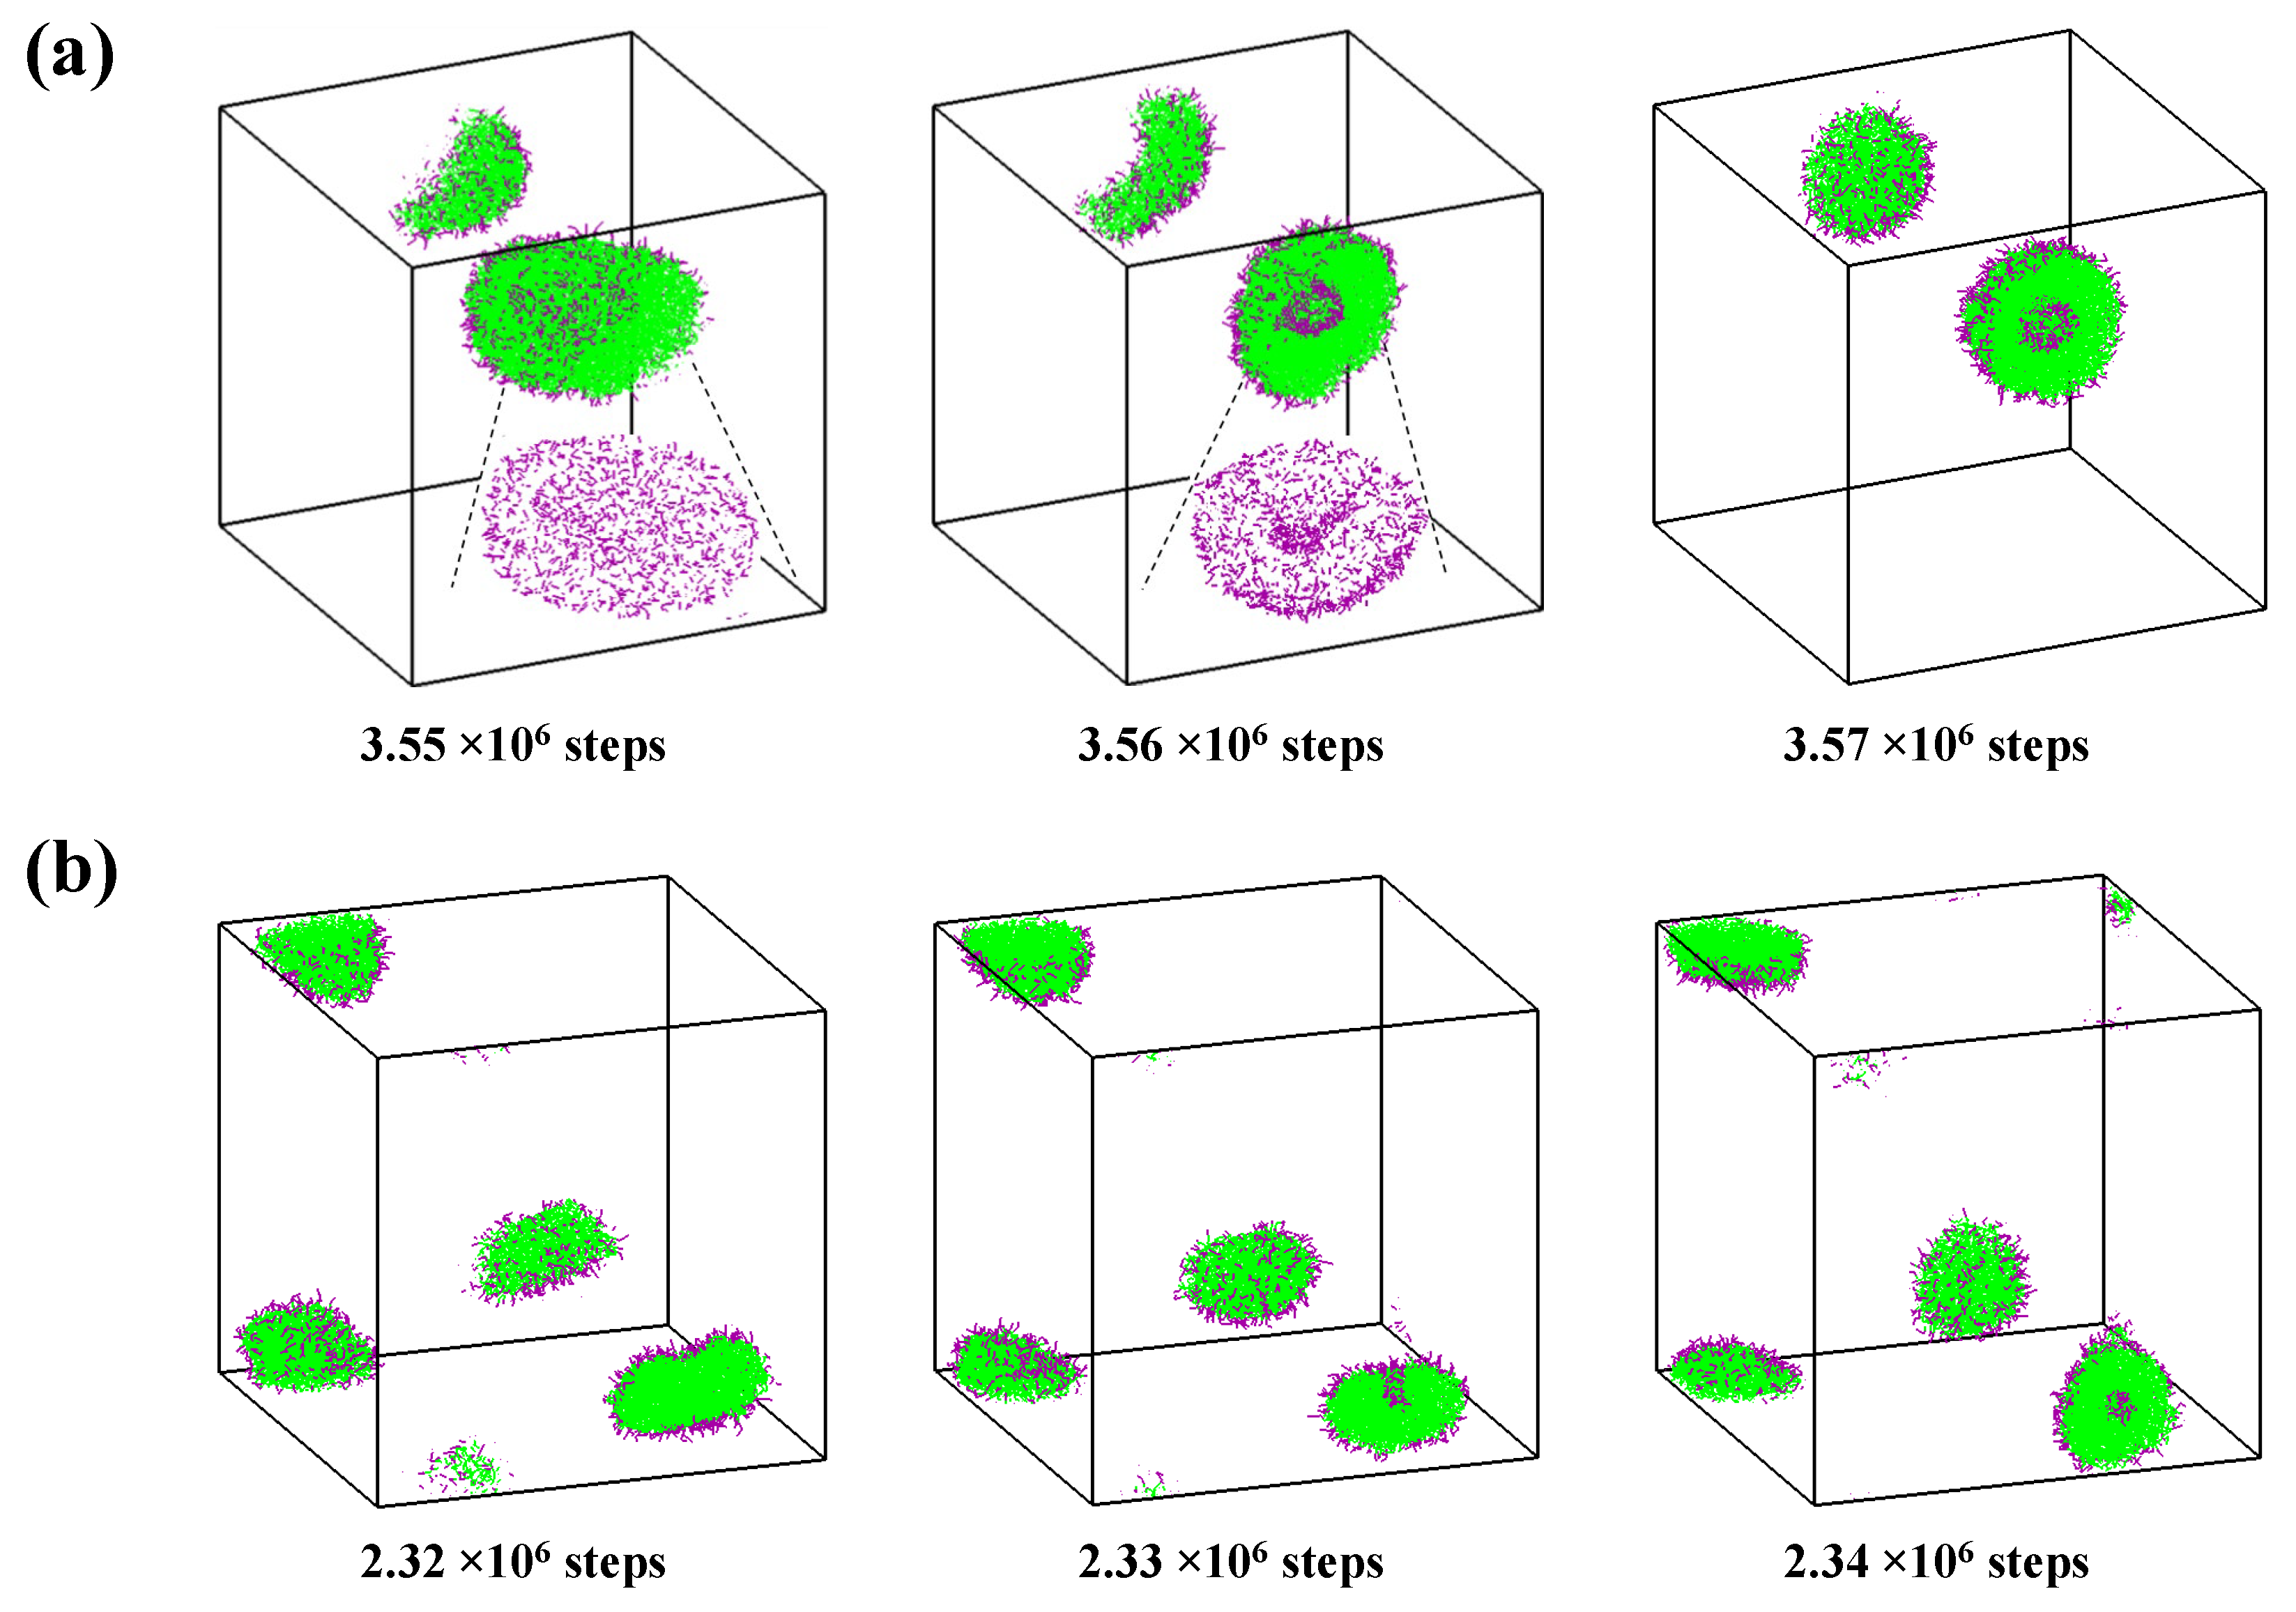
Figure 1. Two trajectories of the direct self-assembly of A2B12 in water. Insets correspond to the integral morphologies of aggregates. Insets depict the integral disk-like and bowl-like intermediates. Hydrophilic and hydrophobic segments are in purple and green, respectively. For clarity, water is not shown and only hydrophilic segments are shown in the insets.
Molecules 28 05113 g001
Figure 2. (a) Typical snapshots of the vesicle formation process during solvent exchange in the case of aWG = 15 starting from ϕ W init = 30%. Insets correspond to the section views of aggregates; (b) Density profiles of water, cosolvent, and copolymer blocks versus the distance from the mass center of the corresponding morphologies in (a). Water, cosolvent, hydrophilic, and hydrophobic segments are in blue, red, purple, and green, respectively. For clarity, the solvents are not shown in the snapshots.
Molecules 28 05113 g002
Figure 3. (a) Typical snapshots of the vesicle formation process observed during solvent exchange in the case of aWG = 15 starting from ϕ W init = 50%. The inset corresponds to the section view of a vesicle; (b) The semi-vesicle formation during the earlier stage of (a). For a better understanding, a section of one elongated semi-vesicle is given; (c) The ratios between the three eigenvalues of the radius of the gyration tensor as a function of time for the elongated semi-vesicle shown in (b); (d) Density profiles of water, cosolvent, and copolymer blocks versus the distance from the mass center of the largest vesicle formed at 3.4 × 10⁵ time steps and ϕW = 50%. The colors of water, cosolvent, hydrophilic, and hydrophobic segments are in blue, red, purple, and green, respectively. For clarity, the solvents are not shown in the snapshots.
Molecules 28 05113 g003
Figure 4. Typical snapshots of the vesicle formation observed at the equilibrium stage of ϕ W init = 70% in the case of aWG = 15. The colors of hydrophilic and hydrophobic segments are in purple and green, respectively. For clarity, solvents are not shown and only hydrophilic segments are shown in the inset.
Molecules 28 05113 g004
Figure 5. Typical snapshots of the vesicle formation process observed during solvent exchange in the case of aWG = 30 starting from ϕ W init = 30% and the density profile of the structure observed at ϕW = 70%. Insets correspond to the section views of aggregates. The colors of water, cosolvent, hydrophilic, and hydrophobic segments are in blue, red, purple, and green, respectively. For clarity, the solvents are not shown in the snapshots.
Molecules 28 05113 g005
Figure 6. Typical snapshots of the vesicle formation process observed during solvent exchange in the case of aWG = 30 starting from ϕ W init = 70%. The inset corresponds to the section view of the aggregate. The colors of hydrophilic and hydrophobic segments are in purple and green, respectively. For clarity, the solvents are not shown in the snapshots and only hydrophilic segments are shown for vesicular structures.
Molecules 28 05113 g006
Figure 7. (a) The percentage of solvents which contact with polymer; (b) The percentage of cosolvent in the contacted solvents; (c) The number of water beads which contact with block A, and (d) The average bond length of block A as a function of ϕW in the case of aWG = 15 and aWG = 30.
Molecules 28 05113 g007
Table 1. Interaction parameters aij in F i j C used in the present work.
WGAB
W25
G15, 3025
A252525
B50255025
Disclaimer/Publisher’s Note: The statements, opinions and data contained in all publications are solely those of the individual author(s) and contributor(s) and not of MDPI and/or the editor(s). MDPI and/or the editor(s) disclaim responsibility for any injury to people or property resulting from any ideas, methods, instructions or products referred to in the content.