Abstract
Fenebrutinib is an orally available Bruton tyrosine kinase inhibitor. It is currently in multiple phase III clinical trials for the management of B-cell tumors and autoimmune disorders. Elementary in-silico studies were first performed to predict susceptible sites of metabolism and structural alerts for toxicities by StarDrop WhichP450™ module and DEREK software; respectively. Fenebrutinib metabolites and adducts were characterized in-vitro in rat liver microsomes (RLM) using MS3 method in Ion Trap LC-MS/MS. Formation of reactive and unstable intermediates was explored using potassium cyanide (KCN), glutathione (GSH) and methoxylamine as trapping nucleophiles to capture the transient and unstable iminium, 6-iminopyridin-3(6H)-one and aldehyde intermediates, respectively, to generate a stable adducts that can be investigated and analyzed using mass spectrometry. Ten phase I metabolites, four cyanide adducts, five GSH adducts and six methoxylamine adducts of fenebrutinib were identified. The proposed metabolic reactions involved in formation of these metabolites are hydroxylation, oxidation of primary alcohol to aldehyde, n-oxidation, and n-dealkylation. The mechanism of reactive intermediate formation of fenebrutinib can provide a justification of the cause of its adverse effects. Formation of iminium, iminoquinone and aldehyde intermediates of fenebrutinib was characterized. N-dealkylation followed by hydroxylation of the piperazine ring is proposed to cause the bioactivation to iminium intermediates captured by cyanide. Oxidation of the hydroxymethyl group on the pyridine moiety is proposed to cause the generation of reactive aldehyde intermediates captures by methoxylamine. N-dealkylation and hydroxylation of the pyridine ring is proposed to cause formation of iminoquinone reactive intermediates captured by glutathione. FBB and several phase I metabolites are bioactivated to fifteen reactive intermediates which might be the cause of adverse effects. In the future, drug discovery experiments utilizing this information could be performed, permitting the synthesis of new drugs with better safety profile. Overall, in silico software and in vitro metabolic incubation experiments were able to characterize the FBB metabolites and reactive intermediates using the multistep fragmentation capability of ion trap mass spectrometry.
1. Introduction
Fenebrutinib (Figure 1; FBB) is an investigational orally available Bruton tyrosine kinase inhibitor developed by Roche pharmaceuticals [1]. FBB inhibits B cell signaling pathways. It is used for the management of B cell tumors and autoimmune disorders specifically rheumatoid arthritis and multiple sclerosis [2,3]. FBB shows the highest potency of Bruton tyrosine kinase inhibitors in phase III clinical trials for multiple sclerosis [4,5]. Adverse effects of FBB include: nausea, vomiting, bleeding, bruising, alanine aminotransferase elevation [6].
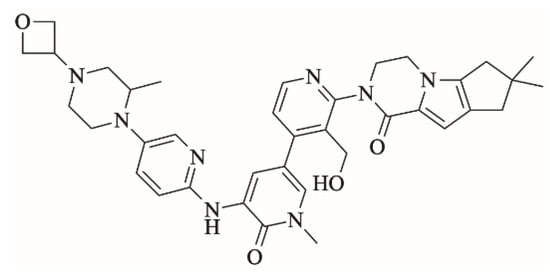
Figure 1.
Chemical structure of fenebrutinib.
Drug metabolism studies are crucial for investigational drugs. Identification of drug metabolites and their possible toxicities is very important [7,8]. Rat liver microsomes are used to investigate drug metabolism in vitro [9]. LC/MS is an efficient technology to identify and characterize drug metabolites [10,11,12,13]. Most drugs are transformed into polar and stable metabolites that aid into their excretion from the body. However, some drugs are bioactivated into unstable electrophiles that has the ability to bind and damage DNA and proteins [14,15]. The formation of such reactive intermediates can be investigated in vitro using RLMs and trapping agents. So as to identify compounds with probable toxicity problems, definite care is set to structural alerts, that have the ability to generate reactive molecular intermediates via metabolism bioactivation. The awareness of such information is necessary in order to decrease the probability that new candidates (pharmaceuticals) might have toxic side effects. Characterization of reactive intermediates is crucial step in the procedure of new drug design with expected good toxicological features [16,17]. Liquid chromatography mass spectrometry (LC-MS) is deliberated the analytical tool of choice that could be used for characterization of reactive intermediates [18,19,20]. The unstable and transient nature of reactive intermediates makes it is difficult to be detected directly. Instead, a trapping agent for reactive intermediates resulted in adducts formation of that are stable and can be detected and characterized by LC-MS [21]. Trapping agents binds to the unstable reactive intermediates and make it easier for investigators to characterize and identify these intermediates using mass spectrometry [22,23,24,25]. In silico toxicity evaluation of the FBB and its metabolites were performed using the DEREK module of software, while the XenoSite and StarDrop software were used to prove the bioactivation theory [26,27].
2. Results and Discussion
2.1. Results of In Silico FBB Metabolism and Toxicity Prediction
StarDrop software predictions of FBB metabolism indicates the lability of each site with respect to metabolism by different isoforms of CYP450 enzymes. This indicates that C46, C47 and C49 in the oxetane ring, C22 the methyl group on the nitrogen atom in the pyridine ring, C39-43 at the other end of the molecule are predicted to be labile to metabolism by CYP450 enzymes especially CYP3A4. The composite site liability (CSL) is shown in the top-right of the metabolic landscape (Figure 2A) and its value is 0.9917 which predicts that FBB is highly susceptible to metabolism by CYP450 isoforms. The results of the WhichP450™ module, concluded in the pie chart is predicting the most likely CYP450 isoforms that has a critical role in FBB metabolism (Figure 2A). According to these results, CYP3A4 isoform has the major role in FBB metabolism [28,29,30].
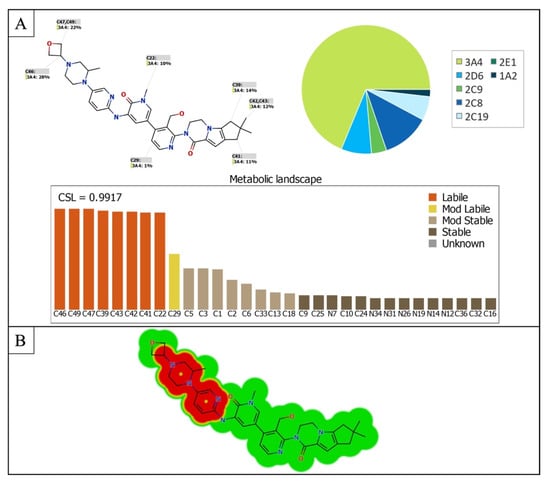
Figure 2.
(A) Predicted metabolic sites for FBB by StarDrop WhichP450 module. (B) Structural alerts of spebrutinib by DEREK module of StarDrop software.
DEREK software was used to assess the possible toxicities of FBB based on its chemical structure. FBB shows possibility of causing HERG channel inhibition (plausible) due to the piperazine moiety and the adjacent pyridine ring (highlighted in red in Figure 2B) [31].
2.2. Fragment Ions Study of FBB
FBB peak elutes at 21.2 min in product ion chromatogram (Figure 3). Dissociation of FBB ion at m/z 665 inside the collision cell produces one fragment at m/z 647 (loss of water molecule). Further investigation using MS3 analysis of fragment m/z 647 yielded eight characteristic and qualitative fragment ions at m/z 629.1, m/z 617.2, m/z 534.1, m/z 491.1, m/z 473.1, m/z 443, m/z 399 and m/z 281.9 (Scheme 1).
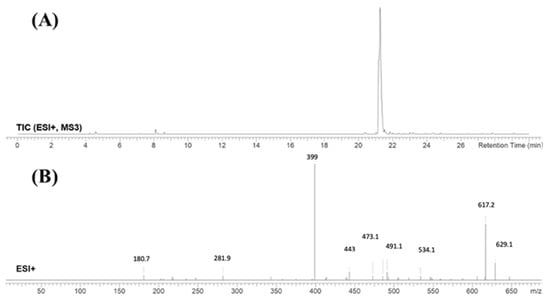
Figure 3.
Product ion chromatogram of FBB (A). Product ion mass spectrum of FBB (B).
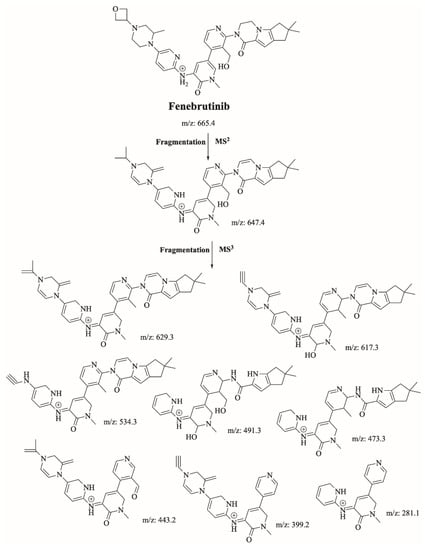
Scheme 1.
Proposed interpretation of FBB fragmentation.
2.3. Identification of FBB Related Metabolites
FBB incubation in RLM resulted in the characterization of ten in vitro metabolites. Proposed reactions by CYP450 enzymes include hydroxylation, oxidation, N-dealkylation and N-oxidation. Different sites of the drug are susceptible to metabolism by the most vulnerable site is the piperazine ring (Figure 4). Figure 5 shows chemical structures of proposed metabolites. The details for all other FBB metabolites are exhibited in the supplementary file (Supplementary Materials: Figures S1–S9; Table S1).
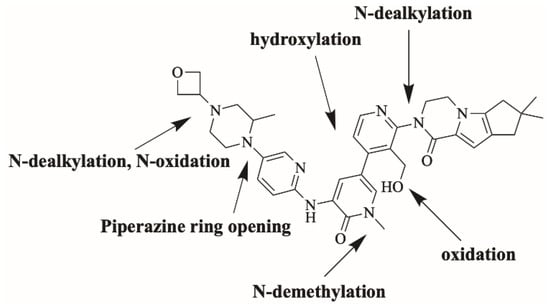
Figure 4.
Proposed metabolic pathways of FBB.
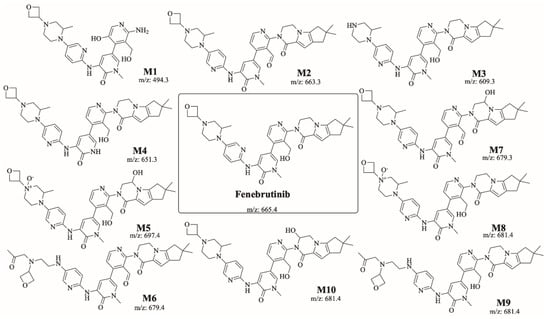
Figure 5.
Summary of the ten proposed metabolites of FBB.
Identification of M1
M1 (m/z 494.3) is proposed to be generated by hydroxylation and N-dealkylation of FBB. M1 peak elutes at 18.4 min in product ion chromatogram. Dissociation of FBB ion at m/z 494.3 inside the collision cell produces one fragment at m/z 476 (loss of water molecule). Further investigation using MS3 analysis of fragment m/z 476 yielded three characteristic fragment ions at m/z 464.4, m/z 380.8 and m/z 321.9 (Figure 6).
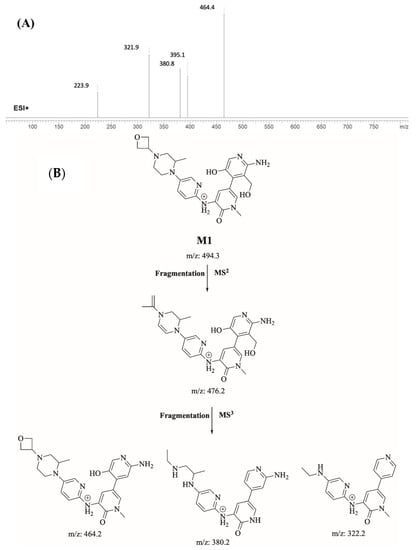
Figure 6.
Product ion mass spectrum of M1 (A). Proposed interpretation of fragmentation of M1 (B).
2.4. Identification of Iminium Reactive Intermediates Using Potassium Cyanide as Trapping Agent
2.4.1. Identification of M11/KCN Cyanide Adduct
M11/KCN is proposed to form by the addition of cyanide group to M3 of FBB. M11/KCN (m/z 620.3) peak appeared at 16.94 minute in product ion chromatogram. Dissociation of M11/KCN ion inside the collision cell produces four fragment ions at m/z 525.2 m/z 457.1, m/z 347.5 m/z and m/z 267.8 (Figure 7).
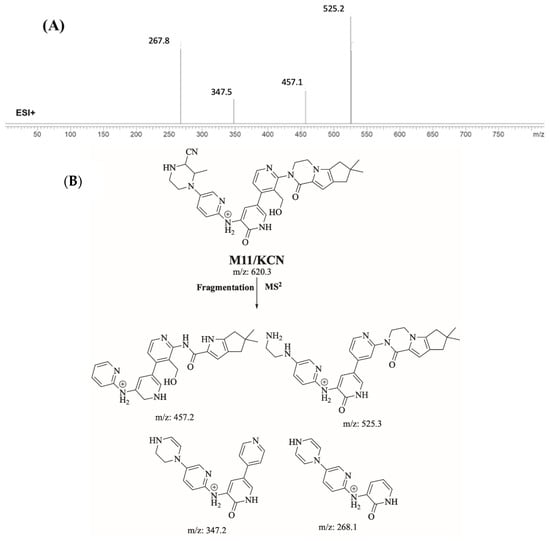
Figure 7.
Product ion mass spectrum of M11/KCN cyanide adduct (A) and proposed interpretation of fragmentation of M11/KCN (B).
2.4.2. Proposed Bioactivation Mechanism of FBB to Iminium Reactive Intermediates
Figure 8 shows the bioactivation pathway for FBB to iminium intermediates. The generation of M11/KCN, M12/KCN, M13/KCN and M14/KCN cyanide adducts revealed the formation of iminium unstable intermediates in the piperazine ring during in vitro metabolism of FBB. Hydroxylation by CYP450 enzymes at piperazine moiety in FBB followed by loss of one water molecule (dehydration) lead to the formation of iminium ions intermediate which are unstable species that can be captured by cyanide as nucleophile forming stable adduct that can be characterized in mass spectrometry. Figure 9 summarizes the proposed cyanide adducts of FBB. The details for all other FBB cyano adducts are exhibited in the supplementary file (Supplementary Materials: Figures S10–S12; Table S2).
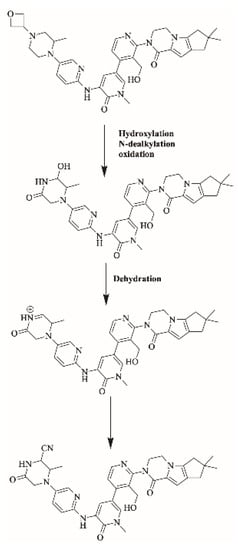
Figure 8.
Proposed bioactivation pathways of FBB to iminium reactive intermediates trapped by potassium cyanide.
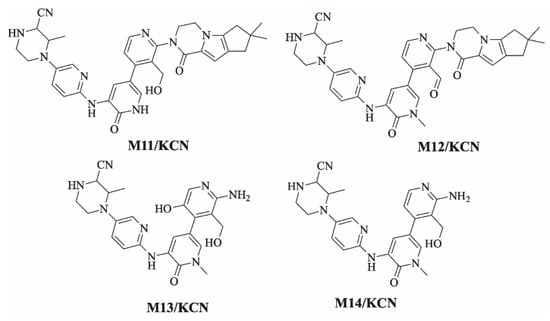
Figure 9.
Summary of proposed cyanide adducts of FBB.
2.5. Identification of 6-Iminopyridin-3(6H)-One Reactive Intermediates Using Glutathione (GSH) as Trapping Agent
2.5.1. Identification of M15/GSH GSH Adduct
M15/GSH is proposed to form by the addition of GSH to the 6-iminopyridin-3(6H)-one reactive metabolite of M1 of FBB. M15/GSH (m/z 799.3) peak appeared at 17.3 min in fragment ion chromatogram. Dissociation of M15/GSH ion at m/z 799 inside the collision cell produces one fragment at m/z 739 (loss of trimethylene oxide ring). Further investigation using MS3 analysis of fragment m/z 739 yielded five characteristic and qualitative fragment ions at m/z 725.3, m/z 699.4, m/z 609.2 m/z 454.8 and m/z 252.6 (Figure 10).
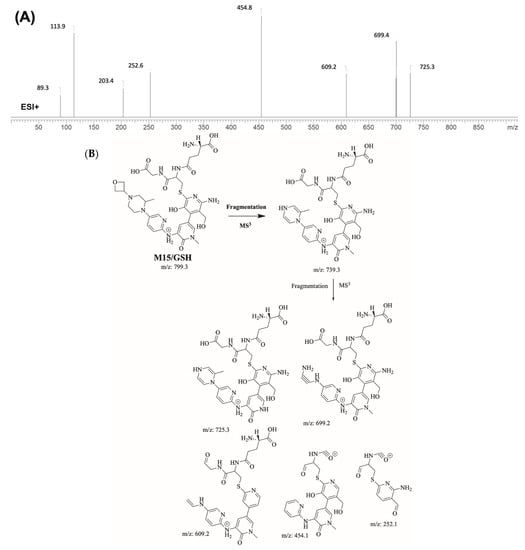
Figure 10.
Product ion mass spectrum of M15/GSH adduct (A) and proposed interpretation of fragmentation of M15/GSH (B).
2.5.2. Proposed Bioactivation Mechanism of FBB to 6-Iminopyridin-3(6H)-One Reactive Intermediates
Figure 11 shows the bioactivation pathway for FBB to 6-iminopyridin-3(6H)-one intermediates. N-dealkylation and hydroxylation of pyridine ring performed by CYP450 enzymes results in the formation of reactive 6-iminopyridin-3(6H)-one intermediates captured by glutathione. Figure 12 summarizes the proposed GSH adducts of FBB. The details for all other FBB GSH adducts are exhibited in the supplementary file (Supplementary Materials: Figures S13–S16; Table S3).
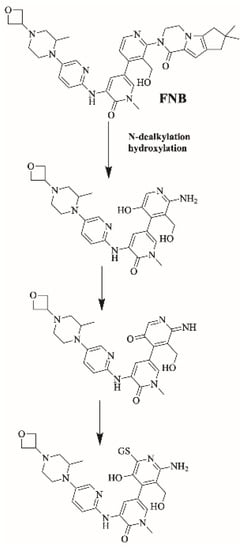
Figure 11.
Proposed bioactivation pathways of FBB to 6-iminopyridin-3(6H)-one reactive intermediates trapped by GSH.
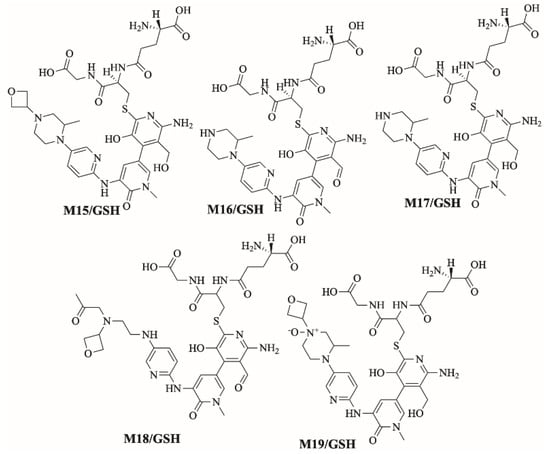
Figure 12.
Summary of proposed GSH adducts of FBB.
2.6. Identification of Aldehyde Reactive Intermediates Using Methoxylamine as Trapping Agent
2.6.1. Identification of M20/CH3ONH2 Methoxylamine Adduct
M20/CH3ONH2 is proposed to form by the addition of methoxylamine to aldehyde reactive intermediate of FBB. M20/CH3ONH2 (m/z 692.4) peak appeared at 22.4 min in fragment ion chromatogram. Dissociation of M20/CH3ONH2 ion at m/z 692.4 inside the collision cell produces one fragment at m/z 664.4. Further investigation using MS3 analysis of fragment m/z 664.4 yielded two characteristic and qualitative fragment ions at m/z 610.5 and m/z 474.6 (Figure 13).
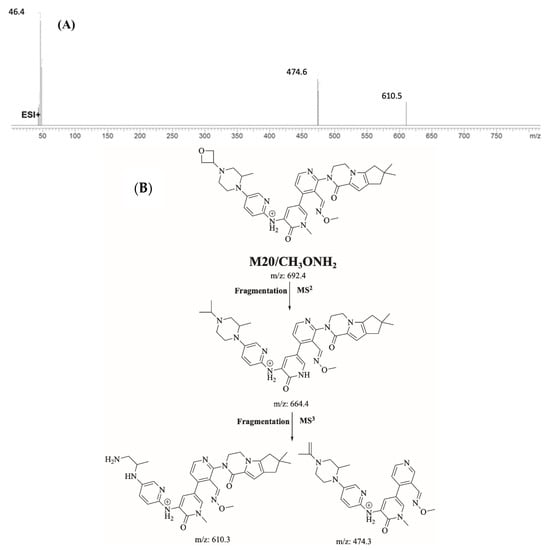
Figure 13.
Product ion mass spectrum of M20/CH3ONH2 adduct (A) and proposed interpretation of fragmentation of M20/CH3ONH2 (B).
2.6.2. Proposed Bioactivation Mechanism of FBB to Aldehyde Reactive Intermediates
Figure 14 shows the bioactivation pathway for FBB to aldehyde intermediates. The generation of FBB692, FBB521, FBB636, FBB708 and FBB724a/b methoxylamine adducts (Figure 15) revealed the generation of aldehyde intermediates in the acrylamide group during in vitro metabolism of FBB [32]. Oxidation of primary alcohol by CYP450 enzymes leads to the formation of aldehyde reactive intermediates which are trapped by methoxylamine forming stable methoxylamine adducts that can be analyzed and detected in mass spectrometry [33]. The details for all other FBB methoxylamine adducts are exhibited in the supplementary file (Supplementary Materials: Figures S17–S21; Table S4).
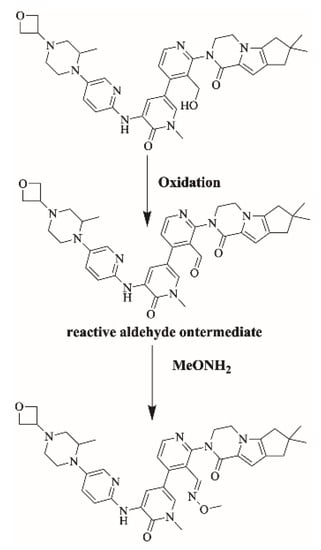
Figure 14.
Proposed bioactivation pathways of FBB to aldehyde reactive intermediates trapped by methoxylamine.

Figure 15.
Summary of proposed methoxylamine adducts of FBB.
3. Chemicals and Methods
3.1. Chemicals and Animals
Sprague Dawley rats were used for RLMs preparation [25,34]. Acetonitrile, formic acid, potassium cyanide, glutathione and methoxylamine were obtained from Sigma-Aldrich company (St. Louis, MO, USA). FBB was purchased from MedChemExpress company (Princeton, NJ, USA). Water (HPLC grade) was provided by Milli-Q plus purification system (Billerica, MA, USA) available at site. All chemicals are analytical grade and solvents are HPLC grade.
Ethical approval for the Animal experiments was acquired from the Animal Ethics Committee at King Saud University (No. KSU-SE-22-83). All animal experiments were completed following the standards of the experimental Animal Use and Care Guidelines of the National Institutes of Health and the Supervision of Animal Experiments Committee. Sprague-Dawley rats were acquired from experimental animal care center King Saud University (Riyadh, Saudi Arabia).
3.2. Chromatographic Conditions
6320 Ion Trap LC–MSn (Agilent Technologies, Palo Alto, CA, USA) was used for the analysis of samples. Electrospray ionization was performed at room temperature in positive ion mode. The dry temperature was 350 °C, the nebulizer pressure was 60 psi, the capillary temperature was 325 °C, the dry gas was 10 L/min. The column used was an Eclipse plus C18 (4.6 × 150 mm, 3.5 micron) (Agilent Technologies, Palo Alto, CA, USA). LC separation was conducted using a mobile phase solvent A: water with 1% formic acid and solvent B: acetonitrile. The run began at 95% mobile phase A, then the percentage of mobile phase B was increased from 5 to 60% in 20 min and then increased to reach 65% at 25 min then kept at this percentage until minute 30. Gradient chromatography was performed with a mobile phase of a water/acetonitrile mixture with a flow rate of 0.4 mL/min and a total run time of 45 min. Injection volume of samples was 5 µL taken from vials that are placed in the autosampler. The indicated chromatographic parameters for investigation of FBB metabolites are summarized in Table 1.

Table 1.
Summary of selected liquid chromatography and mass spectrometry conditions.
3.3. In Silico Prediction of FBB Metabolites and Structural Alerts Using WhichP450™ Metabolism Module and DEREK NEXUS Module of StarDrop Software
StarDrop software was used to predict the main sites of metabolism and to predict site lability specified by the composite site lability (CSL). This software contains the WhichP450 module which predicts regioselectivity of metabolism by different isoforms. This module concludes the findings by a pie chart of the most likely CYP450 isoform that has a major role in FBB metabolism. DEREK module was used to identify structural alerts in FBB that can cause certain toxicities.
3.4. RLM Incubations
Protein concentration of the prepared RLMs was determined using Lowery method [35]. FBB was dissolved in dimethyl sulfoxide (DMSO). FBB (5 μM) was incubated with RLMs (1 mg/mL) in phosphate buffer (50 mM Na/K and 3.3 mM MgCl2) at pH 7.4. One mM NADPH was added to initiate the metabolic reaction. One mM of trapping agents KCN, GSH or methoxylamine were used in the experiments for capturing of iminium, iminopyridinone and aldehyde reactive intermediates, respectively. The reactions were performed in a thermostatic shaking water bath (37 °C for 60 min.). Two mL of ACN (ice cold) was added to stop the metabolic reaction by denaturation of enzymes protein. Centrifugation at 9000× g was done for 12 min at 4 °C to precipitate proteins. The clear supernatants were evaporated under a stream of nitrogen gas then reconstituted in mobile phase (50:50). Negative controls were prepared in the absence of RLMs or NADPH to confirm that FBB phase I metabolites were metabolically produced [28,36,37].
3.5. Characterization of FBB Reactive Intermediates
Extracted ion chromatograms (EIC) of various incubation mixtures were used to characterize FBB metabolites and reactive intermediates. Fragment ions were used to reconstruct the chemical structure of FBB metabolites and reactive intermediates.
4. Conclusions
This study involved in vitro (RLMs) metabolite characterization and bioactivation identification of FBB using LC-MS/MS. Ten in vitro phase I metabolites of FBB were identified (Figure 6). Different pathways of phase I metabolism of FBB were proposed including oxidation of primary alcohol to aldehyde, hydroxylation, N-oxidation and N-dealkylation. Four iminium reactive intermediates, five 6-iminopyridin-3(6H)-one reactive intermediates and six aldehyde reactive intermediates of FBB were identified. Piperazine moiety in FBB is predicted by DEREK software to cause toxicity and is proposed to bioactivated to iminium reactive intermediates captured by cyanide. Oxidation of the hydroxymethyl group on the pyridine ring is proposed to the cause the formation of reactive aldehyde intermediates captures by methoxylamine. N-dealkylation and hydroxylation of the pyridine ring is proposed to cause formation of 6-iminopyridin-3(6H)-one reactive intermediates captured by glutathione. FBB and several phase I metabolites are bioactivated to fifteen reactive intermediates which might be the cause of adverse effects.
Supplementary Materials
The following supporting information can be downloaded at: https://www.mdpi.com/article/10.3390/molecules28104225/s1, Figure S1: Product ion mass spectrum of M2 showing proposed fragmentation pattern; Figure S2: Product ion mass spectrum of M3 showing proposed fragmentation pattern; Figure S3: Product ion mass spectrum of M4 showing proposed fragmentation pattern; Figure S4: Product ion mass spectrum of M5 showing proposed fragmentation pattern; Figure S5: Product ion mass spectrum of M6 showing proposed fragmentation pattern; Figure S6: Product ion mass spectrum of M7 showing proposed fragmentation pattern; Figure S7: Product ion mass spectrum of M8 showing proposed fragmentation pattern; Figure S8: Product ion mass spectrum of M9 showing proposed fragmentation pattern; Figure S9: Product ion mass spectrum of M10 showing proposed fragmentation pattern; Figure S10: Product ion mass spectrum of M12/KCN cyanide adduct showing proposed fragmentation pattern; Figure S11: Product ion mass spectrum of M13/KCN cyanide adduct showing proposed fragmentation pattern; Figure S12: Product ion mass spectrum of M14/KCN cyanide adduct showing proposed fragmentation pattern; Figure S13: Product ion mass spectrum of M16/GSH adduct showing proposed fragmentation pattern; Figure S14: Product ion mass spectrum of M17/GSH adduct showing proposed fragmentation pattern; Figure S15: Product ion mass spectrum of M18/GSH adduct showing proposed fragmentation pattern; Figure S16: Product ion mass spectrum of M19/GSH adduct showing proposed fragmentation pattern; Figure S17: Product ion mass spectrum of M21/CH3ONH2 methoxyleamine adduct showing proposed fragmentation pattern; Figure S18: Product ion mass spectrum of M22/CH3ONH2 methoxyleamine adduct showing proposed fragmentation pattern; Figure S19: Product ion mass spectrum of M23/CH3ONH2 methoxyleamine adduct showing proposed fragmentation pattern; Figure S20: Product ion mass spectrum of M24/CH3ONH2 methoxyleamine adduct showing proposed fragmentation pattern; Figure S21: Product ion mass spectrum of M25/CH3ONH2 methoxyleamine adduct showing proposed fragmentation pattern; Table S1: In vitro phase 1 metabolites of FNB; Table S2: Summary of proposed cyanide adducts of FNB; Table S3: Summary of proposed GSH adducts of FNB; Table S4: Summary of proposed methoxylamine adducts of FNB.
Author Contributions
A.M.A., M.W.A., A.A.K., H.I.A. and A.S.A. contributed to study design. A.M.A. and M.W.A. performed the data analysis, experimental work and aided the drafting of the manuscript. A.A.K., A.S.A., H.I.A. and M.W.A. directed the laboratory experimental work. M.W.A. is the corresponding author of this paper. The final draft manuscript was revised by all authors. A.M.A. participated in preparing the revised version of the manuscript. All authors have read and agreed to the published version of the manuscript.
Funding
This study was supported by the Researchers Supporting Project number (RSPD2023R750), King Saud University, Riyadh, Saudi Arabia.
Institutional Review Board Statement
Male Sprague-Dawley were maintained following the Animal Care Center instructions at King Saud University that were approved by Local Animal Care and Use Committee of KSU. The animal experimental procedure utilized in our current research was validated and approved by the King Saud University’s Ethics Review Committee (Number: KSU-SE-22-83).
Informed Consent Statement
Not applicable.
Data Availability Statement
All data are available within the manuscript.
Acknowledgments
The authors extend their appreciation to the Researcher Supporting Project Number (RSPD2023R750), King Saud University, Riyadh, Saudi Arabia for funding this research work.
Conflicts of Interest
The authors declare no conflict of interest.
Abbreviations
FBB, Fenebrutinib; ACN, acetonitrile; conc. RLM, rat liver microsomes; KCN, potassium cyanide; BTK, Bruton tyrosine kinase; DEREK, StarDrop WhichP450™ module, reactive intermediates, phase I metabolites, GSH, glutathione; KCN, potassium cyanide.
References
- Crawford, J.J.; Zhang, H. Discovery and Development of Non-Covalent, Reversible Bruton’s Tyrosine Kinase Inhibitor Fenebrutinib (GDC-0853). In Complete Accounts of Integrated Drug Discovery and Development: Recent Examples from the Pharmaceutical Industry Volume 2; ACS Publications: Washington, DC, USA, 2019; pp. 239–266. [Google Scholar]
- Edwards, J.C.; Cambridge, G. B-cell targeting in rheumatoid arthritis and other autoimmune diseases. Nat. Rev. Immunol. 2006, 6, 394–403. [Google Scholar] [CrossRef] [PubMed]
- Garg, N.; Padron, E.J.; Rammohan, K.W.; Goodman, C.F. Bruton’s Tyrosine Kinase Inhibitors: The Next Frontier of B-Cell-Targeted Therapies for Cancer, Autoimmune Disorders, and Multiple Sclerosis. J. Clin. Med. 2022, 11, 6139. [Google Scholar] [CrossRef] [PubMed]
- Weber, M.; Harp, C.; Bremer, M.; Goodyear, A.; Crawford, J.; Johnson, A.; Bar-Or, A. Fenebrutinib Demonstrates the Highest Potency of Bruton Tyrosine Kinase Inhibitors (BTKis) in Phase 3 Clinical Development for Multiple Sclerosis (MS)(4437). Neurology 2021, 96, 4473. [Google Scholar]
- Geladaris, A.; Torke, S.; Weber, M.S. Bruton’s Tyrosine Kinase Inhibitors in Multiple Sclerosis: Pioneering the Path Towards Treatment of Progression? CNS Drugs 2022, 36, 1019–1030. [Google Scholar] [CrossRef] [PubMed]
- Oh, J.; Cohen, S.; Isenberg, D.; Maurer, M.; Galanter, J.; Chu, T.; Teterina, A.; Goodyear, A.; Mandel, C.; Lee, C. The Safety of Fenebrutinib in a Large Population of Patients with Diverse Autoimmune Indications Supports Investigation in Multiple Sclerosis (MS)(4564). Neurology 2021, 96, 4564. [Google Scholar]
- Park, B.K.; Kitteringham, N.R.; Maggs, J.L.; Pirmohamed, M.; Williams, D.P. The role of metabolic activation in drug-induced hepatotoxicity. Annu. Rev. Pharmacol. Toxicol. 2005, 45, 177–202. [Google Scholar] [CrossRef]
- Ma, S.; Zhu, M. Recent advances in applications of liquid chromatography–tandem mass spectrometry to the analysis of reactive drug metabolites. Chem.-Biol. Interact. 2009, 179, 25–37. [Google Scholar] [CrossRef]
- Leung, L.; Kalgutkar, A.S.; Obach, R.S. Metabolic activation in drug-induced liver injury. Drug Metab. Rev. 2012, 44, 18–33. [Google Scholar] [CrossRef]
- Liu, X.; Jia, L. The conduct of drug metabolism studies considered good practice (I): Analytical systems and in vivo studies. Curr. Drug Metab. 2007, 8, 815–821. [Google Scholar] [CrossRef]
- Kostiainen, R.; Kotiaho, T.; Kuuranne, T.; Auriola, S. Liquid chromatography/atmospheric pressure ionization–mass spectrometry in drug metabolism studies. J. Mass Spectrom. 2003, 38, 357–372. [Google Scholar] [CrossRef]
- Beccaria, M.; Cabooter, D. Current developments in LC-MS for pharmaceutical analysis. Analyst 2020, 145, 1129–1157. [Google Scholar] [CrossRef]
- Prakash, C.; Shaffer, C.L.; Nedderman, A. Analytical strategies for identifying drug metabolites. Mass Spectrom. Rev. 2007, 26, 340–369. [Google Scholar] [CrossRef] [PubMed]
- Gómez-Lechón, M.J.; Tolosa, L.; Donato, M.T. Metabolic activation and drug-induced liver injury: In vitro approaches for the safety risk assessment of new drugs. J. Appl. Toxicol. 2016, 36, 752–768. [Google Scholar] [CrossRef]
- Prakash, C.; Sharma, R.; Gleave, M.; Nedderman, A. In vitro screening techniques for reactive metabolites for minimizing bioactivation potential in drug discovery. Curr. Drug Metab. 2008, 9, 952–964. [Google Scholar] [CrossRef]
- Stepan, A.F.; Walker, D.P.; Bauman, J.; Price, D.A.; Baillie, T.A.; Kalgutkar, A.S.; Aleo, M.D. Structural alert/reactive metabolite concept as applied in medicinal chemistry to mitigate the risk of idiosyncratic drug toxicity: A perspective based on the critical examination of trends in the top 200 drugs marketed in the United States. Chem. Res. Toxicol. 2011, 24, 1345–1410. [Google Scholar] [CrossRef] [PubMed]
- Attwa, M.W.; Kadi, A.A.; Abdelhameed, A.S.; Alhazmi, H.A. Metabolic stability assessment of new parp inhibitor talazoparib using validated lc–ms/ms methodology: In silico metabolic vulnerability and toxicity studies. Drug Des. Dev. Ther. 2020, 14, 783–793. [Google Scholar] [CrossRef] [PubMed]
- Ma, S.; Subramanian, R. Detecting and characterizing reactive metabolites by liquid chromatography/tandem mass spectrometry. J. Mass Spectrom. 2006, 41, 1121–1139. [Google Scholar] [CrossRef]
- Tolonen, A.; Turpeinen, M.; Pelkonen, O. Liquid chromatography-mass spectrometry in in vitro drug metabolite screening. Drug Discov. Today 2009, 14, 120–133. [Google Scholar] [CrossRef]
- Attwa, M.W.; Kadi, A.A.; Abdelhameed, A.S. Characterization of reactive intermediates formation in dacomitinib metabolism and bioactivation pathways elucidation by LC-MS/MS: In vitro phase I metabolic investigation. RSC Adv. 2018, 8, 38733–38744. [Google Scholar] [CrossRef]
- Attwa, M.W.; AlRabiah, H.; Mostafa, G.A.E.; Bakheit, A.H.; Kadi, A.A. Assessment of In Silico and In Vitro Selpercatinib Metabolic Stability in Human Liver Microsomes Using a Validated LC-MS/MS Method. Molecules 2023, 28, 2618. [Google Scholar] [CrossRef]
- Li, F.; Lu, J.; Ma, X. Profiling the reactive metabolites of xenobiotics using metabolomic technologies. Chem. Res. Toxicol. 2011, 24, 744–751. [Google Scholar] [CrossRef] [PubMed]
- Argoti, D.; Liang, L.; Conteh, A.; Chen, L.; Bershas, D.; Yu, C.-P.; Vouros, P.; Yang, E. Cyanide trapping of iminium ion reactive intermediates followed by detection and structure identification using liquid chromatography–tandem mass spectrometry (LC-MS/MS). Chem. Res. Toxicol. 2005, 18, 1537–1544. [Google Scholar] [CrossRef] [PubMed]
- Attwa, M.W.; AlRabiah, H.; Kadi, A.A. Development and Validation of a Rapid LC-MS/MS Method for Quantifying Alvocidib: In Silico and In Vitro Metabolic Stability Estimation in Human Liver Microsomes. Molecules 2023, 28, 2368. [Google Scholar] [CrossRef] [PubMed]
- Abdelhameed, A.S.; Attwa, M.W.; Kadi, A.A. Identification of Iminium Intermediates Generation in the Metabolism of Tepotinib Using LC-MS/MS: In Silico and Practical Approaches to Bioactivation Pathway Elucidation. Molecules 2020, 25, 5004. [Google Scholar] [CrossRef] [PubMed]
- Marchant, C.A.; Briggs, K.A.; Long, A. In silico tools for sharing data and knowledge on toxicity and metabolism: Derek for windows, meteor, and vitic. Toxicol. Mech. Methods 2008, 18, 177–187. [Google Scholar] [CrossRef] [PubMed]
- Shin, Y.G.; Le, H.; Khojasteh, C.; ECA Hop, C. Comparison of metabolic soft spot predictions of CYP3A4, CYP2C9 and CYP2D6 substrates using MetaSite and StarDrop. Comb. Chem. High Throughput Screen. 2011, 14, 811–823. [Google Scholar] [CrossRef]
- Lavoie, D.S.-G.; Pailleux, F.; Vachon, P.; Beaudry, F. Characterization of xylazine metabolism in rat liver microsomes using liquid chromatography–hybrid triple quadrupole–linear ion trap–mass spectrometry. Biomed. Chromatogr. 2013, 27, 882–888. [Google Scholar] [CrossRef]
- Tan, L.; Kirchmair, J. Software for metabolism prediction. Drug Metab. Predict. 2014, 27–52. [Google Scholar] [CrossRef]
- Yin, W.; Alwabli, R.I.; Attwa, M.W.; Rahman, A.F.M.M.; Kadi, A.A. Simvastatin: In Vitro Metabolic Profiling of a Potent Competitive HMG-CoA Reductase Inhibitor. Separations 2022, 9, 400. [Google Scholar] [CrossRef]
- Chavan, B.B.; Tiwari, S.; Shankar, G.; Nimbalkar, R.D.; Garg, P.; Srinivas, R.; Talluri, M.K. In vitro and in vivo metabolic investigation of the Palbociclib by UHPLC-Q-TOF/MS/MS and in silico toxicity studies of its metabolites. J. Pharm. Biomed. Anal. 2018, 157, 59–74. [Google Scholar] [CrossRef]
- Attwa, M.W.; Kadi, A.A.; Abdelhameed, A.S. Reactive intermediates and bioactivation pathways characterization of avitinib by LC–MS/MS: In vitro metabolic investigation. J. Pharm. Biomed. Anal. 2019, 164, 659–667. [Google Scholar] [CrossRef] [PubMed]
- Lenz, E.M.; Martin, S.; Schmidt, R.; Morin, P.-E.; Smith, R.; Weston, D.J.; Bayrakdarian, M. Reactive metabolite trapping screens and potential pitfalls: Bioactivation of a homomorpholine and formation of an unstable thiazolidine adduct. Chem. Res. Toxicol. 2014, 27, 968–980. [Google Scholar] [CrossRef] [PubMed]
- Van Dijk, W.; Roholl, P.; Reijngoud, D.; Tager, J. A simple procedure for the isolation of lysosomes from normal rat liver. FEBS Lett. 1976, 62, 177–181. [Google Scholar] [CrossRef] [PubMed]
- Waterborg, J.H.; Matthews, H.R. The Lowry method for protein quantitation. Basic Protein Pept. Protoc. 1994, 32, 1–4. [Google Scholar] [CrossRef]
- Kadi, A.A.; Darwish, H.W.; Abuelizz, H.A.; Alsubi, T.A.; Attwa, M.W. Identification of reactive intermediate formation and bioactivation pathways in Abemaciclib metabolism by LC–MS/MS: In vitro metabolic investigation. R. Soc. Open Sci. 2019, 6, 181714. [Google Scholar] [CrossRef]
- Roupe, K.; Teng, X.W.; Fu, X.; Meadows, G.G.; Davies, N.M. Determination of piceatannol in rat serum and liver microsomes: Pharmacokinetics and phase I and II biotransformation. Biomed. Chromatogr. 2004, 18, 486–491. [Google Scholar] [CrossRef]
Disclaimer/Publisher’s Note: The statements, opinions and data contained in all publications are solely those of the individual author(s) and contributor(s) and not of MDPI and/or the editor(s). MDPI and/or the editor(s) disclaim responsibility for any injury to people or property resulting from any ideas, methods, instructions or products referred to in the content. |
© 2023 by the authors. Licensee MDPI, Basel, Switzerland. This article is an open access article distributed under the terms and conditions of the Creative Commons Attribution (CC BY) license (https://creativecommons.org/licenses/by/4.0/).