Article

Dynamic and Static Nature of XH-∗-π and YX-∗-π (X = F, Cl, Br, and I; Y = X and F) in the Distorted π-System of Corannulene Elucidated with QTAIM Dual Functional Analysis

Faculty of Systems Engineering, Wakayama University, 930 Sakaedani, Wakayama 640-8510, Japan
*
Author to whom correspondence should be addressed.
Molecules 2023, 28(10), 4219; https://doi.org/10.3390/molecules28104219
Submission received: 1 March 2023 / Revised: 28 April 2023 / Accepted: 18 May 2023 / Published: 21 May 2023
(This article belongs to the Special Issue Research on Nanostructured Materials 2.0)

Abstract

:
The dynamic and static nature of the XH-∗-π and YX-∗-π (X = F, Cl, Br, and I; Y = X and F) interactions in the distorted π-system of corannulene (π(C20H10)) is elucidated with a QTAIM dual functional analysis (QTAIM-DFA), where asterisks emphasize the presence of bond critical points (BCPs) on the interactions. The static and dynamic nature originates from the data of the fully optimized and perturbed structures, respectively, in QTAIM-DFA. On the convex side, H in F–H-∗-π(C20H10) and each X in Y–X-∗-π(C20H10) join to C of the central five-membered ring in π(C20H10) through a bond path (BP), while each H in X–H-∗-π(C20H10) does so to the midpoint of C=C in the central five-membered ring for X = Cl, Br, or I. On the concave side, each X in F–X-∗-π(C20H10) also joins to C of the central five-membered ring with a BP for X = H, Cl, Br, and I; however, the interactions in other adducts are more complex than those on the convex side. Both H and X in X–H-∗-π(C20H10) (X = Cl and Br) and both Fs in F–F-∗-π(C20H10) connect to the three C atoms in each central five-membered ring (with three BPs). Two, three, and five BPs were detected for the Cl–Cl, I–H, Br–Br, and I–I adducts, where some BPs do not stay on the central five-membered ring in π(C20H10). The interactions are predicted to have a vdW to CT-MC nature. The interactions on the concave side seem weaker than those on the convex side for X–H-∗-π(C20H10), whereas the inverse trend is observed for Y–X-∗-π(C20H10) as a whole. The nature of the interactions in the π(C20H10) adducts of the convex and concave sides is examined in more detail, employing the adducts with X–H and F–X placed on their molecular axis together with the π(C24H12) and π(C6H6) adducts.

Graphical Abstract

1. Introduction

Hydrogen bonds (HBs) [1,2,3,4,5,6,7,8,9,10,11,12] and halogen bonds (XBs) [13,14,15,16] are fundamentally important because of their molecular association ability due to the stabilization of the energy system. HBs and XBs are applied in a wide variety of fields in the chemical and biological sciences [17,18,19] such as crystal engineering, supramolecular soft matter, and nanoparticles. The nature of HBs and XBs has also been discussed based on the theoretical background with the structural aspects [15,20] containing the σ-hole developed on the halogen atoms in XBs. The XH-∗-π and YX-∗-π adducts also form when π-orbitals interact with hydrogen halides and halogen or interhalogen molecules. They are referred to as π-HBs and π-XBs, respectively. In this case, the electrophilic σ*-orbitals of the molecules interact attractively with the π-orbitals, similarly to the case of the n-orbitals on the heteroatoms.
We recently reported the dynamic and static nature of π-HBs and π-XBs in the coronene π-system (π(C24H12)) [21,22], together with those in benzene (π(C6H6)) [23,24,25], naphthalene (π(C10H8)) [26], and anthracene (π(C14H10)) [27]. We have also been very interested in the behavior of π-HBs and π-XBs in distorted π-systems. π-Electron systems, such as π(C24H12), seem moderately rigid and moderately flexible. As a result, distorted π-systems such as corannulene (C20H10) [28,29,30,31] and sumanene (C21H12) [32,33] will form, where π(C20H10) and π(C21H12) are found in fullerenes as partial structures. It must be of particular interest to clarify the differences in the reactivity between the planar and distorted π-systems. The π-systems of coronene (π(C24H12)) and corannulene (π(C20H10)) must be the attractive candidates for the purpose. In the case of the bowl-shaped π(C20H10), the π-orbitals are extended to the convex (cv) side, while they will shrink to the concave (cc) side. This electronic structure will play an important role in the formation of the adducts between corannulene and XH and XY. These clarifications will allow us to anticipate the interactions of bowl-shaped aromatic ring compounds.
The main characteristics of the π-system in corannulene, together with the differences from that of coronene, are explained as follows. Both corannulene and coronene are the neutral aromatic hydrocarbons of the condensed benzene structures, where the central rings of corannulene and coronene contain five and six membered rings of the π-systems, respectively. The π-system of the five membered ring will be more negative, relative to the case of that of the six membered ring, since both π-systems tend to be stabilized by the formation of the 6π electron system. This factor can be examined based on the charge distributions in corannulene and coronene calculated based on the natural population analysis (NPA) [34]. Scheme 1 showed the charge (Qn) evaluated by NPA. The aC atom of the central five-membered ring in corannulene (Qn(aC) = –0.016) is more negatively charged than that of coronene (Qn(aC) = –0.009) (cf.: Qn(fC) = –0.048 in corannulene and Qn(gC) = –0.050 in coronene). On the other hand, Qn(C–H) (= 0.032) of the outside ring in corannulene is charged positively slightly more than that in coronene (Qn(C–H) = 0.031), where Qn(C–H) = 0.000 for benzene.
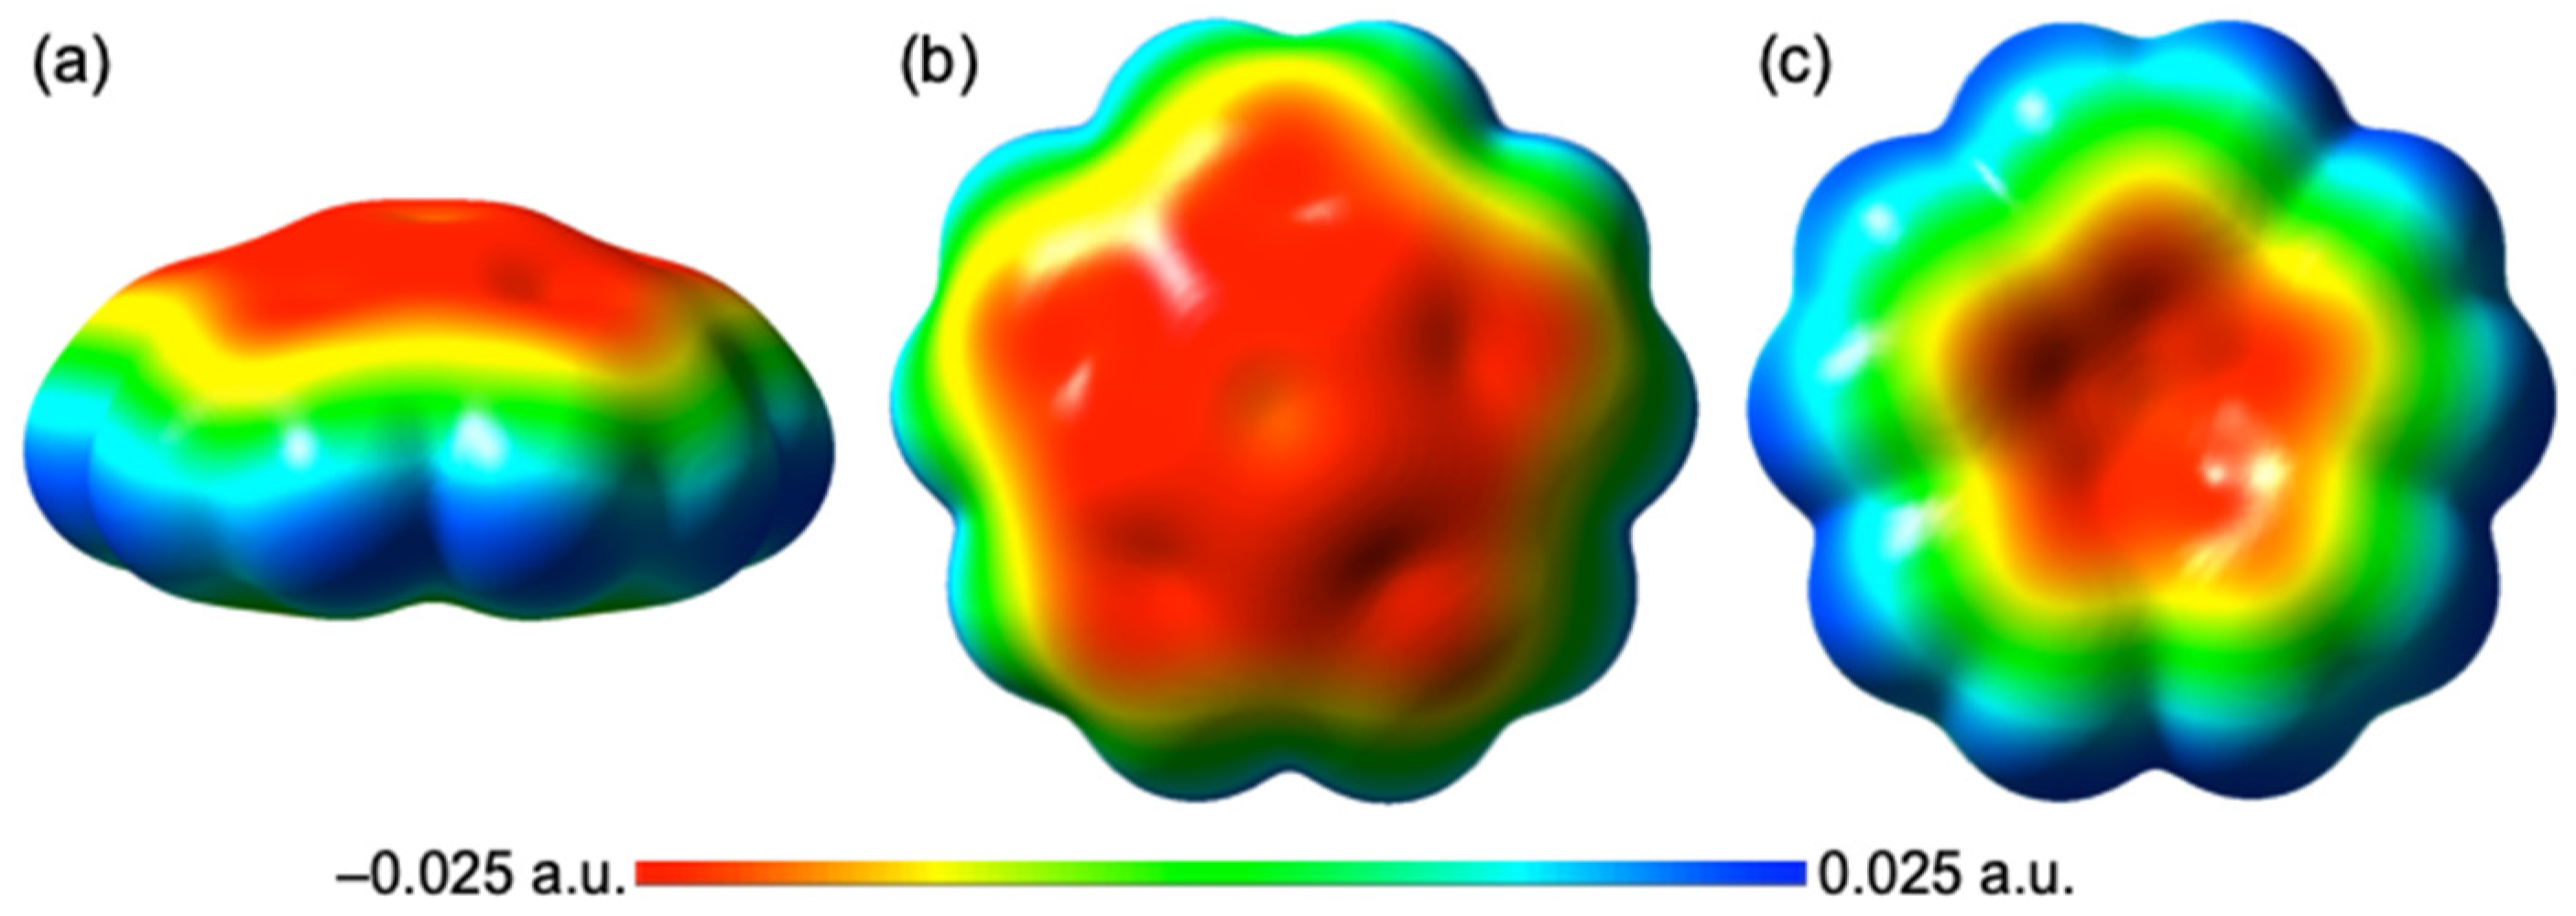
In the bowl-shaped π-system of C20H10, the π-orbitals are extended to the cv side, while they will shrink to the cc side. Namely, the electron density ρ(r) must be more widely extended on the cv side relative to the case of the cc side, as expected. The expectation can be visualized by the electron potential surface (EPS) on the cv and cc sides of corannulene. Figure 1 shows EPS on the cv and cc sides of corannulene, together with the lateral view. The electron–electron repulsive factor between π(C20H10) and B–A in B–A-∗-π(C20H10) (B–A = X–H, X–X, and F–X) will also play an important role in the interaction distances. The interaction distances are named r1 (see Scheme 2). Such a repulsion could be larger on the cc side than that on the cv side in the bowl-shaped π(C20H10), although r1 decreases as the CT interaction of the π(C20H10)→σ*(X–Y: X = X or F) type increases. The A and/or B dependence in r1 is of interest.
The nature of the XH-∗-π in XH-∗-π(C20H10) and YX-∗-π in YX-∗-π(C20H10) will be elucidated, keeping in mind the above viewpoints, comparing that of the nature in the π(C24H12) (and π(C6H6)), after the optimizations of the adducts.
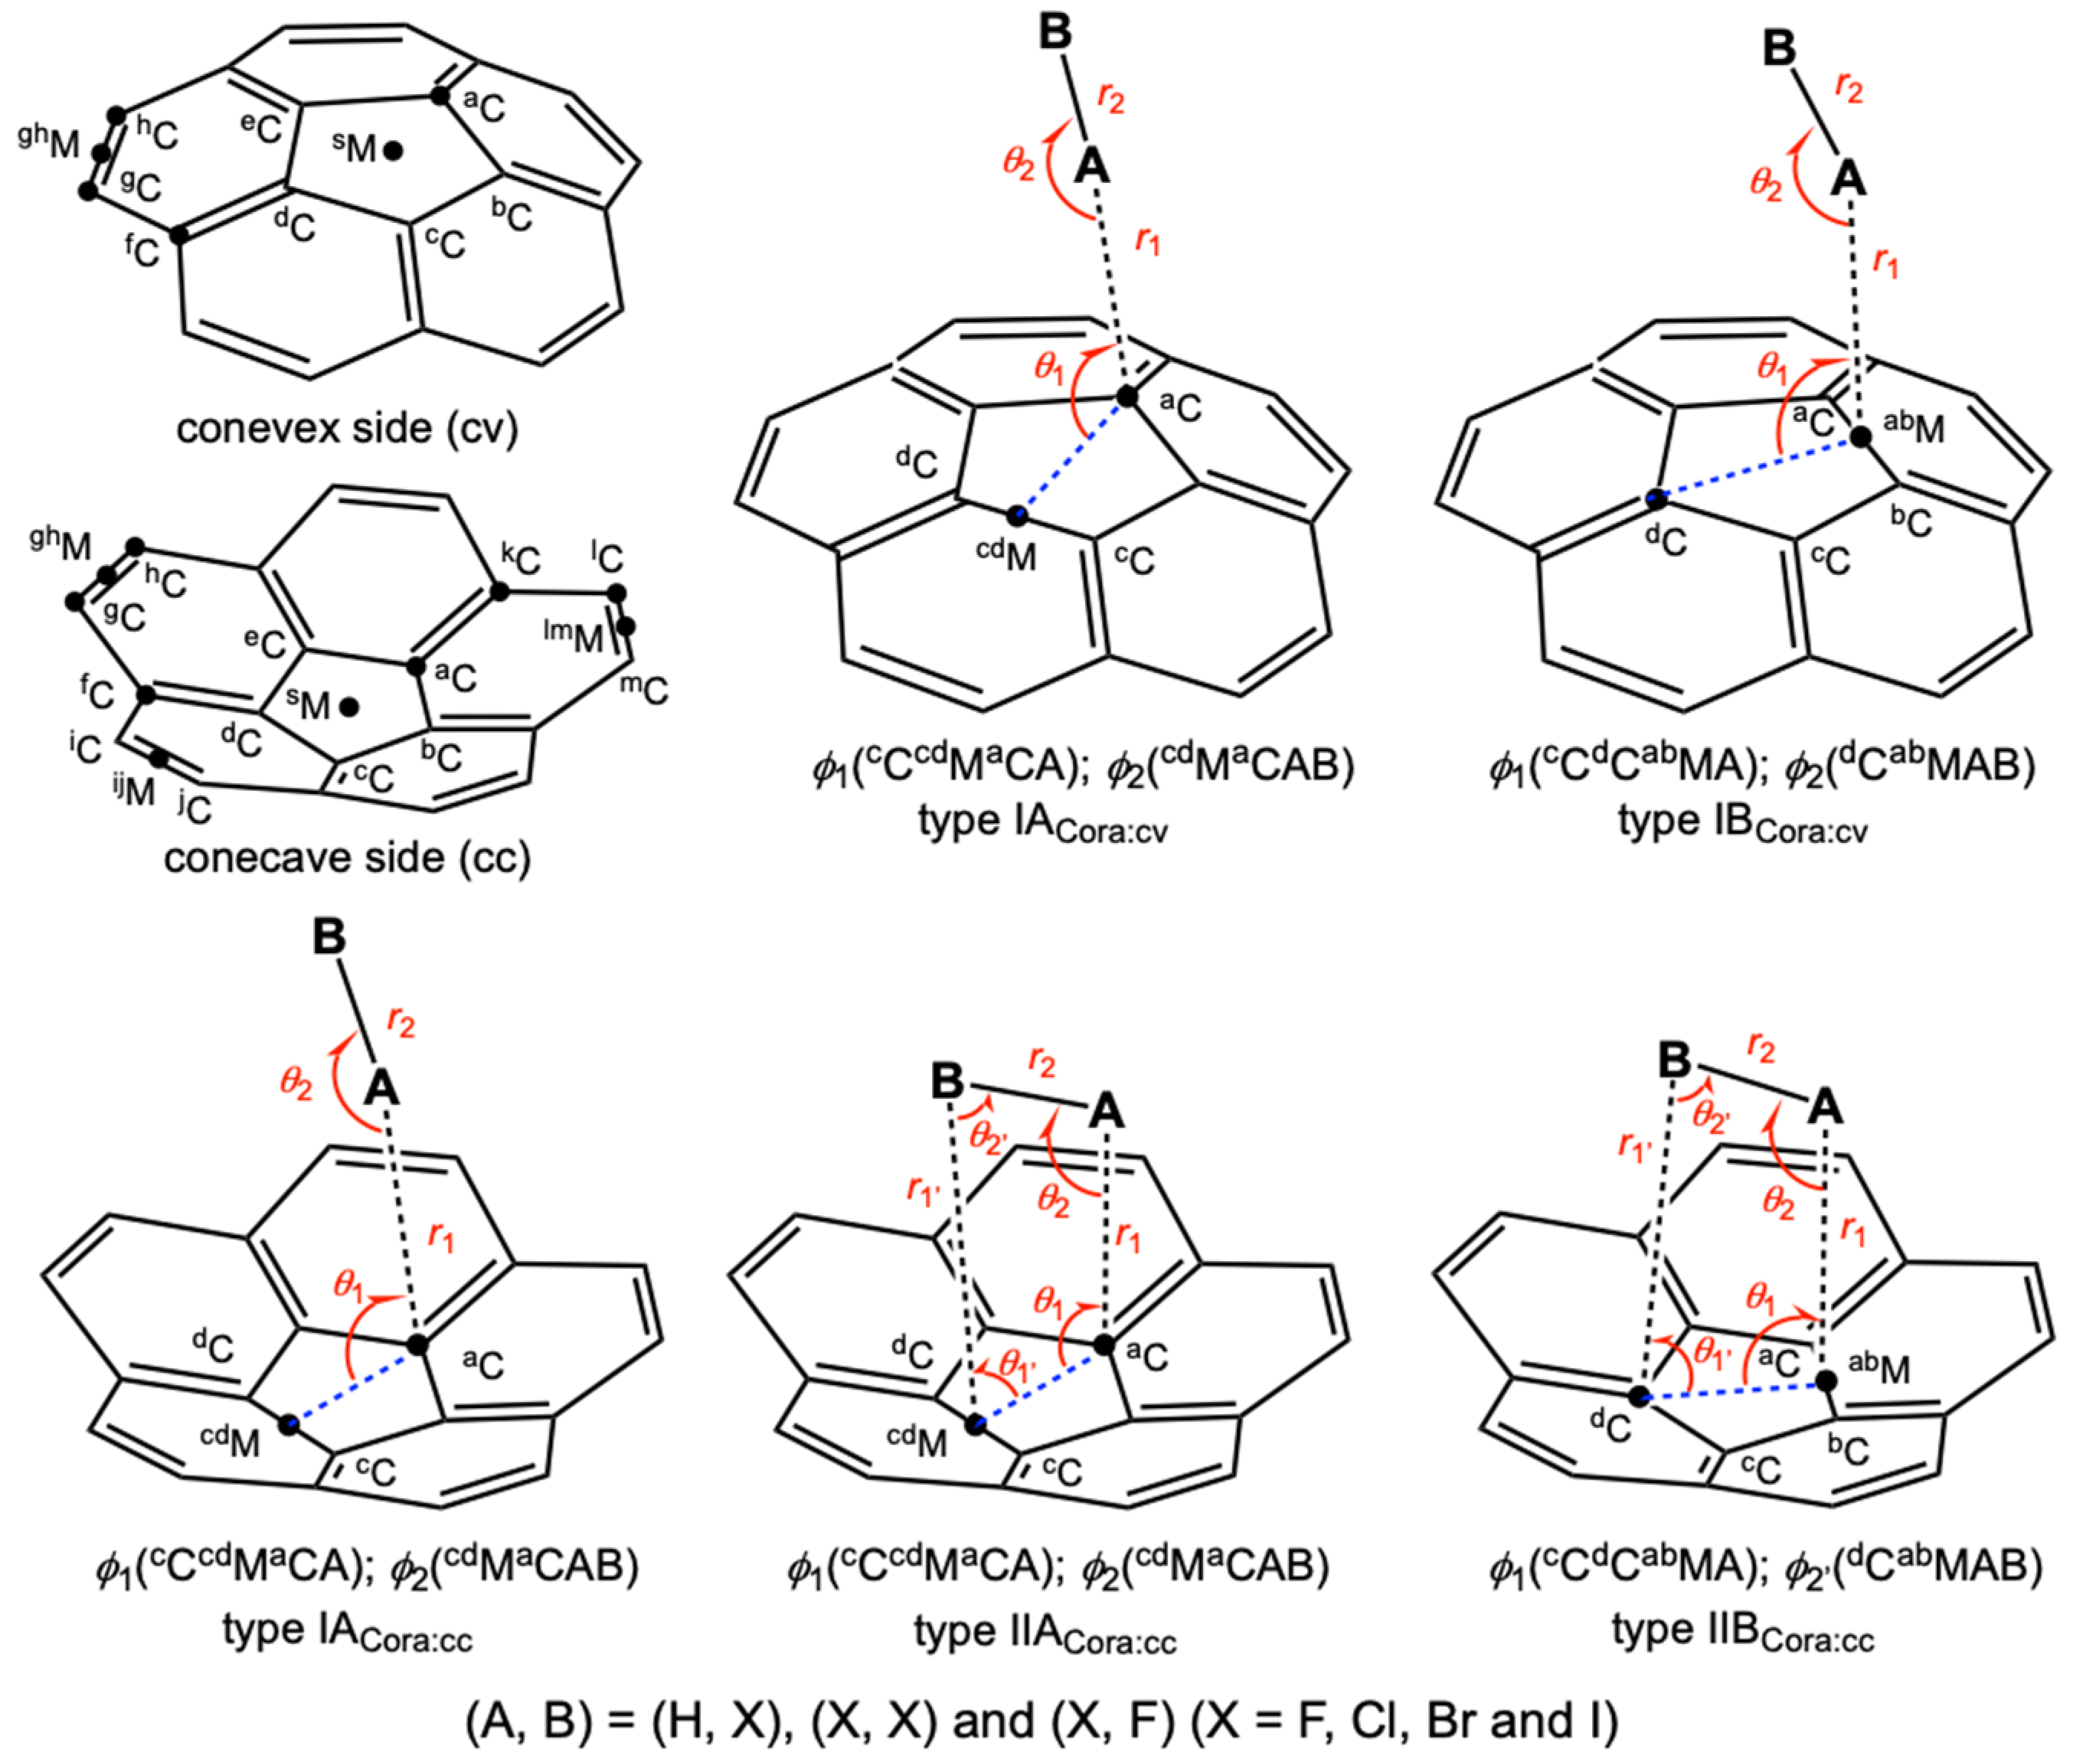
Scheme 2 illustrates the structures of corannulene adducts B–A⋯π(C20H10) (B–A = Y–X: X = F, Cl, Br, and I; Y = H, X, and F) to be clarified. Scheme 2 defines the types of structures together with the structural parameters. The optimized structures of B–A⋯π(C20H10) are referred to as type ICora if B–A interacts with the corannulene π-system through only one site of B–A. In this case, B–A is aligned close to the molecular axis of corannulene. Type ICora are referred to as type IACora and type IBCora, respectively, if B–A interacts with a carbon atom or a midpoint of a C=C bond. The bowl-shaped π-system of π(C20H10) extends more widely over the outside area of cv but more narrowly to the inside area of cc. The structures of the adducts are controlled by the different electronic structures of the two sides. Type ICora are referred to as type ICora:cv and ICora:cc, respectively, if B–A interacts with π(C20H10) on the cv and cc sides, respectively. The structure is type IIBCora when B–A seems to interact with π(C20H10) through both sides of B–A, which is observed on the cc side.
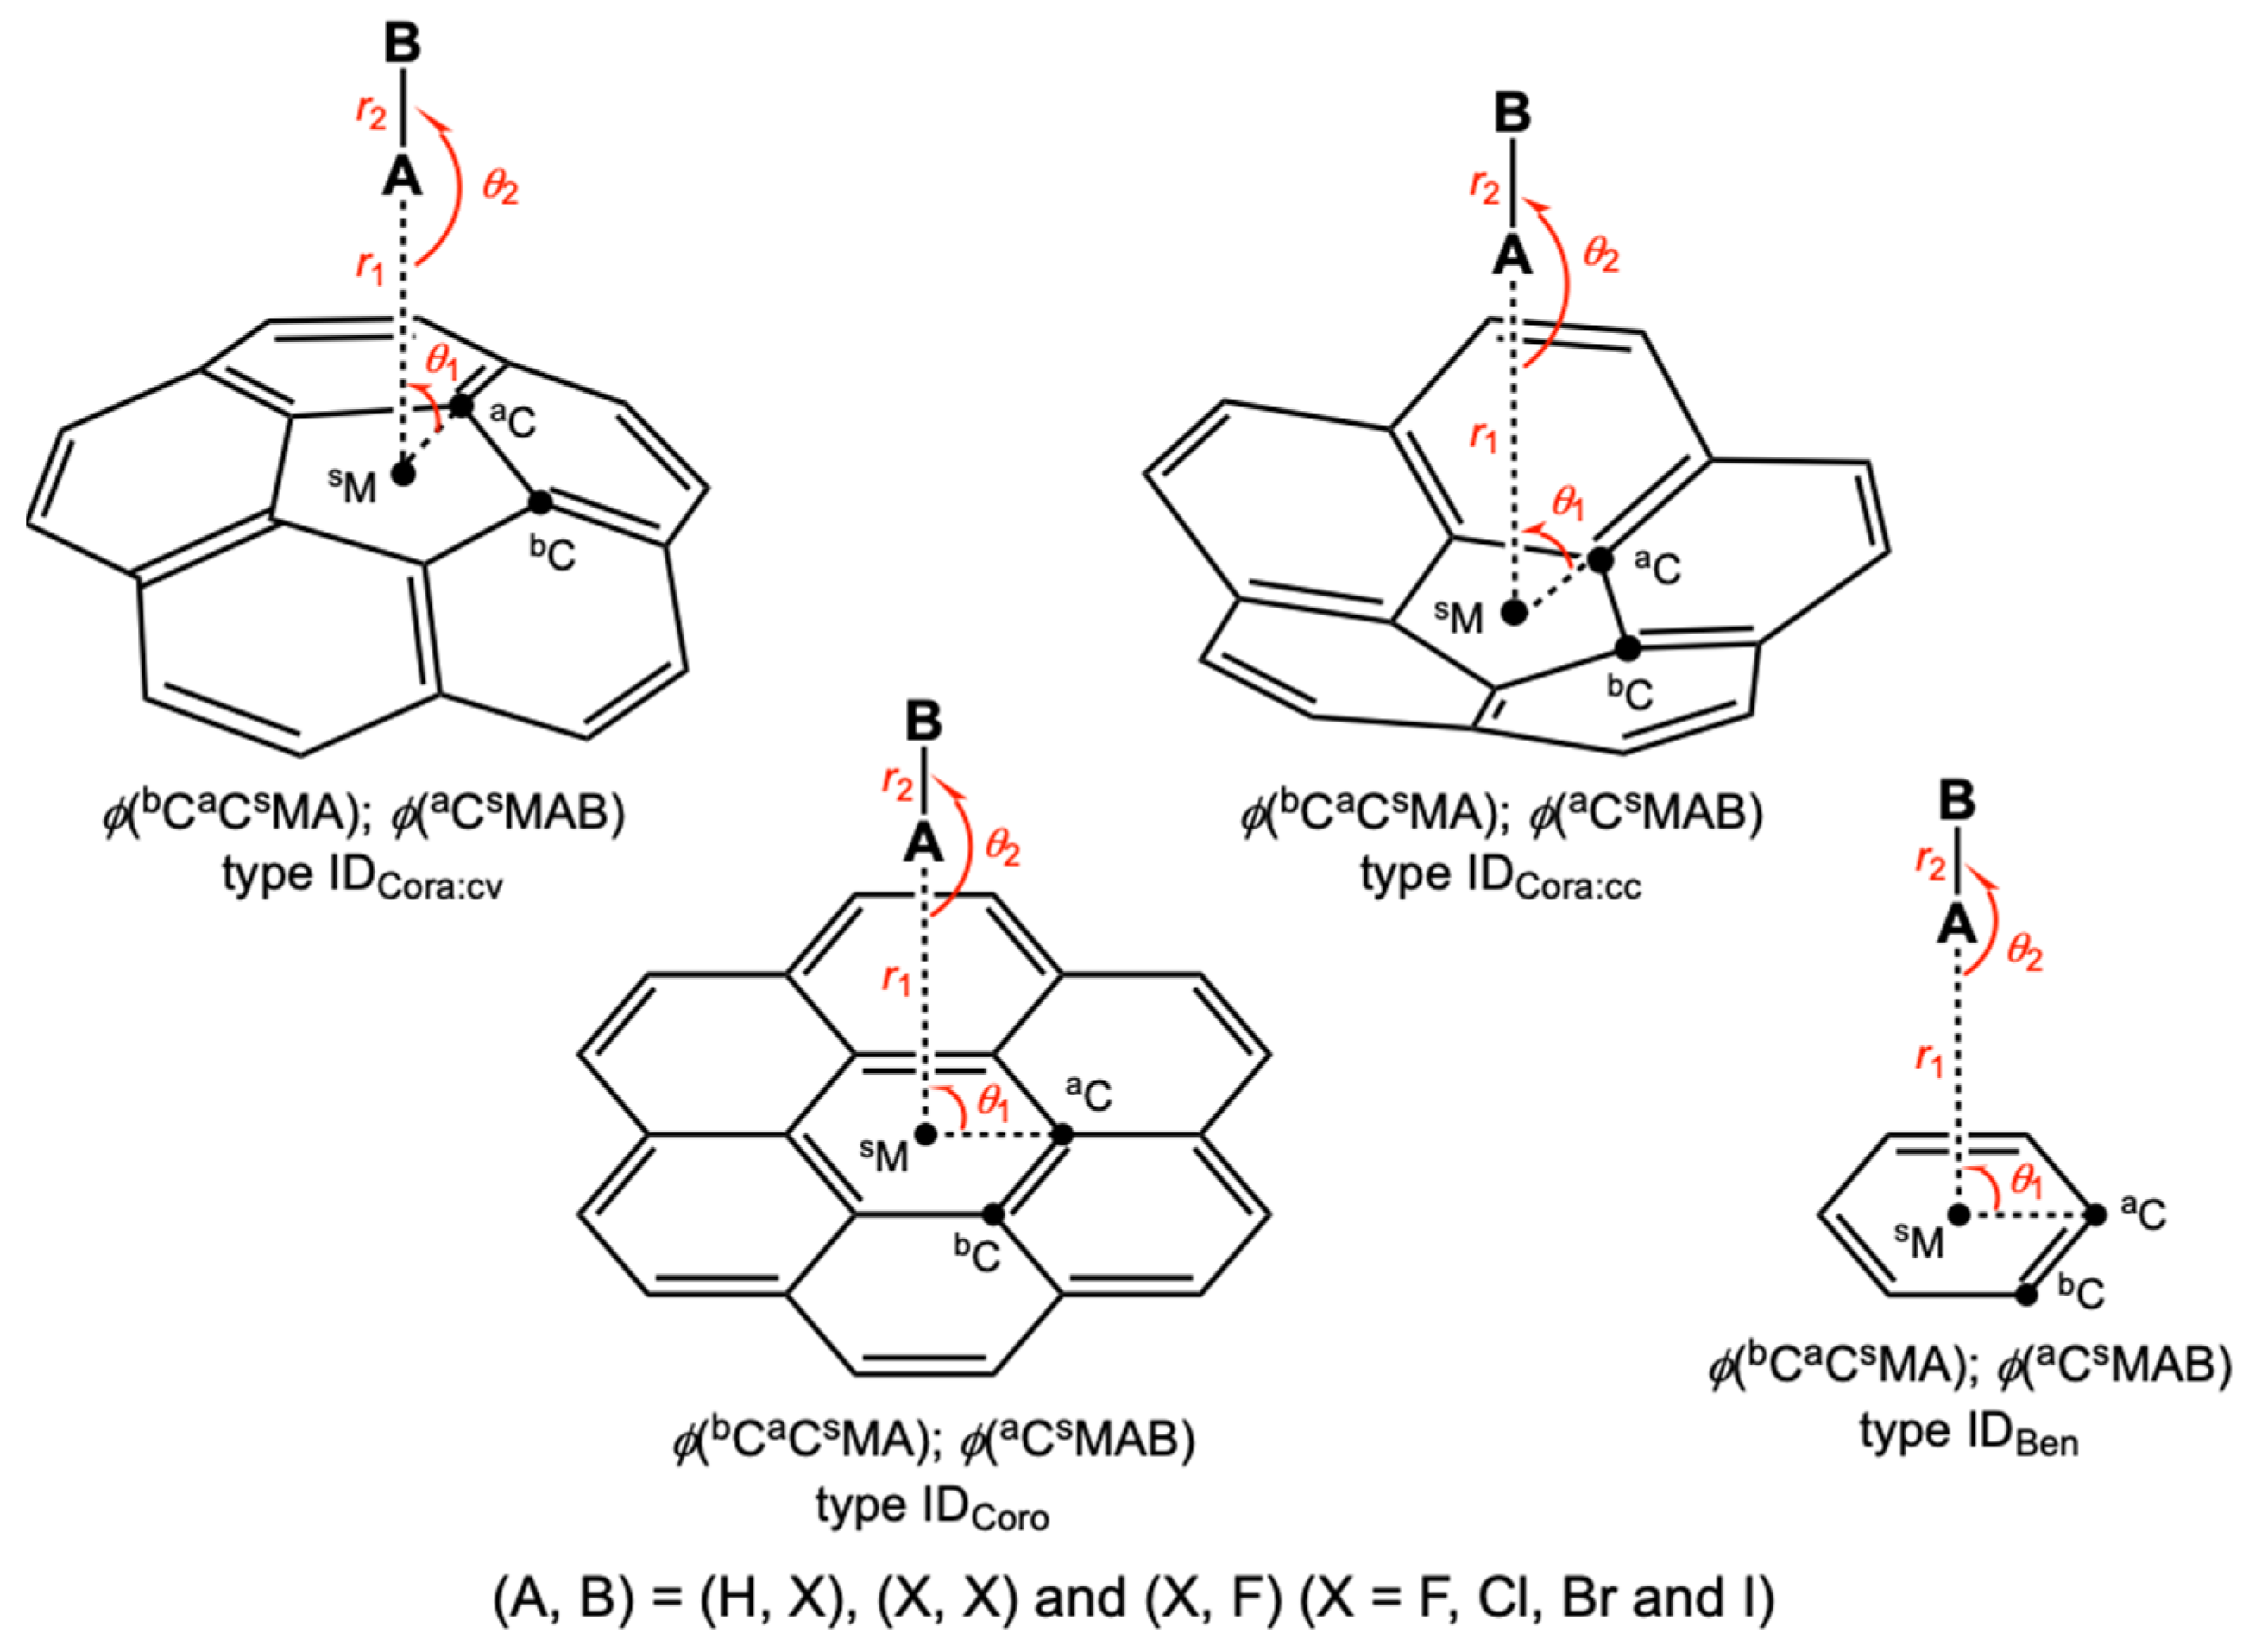
Scheme 3 shows the structures of B–A⋯π (B–A = Y–X: X = F, Cl, Br, and I; Y = H, X, and F) for π of π(C20H10) (both the cv and cc sides), π(C24H12), and π(C6H6). The structures are limited to those for B–A in B–A⋯π being placed on the molecular axis. The structures are referred to as the ID type. The differences and similarities in the nature of the interactions between the planar and distorted π-systems together with the cv and cc sides are examined employing the ID type, shown in Scheme 3. The ID-type structure enables comparison of the nature under the same conditions, where the optimized structures are very different for the adducts with the three π-systems.
The nature of the interactions is analyzed employing the quantum theory of atoms-in-molecules dual functional analysis (QTAIM-DFA) [35,36,37], which we proposed, after the QTAIM approach introduced by Bader [38,39]. A bond critical point (BCP, ∗) is an important concept in QTAIM, which appears on each bond path (PB). QTAIM functions for the interactions in question are calculated at the BCPs. ρ(r) at BCP is denoted by ρb(rc), as are other QTAIM functions, such as the total electron energy densities Hb(rc), potential energy densities Vb(rc), and kinetic energy densities Gb(rc). A chemical bond or interaction between A and B is denoted by A–B, which corresponds to a BP in QTAIM. We use A-∗-B for BP, where the asterisk emphasizes the existence of a BCP in A–B [35,36].
Equations (1) and (2) show the relationships among the functions (cf.: Virial theorem for Equation (2)) [38,39].
Hb(rc) = Gb(rc) + Vb(rc)
(ћ2/8m)∇2ρb(rc) = Hb(rc) − Vb(rc)/2 = Gb(rc) + Vb(rc)/2
Hb(rc) is plotted versus Hb(rc) − Vb(rc)/2 in QTAIM-DFA. Data from the perturbed structures around fully optimized structures are employed for the plots, in addition to the fully optimized ones [35,36,37]. The perturbed structures in this work are generated by using the coordinates derived from the compliance constants of the internal vibrations Cii [40,41,42,43,44]. The method is named CIV. CIV is recognized to be the most reliable method to generate the perturbed structures; however, it cannot be applied when BP starts at least one BCP. The perturbed structures are also generated by using the normal coordinates of the (best-fitted) internal vibrations [45,46]. The method is named NIV, which is also reliable. However, we must be careful when the (best-fitted) internal vibrations are not located in the interactions in question. Results with CIV and/or NIV are discussed in the text, selecting the more approximating one if there are some differences.
Data from the fully optimized structures are analyzed using the polar coordinate (R, θ) representation, which corresponds to the static nature of the interactions [35,36,37,40]. Each interaction plot, for the data from both the perturbed and the fully optimized structures, is expressed by (θp, κp). While θp corresponds to the tangent line of the plot, κp is the curvature. θ and θp are measured from the y-axis and the y-direction, respectively. We proposed the concept of the “dynamic nature of interactions” based on (θp, κp) [35,36,37,40]. We named (R, θ) and (θp, κp) the QTAIM-DFA parameters. (See also footnotes of Table 1 for the definition). QTAIM-DFA is applied to typical chemical bonds, and interactions and rough criteria are established. QTAIM-DFA and the criteria are explained in the Supplementary Materials using Schemes S1–S3, Figures S1 and S2, Table S1, and Equations (S1)–(S7). The basic concept of the QTAIM approach is also explained.
The analyzed results of QTAIM-DFA will help to elucidate the nature of the interactions and a better understanding of the adducts formed by the interactions. QTAIM-DFA must be one of the best methodologies to elucidate the nature of the interactions. QTAIM-DFA will not only classify the interactions but also elucidate the nature. With the results, we will be able to access to the nature of the interactions in the adduct between corannulene and XH, XX, and FX (X = F, Cl, Br, and I) by elucidating the nature of the interactions with the method.
The dynamic and static nature of π-HBs and π-XBs in the bowl-shaped corannulene π-system (π(C20H10)) is elucidated with QTAIM-DFA after the clarification of the structural feature. Herein, we present the results of the investigations on the nature of X–H-∗-π(C20H10), X–X-∗-π(C20H10), and F–X-∗-π(C20H10) (X = F, Cl, Br, and I), where the nature is classified and characterized by employing the criteria as a reference. The differences and similarities in the nature of the interactions in B–A-∗-π for π of π(C20H10) (both cv and cc sides), π(C24H12) [21], and π(C6H6) [23,24,25] are also discussed.

2. Methodological Details of the Calculations

Calculations were performed by employing the Gaussian 09 program package [47]. The 6-311G(2d,p) basis sets for C and H were employed for the calculations, with the basis sets of the 6-311 + G(3df) for F, Cl, and Br, and the (7433211/743111/7411/2 + 1s1p) type for I, implemented from the Sapporo Basis Set Factory [48]. The basis set system is named basis set system-A (BSS-A). The Møller–Plesset second-order energy correlation (MP2) level [49,50,51] was applied to BSS-A (MP2/BSS-A). Optimized structures were confirmed by a frequency analysis. QTAIM functions were calculated using the AIM2000 [52,53] and AIMAll [54] programs with the same method as the optimizations. The optimized structures were not corrected with the BSSE method. A natural bond orbital analysis (NBO) and natural population analysis (NPA) were calculated with M06-2X/BSS-A//MP2/BSS-A [34,55].
Equation (3) explains the process to generate the perturbed structures with CIV [40,41,42,43,44]. The coordinates derived from the Cii values (Ci) are used to generate the i-th perturbed structures in question (Siw). Ci is added to the standard orientation of the fully optimized structure (So) in the matrix representation. The coefficient giw in Equation (3) controls the difference in the structures between Siw and So: giw are determined to satisfy Equation (4) for an interaction in question, where r and ro show the interaction distances in question in the perturbed and fully optimized structures, respectively, with ao of the Bohr radius (0.52918 Å). In the case of NIV, the process can be similarly explained by replacing Ci in Equation (3) to the (best-fitted) normal coordinates of the i-th internal vibration (Ni), which is formulated by Siw = So + giw· Ni. The Ci and Ni values of five digits are used for the generation.
Siw = So + giw· Ci
r = ro + wao (w = (0), ±0.05, and ±0.1; ao = 0.52918 Å)
y = co + c1x + c2x2 + c3x3 (Rc2: square of the correlation coefficient)
In the QTAIM-DFA treatment, Hb(rc) is plotted versus Hb(rc) − Vb(rc)/2 for data of five points of w = 0, ±0.05, and ±0.1 in Equation (4) unless otherwise noted. Each plot is analyzed using a regression curve of the cubic function as shown in Equation (5), where (x, y) = (Hb(rc) − Vb(rc)/2, Hb(rc)) (Rc2 (square of correlation coefficient) > 0.99999 in usual) [37].

3. Results and Discussion

3.1. Optimizations of B–A⋯π(C20H10) (B–A = X–H, X–X, and F–X)

The optimizations of B–A⋯π(C20H10), where B–A = X–H, X–X, and F–X (X = F, Cl, Br, and I), were started with MP2/BSS-A, putting B–A on various places close to the symmetry axis (sM), some carbon atoms (aC, fC, and/or gC) and/or the midpoint of the outside C=C bond (ghM) on the cv and cc sides (see Scheme 2 and Scheme 3 for the definitions). On the cv side, all optimizations of B–A⋯π(C20H10) converged to type IACora:cv, except for type IBCora:cv of X–H⋯π(C20H10) (X = Cl, Br, and I). For the cc side, they converged to type IACora:cc for F–H⋯π(C20H10) and F–X⋯π(C20H10) (X = Cl, Br, and I), type IIACora:cc for X–H⋯π(C20H10) (X = Cl, Br, and I) and X–X⋯π(C20H10) (X = F and Cl), and type IIBCora:cc for X–X⋯π(C20H10) (X = Br and I). The optimized C1 structures were further optimized assuming the Cs structures when the C1 structures were very close to the Cs symmetry. The structural parameters are summarized in Table S2 of the Supplementary Materials. The optimized structures are not shown in the figures, but they can be found as molecular graphs (see Figure 2 and Figure 3). They are drawn on the optimized structures.
Next, molecular graphs are examined after clarification of the structural feature of B–A⋯π(C20H10).

3.2. Molecular Graphs for B–A-∗-π(C20H10) (B–A = X–H, X–X, and F–X)

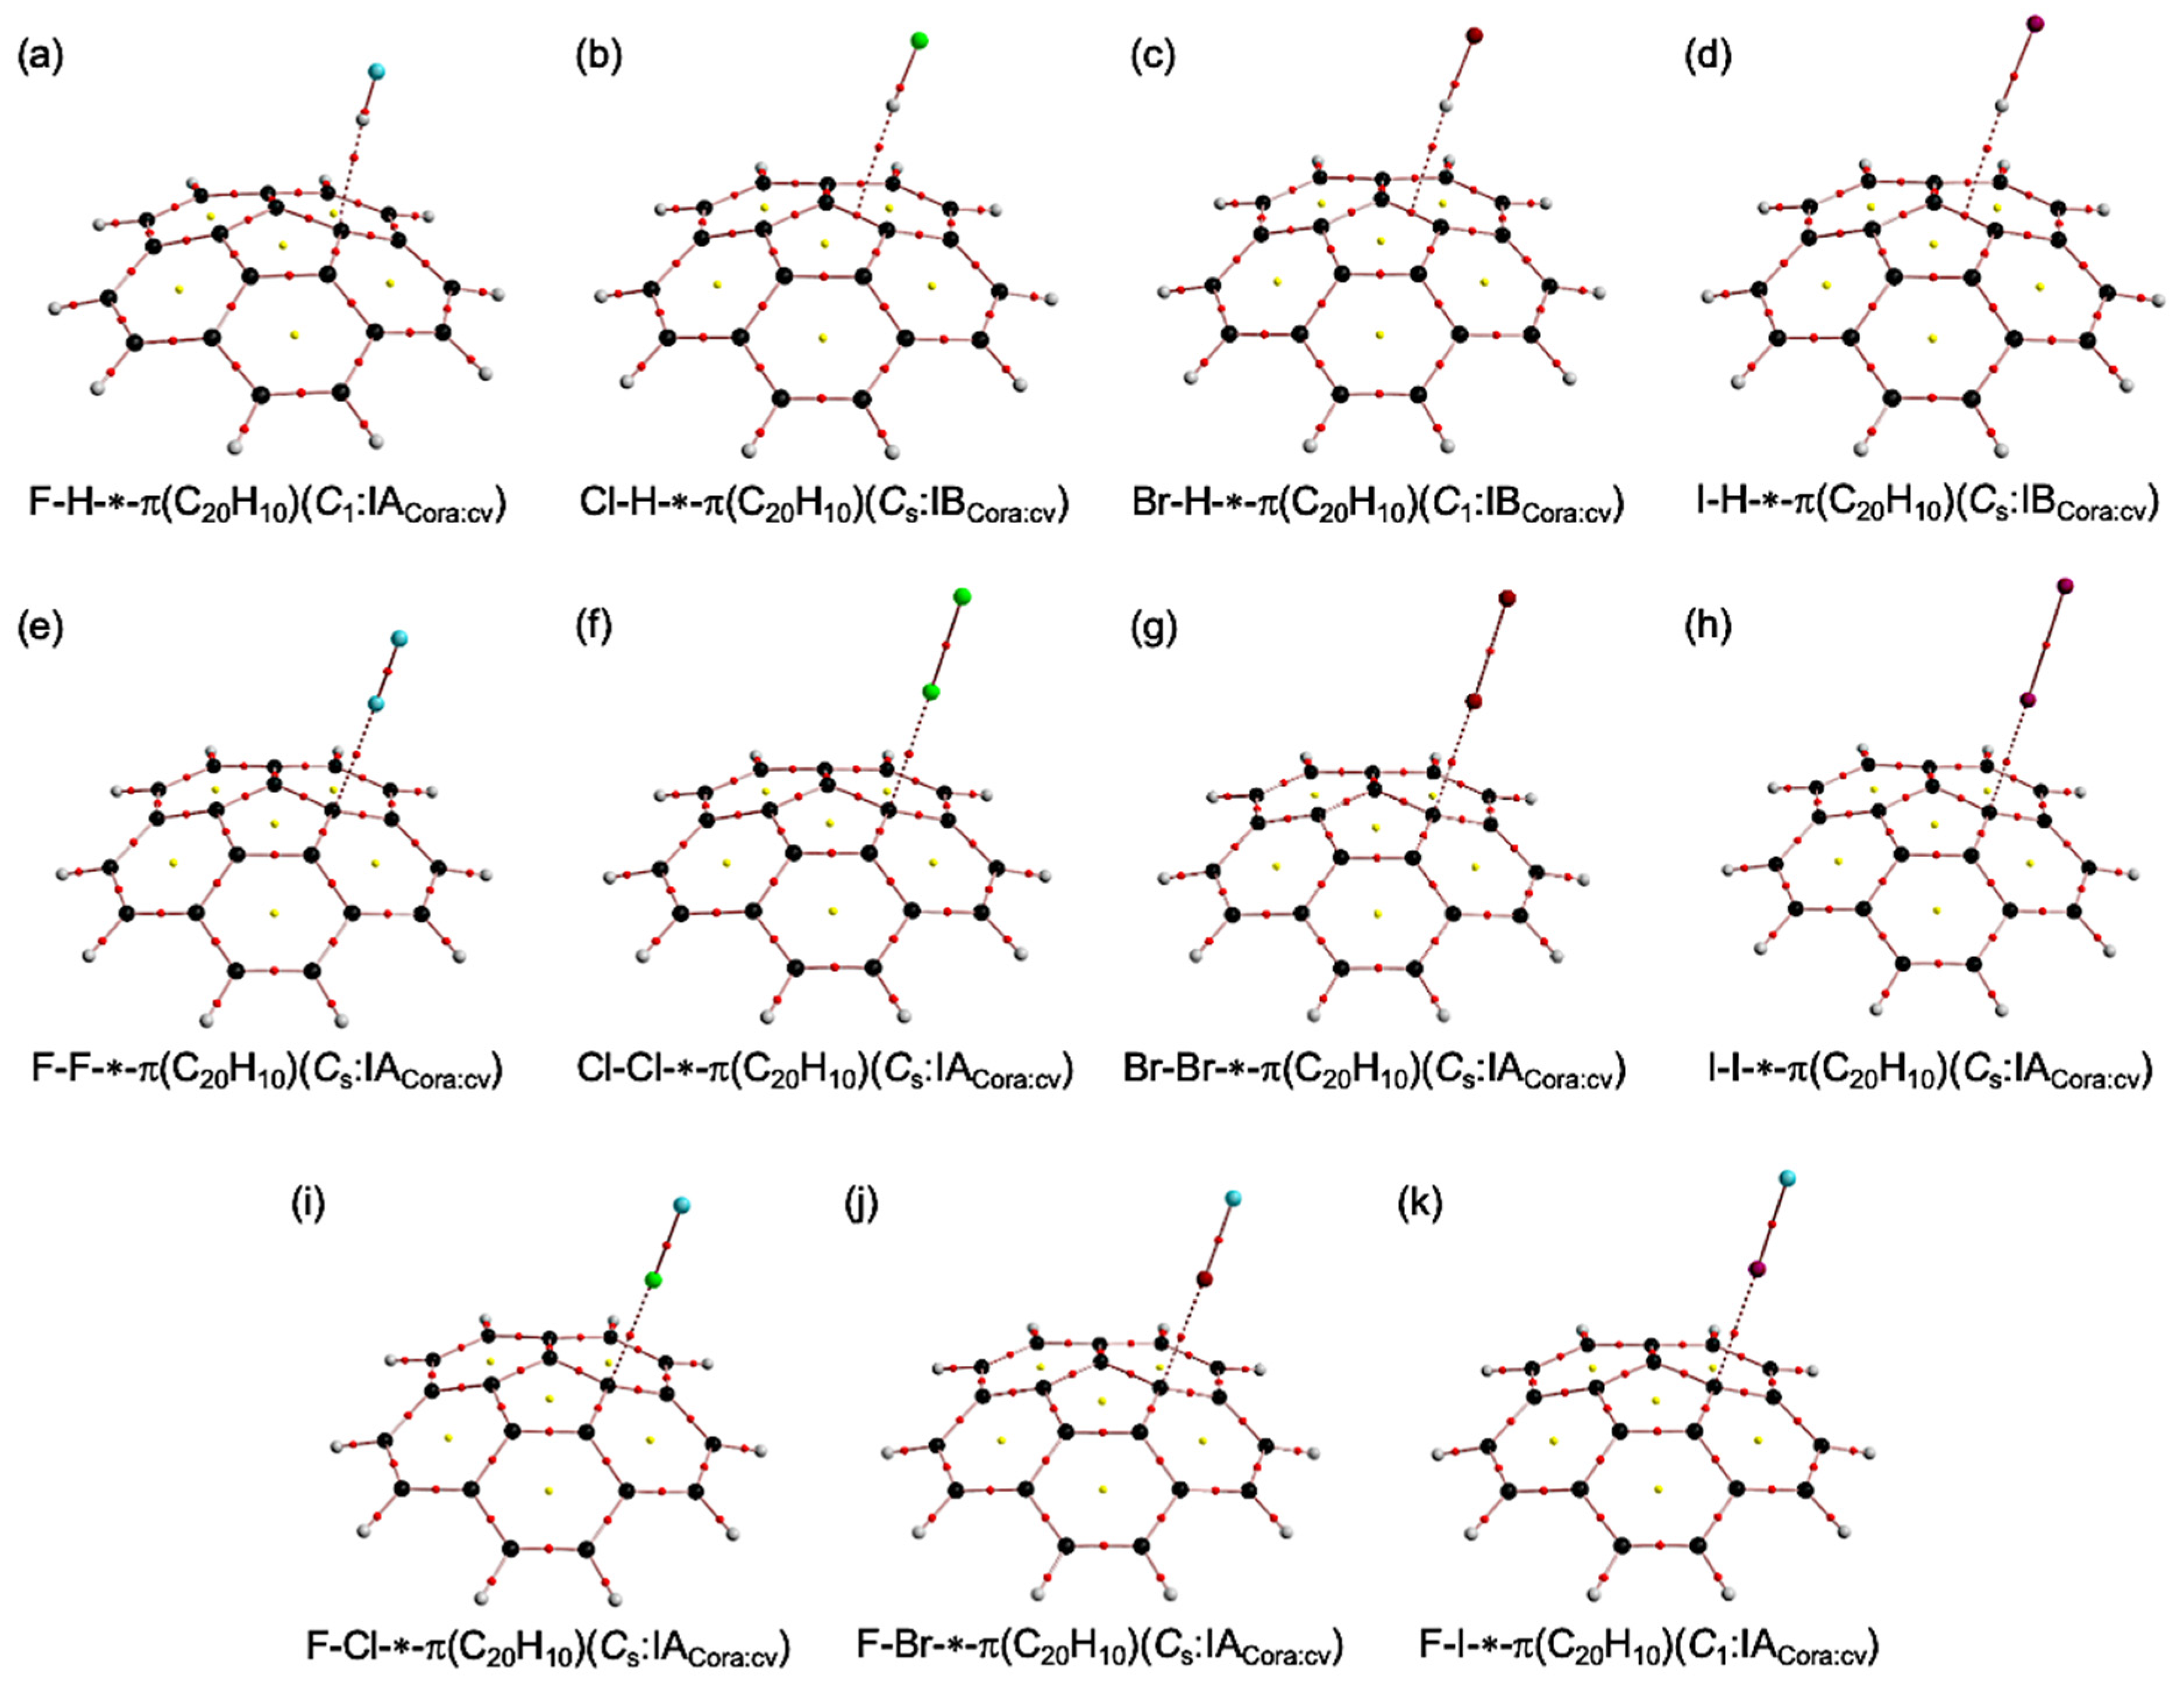
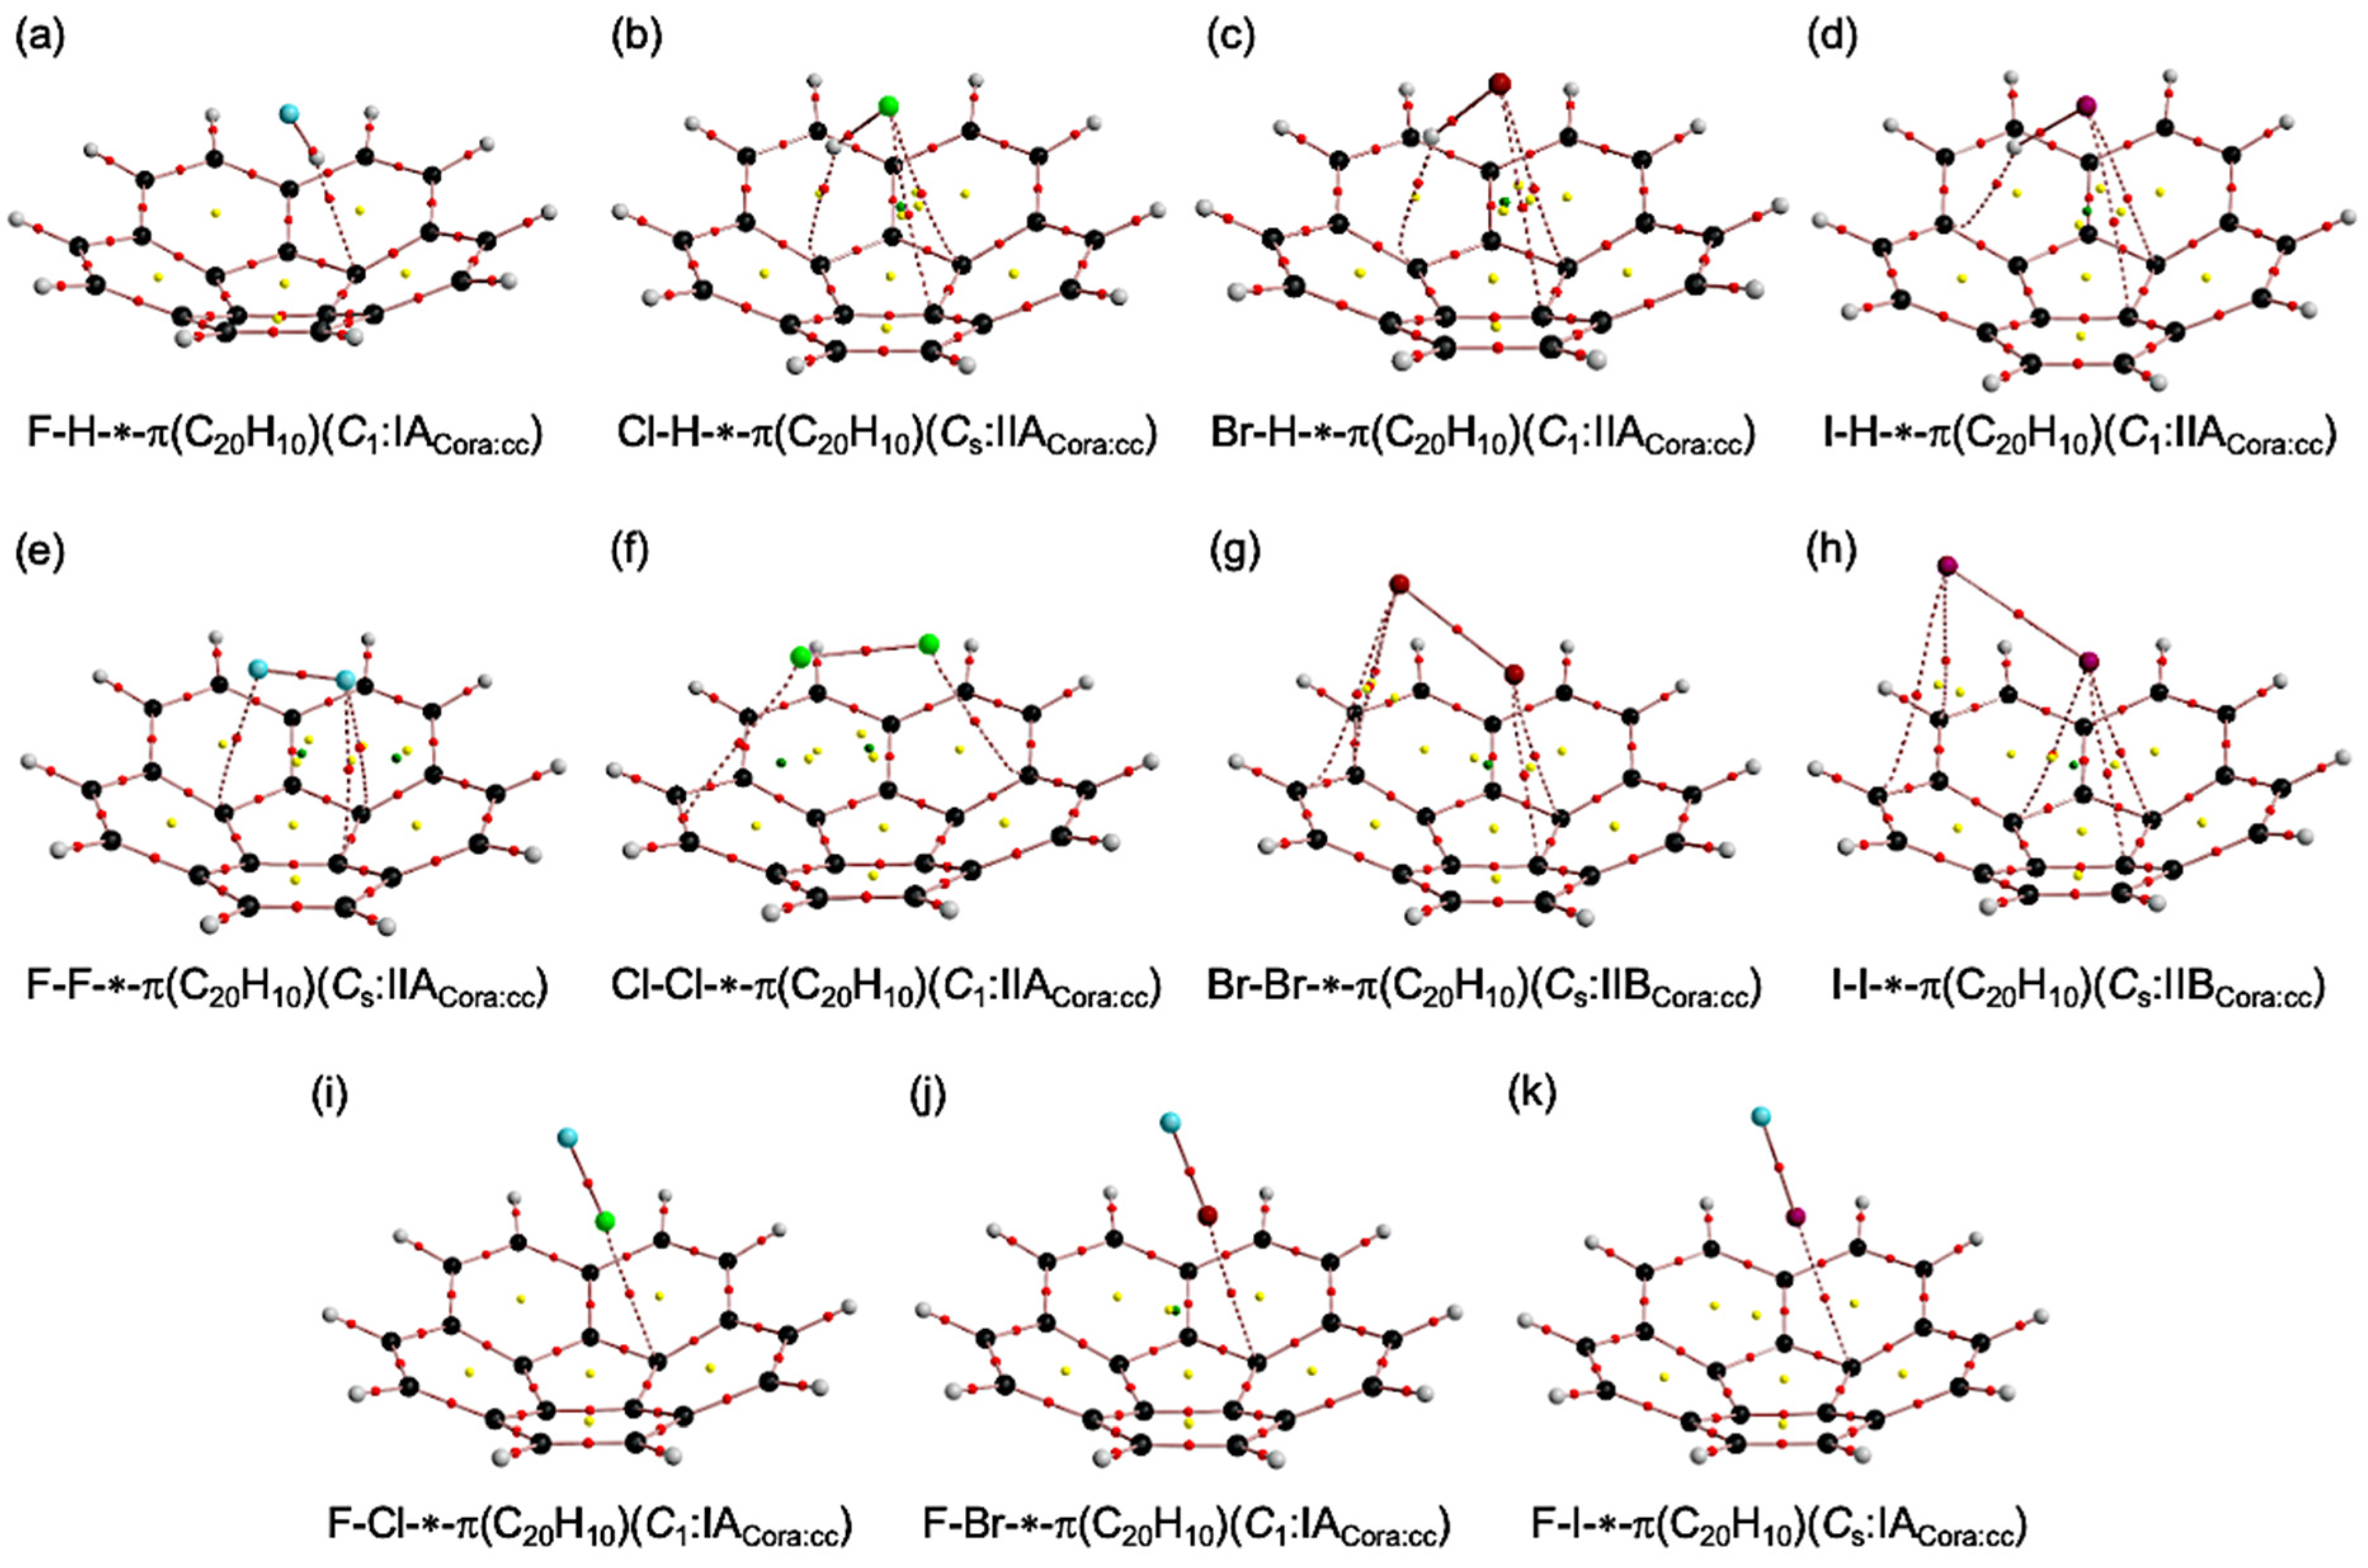
The molecular graphs are drawn on the optimized structures with MP2/BSS-A for X–H-∗-π(C20H10), X–X-∗-π(C20H10), and F–X-∗-π(C20H10), where X = F, Cl, Br, and I. Figure 2 and Figure 3 illustrate the molecular graphs on the cv and cc sides of π(C20H10), respectively. All BCPs expected are clearly detected, containing those for the XH-∗-π, XX-∗-π, and YX-∗-π interactions in question, together with the additional ones. The BPs in question appear clearly, with BCPs, ring critical points (RCPs), and cage critical points (CCPs), if any. The structural features of the species are well visualized by the molecular graphs.
In the reaction on the convex side of corannulene, only the structure of the monodentate coordination to the central five-membered ring was optimized with HX, XX, and FX. On the other hand, on the concave side, similarly, bidentate to pentadentate structures were optimized for coordination to the central five-membered ring, except for HF and FX. In the adducts of X–H-∗-π(C20H10), X–X-∗-π(C20H10), and F–X-∗-π(C20H10), electrons will flow from the corannulene to the components; thus, the electron density will increase on the end of the components.
As shown in Figure 2 and Figure 3, BPs for B–A-∗-π(C20H10) (B–A = X–H, X–X, and F–X) seem almost straight at first glance. BPs, as defined in QTAIM, is the connection of the minima of the electron density, where a BCP exists for each BP between two interacting atoms, although BP sometimes starts from a BCP of a bond. The BPs are not necessarily the shortest path. In other words, the lengths of BPs (rBP) and the straight-line distances (RSL) are approximately equal when the interaction characteristics are relatively simple, but they differ greatly when they are not. Such things often happen in the case of weak interactions. To further examine the behavior of the BPs, rBP and RSL were calculated. The values are collected in Table S4 of the Supplementary Materials, together with the differences between them ΔrBP (=rBPRSL). The ΔrBP values are less than 0.10 Å for all BPs in question, except for Br–H-∗-π(C20H10) (C1: type IIACora:cc; 0.180 Å), Br–H-∗-π(C20H10) (C1: type IBCora:cv; 0.681 Å), and Cl–Cl-∗-π(C20H10) (C1: type IIACora:cc; ΔrBP = 0.701 Å). The rBP is plotted versus RSL, which is shown in Figure S4 of the Supplementary Materials. The plot gave a very good correlation (y = 0.995x + 0.035: Rc2 = 0.998), if omitted Br–H-∗-π(C20H10) (C1: type IIACora:cc), Br–H-∗-π(C20H10) (C1: type IBCora:cv), and Cl–Cl-∗-π(C20H10) (C1: type IIACora:cc). Consequently, all BPs in question can be approximated as straight lines except for the three cases. There must exist some reasons for the large ΔrBP values. Typical cases where large ΔrBP values are observed are shown below. BPs often curve in the area (very) close to atoms. A BP appears when a maximum line of ρ(r) connects two atoms. In this case, the maximum line does not often direct toward the second atom just after it starts the first atom. Such a case is also observed in which a BP directs to a BCP of another bond, where it reaches not the BCP but an atom corresponding to the BCP.

3.3. Survey of B–A-∗-π(C20H10) (B–A = X–H, X–X, and F–X)

The energies for the formation of the adducts from the components, ΔE [= E(B–A∙∙∙π(C20H10))–(E(B–A) + E(C20H10)): B–A = X–H, X–X, and F–X], were calculated with MP2/BSS-A. The ΔEES and ΔEZP values are collected in Table S3 of the Supplementary Materials, where ΔEES and ΔEZP stand for ΔE on the energy surface and those with the collections by the zero-point energy, respectively, together with the second-perturbation energies corresponding to the donor-acceptor interaction from π(C=C) to σ*(X–H) or σ*(Y–X), calculated with M06-2X/BSS-A//MP2/BSS-A.
To confirm the validity of the argument using energy surfaces, we checked the correlation between ΔEZP and ΔEES. ΔEZP is plotted versus ΔEES, which is shown in Figure S3 of the Supplementary Materials. The plots gave (very) good correlations: y = 1.015x + 2.67: Rc2 = 0.996 (n (number of data points) = 11) for cv, y = 1.025x + 3.08: Rc2 = 0.999 (n = 11) for cc, and y = 1.021x + 2.90: Rc2 = 0.998 (n = 22) for all. Therefore, ΔEES can be used for the discussion of ΔE.
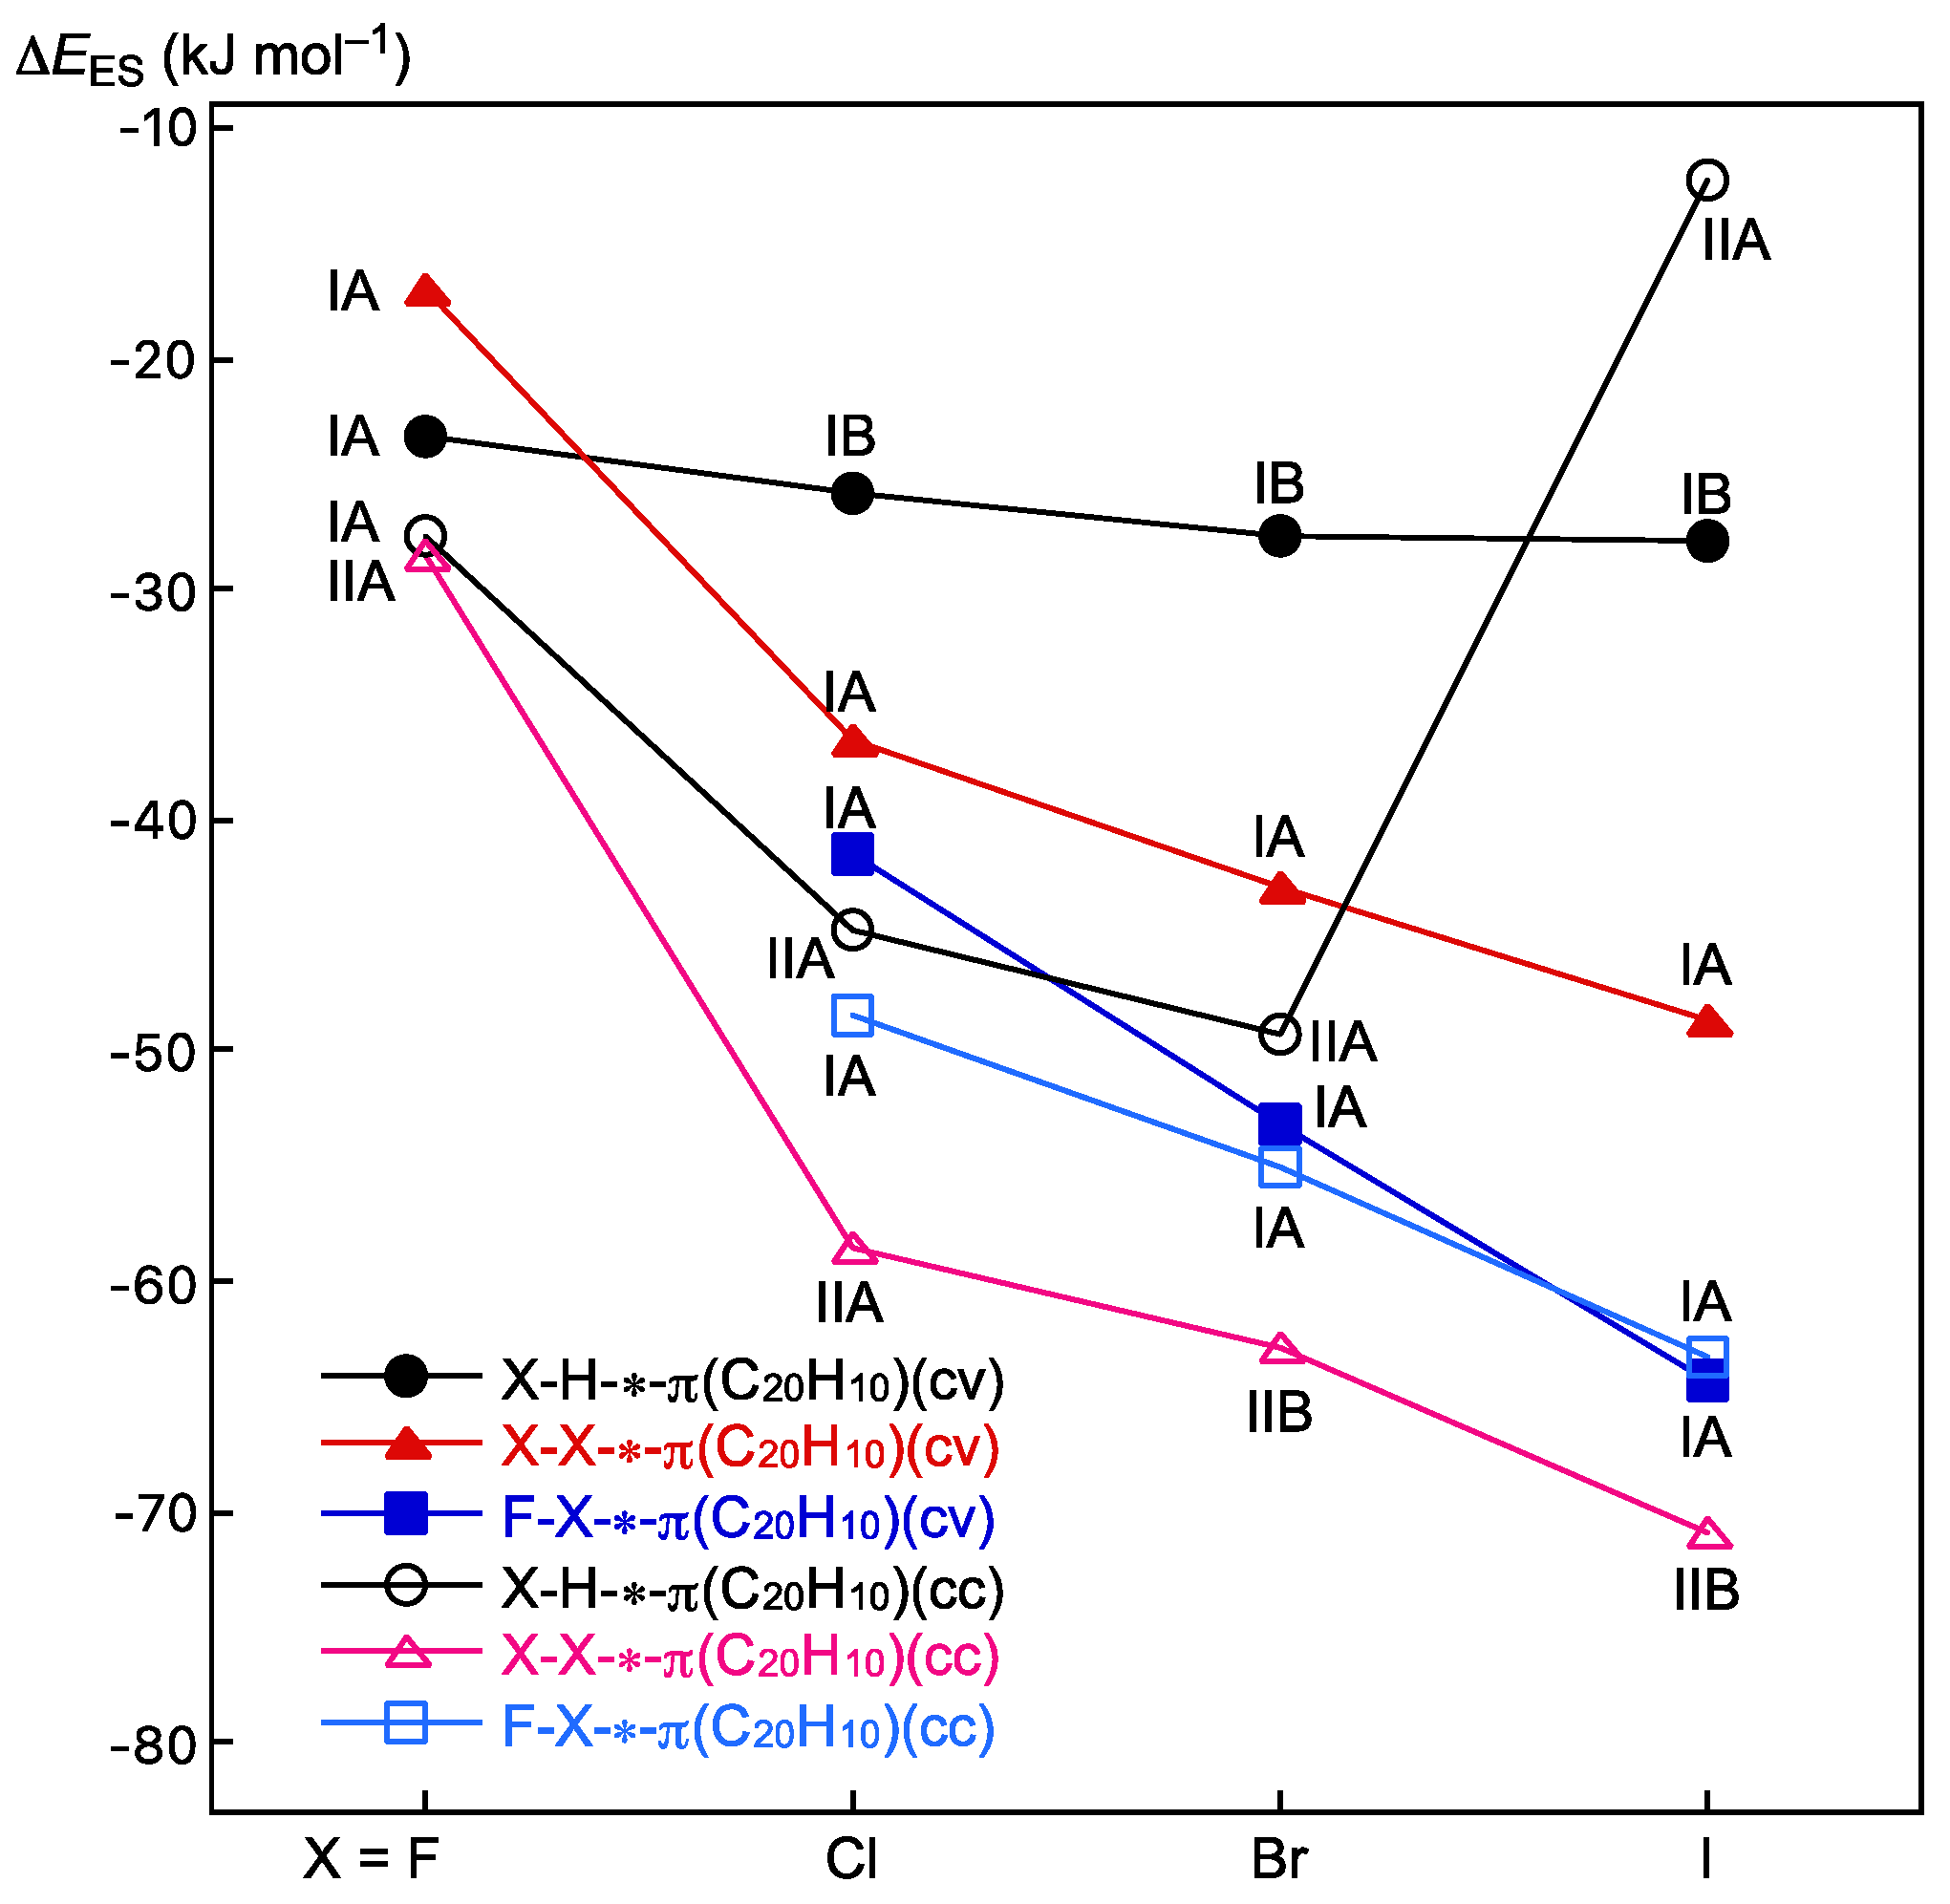
Figure 4 shows the plots of ΔEES of B–A-∗-π(C20H10) (B–A = X–H, X–X, and F–X) on the cv and cc sides versus halogens (X) calculated with M06-2X/BSS-A//MP2/BSS-A. The energies for the formation of the adducts from the components were more stabilized on the concave side except for I–H-∗-π(fC) (IIACora:cc) and F–I-∗-π(aC) (IACora:cc) and become more stable as the atomic number of the halogen increases. I–H-∗-π(fC) (IIACora:cc) is out of trend because the H interacts with the outer carbon fC (Figure 2d). The stabilization energy is almost the same for F–I-∗-π(aC) (IACora:cc) and F–I-∗-π(aC) (IACora:cv). X–X-∗-π was also more stabilized than X–H-∗-π, and X–Y-∗-π was more stabilized than X–X-∗-π except for I–H-∗-π(fC) (C1: IIACora:cc).
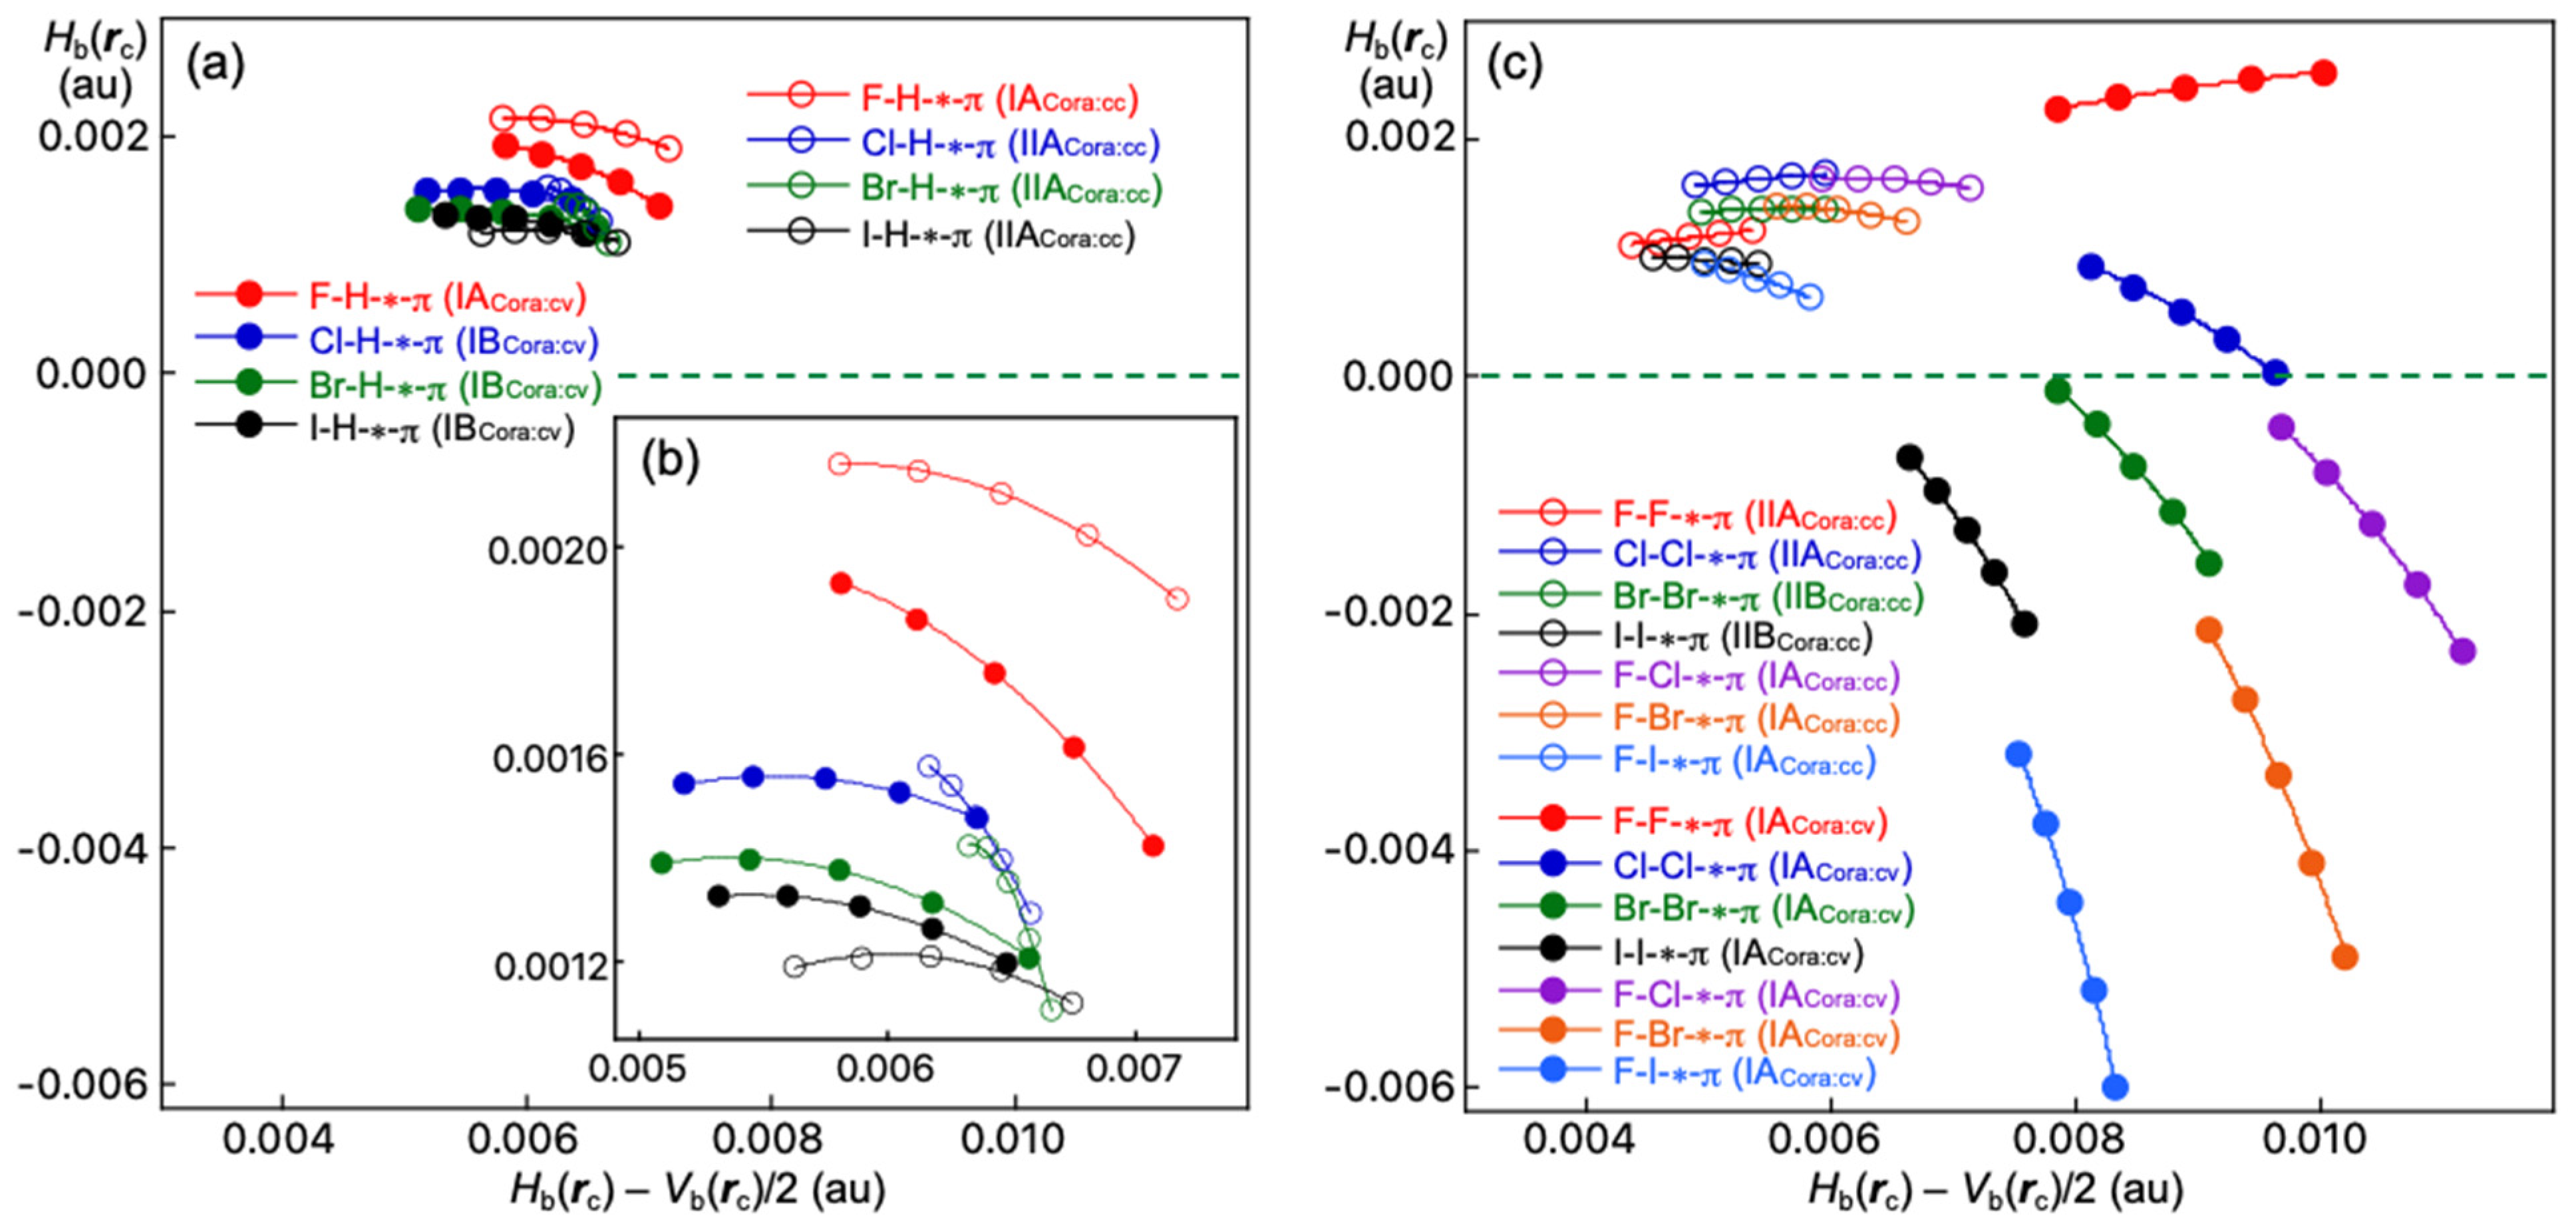
QTAIM functions were calculated for B–A-∗-π(C20H10) (B–A = X–H, X–X, and F–X). Table 1 lists the values. Figure 5 shows a plot of Hb(rc) versus Hb(rc)–Vb(rc)/2 for the interactions in question. Data shown in Table 1 are employed for the plots together with those from the perturbed structures generated with CIV and NIV, although the interactions are limited to the main interactions. The nature of the interactions is clarified by analyzing the plots in Figure 5, according to Equations (S1)–(S4) of the Supplementary Materials.

3.4. Nature of B–A-∗-π(C20H10) (B–A = X–H, X–X, and F–X)

Table 1 lists the ρ(r), Hb(rc) − Vb(rc)/2, and Hb(rc) values of the QTAIM functions. Table 1 collects the QTAIM-DFA parameters of (R, θ) and (θp, κp), the analyzed results, compliance constants Cii for CIV, employed to generate the perturbed structures, and/or the frequencies corresponding to the interval vibrations employed to generate the perturbed structures with NIV. The values for the main interactions are given in Table 1, while those for the additional interactions on the cv and cc side are in Table S8 of the Supplementary Materials, although the definition is tentative. The θp, values for the main interactions with NIV, are plotted versus those with CIV. The plot is shown in Figure S7 of the Supplementary Materials. The correlation is very good (y = 0.955x + 5.0; Rc2 = 0.995), if all data is analyzed except for those from F–H-∗-π(C20H10) (cv), Cl–H-∗-π(C20H10) (cc), and Br–H-∗-π(C20H10) (cc). Only one BP connects the components of the adducts on the cv side, which results in the very good correlation. In the case of the cc side, the correlation is also very good, where the data of Cl–H-∗-π(C20H10) (cc) and Br–H-∗-π(C20H10) (cc) are neglected. The results come from the very complex interaction style on the cc side, where only one BP connects the components of the adducts for F–H-∗-π(C20H10) and F–X-∗-π(C20H10) (X = Cl, Br, and I), whereas the components of the adducts are connected by the multi-BPs for others.
The trends in θ and θp are summarized in Equations (6)–(13). The θ value of X–H-∗-π(C20H10) on the cv side seems smaller than the corresponding values on the cc side except for F–H-∗-π(C20H10). The θ value on the cv side becomes larger in the order shown in Equation (6). The order on the cc side shown in Equation (7) seems very similar to that on the cv side. In the case of Y–X-∗-π(C20H10), the θ value on the cv side is larger than the corresponding value on the cc side, except for F–F-∗-π(C20H10), as shown in Equations (8) and (9). The θ value of Y–X-∗-π(C20H10) on both the cv and cc sides becomes larger in a similar order, as shown in Equations (8) and (9), respectively. The θ values on the cc side seem much smaller than the corresponding values on the cv side except for F–F-∗-π(C20H10). The bend structure of Y–X-∗-π(C20H10) (Cs: IIACora:cc) must be responsible for the much smaller θ values on the cc side. The θp values for X–H-∗-π(C20H10) and Y–X-∗-π(C20H10) show the same trends as those in the θ values.
Order in θ of X–H-∗-π(C20H10) on the cv side:
F–H- (θ = 74.7°: IA) ≈ Cl–H- (74.9°: IB) < Br–H- (76.7°: IB) < I–H- (77.5°: IB)
Order in θ of X–H-∗-π(C20H10) on the cc side:
F–H- (θ = 72.0°: IA) < Cl–H- (76.9°: IIA) < Br–H- (78.2°: IIA) < I–H- (78.9°: IIA)
Order in θ of Y–X-∗-π(C20H10) on the cv side:
F–F- (θ = 74.7°: IA) < Cl–Cl- (86.4°: IA) < Br–Br- (95.0°: IA) < F–Cl- (96.9°: IA) < I–I- (100.3°: IA) < F–Br- (109.3°: IA) < F–I- (119.2°: IA)
Order in θ of Y–X-∗-π(C20H10) on the cc side:
Cl–Cl- (θ = 72.8°: IIA) < Br–Br- (75.4°: IIB) ≈ F–F- (76.3°: IIA) < F–Cl- (75.6°: IA) < F–Br- (76.9°: IA) < I–I- (78.7°: IIB) < F–I- (81.1°: IA)
Order in θp of X–H-∗-π(C20H10) with NIV on the cv side:
Cl–H- (θp = 88.5°: IB) < I–H- (95.9°: IB) ≈ Br–H- (96.2°: IB) < F–H- (111.4°: IA)
Order in θp of X–H-∗-π(C20H10) with NIV on the cc side:
I–H- (θp = 92.2°: IIA) < F–H- (100.2°: IA) < Cl–H- (125.4°: IIA) < Br–H- (137.7°: IIA)
Order in θp of Y–X-∗-π(C20H10) with NIV on the cv side:
F–F- (θp = 81.8°: IA) < Cl–Cl- (120.6°: IA) < Br–Br- (139.3°: IA) < F–Cl- (141.8°: IA) < I–I- (145.7°: IA) < F–Br- (157.7°: IA) < F–I- (164.1°: IA)
Order in θp of Y–X-∗-π(C20H10) with NIV on the cc side:
Cl–Cl- (84.5°: IIA) < Br–Br- (88.5°: IIB) < F–F- (θp = 89.3°: IIA) < F–Cl- (93.8°: IA) < I–I- (94.1°: IIB) < F–Br- (97.1°: IA) < F–I- (107.7°: IA)
Order in θp of X–H-∗-π(C20H10) with CIV on the cc side:
I–H- (θp = 93.5°: IIA) < F–H- (95.9°: IA) < Cl–H- (108.6°: IIA) < Br–H- (117.2°: IIA)
Order in θp of Y–X-∗-π(C20H10) with CIV on the cv side:
F–F- (θp = 81.9°: IA) < Cl–Cl- (122.2°: IA) < Br–Br- (141.4°: IA) < F–Cl- (143.2°: IA) < I–I- (147.9°: IA) < F–Br- (159.2°: IA) < F–I- (165.0°: IA)
Order in θp of Y–X-∗-π(C20H10) with CIV on the cc side:
F–F- (θp = 84.6°: IIA) < Br–Br- (86.3°: IIB) < I–I- (91.2°: IIB) < F–Cl- (95.0°: IA) < F–Br- (99.9°: IA) < F–I- (109.2°: IIB)
The θp values with NIV are discussed first, then those with CIV, since data with CIV are lacking in some cases. The θp values of X–H-∗-π(C20H10) on both the cv and cc sides seem to increase normally except for F–H-∗-π(C20H10) on the cv side and I–H-∗-π(C20H10) on the cc side, as shown in Equations (10), (11), and (14), respectively. The values on the cc side seem larger than those on the cv side, as a whole. The bend IIA structures on the cc side versus the IB structures on the cv side for X–H-∗-π(C20H10) (X = Cl, Br, and I) must be responsible for the trend in θp. The differences in the electronic structures around the cv and cc sides also contribute to the results.
The trends in θp with CIV are shown in Equations (12), (13), (15), and (16); the order in θp of Y–X-∗-π(C20H10) on the cc side seems similar to that on the cv side. However, the magnitudes of θp on the cv side are much larger than those on the cc side except for F–F-∗-π(C20H10). The bend structures on the cc sides are mainly responsible for the results.
The nature of the H-∗-π and X-∗-π interactions is discussed next. In QTAIM-DFA, the θ values classify the interactions in question, while the θp values characterize them. The θ values of 45° < θ < 180° (Hb(rc) − Vb(rc)/2 > 0) correspond to the closed shell (CS) interactions, which are subdivided into the pure CS (p-CS) interactions of 45° < θ < 90° (Hb(rc) > 0) and the regular CS (r-CS) interactions of 90° < θ < 180° (Hb(rc) < 0). All interactions in Table 1 are classified by the p-CS and r-CS interactions since 68.8° < θ < 119.2°. In the p-CS region, the character of interactions is the vdW type for 45° < θp < 90° and the typical hydrogen bond type with no covalency (t-HBnc) for 90° < θp < 125°, where θp = 125° is tentatively given, corresponding to θ = 90°. The characteristics of the r-CS interactions are similarly defined. As a result, the (θ, θp) values of (75°, 90°), (90°, 125°), (115°, 150°), and (150°, 180°) can be considered to be the borderlines between the nature of interactions for vdW/t-HBnc, t-HBnc/t-HBwc, t-HBwc/CT-MC, and CT-MC/CT-TBP, respectively, where t-HBwc, CT-MC, and CT-TBP represent t-HB with covalency, molecular complex formation through CT, and trigonal bipyramidal (TBP) adduct formation through CT, respectively. The parameters given in bold are superior to those in plain in the classification and characterization of interactions. The (θ, θp) values in Table 1 are larger than (72°, 89°) and less than (119°, 165°) for all H-∗-π and X-∗-π interactions. Therefore, the interactions will have the nature of p-CS/vdW, p-CS/t-HBnc, r-CS/t-HBwc, or r-CS/CT-MC.
The nature of the main interactions is discussed first. The θp values calculated with NIV are employed here. As shown in Table 1, the (θ, θp) values for F–H-∗-π(C20H10) (C1: IACora:cv) are (74.7°, 111.4°); therefore, the interaction is predicted to have the t-HBnc nature that appeared in the p-CS region, which is denoted by p-CS/t-HBnc. Both the θ and θp values are less than 90° for Cl–H-∗-π(C20H10) (C1: IBCora:cv), F–F-∗-π(C20H10) (Cs: IACora:cv), and X–X-∗-π(C20H10) (Cs: IIACora:cc: X = F and Cl; Cs: IIBCora:cc: X = Br). Therefore, the interactions are predicted to have a p-CS/vdW nature. The (θ, θp:NIV) values are (86.4°, 120.6°) for Cl–Cl-∗-π(C20H10) (Cs: IACora:cv), (74.7–77.5°, 95.9–111.4°) for X–H-∗-π(C20H10) (C1: IACora:cv: X = F; IBCora:cv: X = Br and I), and (72.0–81.1°, 92.2–137.7°) for X–H-∗-π(C20H10) (C1: IACora:cc: X = F; IIACora:cc: X = Cl, Br, and I), I–I-∗-π(C20H10) (Cs: IIBCora:cc), and F–X-∗-π(C20H10) (Cs: IACora:cc: X = Cl, Br, and I). Consequently, the interactions are predicted to have a p-CS/t-HBnc nature. The Cl-∗-π interaction in Cl–Cl-∗-π(C20H10) (type IACora:cv) seems close to the borderline area between p-CS and r-CS since θ = 86.4°, which is close to 90°. On the other hand, the (θ, θp) values are (95.0–100.3°, 139.3–145.7°) for X–X-∗-π(C20H10) (Cs: IACora:cv: X = Br and I) and F–Cl-∗-π(C20H10) (Cs: IACora:cv). As a result, the interactions are predicted to have a r-CS/t-HBwc nature. The (θ, θp) values are (109.3–119.2°, 157.7–164.1°) for F–X-∗-π(C20H10) (Cs: IACora:cv: X = Br and I). Therefore, the interactions are predicted to have a r-CS/CT-MC nature. Table 1 summarizes the predicted nature.
As shown in Table 1, the predicted nature of the interactions in question with CIV is the same as the corresponding one with NIV, where the differences in θp between those with NIV and CIV are (very) small (0.1° ≤ Δθp (= θp:NIVθp:CIV) ≤ 4.7°) except for F–H-∗-π(C20H10) (C1: IACora:cv), Cl–H-∗-π(C20H10) (Cs: IIACora:cc), and Br–H-∗-π(C20H10) (C1: IIACora:cc). The Δθp values for the three adducts are 12.2°, –16.8°, and –20,5°, respectively. The normal coordinates of the (best-fitted) internal vibrations would not be located on the interactions in question, which would be responsible for the large differences. The large differences in θp are fortunately burred in the larger θp ranges of the interactions in F–H-∗-π(C20H10) (C1: IACora:cv), Cl–H-∗-π(C20H10) (Cs: IIACora:cc), and Br–H-∗-π(C20H10) (C1: IIACora:cc). However, the magnitudes of Δθp for the three adducts seem much larger than those expected. CIV cannot be applied for the interactions in which BPs start from BCP on C=C of π(C20H10). There must be other factors for the large magnitudes. Further investigations would be necessary for the detailed discussion on the large magnitudes of Δθp. Therefore, we will not discuss the differences further here.

3.5. Factors to Control Structures of B–A-∗-π(C20H10) (B–A = X–H, X–X, and F–X)

The molecular graphs for B–A-∗-π(C20H10) (B–A = X–H, X–X, and F–X), shown in Figure 2 and Figure 3, seem very different from those for B–A-∗-π(C24H12) (B–A = X–H, X–X, and F–X) [21], especially the role of the outside ring in the formation of the adducts. What factor controls the observed differences between the coronene and corannulene adducts? The factors were examined first based on the charge distributions in corannulene and coronene calculated with NPA, of which Qn values are shown in Scheme 1. In fact, HX and XY are located near the central 5-membered ring when complexed with corannulene (Figure 2 and Figure 3). Additionally, the formation of bidentate to pentadentate coordination complexes of HX and XY with corannulene on the concave side indicates that these interactions are attractive interactions. The calculated values seem consistent with the observed results, although the relation to the reactivity is complex.
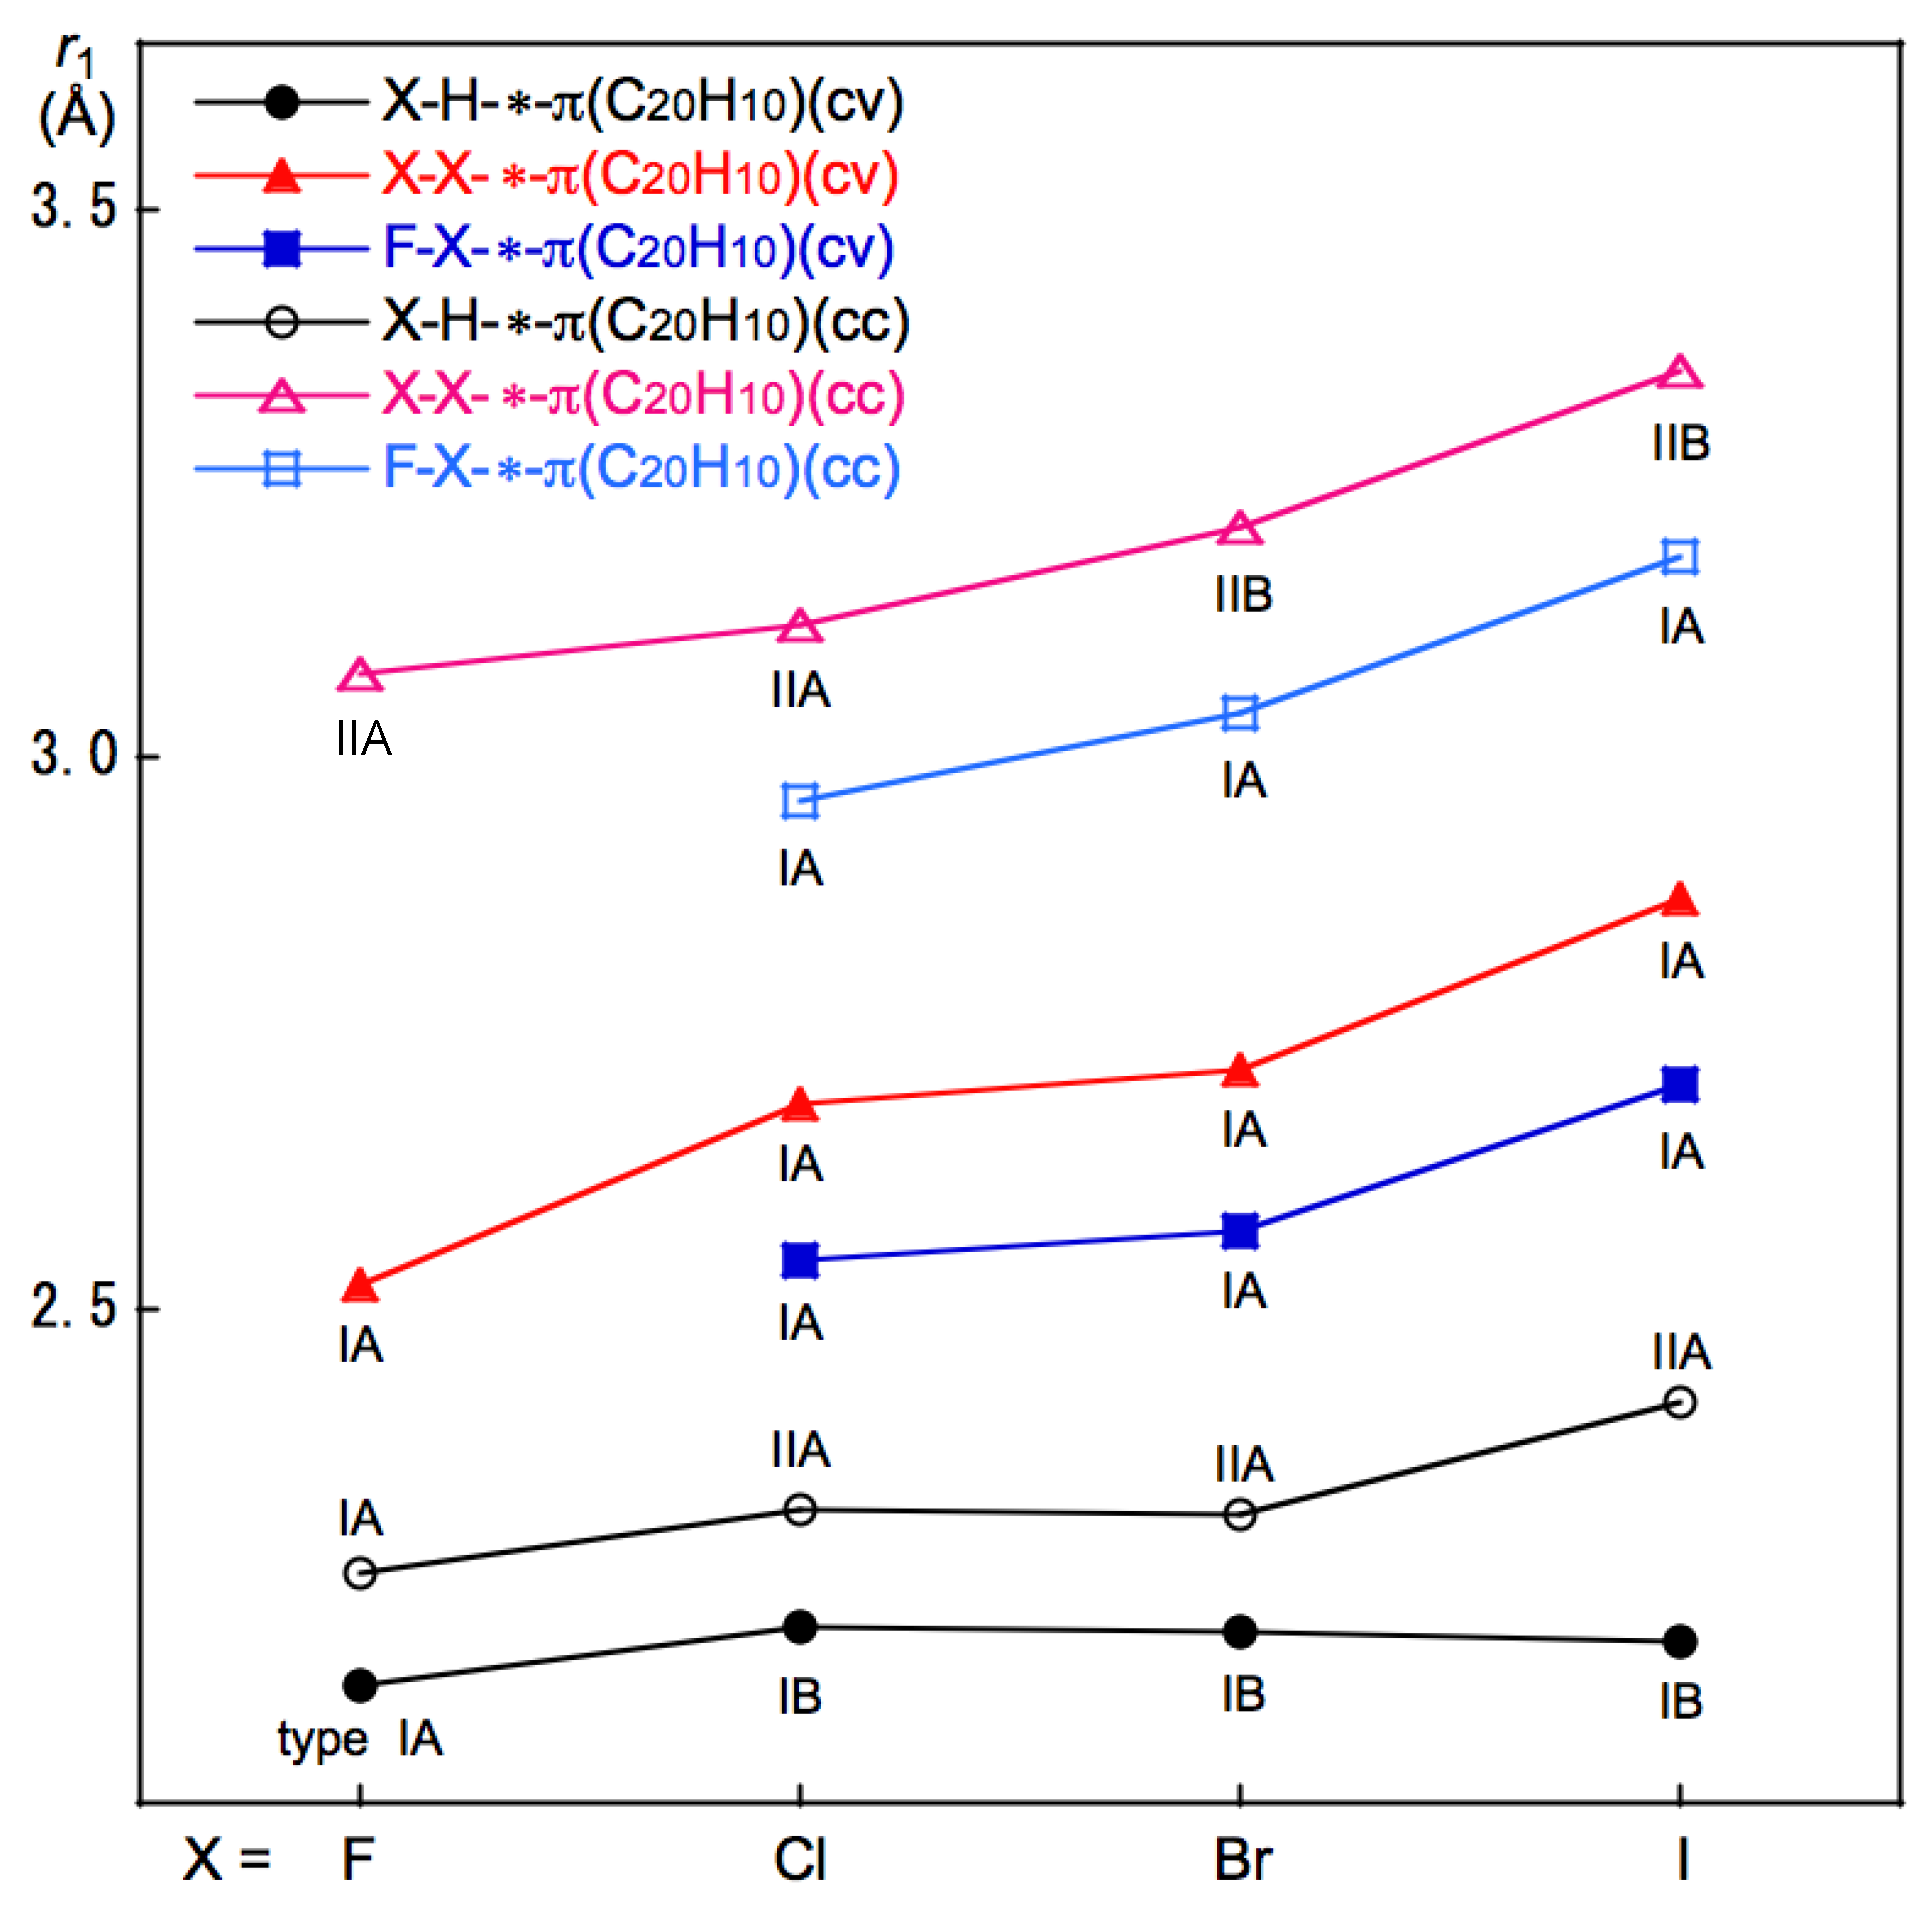
How are the r1 values of B–A-∗-π(C20H10) (B–A = X–H, X–X, and F–X)? The r1 values are plotted versus X = F, Cl, Br, and I, separately by X–H, X–X, and F–X and the cv and cc sides (totally six cases). Figure 6 illustrates the plot, which shows the clear trend in r1 of B–A-∗-π(C20H10). The order in r1 is summarized in Equation (17), where the r1 values of the same X are compared. Next, the trends in r1 are individually discussed.
Order in r1 of B–A-∗-π(C20H10):
B–A- (cv or cc) = X–H- (cv) < X–H- (cc) < F–X- (cv) < X–X- (cv) < F–X- (cc) < X–X- (cc)
The r1 values on the cc side (r1(cc)) are (very) close to r1(cv) (r1(cv) ≈ r1(cc)) for X–H-∗-π(C20H10) if r1 of the same X are compared. On the other hand, r1(cc) is (much) larger than r1(cv) (r1(cv) ≪ r1(cc)) for X–X-∗-π(C20H10) and F–X-∗-π(C20H10) (X = F, Cl, Br, and/or I). The structures of X–X-∗-π(C20H10) (X = Cl, Br, and I) are the IIBCora:cc type on the cc side, whereas they are the IBCora:cc type on the cv side. The difference in the structures must be the reason for r1 (cv) ≪ r1 (cc) in X–X-∗-π(C20H10). In the case of F–X-∗-π(C20H10) (X = Cl, Br, and I), the structures are the IACora type on both the cc and cv sides. Therefore, the difference in the steric repulsion between the cc and cv sides is the reason for the calculated results. The steric repulsion on the concave side of the corannulene may not be as large. However, when HX or XY approaches corannulene from the concave side, it is easy to predict that the steric interaction will be large.
The r1 values of F–X-∗-π(C20H10) are smaller than those of X–X-∗-π(C20H10) on the cv side; if r1 of the same X is compared, so is the cc side. The accepting ability of F–X should be larger than that of X–X, which results in r1(F–X-∗-π(C20H10)) < r1(X–X-∗-π(C20H10)). The X dependence in r1 can be discussed by the data in Figure 6. The r1 values of X–H-∗-π(C20H10) on the cv side seem almost constant of X–H- = F–H- < Cl–H- ≈ Br–H- ≈ I–H-, whereas the values on the cc side become larger (gradually) in the order of X–H- = F–H- < Cl–H- ≈ Br–H- < I–H-. The positive charge developed on H in X–H seems to mainly control the r1 values on the cv side, where Qn(H) = 0.568, 0.331, 0.218, and 0.098 for F–H, Cl–H, Br–H, and I–H, respectively, if evaluated with the NPA under the M06-2X/BSS-A//MP2/BSS-A. The r1 values become larger in the order of X = F < Cl < Br < I for both sides of cv and cc in X–X-∗-π(C20H10) and F–X-∗-π(C20H10). The atomic sizes of X must be an important factor for the X dependence on r1, where the size should be proportional to the number of electrons on X in X–X and F–X. The atomic sizes can be approximated by the vdW radii of atoms, which are 2.40, 2.94, 3.50, 3.70, and 3.96 Å for H, F, Cl, Br, and I, respectively.
In the corannulene adducts with HX of the convex side, the H-∗-π(C20H10) distances of XH-∗-π(C20H10) are HF < HCl < HBr < HI, where HX acts as the monodentate. However, this order is inversely related to the acidity of XH. The size of the halogen may be one of the reasons. The overall trend for the concave and convex sides is the same. However, it is likely on the concave side that a portion of each interaction force will be consumed by the atom on the opposite side by taking bidentate to pentadentate configuration, relative to the convex side. This is because the interaction force of the atoms on the opposite side would be weakened by the bidentate to pentadentate coordination. This means that the distance between atoms on the concave side is longer than that on the convex side.
The electron–electron repulsive factor between π(C20H10) and Y–X (Y = X and F) in Y–X-∗-π(C20H10) is also expected to play an important role in r1. The repulsion could be larger on the cc side than on the cv side in the bowl-shaped π(C20H10), resulting in the relative values of r1(cv) ≪ r1(cc). The electron density ρ(r) must be more widely extended on the cv side relative to the case of the cc side, as expected. The higher negative area on the cv side of π(C20H10) corresponds to the larger distribution of ρ(r) relative to the case of the cc side. The results shown in Figure 6 can be well understood based on the EPS shown in Figure 1, where r1 decreases as the CT interaction of the π(C20H10)→σ*(X–Y: X = X or F) type increases.

3.6. Meaning of the QTAIM-DFA Parameters and the Related Values

What is the meaning of the QTAIM-DFA parameters of (R, θ) and (θp, κp) for the adducts collected in Table 1? However, it seems often difficult to compare the values with those derived from other methods, since the QTAIM approach (and QTAIM-DFA) are analyzed using the values at BCP on BP, whereas analyzed values from other methods seem (very) different from the case of QTAIM-DFA. The charge of an atom (A) in a molecule calculated based on the QTAIM approach (QTAIM(A)) is intrinsically very different from that with NPA (Qn(A)), for instance [38]. Nevertheless, the meaning of the QTAIM-DFA parameters is clarified by comparing other physical parameters.
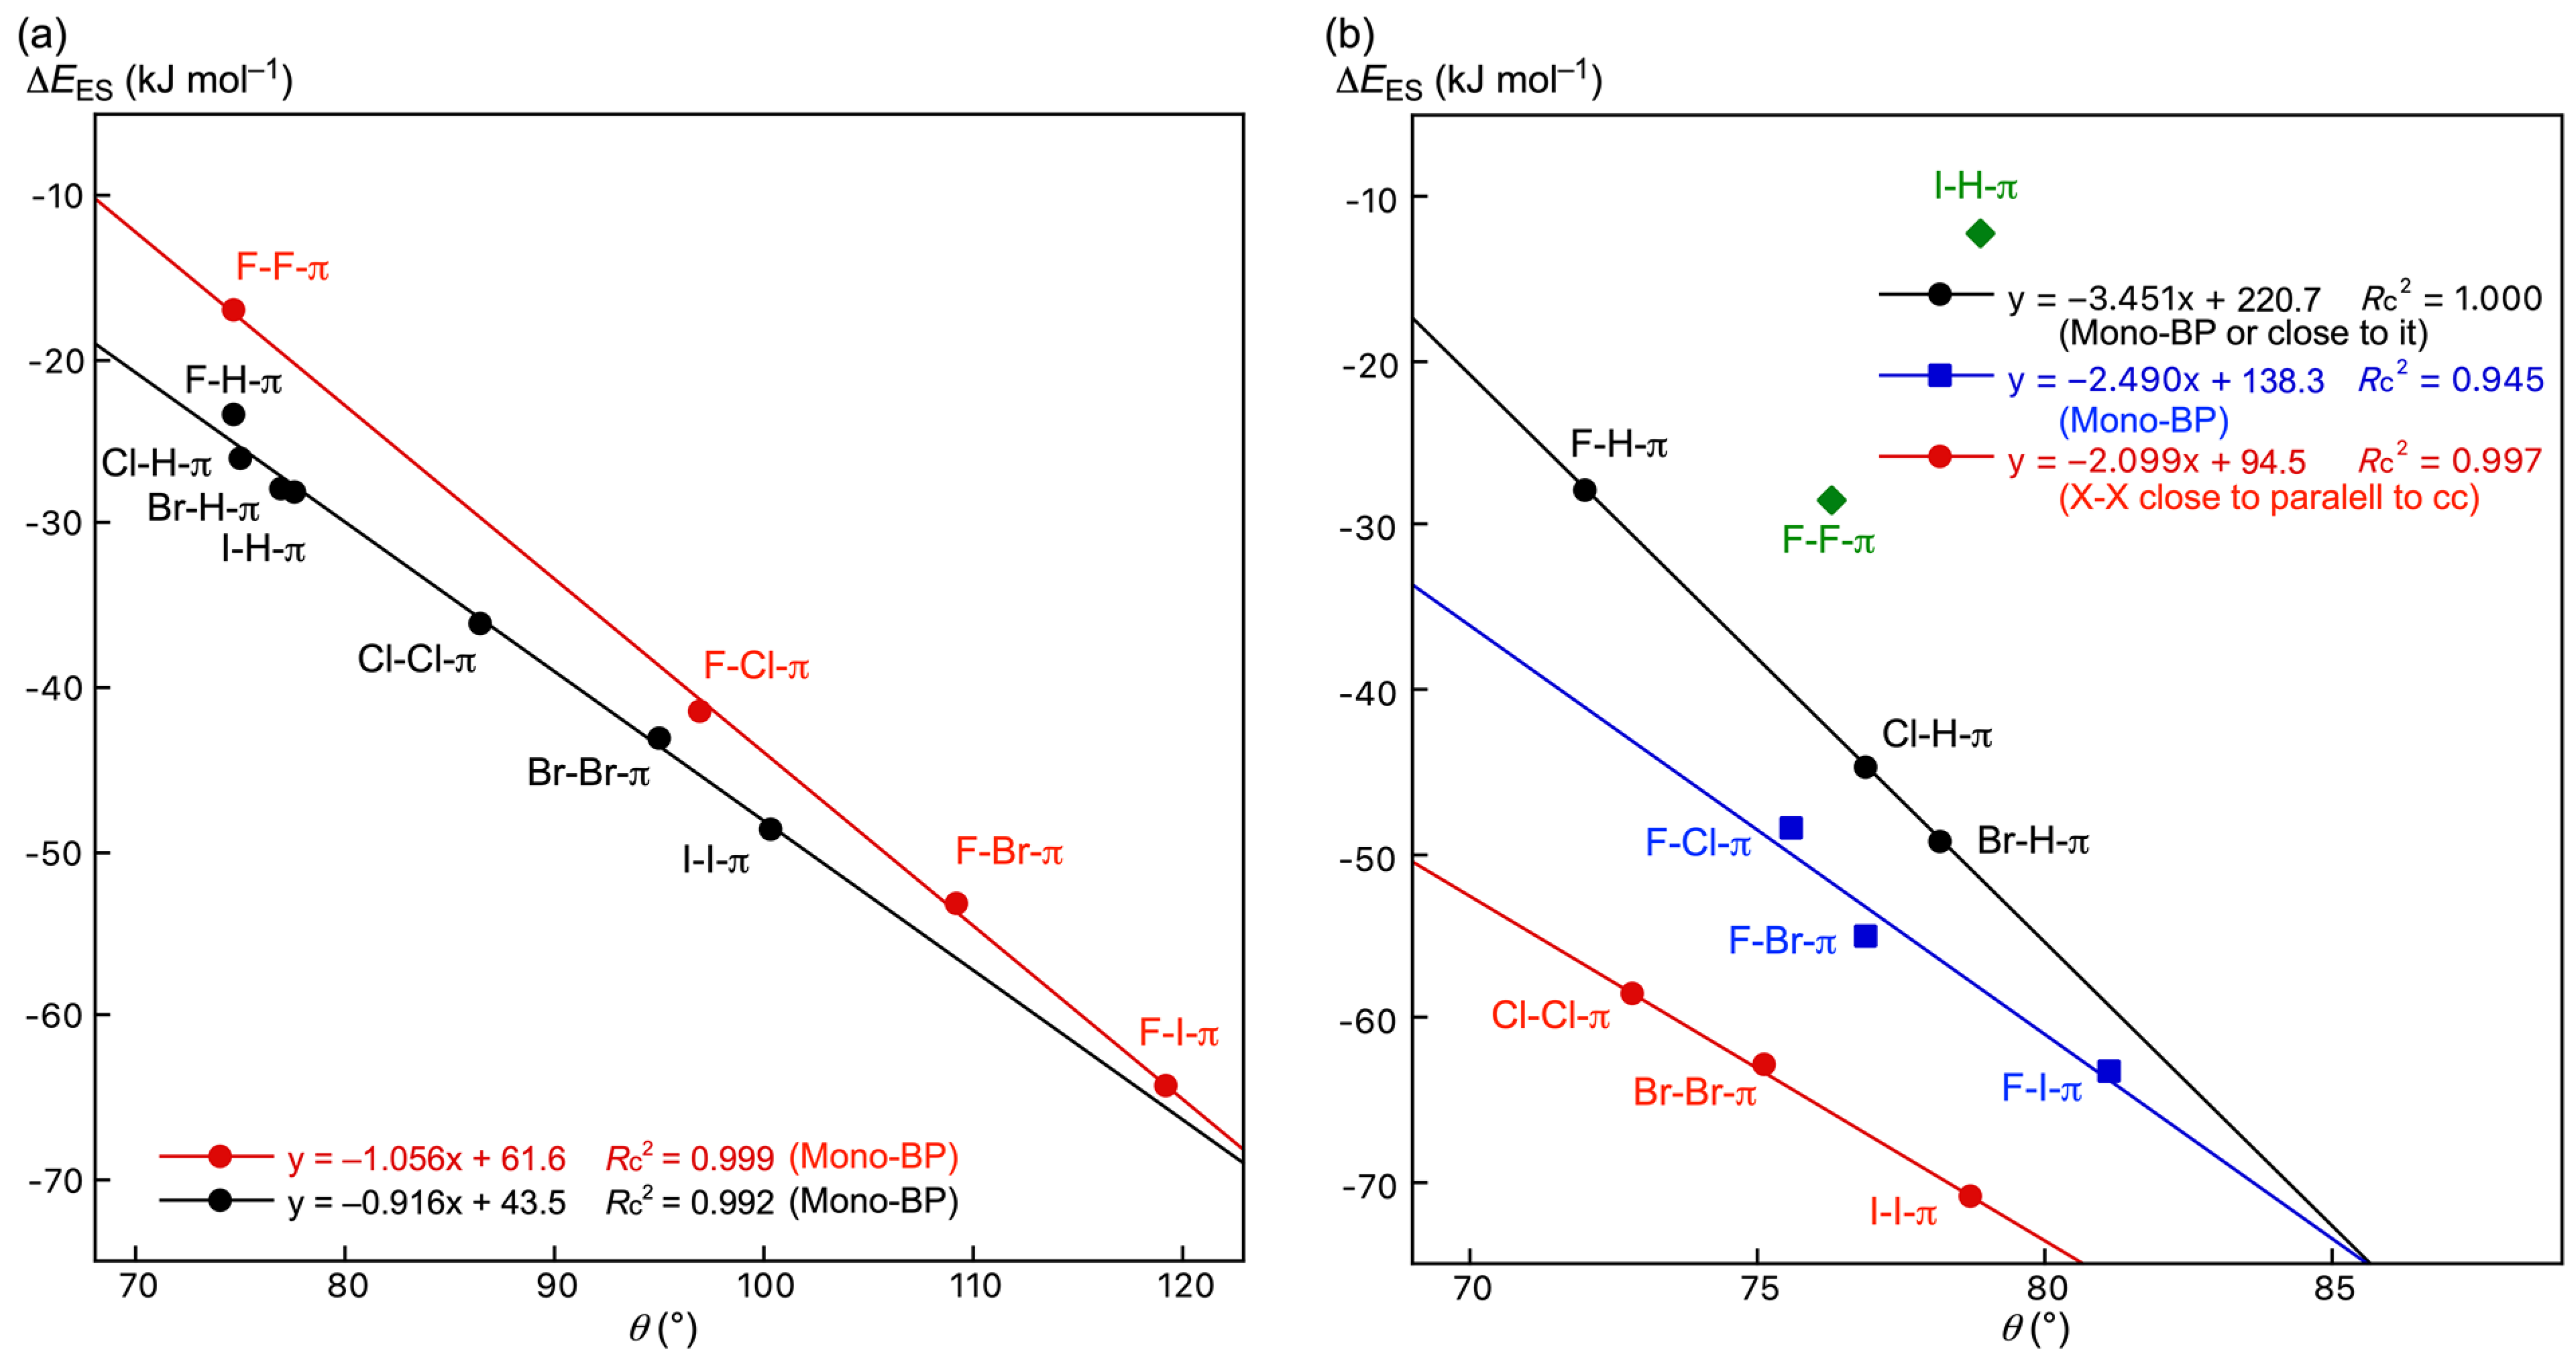
First of all, ΔE are plotted versus θ, separately by the cv and cc sides (see Table 1). Figure 7 shows the plots. The plots give (very) good correlations, which are shown in the figure. The plots for the cv side are shown by Figure 7a, which are analyzed as the two correlations. The first correlation consists of X–H-∗-π(C20H10) (X = F, Cl, Br, and I) and X–X-∗-π(C20H10) (X = Cl, Br, and I) (y = –0.916x + 43.5; Rc2 = 0.992) and the second one of F–X-∗-π(C20H10) (X = F, Cl, Br, and I) (y = –1.056x + 61.6; Rc2 = 0.999). The correlations are close with each other; therefore, they could be recognized as a correlation, where the components in all adducts are connected by only one BP for each. In the case of the cc side (Figure 7b), the plots were analyzed as the four groups. The first group consists of X–X-∗-π(C20H10) (X = Cl, Br, and I) (y = –2.099x + 94.5; Rc2 = 0.997), while X–H-∗-π(C20H10) (X = F, Cl, and Br) forms the second group (y = –3.451x + 220.7; Rc2 = 1.000). The third group contains F–X-∗-π(C20H10) (X = Cl, Br, and I) (y = –2.490x + 138.3; Rc2 = 0.945), while data for I–H-∗-π(C20H10) and F–F-∗-π(C20H10) deviate from the above correlations. The X–X bonds in the first group seem close to parallel to the averaged molecular plane of C20H10. In the case of F–H-∗-π(C20H10) in the second group, F–H and π(C20H10) are connected by only one BP in the adduct. Indeed, the components of X–H-∗-π(C20H10) (X = Cl and Br) are connected by three BPs, but the structures seem close with each other. The components of F–X-∗-π(C20H10) (X = Cl, Br, and I) are connected through only one BP; therefore, the structures are very close with each other.
The θ values are shown to well correlate to the ΔE values, if the data are appropriately analyzed separately by the structures. The results may show that θ appears proportional to ΔE in the weak CS interaction region of vdW, t-HB, and CT-MC. However, the θ values of the main interactions are employed for the plots.
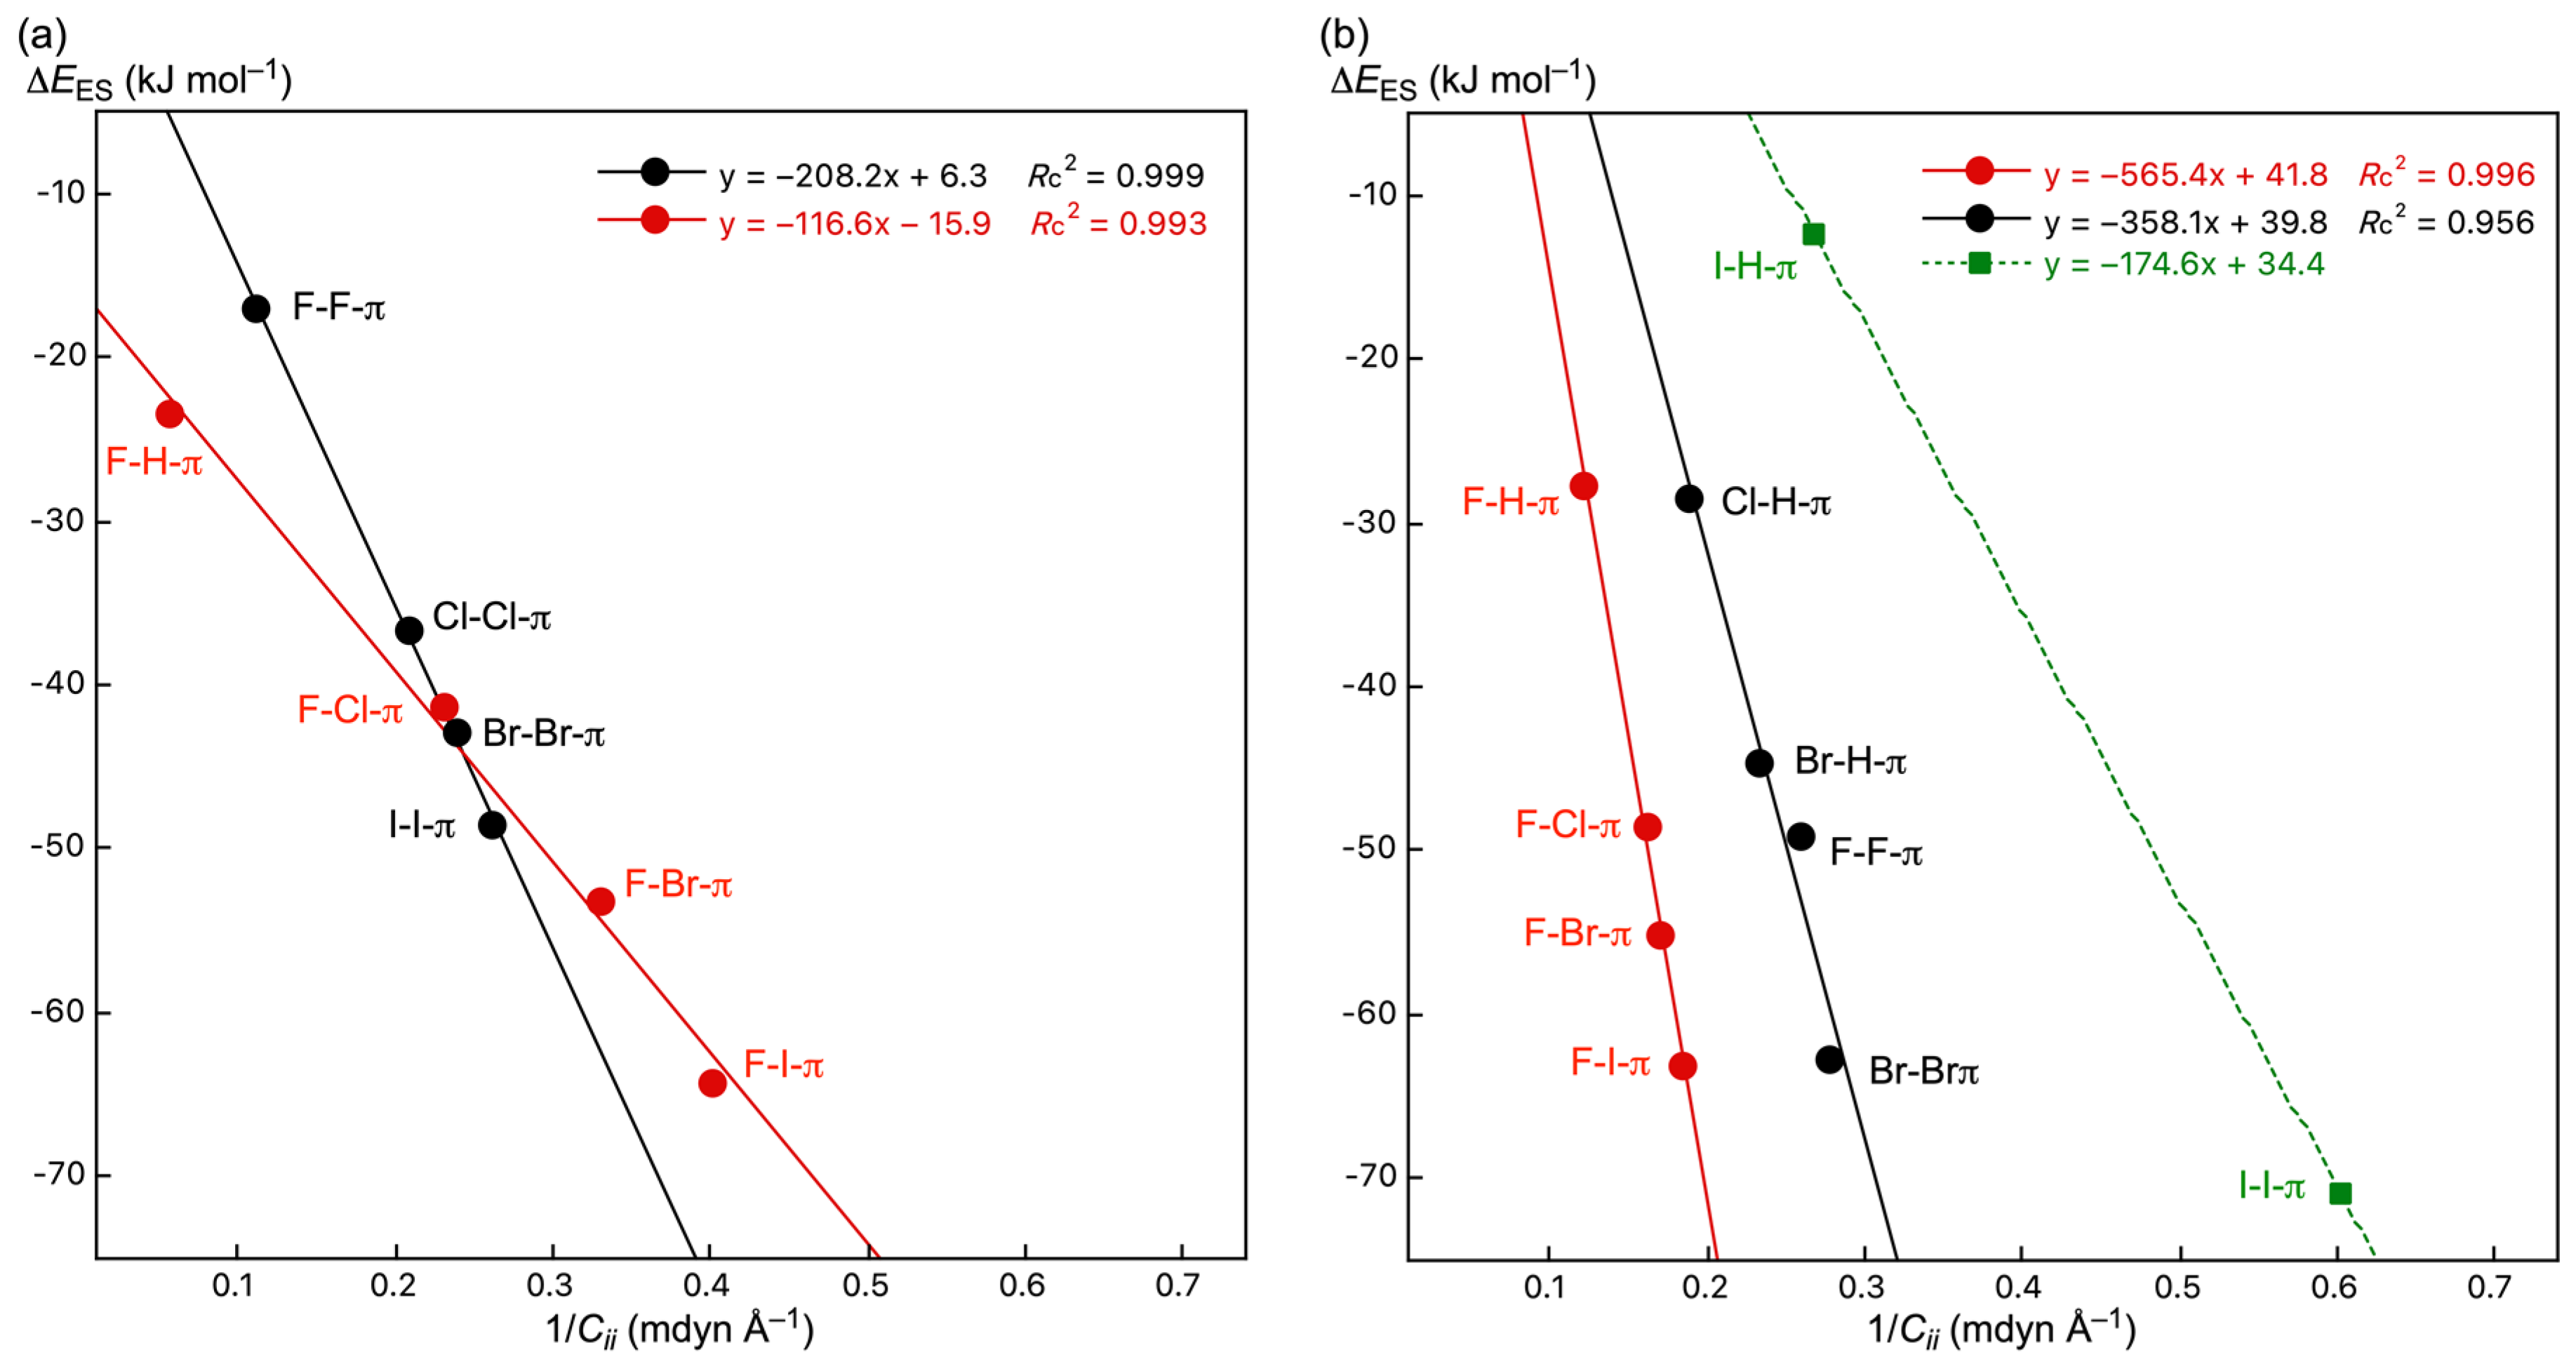
It is necessary to search for such a parameter that covers all interactions for those multi-BPs that connect the components. We examined the Cii–1 values for the purpose, since the total values of Cii–1 could be calculated according to Equation (18).
Cii–1total = Σk Cii–1k
The ΔE values of the adducts are plotted versus Cii–1 or Cii–1total for the adducts. Figure 8 shows the plot, which is analyzed separately by the cv and cc adducts. Figure 8a,b show the plots for the cv and cc adducts, respectively. The plots for the cv side were analyzed as two correlations, similarly to the case of Figure 7a. Data from X–X-∗-π(C20H10) (X = F, Cl, Br, and I) form the first correlation (y = –208.2x + 6.3; Rc2 = 0.999), while the second correlation y = –116.6x−15.9; Rc2 = 0.993) consists of those from F–X-∗-π(C20H10) (X = Cl, Br, and I) and F–H-∗-π(C20H10). In the case of the cc side, the plots were analyzed as three groups. The first group consists of the data from X–H-∗-π(C20H10) (X = Cl and Br) and X–X-∗-π(C20H10) (X = F and Br) (y = –358.1x + 39.8; Rc2 = 0.956) and those from F–X-∗-π(C20H10) (X = Cl, Br, and I) and F–H-∗-π(C20H10) form the second one (y = –565.4x + 41.8; Rc2 = 0.996), whereas those from I–H-∗-π(C20H10) and I–I-∗-π(C20H10) seem to deviate from the correlations. The I atom may interact uniquely with the cc side of π(C20H10). The strength of the interaction would extend over the range of the correlation line, perhaps due to its softness and the (very) large size.
The Cii–1 or Cii–1total values are demonstrated to correlate well with the ΔE values, if the data are appropriately analyzed separately by the structures, again. The results show that the Cii–1 or Cii–1total values are proportional to the ΔE values, as expected [19]. The plots in Figure 7a seem very close to those of Figure 8a, as a whole. The results may show that the θ values can be recognized as a parameter for ΔE, if only one BP connects the components of the cv adducts in the weak CS interaction region of vdW, t-HB, and CT-MC. In the case of the cc side, the plots in Figure 7b seem very different from those in Figure 8b, in the numbers of the plots and the members for the groups. The results must be the reflection of the different physical meanings between θ and Cii–1 (Cii–1total). Of course, the contributions from the weaker BPs are considered in Cii–1total but only the strongest one is in θ, which must also be a very important factor to explain the differences in the plots between Figure 7b and Figure 8a.

3.7. Differences in the Nature of B–A-∗-π (B–A = X–H and F–X) among π of π(C20H10), π(C24H12) and π(C6H6)

The ID structures defined in Scheme 2 are optimized assuming the C5v symmetry for the π(C20H10) adducts, the C6v symmetry for the π(C24H12), and the C2v symmetry for the π(C6H6) adducts. (The optimizations did not converge well under the C6v symmetry for the π(C6H6) adducts.) The structural parameters are collected in Table S6 of the Supplementary Materials. The QTAIM functions and the similarly calculated QTAIM-DFA parameters are collected in Tables S7–S10 of the Supplementary Materials. The values of ΔEES for X–H-∗-π and F–X-∗-π adducts with π(C20H10), π(C24H12), and π(C6H6) are also collected in Table S11 of the Supplementary Materials. Table 2 shows the θ and θp values for the X–H-∗-π and F–X-∗-π interactions together with the Δθ and Δθp values. The Δθ and Δθp values are given from those of the π(C6H6) adducts. They are defined as Δθ = (θ for the π(C20H10) or π(C24H12) adducts) − (θ for the π(C6H6) adducts) and Δθp = (θp for the π(C20H10) or π(C24H12) adducts) − (θp for the π(C6H6) adducts).
The trends in θ and θp are discussed, employing the Δθ and Δθp values. Equations (19)–(22) summarize the trends in Δθ and Δθp, where the values for the F–H and F–F adducts are omitted, since the trends of the values seem very different from others in some cases.
Order for Δθ in X–H-∗-π:
π(C20H10: cv) (–0.7° ≤ Δθ ≤ 0.1°) ≤ π(C24H12) (–0.2° ≤ Δθ ≤ 0.2°) < π(C6H6) (Δθ = 0.0°) < π(C20H10: cc) (2.6°≤ Δθ ≤ 4.3°)
Order for Δθ in F–X-∗-π:
π(C6H6) (Δθ = 0.0°) < π(C24H12) (0.7° ≤ Δθ ≤ 2.1°) ≤ π(C20H10: cv) (1.2° ≤ Δθ ≤ 3.5°) < π(C20H10: cc) (4.7° ≤ Δθ ≤ 5.5°)
Order for Δθp in X–H-∗-π:
π(C6H6) (Δθp = 0.0°) < π(C24H12) (1.6° ≤ Δθp ≤ 3.5°) ≤ π(C20H10: cv) (2.3° ≤ Δθp ≤ 3.6°) < π(C20H10: cc) (12.7° ≤ Δθp ≤ 14.0°)
Order for Δθp in F–X-∗-π:
π(C6H6) (Δθp = 0.0°) < π(C24H12) (3.6° ≤ Δθp ≤ 7.6°) < π(C20H10: cv) (5.4° ≤ Δθp ≤ 11.6°) < π(C20H10: cc) (11.6° ≤ Δθp ≤ 15.4°)
Equation (19) shows the order for Δθ in X–H-∗-π. The order seems reasonable. However, the position of π(C6H6) should be considered, of which the order would be expected to appear between π(C20H10: cc) and π(C24H12). The order for Δθ in F–X-∗-π is given in Equation (20). The order seems curious at first glance. However, the order can be understood if the order is explained separately by the partial order of π(C6H6) < π(C24H12) < π(C20H10: cv) and < π(C20H10: cc).
Equation (21) shows the order for Δθp in X–H-∗-π. The order seems close to that for Δθ in F–X-∗-π shown in Equation (20); therefore, the order can be explained as discussed for the trend in Equation (20). The order for Δθp in F–X-∗-π is given in Equation (22). The order is very close to those in Equations (20) and (21), again. Therefore, the order is well understood by the partial order of π(C6H6) < π(C24H12) < π(C20H10: cc) < π(C20H10: cv), again.
The magnitudes of Δθp in Equation (22) seem larger than those in Equation (21), as a whole, and the magnitudes of Δθp in Equations (21) and (22) seem larger than the magnitudes of Δθ in Equation (20). The dynamic nature of X–H-∗-π and F–X-∗-π in the adducts with π(C20H10) on both the cv and cc sides would be (very) flexible by the structural changes.
The trends in the behavior of Δθ and Δθp show that the process for the formation of the adducts is much more complex than expected based on the electronic structures of π(C6H6), π(C24H12), π(C20H10: cv), and π(C20H10: cc), which were simply imaged. The magnitudes of Δθ and Δθp for the F–H and F–F adducts with π(C20H10) and π(C24H12), from those with π(C6H6), seem much smaller than those for the other adducts. The results may show that the nature of the interactions in question would not be affected so much for the F–H and F–F adducts relative to the case of other adducts.

4. Conclusions

What is the nature of the XH-∗-π and YX-∗-π interactions in a distorted π-system? The nature of such interactions is elucidated, exemplified by the corannulene π-system (π(C20H10)) with QTAIM-DFA, where the π(C20H10) orbitals extend wider over the cv side but narrower on the cc side. In the optimized structures of XH-∗-π(C20H10) and YX-∗-π(C20H10) (X = F, Cl, Br, and I; Y = X and F) with MP2/BSS-A, only one side of the atom, H of X–H or X of Y–X, joins π(C20H10) on the cv side. However, both sides of the atoms connect to π(C20H10) on the cc side in some cases. In the case of the cv adducts, all XH-∗-π(C20H10) (ICora:cv) interactions are predicted to have the p-CS/t-HBnc nature except for FH-∗-π(C20H10), of which the nature is p-CS/vdW. For YX-∗-π(C20H10) (ICora:cv) interactions, the p-CS/vdW and p-CS/t-HBnc nature is predicted for YX = FF and ClCl, respectively, the p-CS/t-HBnc nature is predicted for YX = BrBr, II, and FCl, and the p-CS/CT-MC nature is predicted for YX = FBr and FI. For the cc adducts, the predicted nature seems more complex. Therefore, the descriptions are limited to the main interactions, which are given plainly in Table 2, to avoid complexity. All XH-∗-π(C20H10) interactions are predicted to have a p-CS/t-HBnc nature, irrespective of the (IACora:cc) structure for X = F and the (IIACora:cc) structure for X = Cl, Br, and I. While the FX-∗-π(C20H10) interactions are predicted to have the p-CS/t-HBnc nature for X = Cl, Br, and I, the p-CS/vdW nature is for X = F. The optimized structures are (IACora:cc) for the former and (IIACora:cc) for the latter. In the case of the XX-∗-π(C20H10) (IICora:cc) interactions, the p-CS/vdW nature is predicted for X = Cl and Br, whereas the p-CS/t-HBnc nature is predicted for X = I. Indeed, the predicted nature of the interactions is controlled mainly by the cv and cc sides of π(C20H10) but are determined depending on the structures of the adducts. Therefore, they are more complex on the cc side. The predicted nature seems to increase in the order of X = F < Cl < Br < I for YX-∗-π(C20H10) (Y = F and X).
The differences and similarities are also clarified for the XH-∗-π and YX-∗-π interactions with the bowl-shaped π(C20H10) system and the planar π(C6H6)) and π(C24H12) systems. Indeed, the structures and the nature of the interactions seems well understood based in QTAIM-DFA, but the results show a much more complex process for the formation of the adducts than that expected based on the simply imaged electronic structures. The results will provide a useful guideline to analyze the nature of the interactions in the distorted π-systems and the adducts.

Supplementary Materials

The following are available online at https://www.mdpi.com/article/10.3390/molecules28104219/s1, Scheme S1: Classification of interactions by the signs of ∇2ρb(rc) and Hb(rc), together with Gb(rc) and Vb(rc). Scheme S2: QTAIM-DFA: Plot of Hb(rc) versus Hb(rc)–Vb(rc)/2 for Weak to Strong Interactions. Scheme S3: Rough classification and characterization of interactions by θ and θp, together with kb(rc) (= Vb(rc)/Gb(rc)). Scheme S4: Convex and concave sides of corannulene and definition of structural types of B–A⋯π(C20H10), to be clarified, where (A, B) = (H, X), (X, X), or (X, F) (X = F, Cl, Br and I) with structural parameters. Table S1: Proposed definitions for the classification and characterization of interactions by the signs Hb(rc) and Hb(rc)–Vb(rc)/2 and their first derivatives, together with the tentatively proposed definitions by the characteristic points on the plots of Hb(rc) versus Hb(rc)–Vb(rc)/2. Table S2: The structural parameters for X–H-∗-π(C20H10) and Y–X-∗-π(C20H10) (X, Y = F, Cl, Br and I), evaluated with MP2/BSS-A. Table S3: ΔEES and ΔEZP in X–H-∗-π(C20H10) and Y–X-∗-π(C20H10) (X, Y = F, Cl, Br and I), evaluated with MP2/BSS-A, together with E(2), calculated with the NBO analysis under M06-2X/BSS-A//MP2/BSS-A. Table S4: The rBP and RSL values evaluated with MP2/BSS-A for the optimized and observed structures of B–A-∗-π(C20H10), together with the ΔrBP values. Table S5: The rBP and RSL values evaluated with MP2/BSS-A for the optimized and observed structures of B–A-∗-π(C20H10), together with the ΔrBP values. Table S6: The structural parameters for the H-∗-π and X-∗-π interactions with π(C20H10), π(C24H12), and π(C6H6), (X = F, Cl, Br and I), evaluated with MP2/BSS-A, together with the values from the corresponding ones of the adducts with π(C6H6), respectively. Table S7: QTAIM functions and QTAIM-DFA parameters for X–H-∗-π(C20H10) and Y–X-∗-π(C20H10) (X, Y = F, Cl, Br, and I) on concave side, evaluated with MP2/BSS-A. Table S8: Cii and ΔE for X–H-∗-π(C20H10) and Y–X-∗-π(C20H10) (X, Y = F, Cl, Br, and I), evaluated with MP2/BSS-A,a employing the perturbed structures generated with CIV. Table S9: QTAIM functions and QTAIM-DFA parameters for X–H-∗-π(C20H10) and Y–X-∗-π(C20H10) (X, Y = F, Cl, Br and I) (C5v), evaluated with MP2/BSS-A. Table S10: QTAIM functions and QTAIM-DFA parameters for X–H-∗-π(C24H12) and Y–X-∗-π(C24H12) (X, Y = F, Cl, Br, and I) (C6v), evaluated with MP2/BSS-A. Table S11: QTAIM functions and QTAIM-DFA parameters for X–H-∗-π(C6H6) and Y–X-∗-π(C6H6) (X, Y = F, Cl, Br and I) (C6v), evaluated with MP2/BSS-A. Table S12: ΔEES for X–H-∗-π and Y–X-∗-π adducts with π(C20H10), π(C24H12), and π(C6H6) (X, Y = F, Cl, Br and I) (type ID), evaluated with MP2/BSS-A, together with those differences ΔΔEES. Figure S1: Polar (R, θ) coordinate representation of Hb(rc) versus Hb(rc)–Vb(rc)/2, with (θp, κp) parameters. Figure S2: Plot of Hb(rc) versus w in r(1Cl-2Cl) = ro(1Cl-2Cl) + wao for 1Cl-2Cl-3Cl (a) with the magnified picture of (a) (b) and that of Hb(rc)–Vb(rc)/2 versus w (c). Figure S3: Plots of ΔEZP versus ΔEES for the optimized structures of B–A-∗-π(C20H10), evaluated with MP2/BSS-A. Figure S4: Plot of rBP (r1) versus RSL (r1) for the optimized structures of B–A-∗-π(C20H10) with MP2/BSS-A. Figure S5: Molecular graphs for X–H-∗-π(C20H10), X–X-∗-π(C20H10) and F–X-∗-π(C20H10) at cv side, evaluated with BSS-A: F–H-∗-π(C20H10) (C5v: type IDCora:cv), Cl–H-∗-π(C20H10) (C5v: type IDCora:cv), Br–H-∗-π(C20H10) (C5v: type IDCora:cv), I–H-∗-π(C20H10) (C5v: type IDCora:cv), F–F-∗-π(C20H10) (C5v: type IDCora:cv), Cl–Cl-∗-π(C20H10) (C5v: type IDCora:cv), Br–Br-∗-π(C20H10) (C5v: type IDCora:cv), I–I-∗-π(C20H10) (C5v: type IDCora:cv), F–Cl-∗-π(C20H10) (C5v: type IDCora:cv), F–Br-∗-π(C20H10) (C5v: type IDCora:cv) and F–I-∗-π(C20H10) (C5v: type IDCora:cv) Figure S6: Molecular graphs for X–H-∗-π(C20H10), X–X-∗-π(C20H10) and F–X-∗-π(C20H10) at cc side, evaluated with BSS-A: F–H-∗-π(C20H10) (C5v: type IDCora:cc), Cl–H-∗-π(C20H10) (C5v: type IDCora:cc), Br–H-∗-π(C20H10) (C5v: type IDCora:cc), I–H-∗-π(C20H10) (C5v: type IDCora:cc), F–F-∗-π(C20H10) (C5v: type IDCora:cc), Cl–Cl-∗-π(C20H10) (C5v: type IDCora:cc), Br–Br-∗-π(C20H10) (C5v: type IDCora:cc), I–I-∗-π(C20H10) (C5v: type IDCora:cc), F–Cl-∗-π(C20H10) (C5v: type IDCora:cc), F–Br-∗-π(C20H10) (C5v: type IDCora:cc and F–I-∗-π(C20H10) (C5v: type IDCora:cc). Figure S7: Plot of qP for NIV versus qP for CIV for the optimized structures of B–A-∗-π(C20H10) with MP2/BSS-A. References [56,57,58,59,60,61,62,63,64,65,66,67,68,69] are cited in the supplementary materials.

Author Contributions

S.H. formulated the project. S.H., T.K., Y.S. and W.N. optimized compounds. S.H., T.K. and Y.S. calculated the ρb(rc), Hb(rc) − Vb(rc)/2 (= (ћ2/8m)∇2ρb(rc)), and Hb(rc) values, evaluated the QTAIM-DFA parameters, and analyzed the data. S.H. and W.N. organized the data for writing and wrote the paper. All authors have read and agreed to the published version of the manuscript.

Funding

This research received no external funding.

Institutional Review Board Statement

Not applicable.

Informed Consent Statement

Not applicable.

Data Availability Statement

Data are contained within the article or the Supplementary Materials.

Acknowledgments

The computations were partially performed at the Research Centre for Computational Science, Okazaki, Japan.

Conflicts of Interest

The authors declare no conflict of interest.

Sample Availability

Not applicable.

References

  1. Jeffrey, G.A. An Introduction to Hydrogen Bonding; Oxford University Press: New York, NY, USA, 1997. [Google Scholar]
  2. Scheiner, S. Hydrogen Bonding, A Theoretical Perspective; Oxford University Press: Oxford, UK, 1997. [Google Scholar]
  3. Desiraju, G.R.; Steiner, T. The Weak Hydrogen Bond in Structural Chemistry and Biology; International Union of Crystallography Monographs on Crystallography; Oxford University Press: New York, NY, USA, 1999. [Google Scholar]
  4. Gilli, G.; Gilli, P. The Nature of the Hydrogen Bond: Outline of a Comprehensive Hydrogen Bond Theory (IUCr Monographs on Crystallography); Oxford University Press: Oxford, UK, 2009. [Google Scholar]
  5. Han, K.-L.; Zhao, G.-J. Hydrogen Bonding and Transfer in the Excited State; John Wiley & Sons Ltd.: London, UK, 2010. [Google Scholar]
  6. Meot-Ner, M. The Ionic Hydrogen Bond. Chem. Rev. 2005, 105, 213–284. [Google Scholar] [CrossRef] [PubMed]
  7. Grabowski, S.J. What Is the Covalency of Hydrogen Bonding? Chem. Rev. 2011, 111, 2597–2625. [Google Scholar] [CrossRef] [PubMed]
  8. Desiraju, G.R. Reflections on the Hydrogen Bond in Crystal Engineering. Cryst. Growth Des. 2011, 11, 896–898. [Google Scholar] [CrossRef]
  9. Mahadevi, A.S.; Sastry, G.N. Cation-p Interaction: Its Role and Relevance in Chemistry, Biology, and Material Science. Chem. Rev. 2013, 113, 2100–2138. [Google Scholar] [CrossRef] [PubMed]
  10. Gilday, L.C.; Robinson, S.W.; Barendt, T.A.; Langton, M.J.; Mullaney, B.R.; Beer, P.D. Halogen Bonding in Supramolecular Chemistry. Chem. Rev. 2015, 115, 7118–7195. [Google Scholar] [CrossRef]
  11. Hayashi, S.; Matsuiwa, K.; Kitamoto, M.; Nakanishi, W. Dynamic Behavior of Hydrogen Bonds from Pure Closed Shell to Shared Shell Interaction Regions Elucidated by AIM Dual Functional Analysis. J. Phys. Chem. A 2013, 117, 1804–1816. [Google Scholar] [CrossRef]
  12. Hayashi, S.; Nishide, T.; Nakanishi, W. Behavior of Multi-HBs in Acetic Acid Dimer and Related Species: QTAIM Dual Functional Analysis Employing Perturbed Structures Generated Using Coordinates from Compliance Force Constants. Bull. Chem. Soc. Jpn. 2019, 92, 87–96. [Google Scholar] [CrossRef]
  13. Metrangolo, P.; Resnati, G. (Eds.) Halogen Bonding: Fundamentals and Applications; Series Structure and Bonding; Springer: New York, NY, USA, 2008; Volume 126. [Google Scholar]
  14. Gierszal, K.P.; Davis, J.G.; Hands, M.D.; Wilcox, D.S.; Slipchenko, L.V.; Ben-Amotz, D. π-Hydrogen Bonding in Liquid Water. J. Phys. Chem. Lett. 2011, 2, 2930–2933. [Google Scholar] [CrossRef]
  15. Cavallo, G.; Metrangolo, P.; Milani, R.; Pilati, T.; Priimagi, A.; Resnati, G.; Terraneo, G. The Halogen Bond. Chem. Rev. 2016, 116, 2478–2601. [Google Scholar] [CrossRef]
  16. Wang, C.; Danovich, D.; Mo, Y.; Shaik, S. On The Nature of the Halogen Bond. J. Chem. Theory Comput. 2014, 10, 3726–3737. [Google Scholar] [CrossRef]
  17. Buemi, G. Intramolecular Hydrogen Bonds. Methodologies and Strategies for Their Strength Evaluation. In Hydrogen Bonding—New Insights; Challenges and Advances in Computational Chemistry and Physics; Grabowski, S.J., Ed.; Springer: New York, NY, USA, 2006. [Google Scholar]
  18. Slater, A.G.; Perdigão, L.M.A.; Beton, P.H.; Champness, N.R. Surface-Based Supramolecular Chemistry Using Hydrogen Bonds. Acc. Chem. Res. 2014, 47, 3417–3427. [Google Scholar] [CrossRef] [PubMed]
  19. Nakanishi, W.; Hayashi, S.; Nishide, T. Intrinsic dynamic and static nature of each HB in the multi-HBs between nucleobase pairs and its behavior, elucidated with QTAIM dual functional analysis and QC calculations. RSC Adv. 2020, 10, 24730–24742. [Google Scholar] [CrossRef] [PubMed]
  20. Politzer, P.; Murray, J.S.; Clark, T. Halogen bonding and other σ-hole interactions: A perspective. Phys. Chem. Chem. Phys. 2013, 15, 11178–11189. [Google Scholar] [CrossRef] [PubMed]
  21. Hayashi, S.; Sugibayashi, Y.; Nakanishi, W. Behaviour of the XH-∗-π and YX-∗- π interactions (X, Y = F, Cl, Br and I) in the coronene π-system, as elucidated by QTAIM dual functional analysis with QC calculations. RSC Adv. 2018, 8, 16349–16361. [Google Scholar] [CrossRef] [PubMed]
  22. Novák, M.; Foroutan-Nejad, C.; Marek, R.J. Modulating electron sharing in ion-π-receptors via substitution and external electric field: A route toward bond strengthening. Chem. Theory Comput. 2016, 12, 3788–3795. [Google Scholar] [CrossRef]
  23. Hayashi, S.; Sugibayashi, Y.; Nakanishi, W. Dynamic and static behavior of the H⋯π and E⋯π interactions in EH2 adducts of benzene π-system (E = O, S, Se and Te), elucidated by QTAIM dual functional analysis. Phys. Chem. Chem. Phys. 2016, 18, 9948–9960. [Google Scholar] [CrossRef]
  24. Sugibayashi, Y.; Hayashi, S.; Nakanishi, W. Dynamic and static behavior of hydrogen bonds of the X–H⋯π type (X = F, Cl, Br, I, RO and RR′N.; R, R′ = H or Me) in the benzene π-system, elucidated by QTAIM dual functional analysis. Phys. Chem. Chem. Phys. 2015, 17, 28879–28891. [Google Scholar] [CrossRef]
  25. Sugibayashi, Y.; Hayashi, S.; Nakanishi, W. Behavior of Halogen Bonds of the Y−X⋅⋅⋅π Type (X, Y = F, Cl, Br, I) in the Benzene π System, Elucidated by Using a Quantum Theory of Atoms in Molecules Dual-Functional Analysis. Chem. Phys. Chem. 2016, 17, 2579–2589. [Google Scholar] [CrossRef]
  26. Hayashi, S.; Sugibayashi, Y.; Nakanishi, W. Quantum chemical calculations with the AIM approach applied to the π-interactions between hydrogen chalcogenides and naphthalene. RSC Adv. 2016, 6, 49651–49660. [Google Scholar] [CrossRef]
  27. Hayashi, S.; Sugibayashi, Y.; Nakanishi, W. Behavior of interactions between hydrogen chalcogenides and an anthracene π-system elucidated by QTAIM dual functional analysis with QC calculations. RSC Adv. 2017, 7, 31858–31865. [Google Scholar] [CrossRef]
  28. Dutta, A.K.; Linden, A.; Zoppi, L.; Baldridge, K.K.; Siegel, J.S. Extended Corannulenes: Aromatic Bowl/Sheet Hybridization. Angew. Chem. Int. Ed. 2015, 54, 10792–10796. [Google Scholar] [CrossRef] [PubMed]
  29. Meng, D.; Liu, G.; Xiao, C.; Shi, Y.; Zhang, L.; Jiang, L.; Baldridge, K.K.; Li, Y.; Siegel, J.S.; Wang, Z. Corannurylene Pentapetalae. J. Am. Chem. Soc. 2019, 141, 5402–5408. [Google Scholar] [CrossRef] [PubMed]
  30. Muzammil, E.M.; Halilovic, D.; Stuparu, M.C. Synthesis of corannulene-based nanographenes. Commun. Chem. 2019, 2, 58. [Google Scholar] [CrossRef]
  31. Pérez, C.; Steber, A.L.; Rijs, A.M.; Temelso, B.; Shields, G.C.; Lopez, J.C.; Kisiel, Z.; Schnell, M. Corannulene and its complex with water: A tiny cup of water. Phys. Chem. Chem. Phys. 2017, 19, 14214–14223. [Google Scholar] [CrossRef] [PubMed]
  32. Sakurai, H.; Daiko, T.; Sakane, H.; Amaya, T.; Hirao, T. Structural Elucidation of Sumanene and Generation of Its Benzylic Anions. J. Am. Chem. Soc. 2005, 127, 11580–11581. [Google Scholar] [CrossRef]
  33. Yakiyama, Y.; Wang, Y.; Hatano, S.; Abe, M.; Sakurai, H. Generation of “Sumanenylidene”: A Ground-State Triplet Carbene on a Curved π-Conjugated Periphery. Chem. Asian J. 2019, 14, 1844–1848. [Google Scholar] [CrossRef]
  34. Glendening, E.D.; Landis, C.R.; Weinhold, F. NBO 6.0: Natural bond orbital analysis program. J. Comput. Chem. 2013, 34, 1429–1437. [Google Scholar] [CrossRef]
  35. Nakanishi, W.; Hayashi, S.; Narahara, K. Polar Coordinate Representation of Hb(rc) versus (ℏ2/8m)∇2ρb(rc) at BCP in AIM Analysis: Classification and Evaluation of Weak to Strong Interactions. J. Phys. Chem. A 2009, 113, 10050–10057. [Google Scholar] [CrossRef]
  36. Nakanishi, W.; Hayashi, S. Atoms-in-Molecules Dual Functional Analysis of Weak to Strong Interactions. Curr. Org. Chem. 2009, 14, 181–197. [Google Scholar] [CrossRef]
  37. Nakanishi, W.; Hayashi, S. Role of dG/dw and dV/dw in AIM Analysis: An Approach to the Nature of Weak to Strong Interactions. J. Phys. Chem. A 2013, 117, 1795–1803. [Google Scholar] [CrossRef]
  38. Bader, R.F.W. Atoms in Molecules. A Quantum Theory; Oxford University Press: Oxford, UK, 1990; Available online: https://global.oup.com/academic/product/atoms-in-molecules-9780198558651?cc=jp&lang=en& (accessed on 18 May 2023).
  39. Matta, C.F.; Boyd, R.J. An Introduction to the Quantum Theory of Atoms in Molecules. In The Quantum Theory of Atoms in Molecules: From Solid State to DNA and Drug Design; Wiley-VCH: Weinheim, Germany, 2007. [Google Scholar] [CrossRef]
  40. Nakanishi, W.; Hayashi, S. Perturbed structures generated using coordinates derived from compliance constants in internal vibrations for QTAIM dual functional analysis: Intrinsic dynamic nature of interactions. Int. J. Quantum Chem. 2018, 118, e25590–e25591. [Google Scholar] [CrossRef]
  41. Brandhorst, K.; Grunenberg, J. Compliance 3.0.2. Available online: http://www.oc.tu-bs.de/Grunenberg/compliance.html (accessed on 18 May 2023).
  42. Brandhorst, K.; Grunenberg, J. Efficient computation of compliance matrices in redundant internal coordinates from Cartesian Hessians for nonstationary points. J. Chem. Phys. 2010, 132, 184101. [Google Scholar] [CrossRef]
  43. Brandhorst, K.; Grunenberg, J. How strong is it? The interpretation of force and compliance constants as bond strength descriptors. Chem. Soc. Rev. 2008, 37, 1558–1567. [Google Scholar] [CrossRef] [PubMed]
  44. Grunenberg, J. III-defined concepts in chemistry: Rigid force constants vs. compliance constants as bond strength descriptors for the triple bond in diboryne. Chem. Sci. 2015, 6, 4086–4088. [Google Scholar] [CrossRef] [PubMed]
  45. Nakanishi, W.; Hayashi, S. Dynamic Behaviors of Interactions: Application of Normal Coordinates of Internal Vibrations to AIM Dual Functional Analysis. J. Phys. Chem. A 2010, 114, 7423–7430. [Google Scholar] [CrossRef] [PubMed]
  46. Nakanishi, W.; Hayashi, S.; Matsuiwa, K.; Kitamoto, M. Applications of Normal Coordinates of Internal Vibrations to Generate Perturbed Structures: Dynamic Behavior of Weak to Strong Interactions Elucidated by Atoms-in-Molecules Dual Functional Analysis. Bull. Chem. Soc. Jpn. 2012, 85, 1293–1305. [Google Scholar] [CrossRef]
  47. Frisch, M.J.; Trucks, G.W.; Schlegel, H.B.; Scuseria, G.E.; Robb, M.A.; Cheeseman, J.R.; Scalmani, G.; Barone, V.; Mennucci, B.; Petersson, G.A.; et al. Gaussian 09 (Revision D.01); Gaussian, Inc.: Wallingford, CT, USA, 2009. [Google Scholar]
  48. Noro, T.; Sekiya, M.; Koga, T. Segmented contracted basis sets for atoms H through Xe: Sapporo-(DK)-nZP sets (n = D, T, Q). Theoret. Chem. Acc. 2012, 131, 1124-1–1124-8. [Google Scholar] [CrossRef]
  49. Møller, C.; Plesset, M.S. Note on an Approximation Treatment for Many-Electron Systems. Phys. Rev. 1934, 46, 618–622. [Google Scholar] [CrossRef]
  50. Gauss, J. Effects of electron correlation in the calculation of nuclear magnetic resonance chemical shifts. J. Chem. Phys. 1993, 99, 3629–3643. [Google Scholar] [CrossRef]
  51. Gauss, J. Accurate Calculation of NMR Chemical Shifts. Ber. Bunsen-Ges. Phys. Chem. 1995, 99, 1001–1008. [Google Scholar] [CrossRef]
  52. Biegler-König, F.; Schönbohm, J. The AIM2000 Program (Version 2.0). Available online: http://www.aim2000.de (accessed on 18 May 2023).
  53. Biegler-König, F. Calculation of atomic integration data. J. Comput. Chem. 2000, 21, 1040–1048. [Google Scholar] [CrossRef]
  54. Keith, T.A. AIMAll (Version 17.11.14); TK Gristmill Software: Overland Park, KS, USA, 2017; Available online: http://aim.tkgristmill.com (accessed on 18 May 2023).
  55. Zhao, Y.; Truhlar, D.G. The M06 Suite of Density Functionals for Main Group Thermochemistry, Thermochemical Kinetics, Noncovalent Interactions, Excited States, and Transition Elements: Two New Functionals and Systematic Testing of Four M06-Class Functionals and 12 Other Functionals. Theor. Chem. Acc. 2008, 120, 215–241. [Google Scholar] [CrossRef]
  56. Bader, R.F.W.; Cremer, T.S.S.D.; Kraka, E. Description of conjugation and hyperconjugation in terms of electron distributions. J. Am. Chem. Soc. 1983, 105, 5061–5068. [Google Scholar] [CrossRef]
  57. Bader, R.F.W. A quantum theory of molecular structure and its applications. Chem. Rev. 1991, 91, 893–928. [Google Scholar] [CrossRef]
  58. Bader, R.F.W. A Bond Path:  A Universal Indicator of Bonded Interactions. Phys. Chem. A 1998, 102, 7314–7323. [Google Scholar] [CrossRef]
  59. Biegler-König, F.; Bader, R.F.W.; Tang, T.H. Calculation of the average properties of atoms in molecules. II. J. Comput. Chem. 1982, 3, 317–328. [Google Scholar] [CrossRef]
  60. Bader, R.F.W. Atoms in molecules. Acc. Chem. Res. 1985, 18, 9–15. [Google Scholar] [CrossRef]
  61. Tang, T.H.; Bader, R.F.W.; MacDougall, P. Structure and bonding in sulfur-nitrogen compounds. Inorg. Chem. 1985, 24, 2047–2053. [Google Scholar] [CrossRef]
  62. Biegler-König, F.; Schönbohm, J.; Bayles, D. AIM2000—A program to Analyze and Visualize Atoms in Molecules. J. Comput. Chem. 2001, 22, 545–559. [Google Scholar]
  63. Biegler-König, F.; Schönbohm, J. Update of the AIM2000-program for atoms in molecules. J. Comput. Chem. 2002, 23, 1489–1494. [Google Scholar] [CrossRef]
  64. Nakanishi, W.; Nakamoto, T.; Hayashi, S.; Sasamori, T.; Tokitoh, N. Atoms-in-Molecules Analysis of Extended Hypervalent Five-Center, Six-Electron (5c–6e) C2Z2O Interactions at the 1, 8, 9-Positions of Anthraquinone and 9-Methoxyanthracene Systems. Chem. Eur. J. 2007, 13, 255–268. [Google Scholar] [CrossRef] [PubMed]
  65. Nakanishi, W.; Hayashi, S.; Narahara, K. Atoms-in-molecules dual parameter analysis of weak to strong interactions: Behaviors of electronic energy densities versus Laplacian of electron densities at bond critical points. J. Phys. Chem. A 2008, 112, 13593–13599. [Google Scholar] [CrossRef] [PubMed]
  66. Grimme, W.; Wortmann, J.; Frowein, D.; Lex, J.; Chen, G.; Gleiter, R. Laticyclic conjugated double bonds within the framework of oligocondensed bicyclo[2.2.2]octenes. J. Chem. Soc. Perkin Trans. 2 1998, 9, 1893–1900. [Google Scholar] [CrossRef]
  67. Lin, C.-T.; Wang, N.-J.; Yeh, Y.-L.; Chou, T.-C. Synthesis, reactions and thermal properties of endo-5, 12: endo-6, 11-dietheno-5, 5a, 6, 11, 11a, 12-hexahydronaphthacene. Tetrahedron 1995, 51, 2907–2928. [Google Scholar] [CrossRef]
  68. Espinosa, E.; Alkorta, I.; Elguero, J.; Molins, E. From weak to strong interactions: A comprehensive analysis of the topological and energetic properties of the electron density distribution involving X–H⋯ F–Y systems. J. Chem. Phys. 2002, 117, 5529–5542. [Google Scholar] [CrossRef]
  69. Bianchi, R.; Gervasio, G.; Marabello, D. The experimental charge density in transition metal compounds. C. R. Chim. 2005, 8, 1392. [Google Scholar] [CrossRef]
Scheme 1. Natural charges (Qn) on C and H atoms in corannulene (left) and coronene (right) evaluated with the NPA under the M06-2X/BSS-A//MP2/BSS-A.
Molecules 28 04219 sch001
Figure 1. EPS for corannulene evaluated with MP2/BSS-A. From the (a) lateral side, (b) cv side, and (c) cc side.
Molecules 28 04219 g001
Scheme 2. Convex (cv) and concave (cc) sides of corannulene and definition of structural types of B–A⋯π(C20H10), to be clarified, where (A, B) = (H, X), (X, X), or (X, F) (X = F, Cl, Br, and I) with structural parameters.
Molecules 28 04219 sch002
Scheme 3. Type ID structures of A–B⋯π and the definitions of the structural parameters for π of π(C20H10) on the convex (cv) and concave (cc) sides, π(C24H12), and π(C6H6), where (A, B) = (H, X), (X, X), or (X, F) (X = F, Cl, Br, and I).
Molecules 28 04219 sch003
Figure 2. Molecular graphs for X–H-∗-π(C20H10), X–X-∗-π(C20H10), and F–X-∗-π(C20H10) on the convex (cv) side, evaluated with MP2/BSS-A: F–H-∗-π(C20H10) (C1: type IACora:cv) (a), Cl–H-∗-π(C20H10) (Cs: type IBCora:cv) (b), Br–H-∗-π(C20H10) (C1: type IBCora:cv) (c), I–H-∗-π(C20H10) (Cs: type IBCora:cv) (d), F–F-∗-π(C20H10) (Cs: type IBCora:cv) (e), Cl–Cl-∗-π(C20H10) (Cs: type IACora:cv) (f), Br–Br-∗-π(C20H10) (Cs: type IACora:cv) (g), I–I-∗-π(C20H10) (Cs: type IACora:cv) (h), F–Cl-∗-π(C20H10) (Cs: type IACora:cv) (i), F–Br-∗-π(C20H10) (Cs: type IACora:cv) (j), and F–I-∗-π(C20H10) (C1: type IACora:cv) (k). BPs are drawn as pink lines, BCPs as red dots, and CCPs (cage critical points) as green dots. Carbon atoms are indicated in black and hydrogen atoms are in grey, with fluorine, chlorine, bromine, and iodine atoms in dark yellow, green, dark brown, and dark purple, respectively.
Molecules 28 04219 g002
Figure 3. Molecular graphs for X–H-∗-π(C20H10), X–X-∗-π(C20H10), and F–X-∗-π(C20H10) on the concave (cc) side, evaluated with BSS-A: F–H-∗-π(C20H10) (C1: type IACora:cc) (a), Cl–H-∗-π(C20H10) (Cs: type IIACora:cc) (b), Br–H-∗-π(C20H10) (C1: type IIACora:cc) (c), I–H-∗-π(C20H10) (C1: type IIACora:cc) (d), F–F-∗-π(C20H10) (Cs: type IIACora:cc) (e), Cl–Cl-∗-π(C20H10) (C1: type IIACora:cc) (f), Br–Br-∗-π(C20H10) (Cs: type IIBCora:cc) (g), I–I-∗-π(C20H10) (Cs: type IIBCora:cc) (h), F–Cl-∗-π(C20H10) (C1: type IACora:cc) (i), F–Br-∗-π(C20H10) (C1: type IACora:cc) (j), and F–I-∗-π(C20H10) (Cs: type IACora:cc) (k). BPs are drawn as pink lines, BCPs as red dots, RCPs (ring critical points) as yellow dots, and CCPs (cage critical points) as green dots. Carbon atoms are indicated in black and hydrogen atoms are in grey, with fluorine, chlorine, bromine, and iodine atoms in dark yellow, green, dark brown, and dark purple, respectively.
Molecules 28 04219 g003
Figure 4. Plots of ΔEES of B–A-∗-π(C20H10) (B–A = X–H, X–X, and F–X) on the cv and cc sides versus halogens (X) calculated with M06-2X/BSS-A//MP2/BSS-A.
Molecules 28 04219 g004
Figure 5. QTAIM-DFA plots of Hb(rc) versus Hb(rc)–Vb(rc)/2 for X–H-∗-π(C20H10) (a), the partial one (b), and Y–X-∗-π(C20H10) (c), calculated with MP2/BSS-A. Keys are shown in the figure, in which solid and hollow marks correspond to the cv and cc sides of corannulene, respectively, in X–H-∗-π(C20H10) and Y–X-∗-π(C20H10).
Molecules 28 04219 g005
Figure 6. Plots of r1 of B–A-∗-π(C20H10) (B–A = X–H, X–X, and F–X) on the cv and cc sides versus halogens (X). See Scheme 2 in text for r1.
Molecules 28 04219 g006
Figure 7. Plots of ΔE versus θ on the cv side (a) and cc side (b). The plots for the cv side were analyzed as the two correlations: the first correlation consists of X–H-∗-π(C20H10) (X = F, Cl, Br, and I) and X–X-∗-π(C20H10) (X = Cl, Br, and I), denoted by ●, and the second one of F–X-∗-π(C20H10) (X = F, Cl, Br, and I), denoted by . In the case of the cc side, the plots were analyzed as the four groups. The first group consists of X–H-∗-π(C20H10) (X = F, Cl, and Br) (●) and X–X-∗-π(C20H10) (X = Cl, Br, and I) () forms the second group. The third group contains F–X-∗-π(C20H10) (X = Cl, Br, and I) (), while data for I–H-∗-π(C20H10) and F–F-∗-π(C20H10) () deviate from the three correlations.
Molecules 28 04219 g007
Figure 8. Plots of ΔE versus Cii–1 for the adducts on the cv side (a) and cc side (b). The plots for the cv side were analyzed as two correlations. Data from X–X-∗-π(C20H10) (X = F, Cl, Br, and I), shown by ●, form the first correlation, while the second correlation consists of those from F–X-∗-π(C20H10) (X = Cl, Br, and I) and F–H-∗-π(C20H10) (). In the case of the cc side, the plots were analyzed as three groups. The first group consists of the data from X–H-∗-π(C20H10) (X = Cl and Br) and X–X-∗-π(C20H10) (X = F and Br) (●), and those from F–X-∗-π(C20H10) (X = Cl, Br, and I) and F–H-∗-π(C20H10) () form the second one, whereas those from I–H-∗-π(C20H10) and I–I-∗-π(C20H10) () seem to deviate from the correlations.
Molecules 28 04219 g008
Table 1. QTAIM functions and QTAIM-DFA parameters for X–H-∗-π(C20H10) and Y–X-∗-π(C20H10) (X, Y = F, Cl, Br, and I), evaluated with MP2/BSS-A 1,2, employing the perturbed structures generated with CIV and/or NIV.
Y–X-∗-π(C20H10)
(Symmetry: Type)
ρb(rc)c2ρb(rc) 3Hb(rc)R4θ 5Ciiθp 6κp 7Predicted
Nature
(eao–3)(au)(au)(au)(°)(Å mdyn–1)(°)(au–1)
Convex side (with CIV)
F–H-∗-π(aC) (C1: IACora:cv)0.01650.00640.00180.006774.717.674123.6362.5p-CS/t-HBnc
F–F-∗-π(aC) (Cs: IACora:cv)0.01670.00890.00240.009274.79.00481.936.3p-CS/vdw
Cl–Cl-∗-π(aC) (Cs: IACora:cv)0.02270.00890.00060.008986.44.795122.2198.1p-CS/t-HBnc
Br–Br-∗-π(aC) (Cs: IACora:cv)0.02600.0085−0.00070.008595.04.197141.4127.3r-CS/t-HBwc
I–I-∗-π(aC) (Cs: IACora:cv)0.02510.0071−0.00130.0072100.33.828147.9141.2r-CS/t-HBwc
F–Cl-∗-π(aC) (Cs: IACora:cv)0.03020.0104−0.00130.010596.94.321143.2122.1r-CS/t-HBwc
F–Br-∗-π(aC) (Cs: IACora:cv)0.03410.0097−0.00340.0102109.33.036159.275.5r-CS/CT-MC
F–I-∗-π(aC) (C1: IACora:cv)0.03320.0079−0.00440.0091119.22.487165.052.6r-CS/CT-MC
Convex side (with NIV)
F–H-∗-π(aC) (C1: IACora:cv)0.01650.00640.00180.006774.7102.1 8111.4307.7p-CS/t-HBnc
Cl–H-∗-π(abM) (Cs: IBCora:cv) 90.01600.00570.00160.006074.982.0 888.5117.3p-CS/vdW
Br–H-∗-π(abM) (C1: IBCora:cv) 90.01690.00580.00140.006076.760.7 896.2260.9p-CS/t-HBnc
I–H-∗-π(abM) (Cs: IBCora:cv)0.01750.00590.00130.006077.552.2 895.9240.3p-CS/t-HBnc
F–F-∗-π(aC) (Cs: IACora:cv)0.01670.00890.00240.009274.775.6 881.835.4p-CS/vdw
Cl–Cl-∗-π(aC) (Cs: IACora:cv)0.02270.00890.00060.008986.479.2 8120.6136.5p-CS/t-HBnc
Br–Br-∗-π(aC) (Cs: IACora:cv)0.02600.0085−0.00070.008595.065.9 8139.3125.3r-CS/t-HBwc
I–I-∗-π(aC) (Cs: IACora:cv)0.02510.0071−0.00130.0072100.360.0 8145.7129.1r-CS/t-HBwc
F–Cl-∗-π(aC) (Cs: IACora:cv)0.03020.0104−0.00130.010596.993.3 8141.8101.6r-CS/t-HBwc
F–Br-∗-π(aC) (Cs: IACora:cv)0.03410.0097−0.00340.0102109.386.9 8157.759.2r-CS/CT-MC
F–I-∗-π(aC) (C1: IACora:cv)0.03320.0079−0.00440.0091119.281.6 8164.149.4r-CS/CT-MC
Concave side (with CIV)
F–H-∗-π(aC) (C1: IACora:cc)0.01440.00650.00210.006872.08.17595.9273.2p-CS/t-HBnc
Cl–H-∗-π(aC) (Cs: IIACora:cc)0.01620.00640.00150.006576.931.667108.6409.5p-CS/t-HBnc
Br–H-∗-π(aC) (C1: IIACora:cc)0.01740.00650.00140.006678.234.149117.2736.5p-CS/t-HBnc
I–H-∗-π(fC) (C1: IIACora:cc)0.01720.00620.00120.006378.957.41493.5200.2p-CS/t-HBnc
F–F-∗-π(aC) (Cs: IIACora:cc)0.00930.00480.00120.005076.312.66584.66.4p-CS/vdw
Br–Br-∗-π(aC) (Cs: IIBCora:cc)0.01240.00540.00140.005675.49.44286.385.5p-CS/vdw
I–I-∗-π(aC) (Cs: IIBCora:cc)0.01300.00490.00100.005078.74.97591.2117.9p-CS/t-HBnc
F–Cl-∗-π(aC) (C1: IACora:cc)0.01370.00650.00170.006775.66.16295.0140.9p-CS/t-HBnc
F–Br-∗-π(aC) (C1: IACora:cc)0.01390.00610.00140.006276.95.87599.9204.6p-CS/t-HBnc
F–I-∗-π(aC) (Cs: IACora:cc)0.01410.00540.00080.005481.15.412109.2324.3p-CS/t-HBnc
Concave side (with NIV)
F–H-∗-π(aC) (C1: IACora:cc)0.01440.00650.00210.006872.0100.0 8100.2282.2p-CS/t-HBnc
Cl–H-∗-π(aC) (Cs: IIACora:cc)0.01620.00640.00150.006576.977.7 8125.4955.4p-CS/t-HBnc
Br–H-∗-π(aC) (C1: IIACora:cc)0.01740.00650.00140.006678.259.0 8137.71830p-CS/t-HBnc
I–H-∗-π(fC) (C1: IIACora:cc)0.01720.00620.00120.006378.953.5 892.2344.1p-CS/t-HBnc
F–F-∗-π(aC) (Cs: IIACora:cc)0.00930.00480.00120.005076.376.2 889.3305.2p-CS/vdw
Cl–Cl-∗-π(fC) (C1: IIACora:cc)0.01180.00540.00170.005672.897.0 884.594.5p-CS/vdw
Br–Br-∗-π(aC) (Cs: IIBCora:cc)0.01240.00540.00140.005675.476.0 888.598.1p-CS/vdw
I–I-∗-π(aC) (Cs: IIBCora:cc)0.01300.00490.00100.005078.770.9 894.1136.2p-CS/t-HBnc
F–Cl-∗-π(aC) (C1: IACora:cc)0.01370.00650.00170.006775.695.4 893.8131.4p-CS/t-HBnc
F–Br-∗-π(aC) (C1: IACora:cc)0.01390.00610.00140.006276.979.2 897.1168.1p-CS/t-HBnc
F–I-∗-π(aC) (Cs: IACora:cc)0.01410.00540.00080.005481.176.0 8107.7228.9p-CS/t-HBnc
1 See text for BSS-A. 2 Data are given at BCP, which is shown by A-∗-π, where a one side interaction is shown if two are identical due to symmetry. 3 c2ρb(rc) = Hb(rc) − Vb(rc)/2, where c = ћ2/8m. 4 R = (x2 + y2)1/2, where (x, y) = (Hb(rc) − Vb(rc)/2, Hb(rc)). 5 θ = 90° − tan–1 (y/x). 6 θp = 90° − tan–1 (dy/dx). 7 κp = |d2y/dx2|/[1 + (dy/dx)2]3/2. 8 The frequency corresponding to the interval vibration employed to generate the perturbed structures with NIV in cm–1. 9 Perturbed structures are generated employing w = –0.05, –0.025, (0), 0.025, and 0.05 in Equation (4).
Table 2. θ and θp values for H-∗-π and X-∗-π interactions with π(C20H10), π(C24H12), and π(C6H6), evaluated with MP2/BSS-A, together with values from corresponding adducts with π(C6H6), respectively 1.
Y–X-∗-π(C20H10)
(Symmetry: Type)
θ 2θp3Δθ 4Δθp5Y–X-∗-π(C24H12/C6H6)
(Symmetry: Type)
θ 2θp 3Δθ 4Δθp 5
(°)(°)(°)(°)(°)(°)(°)(°)
Convex side of π(C20H10) Y–X-∗-π(C24H12)
F–H-∗-π(aC) (C5v: IDCora:cv) 6,766.168.9−1.3−0.6F–H-∗-π(aC) (C6v: IDCor) 6,767.068.8−0.4−0.7
Cl–H-∗-π(aC) (C5v: IDCora:cv) 6,771.574.4−0.72.3Cl–H-∗-π(aC) (C6v: IDCor) 6,772.073.7−0.21.6
Br–H-∗-π(aC) (C5v: IDCora:cv) 6,772.575.8−0.33.1Br–H-∗-π(aC) (C6v: IDCor) 6,772.775.2−0.12.5
I–H-∗-π(aC) (C5v: IDCora:cv) 6,773.677.70.13.6I–H-∗-π(aC) (C6v: IDCor) 6,773.777.60.23.5
F–F-∗-π(aC) (C5v: IDCora:cv) 6,770.573.5−1.4−1.9F–F-∗-π(aC) (C6v: IDCor) 6,771.374.9−0.6−0.5
F–Cl-∗-π(aC) (C5v: IDCora:cv) 6,769.677.61.25.4F–Cl-∗-π(aC) (C6v: IDCor) 6,769.175.80.73.6
F–Br-∗-π(aC) (C5v: IDCora:cv) 6,771.781.32.17.2F–Br-∗-π(aC) (C6v: IDCo) 6,770.878.81.24.7
F–I-∗-π(aC) (C5v: IDCora:cv) 7,876.590.83.511.6F–I-∗-π(aC) (C6v: IDCor) 6,775.186.82.17.6
Concave side of π(C20H10) Y–X-∗-π(C6H6)
F–H-∗-π(aC) (C5v: IDCora:cc) 6,768.276.00.86.5F–H-∗-π(aC) (C6v: IDBzn) 6,767.469.5
Cl–H-∗-π(aC) (C5v: IDCora:cc) 6,774.884.82.612.7Cl–H-∗-π(aC) (C6v: IDBzn) 6,772.272.1
Br–H-∗-π(aC) (C5v: IDCora:cc) 6,775.986.83.114.1Br–H-∗-π(aC) (C6v: IDBzn) 6,772.872.7
I–H-∗-π(aC) (C5v: IDCora:cc) 6,777.888.14.314.0I–H-∗-π(aC) (C6v: IDBzn) 6,773.574.1
F–F-∗-π(aC) (C5v: IDCora:cc) 6,772.775.70.80.3F–F-∗-π(aC) (C6v: IDBzn) 6,771.975.4
F–Cl-∗-π(aC) (C5v: IDCora:cc) 6,773.183.84.711.6F–Cl-∗-π(aC) (C6v: IDBzn) 6,768.472.2
F–Br-∗-π(aC) (C5v: IDCora:cc) 6,774.586.44.912.3F–Br-∗-π(aC) (C6v: IDBzn) 6,769.674.1
1 See text for BSS-A. 2 θ = 90°–tan–1 (y/x), where (x, y) = (Hb(rc)–Vb(rc)/2, Hb(rc)). 3 θp = 90°–tan–1 (dy/dx). 4 Δθ = (θ for the π(C20H10) or π(C24H12) adducts) − (θ for the π(C6H6) adducts). 5 Δθp = (θp for the π(C20H10) or π(C24H12) adducts) − (θp for the π(C6H6) adducts). 6 Predicted to be vdW interactions appearing in the p-CS region. 7 Two imaginary frequencies being predicted for each. 8 Predicted to be t-HBnc interactions appeared in the p-CS region.
Disclaimer/Publisher’s Note: The statements, opinions and data contained in all publications are solely those of the individual author(s) and contributor(s) and not of MDPI and/or the editor(s). MDPI and/or the editor(s) disclaim responsibility for any injury to people or property resulting from any ideas, methods, instructions or products referred to in the content.