Article

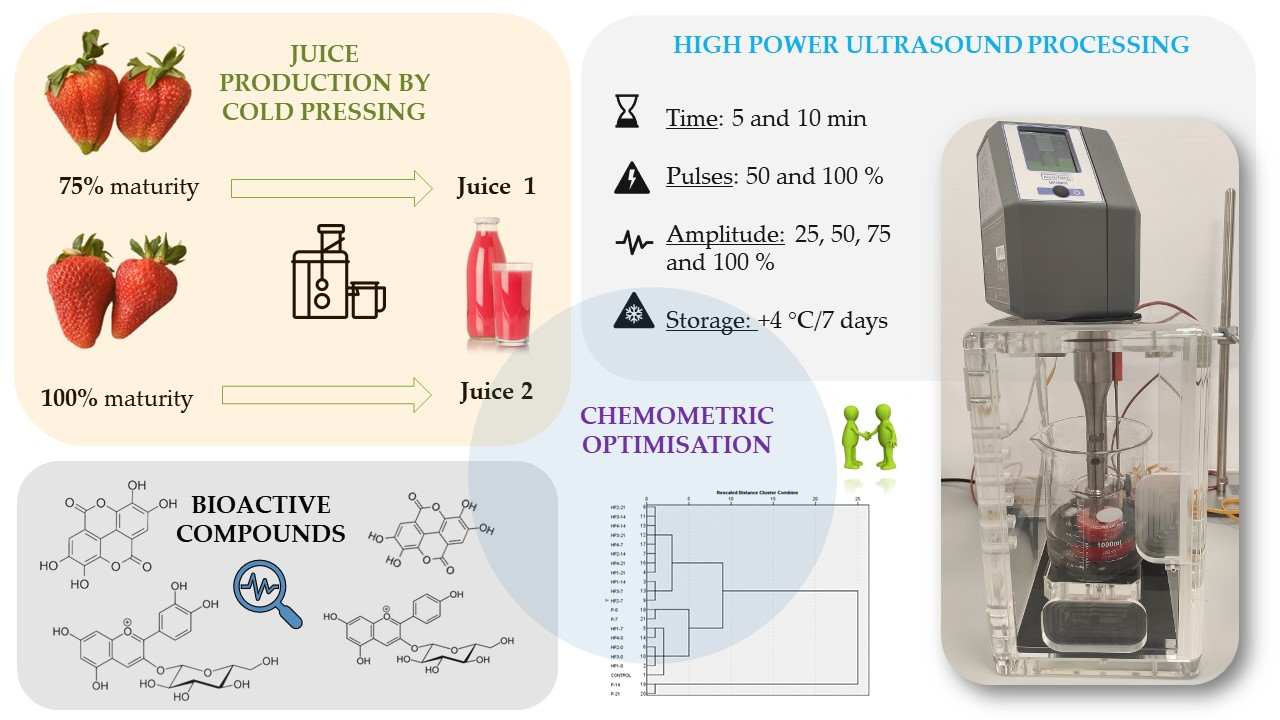
A Chemometric Investigation on the Functional Potential in High Power Ultrasound (HPU) Processed Strawberry Juice Made from Fruits Harvested at two Stages of Ripeness

1
Faculty of Food Technology and Biotechnology, University of Zagreb, Pierottijeva 6, 10000 Zagreb, Croatia
2
Department of Food Technology, University North, Trg dr. Žarka Dolinara 1, 48000 Koprivnica, Croatia
3
Department of Pomology, Division of Horticulture and Landscape Architecture, Faculty of Agriculture, University of Zagreb, Svetošimunska Cesta 25, 10000 Zagreb, Croatia
4
Faculty of Technology, University of Novi Sad, Blvd. Cara Lazara 1, 21000 Novi Sad, Serbia
5
Department of Animal Science, Food and Nutrition, Università Cattolica del Sacro Cuore, Via Emilia Parmense 84, 29122 Piacenza, Italy
6
Department for Sustainable Food Process, Università Cattolica del Sacro Cuore, Via Emilia Parmense 84, 29122 Piacenza, Italy
*
Author to whom correspondence should be addressed.
Molecules 2023, 28(1), 138; https://doi.org/10.3390/molecules28010138
Submission received: 8 November 2022 / Revised: 10 December 2022 / Accepted: 20 December 2022 / Published: 24 December 2022
(This article belongs to the Special Issue Food Polyphenols as Affected by Food Processing Conditions)

Abstract

:
This work aimed to investigate the influence of high-power ultrasound (HPU) technology on the stability of bioactive compounds in strawberry juices obtained from fruits with different stages of ripeness (75% vs. 100%) and stored at 4 °C for 7 days. HPU parameters were amplitude (25, 50, 75, and 100%), pulses (50 vs. 100%) and treatment time (5 vs. 10 min). Amplitude and pulse had a significant effect (p ≤ 0.05) on all bioactive compounds except flavonols and hydroxycinnamic acids. The treatment duration of 5 min vs. 10 min had a significant positive impact on the content of anthocyanins, flavonols and condensed tannins, while the opposite was observed for total phenols, whereas no statistically significant effect was observed for hydroxycinnamic acids. The temperature changes during HPU treatment correlated positively with almost all HPU treatment parameters (amplitude, pulse, energy, power, frequency). Optimal parameters of HPU were obtained for temperature changes, where the highest content of a particular group of bioactive compounds was obtained. Results showed that by combining fruits with a certain ripeness and optimal HPU treatment, it would be possible to produce juices with highly preserved bioactive compounds, while HPU technology has prospects for application in functional food products.

Graphical Abstract

1. Introduction

Strawberry (Fragaria x ananassa Duch.) is a seasonal fruit that is very popular among consumers, as well as its products such as jams, purees and juices [1]. This fruit is rich in various bioactive compounds, especially anthocyanins, phenolic acids and flavonoids, which have many health-promoting properties due to their antioxidant effects [2,3,4]. On the other hand, the increased incidence of certain diseases (e.g., obesity, cardiovascular and neurological diseases, cancer) associated with poor diets and unhealthy lifestyles has made consumers in today’s world more aware of healthy diets. Functional foods such as juices [5] are particularly important as part of a healthy diet [6]. Considering their chemical composition and biological potential, strawberries can be considered a functional food [7]. Therefore, strawberry fruits are used in the production of various functional products such as functional dairy products [8,9], functional gluten-free products [10], functional fermented beverages [11] and products [12], functional marmalade [13], functional jelly candies [14], functional fruit juices [15], functional fruit drinks [16] and nectars [17].
Functional strawberry juices are of particular interest as they have been shown to possess anti-inflammatory, cardioprotective, anticancer, antioxidant, genoprotective, and neuroprotective properties [7]. Strawberries also showed promising antiviral properties against various pathogenic viruses [18], which is especially important in the current era of global pandemics and crises. Moreover, the global fruit and vegetable juices market was estimated to reach USD 131.62 billion in 2021 and is projected to grow at a compound annual growth rate (CAGR) of 6.3% from 2022 to 2030. Therefore, the interest in producing and consuming juices is steadily increasing [19].
The most critical parameter for successful strawberry juice production is the selection of the cultivar that best suits the cultivation method and ecological conditions [20,21]. Strawberries are susceptible to transportation, which significantly affects their quality, i.e., physical and chemical parameters, bioactive composition and sensory properties [22]. A recent study has confirmed that strawberries harvested at a lower stage of ripeness (75% red fruits) have better structural characteristics for transport and storage, while their processing into juice has also been shown to be good in terms of maintaining quality compared to strawberry juices obtained from 100% ripe strawberries [23]. When processed into juice, fruits with 75% ripeness showed less color change than fruits with 100% ripeness, and sensory characteristics were similar to fully ripe fruits [23]. Thus, by selecting an appropriate cultivar and fruit ripeness level, as well as a strategy for sustainable processing, strawberries could be an excellent raw material for producing high-quality functional juices and serving as fruit meals for consumers while meeting recommendations for higher daily fruit intake [24].
In industrial production, juices are usually preserved by the conventional pasteurization process to extend their shelf-life. Besides the thermolabile bioactive compounds, high temperatures during pasteurization generally cause chemical alterations in volatile fractions and, consequently, affect strawberry products’ nutritional, biological, and sensory quality [25,26]. Hartmann et al. [27] found a significant loss of vitamin C, anthocyanins, total phenols and antioxidant capacity by heating strawberry juices at 85 °C for 5 s and 15 min. A longer processing time at the same temperature (85 °C) resulted in significantly higher losses of polyphenols and anthocyanins. In addition, heating causes reactions between hexoses with amino acids and the formation of Maillard reaction products, which cause browning of the juice and negatively affect the product’s appearance and overall sensory impression [28]. Therefore, the application of innovative non-thermal technologies has been increasingly explored recently. Chemat et al. [29,30] emphasized that when selecting new process technologies, special attention should be paid to environmentally friendly and sustainable technologies that allow for saving both energy and water while ensuring a safe and high-quality product. One of these new technologies is ultrasound-assisted processing.
The main phenomenon responsible for the effects of ultrasonic processing on liquid media is acoustic cavitation [31], which causes various physical and chemical changes [30]. Compared to thermal pasteurization, ultrasonic processing of juices has the following main advantages: control of enzymatic browning, better preservation of bioactive compounds, prolonged shelf life and improved physicochemical properties of fruit juices [32]. Studies have shown that High Power Ultrasound (HPU) treatment does not cause significant changes in physicochemical and color parameters of strawberry juice and that HPU treatment contributes to significant improvements in bioactive compounds’ contents (i.e., total phenolic content, ascorbic acid, total anthocyanins) and antioxidant activity of the product depending on the adjusted process parameters [33,34,35,36].
Since HPU technology has not yet been used to process fruit of different ripeness levels, it is unknown whether this technology would be suitable for processing strawberry juices from two ripeness levels. A recent study applying High Intensity Pulsed Electric Field (HIPEF) has shown that this technology is suitable for processing strawberry juices from different ripening stages, as it improves the stability of bioactive compounds during shelf life [37].
In summary, this study aimed to investigate the influence of HPU treatment parameters (amplitude, pulse, and treatment duration) on the stability of bioactive compounds in strawberry juices from fruits of different ripening stages (75% vs. 100%) during storage at 4 °C for 7 days. The application of chemometrics to evaluate the influence of ultrasonic processing parameters was utilized to find optimal HPU processing conditions in terms of the highest stability of bioactive compounds.

2. Results and Discussion

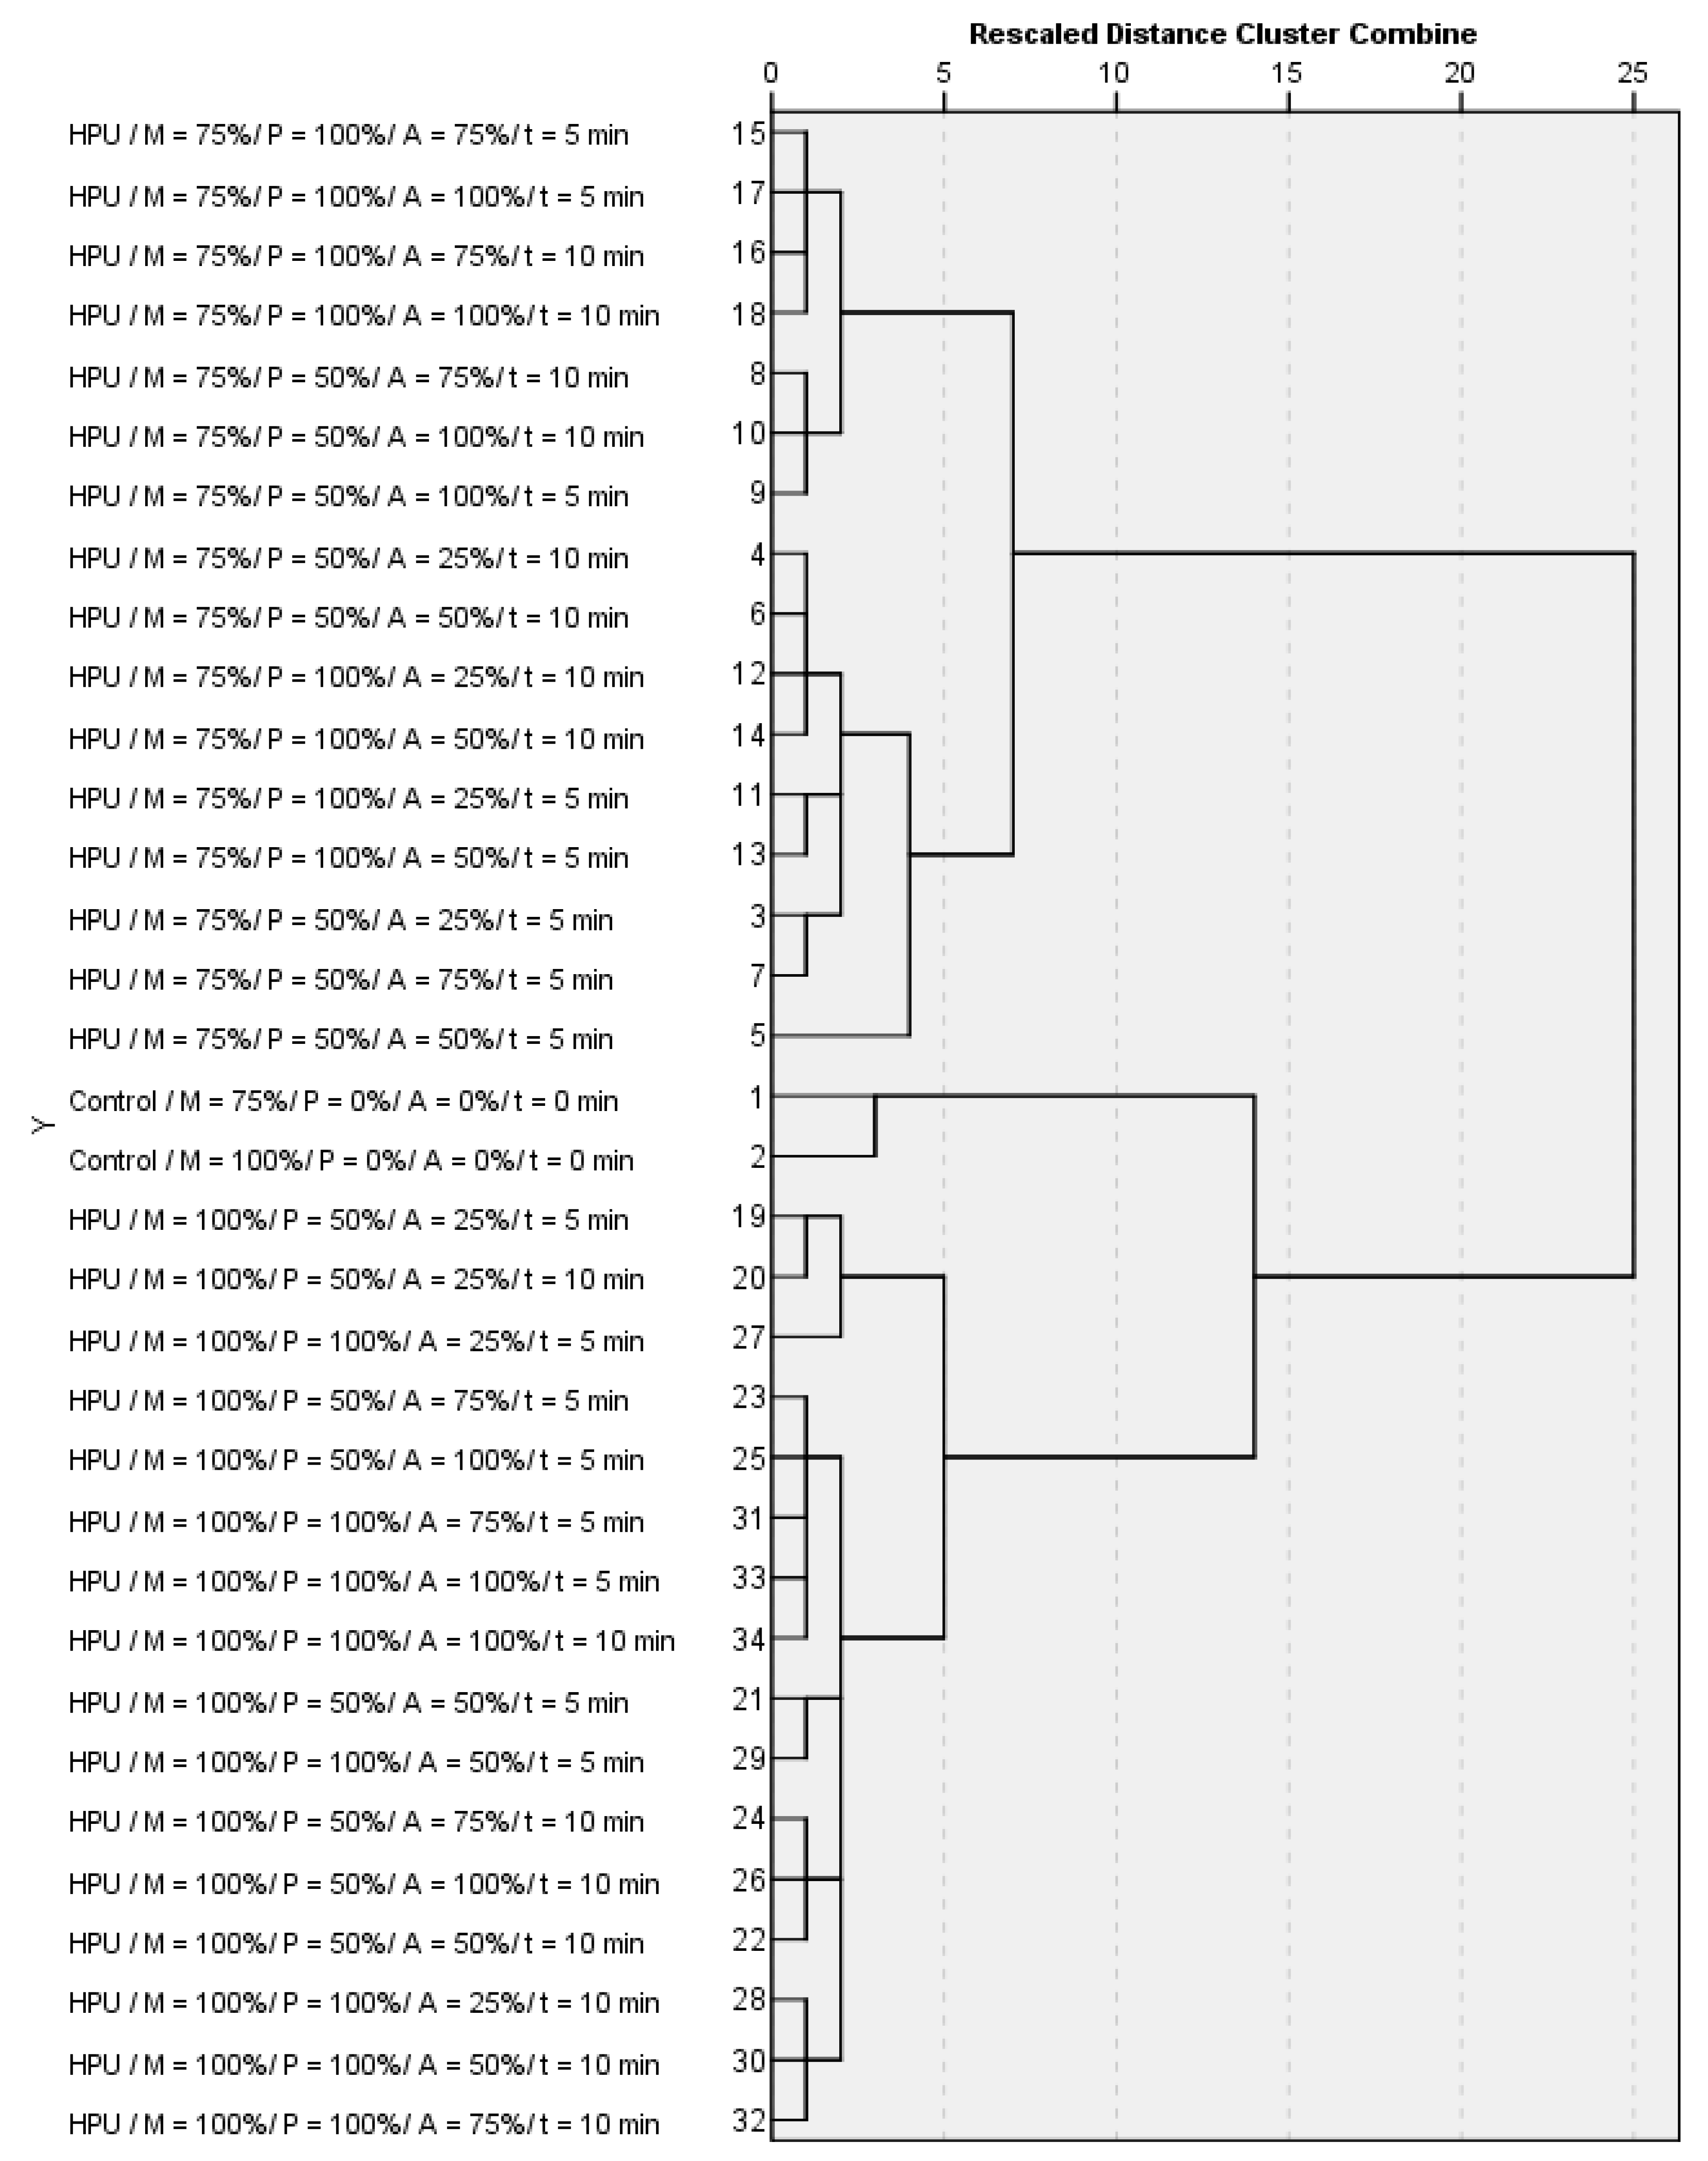
2.1. The Use of Chemometrics for the Evaluation of HPU Processing

Untreated juices (control samples) from both ripening stages were compared in terms of soluble solids content (SSC) and pH, as well as total phenolic compounds (TPC), monomeric anthocyanins (ANT), hydroxycinnamic acids (HCA), flavonols (FL) and condensed tannins (CT). The levels of all studied bioactive compounds in the control samples were higher in juice from 100% ripe fruit than in 75% (Table 1). Aubert et al. [38] recorded a 1.6 times higher value of total phenols in fully ripe strawberry fruit than in 75% ripe strawberry fruit. The most represented group of bioactive compounds was CT (81.05%), followed by HCA (14.74%), ANT (13.02%) and finally, FL (3.26%). The average values of the bioactive compounds of the control samples are shown in Table 1.
Data analysis initially examined relationships between the samples by an exploratory hierarchical Ward’s cluster analysis. When samples were analyzed for standardized similarities for various types of treatments (controls vs. HPU), maturity (%), HPU pulse (%), amplitude (%), treatment time (min), content of TPC (mg 100 mL−1), ANT (mg 100 mL−1), HCA (mg 100 mL−1), FL (mg 100 mL−1), CT (mg 100 mL−1), SSC (%), and pH, it was revealed that the most similar samples to controls were those treated with a maturity of 100%, a pulse of 50%, an amplitude of 25%, and treatment durations of 5 and 10 min. They were similar to controls and clustered together regardless of maturity (Figure 1). Other samples similar to controls were those with a maturity of 100%, a pulse of 100%, an amplitude of 25%, and a treatment duration of 5 min.
More detailed examination with Kruskal–Wallis analysis revealed that the chemical profile of the control samples compared with the HPU-treated samples was similar for all polyphenolic groups, except for CT. This group of compounds was found in higher amounts in the HPU samples (Table 2). These results could be a consequence of the effect of cavitation under the influence of HPU [39], which degrades the cellular structure and allows easier CT extraction into the surrounding juice [40,41]. In their research, Bautista-Ortin et al. [42] concluded that HPU treatment is the most effective method to preserve and extract CT during red winemaking, regardless of the different maceration times. Similar results were confirmed by the research of Plaza et al. [43].

2.2. The Changes of Bioactive Compounds in Strawberry Juices under HPU Processing and Storage

Table 3 shows the influence of ripeness and storage on the control juice samples.
The levels of all studied bioactive compounds in the control samples, except for total phenolic compounds and FL, were significantly higher (p ≤ 0.01) in juices made from 100% ripe fruit than those of 75% ripeness, this is largely consistent with our previous findings [37]. As ripeness increased, TPC decreased in control samples, which is consistent with other literature [44]. Indeed, phenolic compounds are synthesized in the skin of fruits, and considering the lower mass of unripe fruits, their proportion is higher in unripe (smaller) fruits than in larger (riper) fruits [44]. Anthocyanins, the compounds responsible for the red color of strawberries, were almost twice as abundant in juices made of 100% ripe strawberries vs. 75%. Considering that the intensity of the red color increases as strawberries ripen, it was expected that the riper fruits and their products would have higher levels of anthocyanins, which is consistent with the results of Pradas et al. [45]. The HCA content in juices from fully ripe strawberries is almost 52% higher compared to juices from 75% ripe fruits. The higher HCA concentration in the juice of fully ripe strawberries can be explained by the accumulation of phenolic acids [45]. FL was the only exception that was not affected by ripeness. According to studies by Pradas et al. [45], the degree of ripeness had no statistically significant effect on the proportion of flavonols, mainly determined by the cultivar.
Storage positively influenced the contents of HCA and FL in control samples, while the contents of ANT decreased (Table 3). The value of HCA was 6.2% higher after 7 days of storage than after 0 days, which is in agreement with other literature reports [37,38]. The previous study confirmed that total and individual anthocyanins were degraded during storage according to first-order reaction kinetics, and the rate was strongly dependent on temperature [46]. However, storage of the juices for 7 days did not affect the content of TPC and CT. Similarly, the TPC content of the lychee juices after storage at 4 °C for 168 h was not significantly lower than that of the different lychee juices before storage [47].
The changes in bioactive compounds in HPU-treated juice samples during storage are shown in Table 4.
Juices from riper strawberries had higher levels of ANT, HCA, FL, and CT, but the same as in untreated juices, TPC content was higher in the samples from less ripe strawberries (75%). As mentioned earlier, higher TPC contents were found in unripe fruits compared to ripe fruits [44].
To find the optimal parameters for HPU processing of strawberry juices, it is necessary to consider the influence of each HPU process parameter on the stability of bioactive compounds. Thus, increasing the amplitude from 25% to 75% resulted in a statistically significant decrease in the TPC value, while further increasing the amplitude up to 100% significantly increased the TPC value. These results may indicate an optimal amplitude value at which the TPC is best preserved and emphasizes the need to optimize HPU parameters. In the study by Bursać Kovačević et al. [48], increasing the amplitude from 40 to 80% decreased (p ≤ 0.05) the TPC value, which is in agreement with our study. On the other hand, Pala et al. [49] reported that amplitude (50%, 75%, and 100%) did not statistically significantly affect the TPC value in HPU-treated pomegranate juice.
Increasing the amplitude from 25 to 100% significantly decreased the content of ANT. Tiwari et al. [50] found the same trend where increasing the amplitude caused a statistically significant decrease in ANT content in HPU-treated strawberry juice (1500 W, 20 kHz). A significant decrease in ANT content at higher amplitudes (75 and 100%) in HPU-treated pomegranate juice was found by Pala et al. [49]. A possible reason for the observed trend could be explained by cavitational collapse and free radical formation [51,52]. Moreover, the increase in amplitude significantly decreased HCA and CT. These results are consistent with the studies of Lukić et al. [53], who found that higher frequencies negatively affected the concentrations of total tannins in red wine. The studies performed by Celotti et al. [54] are in some agreement with the results obtained, as they found the same trend of decreasing CT value with increasing amplitude from 41 to 81% in red wine treated with HPU (200 W, 20 kHz) at 15 and 30 day storage.
Unlike the other groups of compounds, FL was the only exception and was not affected by the variations in amplitude. A similar pattern was found in the research of Bursać Kovačević et al. [48], where variations of amplitude (40 and 80%) did not significantly affect the content of total flavan-3-ols in HPU-treated cloudy apple juice.
As for the pulse, there are two basic types of ultrasound generation, continuous and pulsed. In pulsed generation, the ultrasound output of the generator is switched on and off for a short time and the process is repeated. However, the effect of pulse modulation on the quality characteristics of fruit juices is still not thoroughly explored [32]. Therefore, in this study, we aim to investigate how two pulse modes affect bioactive juice quality. To that end, a higher pulse duration (100%) positively affected the stability of TPC, while higher values of ANT, FL and CT were observed when treated with a lower pulse duration (50%). This influence was not related to the HCA content. In the literature, it is not possible to find a reason for this trend. Still, the 100% pulse may be too invasive for the stability of the studied subgroups of polyphenolic compounds; therefore, for their preservation, HPU treatment with a lower pulse is suggested.
When considering the influence of treatment duration, it appears that a longer duration of sonication (10 min vs. 5 min) has either no effect (TPC and HCA) or a negative effect (ANT, FL, CT). Studies by other authors also confirmed the insignificant effect of treatment time on TPC [48,49,55,56]. Moreover, increasing the pulse from 50 to 100% and the treatment time from 5 to 10 min decreased ANT content. Studies by Tiwari et al. [50] confirmed the significant effect of treatment time on the reduction of ANT in HPU-treated strawberry juices. Wang et al. [35] found that total phenolics increased significantly with the increasing duration of ultrasound treatment. The authors explained this by adding sonochemically generated hydroxyl radicals (OH˙) to the aromatic ring of the phenolic compounds in the ortho-, meta- and para-positions. In addition, they suggested that during ultrasound treatment, the increase in mass transfer rates and the possible disruption of the cell wall of strawberry tissue due to the formation of microcavities could also lead to the release of more phenolic constituents into the juice. Another important effect when strawberry juices are sonicated is the change in the microstructure of the pulp tissue of the juice. The change in cell structures caused by ultrasound treatment increased with increasing treatment time. Therefore, variations regarding the different influence of processing time on different subgroups of polyphenolic compounds are also possible, considering that not all are located at the same positions in the cellular structures [35].
Storage had a statistically significant effect on the reduction of TPC in treated juice after 7 days of storage. These results are in agreement with those of Bursać Kovačević et al. [48], who found the same trend in HPU-treated cloudy apple juice (100 W, 30 kHz frequency) when stored at 4 °C for 7 days.
The 7 day storage had a statistical effect on the decrease of ANT content in the treated juices, which agrees with the results of Tiwari et al. [51], who found a 10% loss of ANT in strawberry juice during 10 day storage at 4 °C. Decreasing ANT levels during the storage of HPU juices has also been reported in other studies [57].
In contrast to TPC and ANT, whose levels decreased after 7 days of storage, HCA and FL increased and the level of CT remained constant. This may indicate that condensation of ANT increases the level of CT while HCA and FL are released into the juices. Similar patterns were previously observed in control samples (Table 3), so it is fairly safe to assume that these changes are due to certain natural processes that occur in strawberry fruit during ripening and storage. In any case, this transformation is not efficient enough to keep TPC constant, so it decreases during storage. In other words, the influences from the HPU samples can be well detected and separated from those of natural occurrences. Tomadoni et al. [34] observed that both control and ultrasound-treated strawberry juices increased phenolic compounds during storage in the refrigerator (0, 3, 7, and 10 days). The authors concluded that the changes that caused senescence and decomposition of the cell structure and, consequently, the release of free phenolic acids and free amino acids, may contribute to the increase in polyphenol contents [34]. Finally, the results on the influence of storage on CT are consistent with the results of Lukić et al. [53], who found no statistically significant influence of storage times of 3 and 6 months on the content of total tannins in HPU-treated red wine (700 W, 20 kHz).

2.3. Optimization of HPU Parameters for Strawberry Juice Treatment

Strawberry is an important fruit used for juicing due to its health-promoting bioactive constituents and potential health effects [2]. However, processing and storage conditions may play an important role in the bioavailability of these health-promoting compounds [58]. A previous study suggests that strawberry juices have increased levels of anthocyanins and other phenolic components from strawberry after processing by means of innovative technologies, exhibiting larger amounts compared to the untreated samples. This is suggested to be related to increased matrix disruption and extractability from the matrix, thus liberating bioactive compounds and making them more available for digestion [59]. Therefore, processing parameters and storage conditions must be optimized to ensure the highest quality of stored juices to provide potential health-benefits.
Numerous studies have already been conducted showing the negative influence of temperature on bioactive compounds such as total phenols, anthocyanins, flavonoids, vitamin C and others [27,60,61]. Since temperature changes are crucial for maintaining nutrient content and bioactive value in juices, we wanted to find out how temperature change (ΔT) relates to other HPU parameters. As shown in Table 5, ΔT ranged from 4 to even 54 °C during HPU processing. It is evident that this is a wide temperature range that certainly has an impact on the quality of the treated juices.
From Table 6, it can be seen that ΔT was strongly positively associated with all HPU parameters, namely: energy, power, pulse, amplitudes, and frequency. The only exception was the length of treatment time, which showed the same pattern as the other HPU parameters, except that the correlation was slightly weaker. The increase in amplitude correlated positively (0.59) with temperature change. All other relationships are listed in the same table. In the study of Margean et al. [62], by changing the amplitude parameter from 50 to 70%, an increase in temperature was observed in red grape juice during HPU treatment (750 W, 20 kHz).
Considering that temperature changes correlated with HPU parameters, Table 7 shows the optimal temperature changes (ΔT) and the optimal degree of ripeness at which the maximum content of bioactive compounds is reached. Thus, the highest content of total phenolic compounds (TPC) and FL, respectively, 102.96 mg 100 mL−1 and 2.68 mg 100 mL−1, can be obtained from fruits with a ripening degree of 75% and a temperature change of 4 °C.
Relating the optimal temperature to the applied HPU treatment parameters (Table 5), it can be observed that a temperature change of 4 °C corresponds to the HPU parameters amplitude 25%, pulse 50%, and treatment duration 10 min, at which the highest values of TPC, FL, and CT were obtained. From this it is clear that higher temperatures do not favor the content of TPC, FL and CT. These results agree with the study of Jabbar et al. [63], where with an increase in temperature from 20 to 60 °C during thermosonication, a significant decrease in the content of TPC, FL and CT in carrot juice was observed. Similar results were obtained by Dundar et al. [64], in which increasing the temperature from 25 to 75 °C during ultrasonication negatively affected the content of total phenols in cloudy strawberry nectar, more specifically, the highest TPC yield of 779.8 mg L−1 was obtained at a temperature of 25 °C.
Wahia et al. [65] optimized the thermosonication of orange juice in the temperature range of 45–70 °C and found that the optimal parameters with the highest content of total phenols were 495.34 mg 100 mL−1 at a temperature of 49.53 °C, a treatment time of 28.87 min and a frequency of 20.85 kHz. On the other hand, Pokhrel et al. [66] did not observe any statistically significant effect of temperature (50–58 °C) during ultrasound treatment on the content of total phenols in carrot juice.
In contrast to TPC, FL, and CT, the maximum contents of ANT and HCA, 15.58 mg 100 mL−1 and 14.14 mg 100 mL−1, respectively, were measured at significantly higher temperature changes, 35.41 °C and 36.77 °C, of fully ripe fruit (Table 7). Again, comparing the temperature change with the applied HPU parameters from Table 5 and interpolating, we obtained that the highest values of ANT and HCA were obtained at a pulse of 100% and a treatment time of 5 min with different amplitudes of 70.5% and 88.5%, respectively.
Margean et al. [62] confirmed that the HCA content in red grape juice increases with an increase in amplitude from 50 to 70% as well as temperature. As can be seen from the results, HCA and ANT gave higher yields at higher temperatures. This is confirmed by the studies of Dundar et al. [64] who observed the highest ANT content in cloudy strawberry nectar during ultrasonic treatment at 50 °C.

3. Materials and Methods

3.1. Chemicals and Standards

HPLC 99% pure methanol obtained from Honeywell (Honeywell, Paris, France) was used as an extraction solvent, while Folin–Ciocalteau reagent obtained from Fisher Scientific (Fisher Scientific, Loughborough, UK) was used for spectrophotometric determination of total phenols. Hydrochloric acid (37%, w/w), sulfuric acid (96%, p.a.), sodium carbonate, anhydrous (99.5–100.5%), and formic acid (98%, p.a.) were obtained from Lachner (Lachner s.r.o., Neratovice, Czech Republic). Ethanol (96% pure) was obtained from Gram-mol (Gram-mol d.o.o., Zagreb, Croatia). Quercetin (95%) and gallic acid standard (97.5–102.5%) were purchased from Acros Organics (Acros Organics, Guangzhou, China) and Sigma-Aldrich (Sigma-Aldrich Co., St. Louis, MO, USA). Vanillin (99%), potassium chloride (99.0–100.5%), sodium acetate anhydride (99%), and chlorogenic acid (min. 95%) were purchased from Thermo Fisher (Thermo Fisher GmbH, Kandel, Germany).

3.2. Production of Strawberry Juice

Strawberry fruits (Fragaria x ananassa Duch, cv. ‘Albion’) were grown and harvested in 2021 at Jagodar HB, Donja Lomnica, Croatia. Fruits were harvested at two different ripening stages: (i) 75% ripe fruits, i.e., technological ripening (F1), and (ii) 100% ripe fruits, i.e., consumption ripening stage (F2). After harvest, fruits were delivered to the laboratory, cleaned (stems were removed, washed with tap water and dried with cellulose) and stored in plastic containers at −18 °C until processing. Strawberries were thawed overnight in the refrigerator before processing into juices. Juices (J1 and J2) were prepared from fruits of the corresponding ripeness level (F1 and F2) by cold pressing in a Kuvings B6000 Slow Juicer (VerVita d.o.o., Zagreb, Croatia). The prepared juices were immediately subjected to HPU treatment as described in Section 3.3. All juices were filled into hermetically sealed sterile glass bottles.

3.3. High Power Ultrasound (HPU) Processing of Strawberry Juice

Strawberry juice samples were treated with high-power ultrasound on a Hielscher UP400St device (Hielscher Ultrasonics GmbH, Teltow, Germany). The UP400St device consists of a digital ultrasound processor, titanium DN22 (546 mm2) sonotrode, a stainless-steel base, and an acrylic glass soundproof box. The maximum power of the UP400St ultrasonic processor is 400 W, the amplitude is adjustable from 20 to 100%, the pulse from 10 to 100%, and the treatment time is set manually in the range from 0.1 s to 99 days. The device also includes a digital thermometer with a range of −50 to 200 °C to measure the temperature of the sample before, during and after treatment.
The control samples were untreated juices, while the HPU samples were treated by varying the HPU parameters: amplitude (25, 50, 75 and 100%), pulse (50 and 100%), and treatment duration (5 and 10 min), according to the experimental design (Table 8). Juices were analyzed immediately after HPU treatment, and after storage at 4 °C for 7 days.

3.4. Extraction of Bioactive Compounds

The extraction of bioactive compounds from juices J1 and J2 was prepared according to a modified protocol from the literature [67]. Immediately before extraction, the juice samples were briefly homogenized using a vortex shaker (Grant Instruments Ltd., Cambs, UK). The extraction procedure was performed by pipetting 5 mL of a homogenized sample of strawberry juice into an Erlenmeyer flask and adding 20 mL of the extraction solvent (1% formic acid in 80% methanol, v/v). Then, the prepared mixture was extracted in an ultrasonic bath DT 514 H Sonorex Digitec 13.5 L (Bandelin electronic GmbH, Berlin, Germany) at 50 °C for 15 min. After extraction, the supernatants were filtered into 25 mL volumetric flasks and made up to the mark with extraction solvent and stored at 4 °C until analysis. All extracts were prepared in duplicates.

3.5. Determination of Total Phenolic Content (TPC)

A modified Follin–Ciocalteu method from the literature was used to determine the TPC [68]. Total phenols were determined by pipetting 400 µL of the extract (previously diluted 1:1 with the extraction solvent), 400 µL of the F.C. reagent (previously diluted 5× with distilled water), and 4 mL of a 7.5% sodium carbonate solution. The reaction mixture was allowed to stand at room temperature for 20 min and then the absorbance was measured at 725 nm using a LLG-uniSPEC 2 Spectrophotometer (Lab Logistics Group GmbH, Meckenheim, Germany). The determination for each sample was prepared in parallel. The TPC was calculated from a calibration curve prepared with different concentrations of gallic acid solutions (10–250 mg L−1), and results were expressed as mg gallic acid equivalent (GAE) per 100 g or 100 mL of sample.

3.6. Determination of Total Monomeric Anthocyanins (ANT)

The spectrophotometric pH differential method has been used to determine ANT [69]. Briefly, 1 mL of the extract was mixed with 4 mL of 0.4 M buffer pH 4.5 (sodium acetate buffer) and separated with 4 mL of 0.025 M buffer pH 1.0 (potassium chloride buffer). After standing for 20 min at room temperature, the absorbance of the reaction mixture was measured at 520 and 700 nm on a LLG-uniSPEC 2 Spectrophotometer (Lab Logistics Group GmbH, Meckenheim, Germany). Determination was prepared in parallel for each sample, and deionized water was used as a blank. According to the equation from the literature [69], the concentration of monomeric anthocyanins is expressed as pelargonidin-3-glucoside equivalent (Pg-3-G) (mg 100 mL−1).

3.7. Determination of Total Hydroxycinnamic Acids (HCA)

A modified spectrophotometric method described in the literature was used to determine HCA [70]. Briefly, 250 µL of solution 1 (1 g L−1 solution of HCl dissolved in 96% ethanol) and 4.55 mL of solution 2 (2 g L−1 HCl dissolved in distilled water) were added to 250 µL of the extract. After homogenization for 1 min with a vortex shaker (Grant Instruments Ltd., Cambs, UK), the reaction mixture was allowed to stand in the dark at room temperature for 30 min. Then, the color reaction was measured at 320 nm using a LLG-uniSPEC 2 Spectrophotometer (Lab Logistics Group GmbH, Meckenheim, Germany). For the blank, the determination procedure was identical, except that the extraction solvent was used instead of the extract. For each sample, the measurements were performed in parallel. A calibration curve was prepared from different concentrations of chlorogenic acid solutions (10–600 mg L−1), which was used to determine the HCA content in the extracts. The results were expressed as mg chlorogenic acid equivalent (CAE) per 100 g or 100 mL of the sample.

3.8. Determination of Total Flavonols (TF)

A modified spectrophotometric method described in the literature was used for the determination of TF [70]. Briefly, 250 µL of solution 1 (1 g L−1 HCl dissolved in 96% ethanol) and 4.55 mL of solution 2 (2 g L−1 HCl dissolved in distilled water) were added to 250 µL of the extract. After homogenization for 1 min with a vortex shaker (Grant Instruments Ltd., Cambs, UK), the reaction mixture was allowed to stand in the dark at room temperature for 30 min. Then, the color reaction was measured at 360 nm on a LLG-uniSPEC 2 Spectrophotometer (Lab Logistics Group GmbH, Meckenheim, Germany). For the blank, the determination procedure was identical, except that the extraction solvent was used instead of the extract. For each sample, the measurements were performed in parallel. A calibration curve was prepared from different concentrations of the quercetin solution (10–600 mg L−1) from which the content of FL in the extracts was determined. The results were expressed as mg quercetin equivalent (QE) per 100 g or 100 mL of the sample.

3.9. Determination of Condensed Tannins (CT)

A modified spectrophotometric method described in the literature was used to determine CT [71]. Briefly, 2.5 mL of reagent 1 (25% H2SO4 solution in methanol) and 1 mL of extract were added to 2.5 mL of reagent 2 (1% vanillin solution in methanol). After homogenization for 1 min with a vortex shaker (Grant Instruments Ltd., Cambs, UK), the reaction mixture was allowed to stand at room temperature for 10 min. The color reaction was then measured at 500 nm using a LLG-uniSPEC 2 Spectrophotometer (Lab Logistics Group GmbH, Meckenheim, Germany). For the blank, the determination procedure was identical, except that the extraction solvent was used instead of the extract. For each sample, measurements were performed in parallel. A calibration curve was generated from different concentrations of catechin solution (10–120 mg L−1) and the results were expressed as mg catechin equivalent (CA) per 100 g or 100 mL of the sample.

3.10. Statistical Analysis

Descriptive statistics were used for the characterization of the sample. Discrete variables were tested by MANOVA. Exploratory hierarchical Ward’s cluster analysis was used for measuring standardized similarities in samples. Nonparametric analysis employed the Kruskal–Wallis test. Pearson’s linear correlation tested the relation between the pairs of continuous variables. Linear regression was employed to build and compare mathematical models. The level of significance for all tests was α ≤ 0.05, and results were analyzed using SPSS software (v.22). Statgraphics Centurion XVII was used to build and compare mathematical models (Statpoint Technologies Inc., Warrenton, VI, USA).

4. Conclusions

HPU technology was used for the first time in producing functional strawberry juices from fruits with different degrees of ripeness. The results showed that strawberry fruit juices treated with HPU from fruits with 100% ripeness had higher contents of ANT, HCA, FL, and CT than juice samples from fruits with 75% ripeness, whereas the opposite trend was observed for TPC. Therefore, strawberry juices from both ripening stages are suitable for HPU treatment because they have a solid bioactive value.
When considering the influence of HPU treatment parameters, it was found that increasing all processing parameters (e.g., amplitude, pulse, treatment duration) generally negatively affected the examined bioactive compounds. A 7 day storage had a statistically positive effect on the content of HCA and FL in HPU-treated juice samples, a negative effect on TPC and ANT, while it did not affect CT. The same trend was observed in the untreated samples, except for TPC, where 7 days of storage had a positive effect on the content.
Since a wide range of temperature changes was observed during HPU treatment of strawberry juices, the analysis showed that they were significantly correlated with almost all HPU treatment parameters (e.g., amplitude, pulses, energy, power, and frequency). Consequently, the optimal HPU parameters for these compounds were an amplitude of 25%, a pulse of 50%, and a treatment duration of 10 min. Thus, combining a suitable fruit ripening stage and HPU treatment parameters with optimal temperature variations during the treatment would be possible to obtain a high content of bioactive compounds in the juices. Therefore, HPU technology has great potential for producing functional foods based on strawberry juices.

Author Contributions

Conceptualization, D.B.K., B.D. and P.P.; methodology, D.B.K., P.P., B.D. and B.P.; validation, A.B.M., B.P.,S.M., G.R. and L.L.; formal analysis, A.B.M., P.B. and D.B.; investigation, B.P., S.M., G.R. and L.L.; data curation, P.P.; writing—original draft preparation, A.B.M., D.B.K. and P.P.; writing—review and editing, B.D., D.B., P.B., G.R., P.P., L.L., B.P. and S.M.; visualization, D.B., P.B., P.P. and A.B.M.; supervision, D.B.K.; project administration, D.B.K.; funding acquisition, D.B.K. All authors have read and agreed to the published version of the manuscript.

Funding

This research was funded by the Croatian Science Foundation through the funding of the Hurdle Technology and 3D Printing for Sustainable Fruit Juice Processing and Preservation project, IP-2019–04-2105. The work of doctoral student Anica Bebek Markovinović has been fully supported by the “Young researchers’ career development project—training of doctoral students” of the Croatian Science Foundation (DOK-2020–01). The authors thank the “Romeo ed Enrica Invernizzi” foundation (Milan, Italy) for kindly supporting the metabolomics facility at Università Cattolica del Sacro Cuore.

Institutional Review Board Statement

Not applicable.

Informed Consent Statement

Not applicable.

Data Availability Statement

Not applicable.

Conflicts of Interest

The authors declare no conflict of interest.

Sample Availability

Not applicable.

References

  1. Basu, A.; Nguyen, A.; Betts, N.M.; Lyons, T.J. Strawberry as a functional food: An evidence-based review. Crit. Rev. Food Sci. Nutr. 2013, 54, 790–806. [Google Scholar] [CrossRef] [PubMed]
  2. Miller, K.; Feucht, W.; Schmid, M. Bioactive compounds of strawberry and blueberry and their potential health effects based on human intervention studies: A brief overview. Nutrients 2019, 11, 1510. [Google Scholar] [CrossRef] [PubMed] [Green Version]
  3. Baby, B.; Antony, P.; Vijayan, R. Antioxidant and anticancer properties of berries. Crit. Rev. Food Sci. Nutr. 2017, 58, 2491–2507. [Google Scholar] [CrossRef] [PubMed]
  4. Tomašević, I.; Putnik, P.; Valjak, F.; Pavlić, B.; Šojić, B.; Bebek Markovinović, A.; Bursać Kovačević, D. 3d printing as novel tool for fruit-based functional food production. Curr. Opin. Food Sci. 2021, 41, 138–145. [Google Scholar] [CrossRef]
  5. Žuntar, I.; Petric, Z.; Bursać Kovačević, D.; Putnik, P. Safety of probiotics: Functional fruit beverages and nutraceuticals. Foods 2020, 9, 947. [Google Scholar] [CrossRef]
  6. Granato, D.; Barba, F.J.; Bursać Kovačević, D.; Lorenzo, J.M.; Cruz, A.G.; Putnik, P. Functional foods: Product development, technological trends, efficacy testing, and safety. Annu. Rev. Food Sci. Technol. 2020, 11, 93–118. [Google Scholar] [CrossRef] [Green Version]
  7. Giampieri, F.; Forbes-Hernandez, T.Y.; Gasparrini, M.; Alvarez-Suarez, J.M.; Afrin, S.; Bompadre, S.; Quiles, J.L.; Mezzetti, B.; Battino, M. Strawberry as a health promoter: An evidence-based review. Food Funct. 2015, 6, 1386–1398. [Google Scholar] [CrossRef] [Green Version]
  8. Kowaleski, J.; Quast, L.B.; Steffens, J.; Lovato, F.; Rodrigues dos Santos, L.; Zambiazi da Silva, S.; Maschio de Souza, D.; Felicetti, M.A. Functional yogurt with strawberries and chia seeds. Food Biosci. 2020, 37, 100726. [Google Scholar] [CrossRef]
  9. Balthazar, C.F.; Santillo, A.; Guimarães, J.T.; Capozzi, V.; Russo, P.; Caroprese, M.; Marino, R.; Esmerino, E.A.; Raices, R.S.L.; Silva, M.C.; et al. Novel milk–juice beverage with fermented sheep milk and strawberry (fragaria × ananassa): Nutritional and functional characterization. J. Dairy Sci. 2019, 102, 10724–10736. [Google Scholar] [CrossRef] [Green Version]
  10. Korus, J.; Juszczak, L.; Ziobro, R.; Witczak, M.; Grzelak, K.; SÓJka, M. Defatted strawberry and blackcurrant seeds as functional ingredients of gluten-free bread. J. Texture Stud. 2012, 43, 29–39. [Google Scholar] [CrossRef]
  11. Zhao, Z.; Wu, X.; Chen, H.; Liu, Y.; Xiao, Y.; Chen, H.; Tang, Z.; Li, Q.; Yao, H. Evaluation of a strawberry fermented beverage with potential health benefits. PeerJ 2021, 9, e11974. [Google Scholar] [CrossRef]
  12. Guo, L.; Li, K.; Kang, J.S.; Kang, N.J.; Son, B.G.; Choi, Y.W. Strawberry fermentation with Cordyceps militaris has anti-adipogenesis activity. Food Biosci. 2020, 35, 100576. [Google Scholar] [CrossRef]
  13. Özbek, T.; Şahin-Yeşilçubuk, N.; Demirel, B. Quality and nutritional value of functional strawberry marmalade enriched with chia seed (Salvia hispanica L.). J. Food Qual. 2019, 2019, 1–8. [Google Scholar] [CrossRef] [Green Version]
  14. Ali, M.R.; Mohamed, R.M.; Abedelmaksoud, T.G. Functional strawberry and red beetroot jelly candies rich in fibers and phenolic compounds. Food Syst. 2021, 4, 82–88. [Google Scholar] [CrossRef]
  15. Cassani, L.; Tomadoni, B.; Moreira, M.R.; Agüero, M.V. Improving quality parameters of functional strawberry juices: Optimization of prebiotic fiber enrichment and geraniol treatment. Food Bioprocess Technol. 2018, 11, 2110–2124. [Google Scholar] [CrossRef]
  16. Soliman, Z.; Mekky, T.M.; Zeid, M.H. Production of functional drinks from blood orange and strawberry. J. Home Econ. 2015, 25, 131–148. [Google Scholar]
  17. Moscovici Joubran, A.; Katz, I.H.; Okun, Z.; Davidovich-Pinhas, M.; Shpigelman, A. The effect of pressure level and cycling in high-pressure homogenization on physicochemical, structural and functional properties of filtered and non-filtered strawberry nectar. Innov. Food Sci. Emerg. Technol. 2019, 57, 102203. [Google Scholar] [CrossRef]
  18. Santhi, V.P.; Sriramavaratharajan, V.; Murugan, R.; Masilamani, P.; Gurav, S.S.; Sarasu, V.P.; Parthiban, S.; Ayyanar, M. Edible fruit extracts and fruit juices as potential source of antiviral agents: A review. J. Food Meas. Charact. 2021, 15, 5181–5190. [Google Scholar] [CrossRef]
  19. Available online: https://www.grandviewresearch.com/industry-analysis/fruit-vegetable-juice-market (accessed on 14 September 2022).
  20. Šamec, D.; Maretić, M.; Lugarić, I.; Mešić, A.; Salopek-Sondi, B.; Duralija, B. Assessment of the differences in the physical, chemical and phytochemical properties of four strawberry cultivars using principal component analysis. Food Chem. 2016, 194, 828–834. [Google Scholar] [CrossRef]
  21. Voća, S.; Duralija, B.; Družić, J.; Skendrović-Babojelić, M.; Dobričević, N.; Čmelik, Z. Influence of cultivation systems on physical and chemical composition of strawberry fruits cv. Elsanta. Agric. Conspec. Sci. 2006, 71, 171–174. [Google Scholar]
  22. Azam, M.; Ejaz, S.; Naveed Ur Rehman, R.; Khan, M.; Qadri, R. Postharvest quality management of strawberries. In Strawberry—Pre- and Post-Harvest Management Techniques for Higher Fruit Quality; Toshiki, A., Md, A., Eds.; IntechOpen: London, UK, 2019; pp. 1–21. [Google Scholar] [CrossRef] [Green Version]
  23. Bebek Markovinović, A.; Putnik, P.; Duralija, B.; Krivohlavek, A.; Ivešić, M.; Mandić Andačić, I.; Palac Bešlić, I.; Pavlić, B.; Lorenzo, J.M.; Bursać Kovačević, D. Chemometric valorization of strawberry (fragaria × ananassa duch.) cv. ‘Albion’ for the production of functional juice: The impact of physicochemical, toxicological, sensory, and bioactive value. Foods 2022, 11, 640. [Google Scholar] [CrossRef] [PubMed]
  24. Bursać Kovačević, D.; Brdar, D.; Fabečić, P.; Barba, F.J.; Lorenzo, J.M.; Putnik, P. Strategies to achieve a healthy and balanced diet: Fruits and vegetables as a natural source of bioactive compounds. In Agri-Food Industry Strategies for Healthy Diets and Sustainability; Barba, F.J., Putnik, P., Bursać Kovačević, D., Eds.; Academic Press: Cambridge, MA, USA, 2020; pp. 51–88. [Google Scholar]
  25. Teribia, N.; Buvé, C.; Bonerz, D.; Aschoff, J.; Hendrickx, M.; Loey, A.V. Effect of cultivar, pasteurization and storage on the volatile and taste compounds of strawberry puree. LWT 2021, 150, 112007. [Google Scholar] [CrossRef]
  26. Bursać Kovačević, D.; Putnik, P.; Dragović-Uzelac, V.; Vahčić, N.; Babojelić, M.S.; Levaj, B. Influences of organically and conventionally grown strawberry cultivars on anthocyanins content and color in purees and low-sugar jams. Food Chem. 2015, 181, 94–100. [Google Scholar] [CrossRef] [PubMed]
  27. Hartmann, A.; Patz, C.-D.; Andlauer, W.; Dietrich, H.; Ludwig, M. Influence of processing on quality parameters of strawberries. J. Agric. Food Chem. 2008, 56, 9484–9489. [Google Scholar] [CrossRef] [PubMed]
  28. Aguiló-Aguayo, I.; Oms-Oliu, G.; Soliva-Fortuny, R.; Martín-Belloso, O. Changes in quality attributes throughout storage of strawberry juice processed by high-intensity pulsed electric fields or heat treatments. LWT—Food Sci. Technol. 2009, 42, 813–818. [Google Scholar] [CrossRef]
  29. Chemat, F.; Rombaut, N.; Sicaire, A.-G.; Meullemiestre, A.; Fabiano-Tixier, A.-S.; Abert-Vian, M. Ultrasound assisted extraction of food and natural products. Mechanisms, techniques, combinations, protocols and applications. A review. Ultrason. Sonochem. 2017, 34, 540–560. [Google Scholar] [CrossRef]
  30. Chemat, F.; Zille, H.; Khan, M.K. Applications of ultrasound in food technology: Processing, preservation and extraction. Ultrason. Sonochem. 2011, 18, 813–835. [Google Scholar] [CrossRef]
  31. Dimić, I.; Teslić, N.; Putnik, P.; Bursać Kovačević, D.; Zeković, Z.; Šojić, B.; Mrkonjić, Ž.; Čolović, D.; Montesano, D.; Pavlić, B. Innovative and conventional valorizations of grape seeds from winery by-products as sustainable source of lipophilic antioxidants. Antioxidants 2020, 9, 568. [Google Scholar] [CrossRef]
  32. Dolas, R.; Saravanan, C.; Kaur, B.P. Emergence and era of ultrasonic’s in fruit juice preservation: A review. Ultrason. Sonochem. 2019, 58, 104609. [Google Scholar] [CrossRef]
  33. Bhat, R.; Goh, K.M. Sonication treatment convalesce the overall quality of hand-pressed strawberry juice. Food Chem. 2017, 215, 470–476. [Google Scholar] [CrossRef]
  34. Tomadoni, B.; Cassani, L.; Viacava, G.; Moreira, M.D.R.; Ponce, A. Effect of ultrasound and storage time on quality attributes of strawberry juice. J. Food Process Eng. 2017, 40, e12533. [Google Scholar] [CrossRef]
  35. Wang, J.; Wang, J.; Ye, J.; Vanga, S.K.; Raghavan, V. Influence of high-intensity ultrasound on bioactive compounds of strawberry juice: Profiles of ascorbic acid, phenolics, antioxidant activity and microstructure. Food Control 2019, 96, 128–136. [Google Scholar] [CrossRef]
  36. Yildiz, G.; Aadil, R.M. Comparison of high temperature-short time and sonication on selected parameters of strawberry juice during room temperature storage. J. Food Sci. Technol. 2019, 57, 1462–1468. [Google Scholar] [CrossRef]
  37. Bebek Markovinović, A.; Putnik, P.; Stulić, V.; Batur, L.; Duralija, B.; Pavlić, B.; Vukušić Pavičić, T.; Herceg, Z.; Bursać Kovačević, D. The application and optimization of hipef technology in the processing of juice from strawberries harvested at two stages of ripeness. Foods 2022, 11, 1997. [Google Scholar] [CrossRef]
  38. Aubert, C.; Bruaut, M.; Chalot, G.; Cottet, V. Impact of maturity stage at harvest on the main physicochemical characteristics, the levels of vitamin c, polyphenols and volatiles and the sensory quality of gariguette strawberry. Eur. Food Res. Technol. 2020, 247, 37–49. [Google Scholar] [CrossRef]
  39. Cruz-Cansino, N.D.S.; Ramírez-Moreno, E.; León-Rivera, J.E.; Delgado-Olivares, L.; Alanis-Garcia, E.; Ariza-Ortega, J.A.; Manriquez-Torres, J.D.J.; Jaramillo-Bustor, D.P. Shelf life, physicochemical, microbiological and antioxidant properties of purple cactus pear (opuntia ficus indica) juice after thermoultrasound treatment. Ultrason. Sonochem. 2015, 27, 277–286. [Google Scholar] [CrossRef]
  40. Abid, M.; Jabbar, S.; Wu, T.; Hashim, M.M.; Hu, B.; Lei, S.; Zhang, X.; Zeng, X. Effect of ultrasound on different quality parameters of apple juice. Ultrason. Sonochem. 2013, 20, 1182–1187. [Google Scholar] [CrossRef]
  41. Kataoka, H. New trends in sample preparation for analysis of plant-derived medicines. Curr. Org. Chem. 2010, 14, 1698–1713. [Google Scholar] [CrossRef]
  42. Bautista-Ortín, A.B.; Jiménez-Martínez, M.D.; Jurado, R.; Iniesta, J.A.; Terrades, S.; Andrés, A.; Gómez-Plaza, E. Application of high-power ultrasounds during red wine vinification. Int. J. Food Sci. Technol. 2017, 52, 1314–1323. [Google Scholar] [CrossRef]
  43. Plaza, E.G.; Jurado, R.; Iniesta, J.A.; Bautista-Ortín, A.B. High power ultrasounds: A powerful, non-thermal and green technique for improving the phenolic extraction from grapes to must during red wine vinification. BIO Web Conf. 2019, 12, 02001. [Google Scholar] [CrossRef]
  44. Wei, M.; Wang, H.; Ma, T.; Ge, Q.; Fang, Y.; Sun, X. Comprehensive utilization of thinned unripe fruits from horticultural crops. Foods 2021, 10, 2043. [Google Scholar] [CrossRef] [PubMed]
  45. Pradas, I.; Medina, J.J.; Ortiz, V.; Moreno-Rojas, J.M. ‘Fuentepina’ and ‘amiga’, two new strawberry cultivars: Evaluation of genotype, ripening and seasonal effects on quality characteristics and health-promoting compounds. J. Berry Res. 2015, 5, 157–171. [Google Scholar] [CrossRef] [Green Version]
  46. Muche, B.M.; Speers, R.A.; Rupasinghe, H.P.V. Storage temperature impacts on anthocyanins degradation, color changes and haze development in juice of “merlot” and “ruby” grapes (Vitis vinifera). Front. Nutr. 2018, 5, 100. [Google Scholar] [CrossRef] [PubMed]
  47. Su, D.; Wang, Z.; Dong, L.; Huang, F.; Zhang, R.; Jia, X.; Wu, G.; Zhang, M. Impact of thermal processing and storage temperature on the phenolic profile and antioxidant activity of different varieties of lychee juice. Lwt 2019, 116, 108578. [Google Scholar] [CrossRef]
  48. Bursać Kovačević, D.; Bilobrk, J.; Buntić, B.; Bosiljkov, T.; Karlović, S.; Rocchetti, G.; Lucini, L.; Barba, F.J.; Lorenzo, J.M.; Putnik, P. High-power ultrasound altered the polyphenolic content and antioxidant capacity in cloudy apple juice during storage. J. Food Process. Preserv. 2019, 43, e14023. [Google Scholar] [CrossRef]
  49. Pala, Ç.U.; Zorba, N.N.D.; ÖZcan, G. Microbial inactivation and physicochemical properties of ultrasound processed pomegranate juice. J. Food Prot. 2015, 78, 531–539. [Google Scholar] [CrossRef]
  50. Tiwari, B.K.; O’Donnell, C.P.; Patras, A.; Cullen, P.J. Anthocyanin and ascorbic acid degradation in sonicated strawberry juice. J. Agric. Food Chem. 2008, 56, 10071–10077. [Google Scholar] [CrossRef]
  51. Tiwari, B.K.; O’Donnell, C.P.; Patras, A.; Brunton, N.; Cullen, P.J. Stability of anthocyanins and ascorbic acid in sonicated strawberry juice during storage. Eur. Food Res. Technol. 2008, 228, 717–724. [Google Scholar] [CrossRef]
  52. Suslick, K.S. The chemical effects of ultrasound. Sci. Am. 1989, 260, 80–86. [Google Scholar] [CrossRef]
  53. Lukić, K.; Brnčić, M.; Ćurko, N.; Tomašević, M.; Valinger, D.; Denoya, G.I.; Barba, F.J.; Ganić, K.K. Effects of high power ultrasound treatments on the phenolic, chromatic and aroma composition of young and aged red wine. Ultrason. Sonochem. 2019, 59, 104725. [Google Scholar] [CrossRef]
  54. Celotti, E.; Stante, S.; Ferraretto, P.; Román, T.; Nicolini, G.; Natolino, A. High power ultrasound treatments of red young wines: Effect on anthocyanins and phenolic stability indices. Foods 2020, 9, 1344. [Google Scholar] [CrossRef]
  55. Fonteles, T.V.; Costa, M.G.M.; de Jesus, A.L.T.; de Miranda, M.R.A.; Fernandes, F.A.N.; Rodrigues, S. Power ultrasound processing of cantaloupe melon juice: Effects on quality parameters. Food Res. Int. 2012, 48, 41–48. [Google Scholar] [CrossRef]
  56. Costa, M.G.M.; Fonteles, T.V.; de Jesus, A.L.T.; Almeida, F.D.L.; de Miranda, M.R.A.; Fernandes, F.A.N.; Rodrigues, S. High-intensity ultrasound processing of pineapple juice. Food Bioprocess Technol. 2011, 6, 997–1006. [Google Scholar] [CrossRef]
  57. Jiang, B.; Mantri, N.; Hu, Y.; Lu, J.; Jiang, W.; Lu, H. Evaluation of bioactive compounds of black mulberry juice after thermal, microwave, ultrasonic processing, and storage at different temperatures. Food Sci. Technol. Int. 2014, 21, 392–399. [Google Scholar] [CrossRef]
  58. Cassani, L.; Gerbino, E.; Moreira, M.d.R.; Gómez-Zavaglia, A. Influence of non-thermal processing and storage conditions on the release of health-related compounds after in vitro gastrointestinal digestion of fiber-enriched strawberry juices. J. Funct. Foods 2018, 40, 128–136. [Google Scholar] [CrossRef]
  59. Stübler, A.-S.; Lesmes, U.; Juadjur, A.; Heinz, V.; Rauh, C.; Shpigelman, A.; Aganovic, K. Impact of pilot-scale processing (thermal, PEF, HPP) on the stability and bioaccessibility of polyphenols and proteins in mixed protein- and polyphenol-rich juice systems. Innov. Food Sci. Emerg. Technol. 2020, 64, 102426. [Google Scholar] [CrossRef]
  60. Nadeem, M.; Ubaid, N.; Qureshi, T.M.; Munir, M.; Mehmood, A. Effect of ultrasound and chemical treatment on total phenol, flavonoids and antioxidant properties on carrot-grape juice blend during storage. Ultrason. Sonochem. 2018, 45, 1–6. [Google Scholar] [CrossRef]
  61. Igual, M.; García-Martínez, E.; Camacho, M.M.; Martínez-Navarrete, N. Effect of thermal treatment and storage on the stability of organic acids and the functional value of grapefruit juice. Food Chem. 2010, 118, 291–299. [Google Scholar] [CrossRef]
  62. Margean, A.; Lupu, M.I.; Alexa, E.; Padureanu, V.; Canja, C.M.; Cocan, I.; Negrea, M.; Calefariu, G.; Poiana, M.-A. An overview of effects induced by pasteurization and high-power ultrasound treatment on the quality of red grape juice. Molecules 2020, 25, 1669. [Google Scholar] [CrossRef] [Green Version]
  63. Jabbar, S.; Abid, M.; Hu, B.; Hashim, M.M.; Lei, S.; Wu, T.; Zeng, X. Exploring the potential of thermosonication in carrot juice processing. J. Food Sci. Technol. 2015, 52, 7002–7013. [Google Scholar] [CrossRef]
  64. Dündar, B.; Ağçam, E.; Akyıldız, A. Optimization of thermosonication conditions for cloudy strawberry nectar with using of critical quality parameters. Food Chem. 2019, 276, 494–502. [Google Scholar] [CrossRef] [PubMed]
  65. Wahia, H.; Zhou, C.; Sarpong, F.; Mustapha, A.T.; Liu, S.; Yu, X.; Li, C. Simultaneous optimization of Alicyclobacillus acidoterrestris reduction, pectin methylesterase inactivation, and bioactive compounds enhancement affected by thermosonication in orange juice. J. Food Process. Preserv. 2019, 43, e14180. [Google Scholar] [CrossRef]
  66. Pokhrel, P.R.; Bermúdez-Aguirre, D.; Martínez-Flores, H.E.; Garnica-Romo, M.G.; Sablani, S.; Tang, J.; Barbosa-Cánovas, G.V. Combined effect of ultrasound and mild temperatures on the inactivation of E. coli in fresh carrot juice and changes on its physicochemical characteristics. J. Food Sci. 2017, 82, 2343–2350. [Google Scholar] [CrossRef] [PubMed]
  67. Bursać Kovačević, D.; Putnik, P.; Dragović-Uzelac, V.; Pedisić, S.; Režek Jambrak, A.; Herceg, Z. Effects of cold atmospheric gas phase plasma on anthocyanins and color in pomegranate juice. Food Chem. 2016, 190, 317–323. [Google Scholar] [CrossRef]
  68. Yuan, B.; Danao, M.-G.C.; Stratton, J.E.; Weier, S.A.; Weller, C.L.; Lu, M. High pressure processing (hpp) of aronia berry purée: Effects on physicochemical properties, microbial counts, bioactive compounds, and antioxidant capacities. Innov. Food Sci. Emerg. Technol. 2018, 47, 249–255. [Google Scholar] [CrossRef]
  69. Lee, J.; Durst, R.W.; Wrolstad, R.E. Determination of total monomeric anthocyanin pigment content of fruit juices, beverages, natural colorants, and wines by the ph differential method: Collaborative study. J. AOAC Int. 2005, 88, 1269–1278. [Google Scholar] [CrossRef] [Green Version]
  70. Howard, L.R.; Clark, J.R.; Brownmiller, C. Antioxidant capacity and phenolic content in blueberries as affected by genotype and growing season. J. Sci. Food Agric. 2003, 83, 1238–1247. [Google Scholar] [CrossRef]
  71. Sun, B.; Ricardo-da-Silva, J.M.; Spranger, I. Critical factors of vanillin assay for catechins and proanthocyanidins. J. Agric. Food Chem. 1998, 46, 4267–4274. [Google Scholar] [CrossRef]
Figure 1. Results of the hierarchical cluster analysis of averaged and standardized samples.
Molecules 28 00138 g001
Table 1. Average values for analytical parameters in untreated samples (control).
MaturityTPCANTHCAFLCT
75%93.62 ± 1.998.99 ± 0.1310.56 ± 0.681.77 ± 0.6870.65 ± 1.53
100%96.18 ± 3.8117.84 ± 0.3116.66 ± 0.712.44 ± 0.8288.75 ± 1.60
Results are expressed as the mean ± STD for control samples in mg 100 mL−1; TPC—total phenolic compounds; ANT—monomeric anthocyanins; HCA—hydroxycinnamic acids; FL—flavonols; CT—condensed tannins.
Table 2. Kruskal–Wallis test statistics for the HPU vs. control samples.
Bioactive CompoundTreatmentMean RankChi-SquareSignificance
TPCControl
HPU
2.50
32.5
2.5280.11
ANTControl
HPU
2.50
32.5
1.8380.18
HCAControl
HPU
2.50
32.5
0.6330.43
FLControl
HPU
2.50
32.5
1.4160.23
CTControl
HPU
2.50
32.5
4.1340.04
Results are expressed as the mean rank for control vs. HPU samples mg 100 mL−1; TPC—total phenolic compounds; ANT—monomeric anthocyanins; HCA—hydroxycinnamic acids; FL—flavonols; CT—condensed tannins.
Table 3. Changes in the bioactive compounds in control juice samples during storage.
VariablenTPCANTHCAFLCT
Maturity4p ≤ 0.01 p ≤ 0.01 p ≤ 0.01 p = 0.06 p ≤ 0.01
75%4103.1 ± 1.26 a8.84 ± 0.09 b11.71 ± 0.24 b2.25 ± 0.55 a75.56 ± 0.91 b
100%490.73 ± 1.26 b17.21 ± 0.09 a17.76 ± 0.24 a4.27 ± 0.55 a86.54 ± 0.91 a
Storage p = 0.09 p ≤ 0.01 p ≤ 0.01 p = 0.02 p = 0.10
0 days494.90 ± 1.26 a13.42 ± 0.09 a13.61 ± 0.24 b2.11 ± 0.55 b79.70 ± 0.91 a
7 days498.94 ± 1.26 a12.63 ± 0.09 b15.86 ± 0.24 a4.41 ± 0.55 a82.39 ± 0.91 a
Dataset average896.92 ± 0.8913.023 ± 0.0914.74 ± 0.173.26 ± 0.3981.05 ± 0.64
The results are expressed as the mean ± standard error in mg 100 mL−1. Values represented with different letters in a column are statistically different at p ≤ 0.05. significant factor in multifactor analysis. not significant factor in multifactor analysis. TPC—total phenolic content; ANT—monomeric anthocyanins; HCA—total hydroxycinnamic acids; FL—flavonols; CT—condensed tannins.
Table 4. Changes in the bioactive compounds in juice samples under HPU during storage.
VariablenTPCANTHCAFLCT
Maturity p ≤ 0.01 p ≤ 0.01 p ≤ 0.01 p ≤ 0.01 p ≤ 0.01
75%6492.61 ± 0.49 a8.22 ± 0.03 b10.66 ± 0.08 b2.06 ± 0.11 b67.23 ± 0.21 b
100%6478.59 ± 0.49 b15.02 ± 0.03 a14.92 ± 0.08 a2.94 ± 0.11 a70.48 ± 0.21 a
Amplitude p ≤ 0.01 p ≤ 0.01 p ≤ 0.01 p = 0.91 p ≤ 0.01
25%3289.08 ± 0.69 a12.14 ± 0.04 a13.24 ± 0.12 a2.57 ± 0.16 a73.56 ± 0.30 a
50%3286.22 ± 0.69 b11.48 ± 0.04 b12.83 ± 0.12 b2.54 ± 0.16 a68.87 ± 0.30 b
75%3282.16 ± 0.69 c11.60 ± 0.04 c12.66 ± 0.12 b,c2.42 ± 0.16 a67.76 ± 0.30 c
100%3284.94 ± 0.69 b11.27 ± 0.04 d12.44 ± 0.12 c2.47 ± 0.16 a65.23 ± 0.30 d
Pulse p = 0.02 p ≤ 0.01 p = 0.19 p = 0.05 p ≤ 0.01
50%6484.88 ± 0.49 b11.71 ± 0.03 a12.86 ± 0.08 a2.66 ± 0.12 a69.30 ± 0.21 a
100%6486.32 ± 0.49 a11.53 ± 0.03 b12.72 ± 0.08 a2.34 ± 0.12 b68.41 ± 0.21 b
Treatment time p = 0.09 p ≤ 0.01 p = 0.49 p ≤ 0.01 p ≤ 0.01
5 min6484.97 ± 0.49 a11.75 ± 0.03 a12.75 ± 0.08 a2.75 ± 0.12 a69.38 ± 0.21 a
10 min6486.23 ± 0.49 a11.50 ± 0.03 b12.83 ± 0.08 a2.26 ± 0.12 b68.33 ± 0.21 b
Storage p ≤ 0.01 p ≤ 0.01 p ≤ 0.01 p ≤ 0.01 p = 0.54
0 days6487.25 ± 0.49 a12.03 ± 0.03 a12.41 ± 0.08 b1.81 ± 0.11 b68.76 ± 0.21 a
7 days6483.95 ± 0.49 b11.21 ± 0.03 b13.18 ± 0.08 a3.20 ± 0.11 a68.95 ± 0.21 a
Dataset average12885.60 ± 0.3411.62 ± 0.0212.79 ± 0.052.50 ± 0.0868.55 ± 0.15
The results are expressed as the mean ± standard error in mg 100 mL−1. Values represented with different letters in a column are statistically different at p ≤ 0.05. significant factor in multifactor analysis. not significant factor in multifactor analysis. TPC—total phenolic content; ANT—monomeric anthocyanins; HCA—total hydroxycinnamic acids; FL—flavonols; CT—condensed tannins.
Table 5. HPU treatment parameters.
Amplitudes (%)Pulse (%)Treatment Time (min)Energy (Wh)Power (W)Frequency (kHz)ΔT
(°C)
25.050.010.02.940.023.74.0
25.050.05.01.542.023.78.0
25.050.010.03.042.023.612.0
50.050.010.03.578.023.714.0
50.050.05.01.971.023.715.0
50.050.010.03.771.023.816.0
25.050.05.01.545.023.617.0
25.0100.05.03.544.023.818.0
66.766.76.73.778.723.719.0
50.0100.05.06.690.023.821.0
37.575.07.54.452.523.722.0
25.0100.05.03.838.023.623.0
75.050.05.02.285.023.825.0
100.050.07.53.188.023.826.0
75.050.010.04.285.023.829.0
75.0100.05.010.0133.023.831.0
75.050.010.04.474.023.833.0
75.075.010.07.976.023.834.0
100.0100.05.011.5177.023.835.0
50.0100.05.06.693.023.836.0
100.0100.05.011.1166.023.837.0
50.0100.010.012.890.023.846.0
75.0100.07.513.5129.023.849.0
100.0100.010.020.8177.023.850.0
75.0100.010.016.4128.023.851.0
100.0100.010.019.9176.023.854.0
Table 6. Pearson Correlations for HPU parameters.
ΔT
(°C)
Amplitudes (%)Pulse (%)Treatment
Time (min)
Energy (Wh)Power
(W)
Frequency (kHz)
ΔT (°C)10.59 0.61 0.22 0.85 0.76 0.52
Amplitudes (%) 1000.39 0.79 0.65
Pulse (%) 100.73 0.44 0.13
Treatment time (min) 10.37 −0.02 −0.10
Energy (Wh) 10.76 0.31
Power (W) 10.58
Frequency (kHz) 1
Values represented are Pearson Correlations that are statistically significant at p ≤ 0.05. significant correlations; not significant correlations.
Table 7. Optimal HPU parameters for lowest ΔT and maturity with maximum mg 100 mL−1 of polyphenols in samples.
Analytical VariableTPCANTHCAFLCT
Content (mg 100 mL−1)102.9615.5814.142.6875.28
Maturity (%)7510010075100
ΔT (°C)4.035.4136.774.04.0
TPC—total phenolic content; ANT—monomeric anthocyanins; HCA—total hydroxycinnamic acids; FL—flavonols; CT—condensed tannins.
Table 8. Experimental design.
SampleJuiceStorage
(Days)
TreatmentAmplitude
(%)
Pulse
(%)
Treatment Time
(min)
1J10Control///
2J10HPU25505
3J10HPU 10
4J10HPU 1005
5J10HPU 10
6J10HPU50505
7J10HPU 10
8J10HPU 1005
9J10HPU 10
10J10HPU75505
11J10HPU 10
12J10HPU 1005
13J10HPU 10
14J10HPU100505
15J10HPU 10
16J10HPU 1005
17J10HPU 10
18J20Control///
19J20HPU25505
20J20HPU 10
21J20HPU 1005
22J20HPU 10
23J20HPU50505
24J20HPU 10
25J20HPU 1005
26J20HPU 10
27J20HPU75505
28J20HPU 10
29J20HPU 1005
30J20HPU 10
31J20HPU100505
32J20HPU 10
33J20HPU 1005
34J20HPU 10
35J17Control///
36J17HPU25505
37J17HPU 10
38J17HPU 1005
39J17HPU 10
40J17HPU50505
41J17HPU 10
42J17HPU 1005
43J17HPU 10
44J17HPU75505
45J17HPU 10
46J17HPU 1005
47J17HPU 10
48J17HPU100505
49J17HPU 10
50J17HPU 1005
51J17HPU 10
52J27Control///
53J27HPU25505
54J27HPU 10
55J27HPU 1005
56J27HPU 10
57J27HPU50505
58J27HPU 10
59J27HPU 1005
60J27HPU 10
61J27HPU75505
62J27HPU 10
63J27HPU 1005
64J27HPU 10
65J27HPU100505
66J27HPU 10
67J27HPU 1005
68J27HPU 10
J1—strawberry juice prepared from 75% ripe strawberries; J2—strawberry juice prepared from 100% ripe strawberries; Control—untreated samples.
Disclaimer/Publisher’s Note: The statements, opinions and data contained in all publications are solely those of the individual author(s) and contributor(s) and not of MDPI and/or the editor(s). MDPI and/or the editor(s) disclaim responsibility for any injury to people or property resulting from any ideas, methods, instructions or products referred to in the content.

