Article

Determination of Flavonoids in Selected Scleranthus Species and Their Anti-Collagenase and Antioxidant Potential

1
Department of Pharmacognosy, Faculty of Pharmacy with the Division of Laboratory Medicine, Medical University of Białystok, ul. Mickiewicza 2a, 15-230 Białystok, Poland
2
Microbiota Lab, Center for Preclinical Studies, Department of Pharmacognosy and Molecular Basis of Phytotherapy, Faculty of Pharmacy, Medical University of Warsaw, ul. Banacha 1, 02-097 Warsaw, Poland
3
Department of Pharmacy, University of Chieti−Pescara “G. d’Annunzio”, 66100 Chieti, Italy
*
Author to whom correspondence should be addressed.
Molecules 2022, 27(6), 2015; https://doi.org/10.3390/molecules27062015
Submission received: 2 March 2022 / Revised: 17 March 2022 / Accepted: 17 March 2022 / Published: 21 March 2022
(This article belongs to the Special Issue Phytotherapy: Medicinal Plants and Natural Products in Healthcare)

Abstract

:
A new 5,7-dihydroxy-3′-methoxy-4′-acetoxyflavone-8-C-β-d-arabinopyranoside-2″-O-(4‴-acetoxy)-glucoside (6) and three known flavone C-glycosides—5,7,3′,4′-tetrahydroxyflavone-6-C-xyloside-8-C-β-d-glucoside (lucenin-1) (7), 5,7,3′-trihydroxyflavone-6-C-glucoside-8-C-β-d-glucoside (vicenin-2) (8), and 5,7,4′-trihydroxy-3′-methoxyflavone-6-C-β-d-glucopyranoside-8-C-α-arabinopyranoside (chrysoeriol-6-C-β-d-glucopyranoside-8-C-α-arabinopyranoside) (9)—were isolated from aerial parts of Scleranthus perennis L. (Caryophyllaceae). Their structures were determined through the use of comprehensive spectroscopic and spectrometric methods, and a method for the quantification of the major constituents of S. perennis and S. annuus L. was developed. Furthermore, the anti-collagenase and antioxidant activities of all isolated compounds obtained from extracts and fractions from both Scleranthus species were evaluated. The highest percentage of collagenase inhibition (at 400 µg/mL) was distinguished for methanolic extracts (22.06%, 32.04%) and ethyl acetate fractions (16.59%, 14.40%) from S. annuus and S. perennis. Compounds 69 displayed moderate inhibitory activity, with IC50 values ranging from 39.59–73.86 µM.

1. Introduction

Scleranthus perennis L. and Scleranthus annuus L., belonging to the Caryophyllaceae family, are endemic species to Europe, North Africa, and Western Asia [1,2]. Only a few studies have reported on the phytochemical description of these plants. To date, the allocated substances previously isolated from S. annuus were mostly phenolic acids and phytoecdysteroids, as well as flavonoids [3,4]. Our previous phytochemical study has shown the presence of new flavonoid C-glycosides in aerial parts of S. perennis (scleranthoside A–C), as well as a paenonside derivative [5]. As part of an ongoing investigation on S. perennis (or perennial knawel), we carried out a chemical study on the ethyl acetate and butanol fractions from perennial knawel, resulting in the isolation and structural characterization of the next four flavonoid C-glycosides on the basis of extensive spectroscopic and spectrometric analysis, including 1D and 2D NMR (COSY, HSQC, and HMBC) and ESI-MS spectra. Furthermore, the chemical descriptions of the polyphenolic compounds, as well as qualitative and quantitative validated analysis of extracts and fractions from both S. perennis and S. annuus, make them important starting materials for assessment of the chemotaxonomic characteristics of the Scleranthus genus.
Flavonoids possess topical anti-inflammatory and anti-aging potentials, as was shown in both in vitro and in vivo investigations [6]. It is well known that plants containing a variety of natural antioxidants can be assumed as candidates for moderating the effects of the skin-aging process by limiting the biochemical consequences of oxidation [7]. The main role of ROS (reactive oxygen species) is to exterminate and damage attacking micro-organisms and degrade destroyed tissue structures. Nonetheless, imprecise targeting of ROS may provoke oxidative stress in surrounding healthy cells, leading to an intensification of pathological processes. The excessive release of ROS occurs in the pathogenesis of numerous human skin diseases, including age-related disorders [8]. The ECM (extracellular matrix) is the part of the skin composed of, inter alia, proteins including collagen or elastin, and its degradation is tied with the skin-aging process [9]. Many studies have deliberated over the elevated level of some matrix metalloproteinases (MMP), such as collagenase or elastase, in inflamed and photoaged skin [10,11,12]. MMP decompose dermal matrix proteins, such as collagen, thus contributing to skin injuries and wrinkle formation. Consequently, factors with the ability to inhibit collagenase or elastase activity have an advantageous impact for supporting skin health, through the prevention of dermal matrix degradation [13]. In this respect, continuing the search for anti-collagenase substances and the most active components modulating the enzyme activity, a comparison between crude extracts and fractions obtained by chromatographic separation from both S. perennis and S. annuus, as well as pure standards, was carried out.

2. Results and Discussion

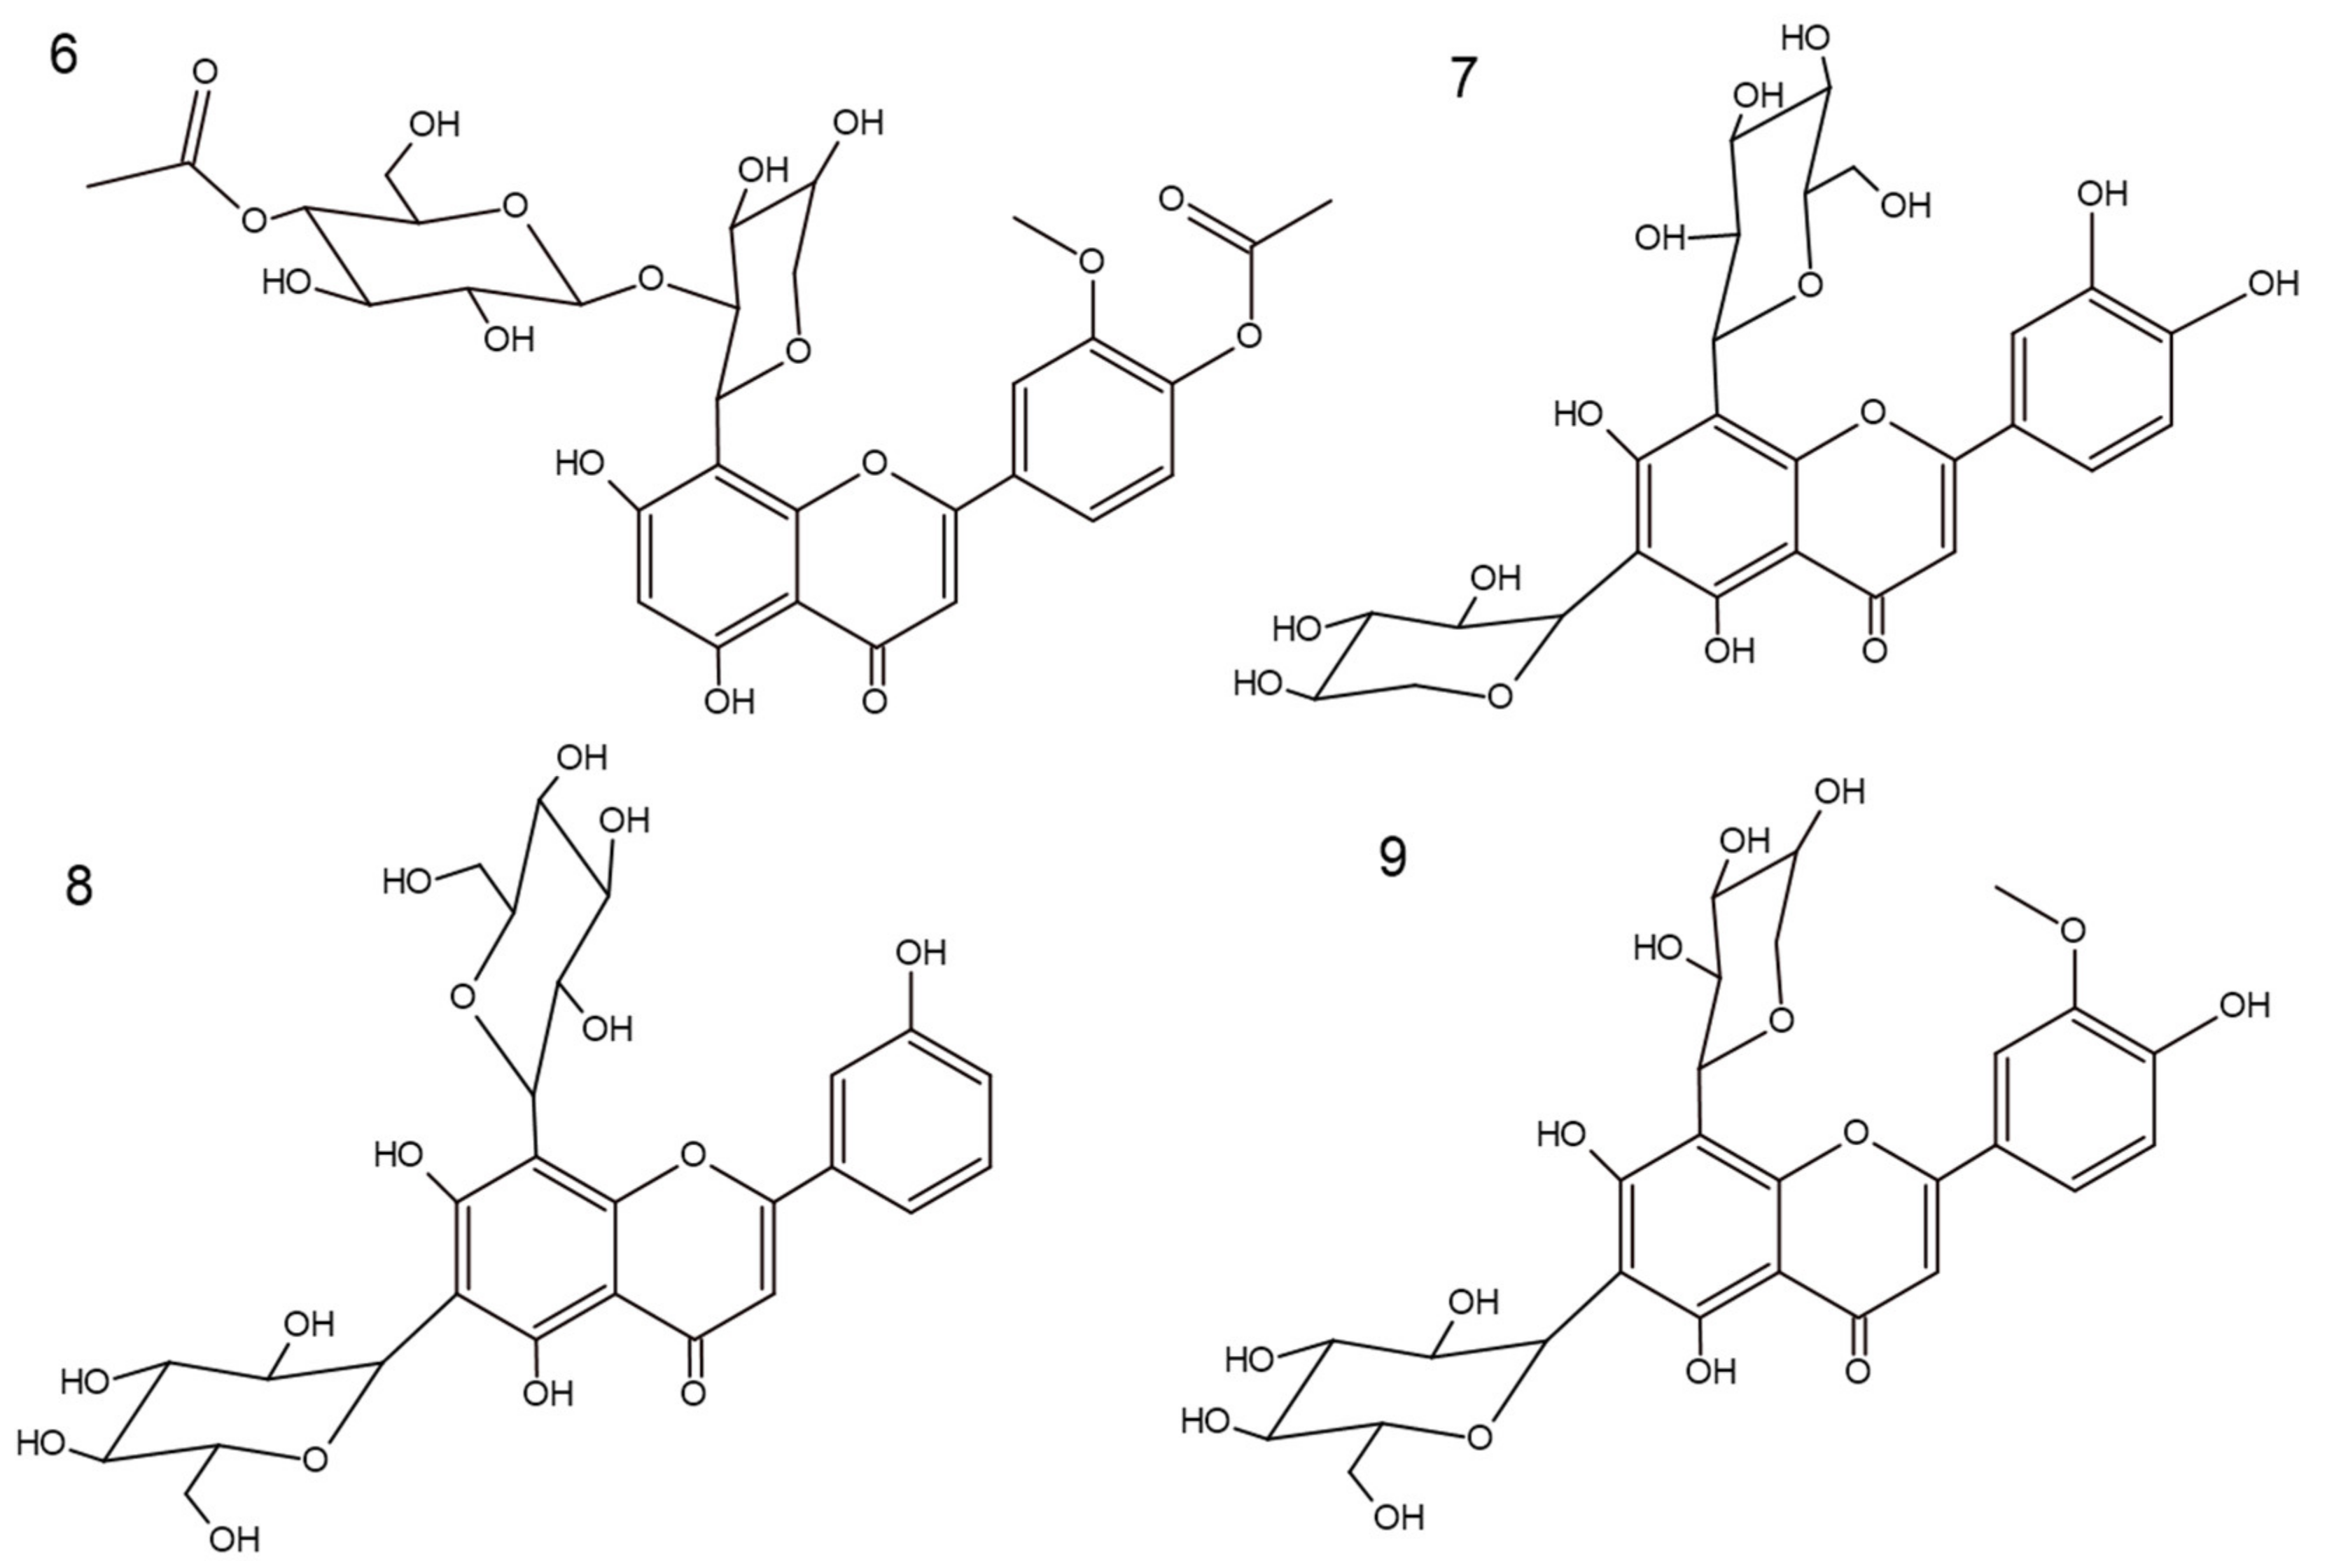
2.1. Isolation and Identification of Flavone C-Glycosides (69)

In our previous research, one phenolic derivative (5) and four flavone derivatives (14) were isolated and fully identified [5]. As a result of ongoing exhaustive multi-step chromatographic isolation processes, one (6) and three (79) chromatographically homogeneous unknown compounds were isolated from the ethyl acetate (SP5) and butanol (SP6) fractions, respectively (Figure 1). The identification of those compounds was executed based on products of acid hydrolysis [5] and spectroscopic methods, such as ultraviolet (UV) spectroscopy, nuclear magnetic resonance (NMR), and mass spectrometry (MS).

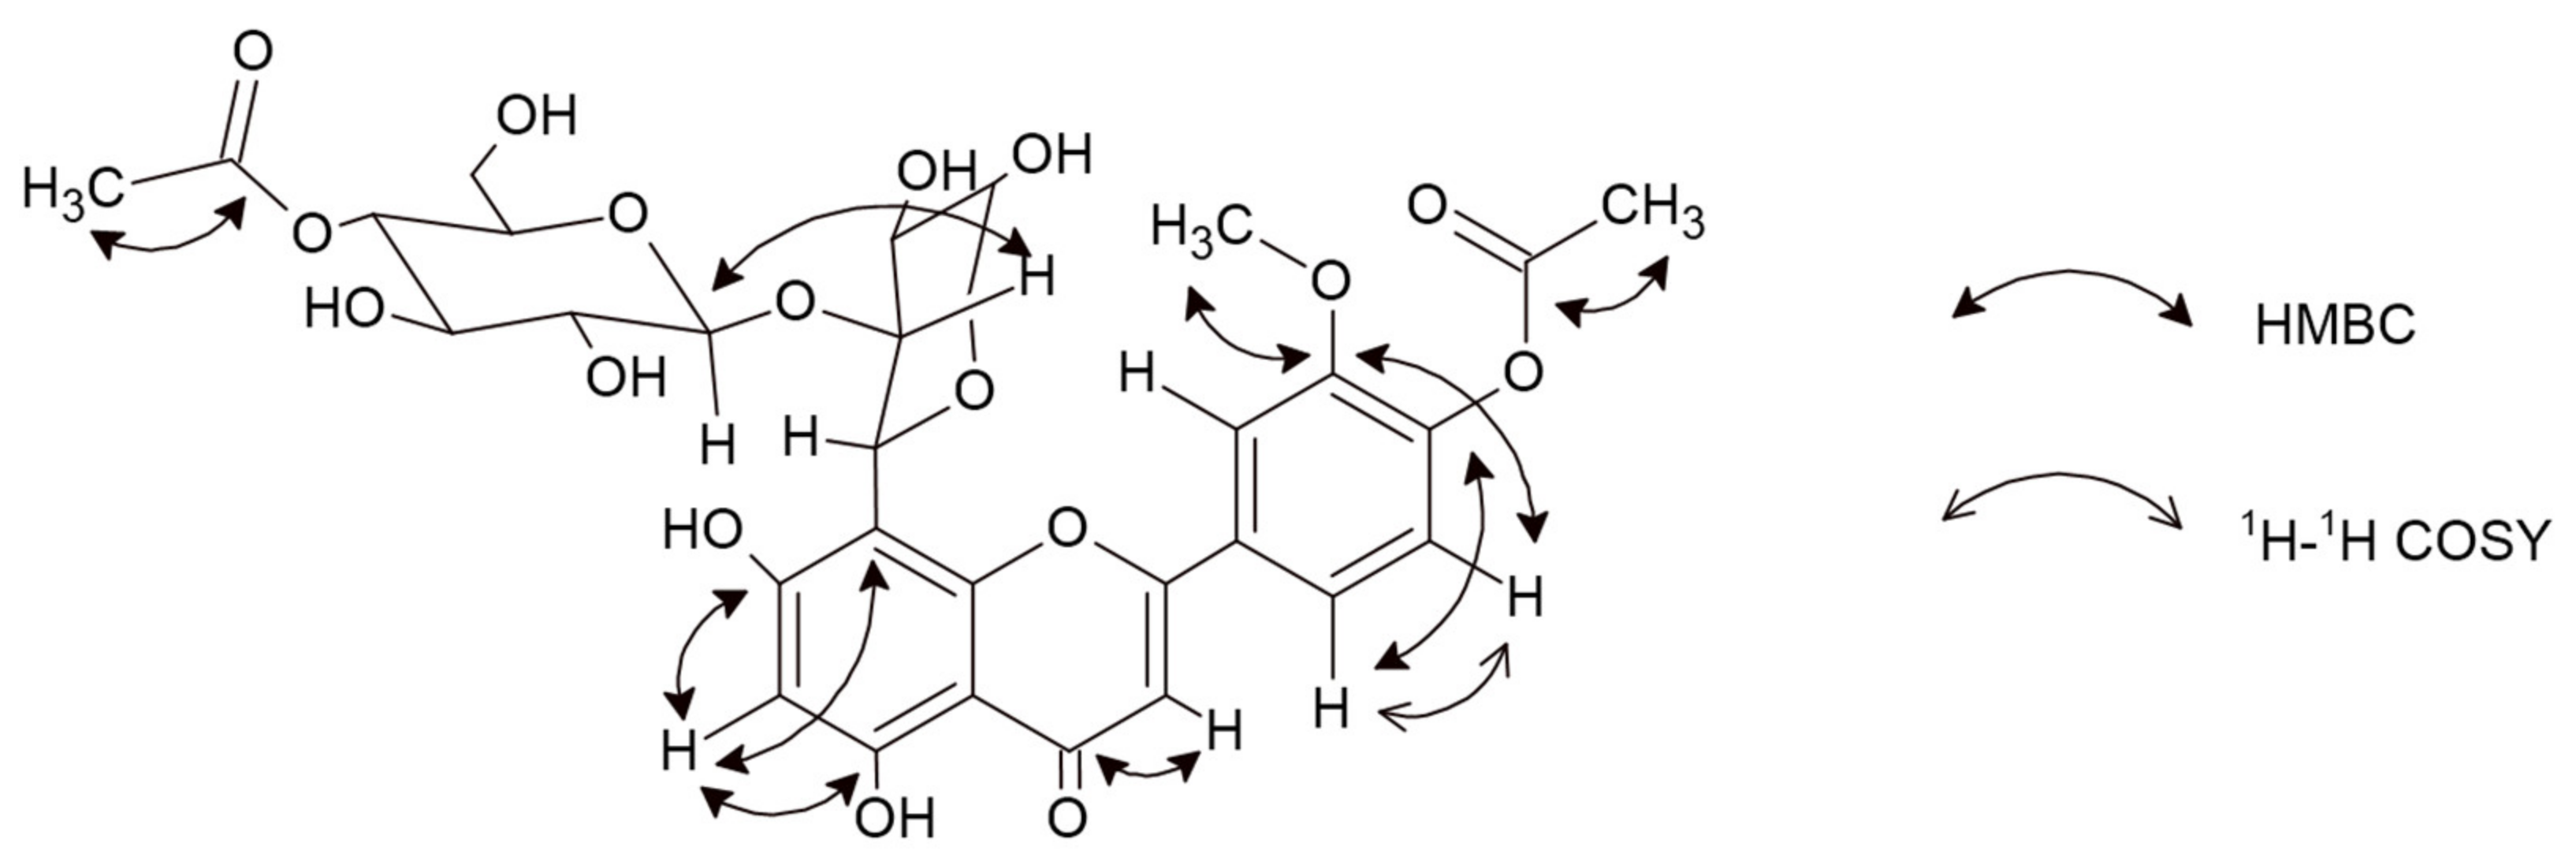
2.1.1. 5,7-Dihydroxy-3′-methoxy-4′-acetoxyflavone-8-C-β-d-arabinopyranoside-2″-O-(4‴-acetoxy)-glucoside (6)

Compound 6 was received as a yellow amorphous powder. Based on the HRESIMS ion peak at m/z 679 [M + H]+, the molecular formula of C31H34O17 was determined. Its UV spectrum showed absorption maxima at 263 and 287 nm, indicating the characteristic pattern of flavones. Sodium acetate (NaOAc) is used with flavones containing a 4′-hydroxyl group, where the band I appears as a peak similar to that observed with sodium methoxide (NaOMe) (304 nm and 301 nm, respectively). Furthermore, in the presence of NaOMe, a bathochromic shift of 17 nm indicated that C4′ is substituted. A bathochromic shift of 12 nm in the presence of NaOAc/H3BO3 indicated a B-ring containing an ortho-substitution pattern. Additionally, shifts of 14 nm (in the presence of NaOAc) and 31 nm (in the presence of AlCl3/HCl) signify free hydroxyl groups at C5 and C7 [14]. The 1H and 13C NMR data showed similarities to scleranthoside C [5], except for a set of signals assignable to an arabinose group. The appearance of one proton singlet at δ 6.23 in the 1H spectrum displays a tri-substituted pattern of A-ring. The absence of signals in the 13C spectrum points out a moiety in a C8. In the HMBC experiment, the proton at δ 6.23 exhibited a correlation with C5 (δ 161.39) and C8 (δ 104.59), which led to the assignment of this proton to position H-C6 [15,16]. Carbons in an A-, C-, and B-rings were assigned based on meticulous analysis of the 13C spectrum, supported by 2D NMR correlations and previous identification of C-flavone glycosides [5]. Thus, based on COSY correlation, the signals at δ 6.95 (1H, d, J = 7.78 Hz) and δ 7.50 (1H, d, J = 7.78 Hz) were assigned to H-C5′ and H-C6′, respectively. Further, the carbon signals at δ 150.46 and δ 148.06 correspond to an ortho-coupling 3′,4′-deoxidized B-ring [17]. The inherence of the double bond appears at δ 182.74 in the 13C NMR spectrum, which corresponds to the C4. The HMBC data showed that the C4 signal was combined with the proton signal at δ 6.58 allocated to H-C3. The presence of a methyl group was concluded from 1H (δ 4.03) and 13C NMR (δ 55.32) and located at C3′ based on HMBC correlation. Furthermore, two acetoxy groups in the structure were revealed by a chemical shift of the –CH3 group in the 1H NMR spectrum as singlets at δ 1.97 and δ 2.02, as well as in the 13C NMR spectrum for acetoxycarbonyl carbon at δ 170.72 and δ 171.47 and acetoxymethyl carbon at δ 19.31 and δ 19.58 [5,17]. This conclusion was further maintained by the HSQC and HMBC correlations (see Figure 2 and Figures S5–S7 in the Supplementary Materials).
Two anomeric proton signals at δ 5.16 (d, 1H, J = 9.29 Hz) and δ 4.31 (d, 1H, J = 7.53 Hz) indicated the presence of two sugar groups. The interglycosidic linkages of 6 were determined by analysis of the HMBC data. Based on the chemical shifts of the individual saccharides, one of them was β-d-glucose (δ 2.93–3.19) and the other was β-d-arabinopyranoside (δ 3.90–4.09) [5,17]. The arabinose residue was assigned to position 8 based on cross-peaks in HMBC correlations (δ 104.59 and δ 5.19). Moreover, a signal occurring in the 1H NMR spectrum at δ 4.31 (d, 1H) with J-coupling value of 7.53 Hz indicated an O-glycoside link. Through comparison of these data with the reported Rf value (0.55) of products of acid hydrolysis, the terminal sugar was classified as glucose. These data, together with the retro-Diels–Alder re-shuffling in a positive ESI-MS fragmentation pattern—637 [M + H-Ac], 475 [M + H-hex-Ac], 343 [M + H-hex-Ac-pent], and 313 [M + H-hex-Ac-pent-OCH3] (Figure S1)—suggested the presence of acetylation of hexose moiety, as well as methylation and acetylation of the B-ring. Thus, the structure of 6, which is a new natural product, was established as 5,7-dihydroxy-3′-methoxy-4′-acetoxyflavone-8-C-β-d-arabinopyranoside-2″-O-(4‴-acetoxy)-glucoside and named scleranthoside D (Figure 1).

2.1.2. 5,7,3′,4′-Tetrahydroxyflavone-6-C-xyloside-8-C-β-d-glucoside (Lucenin-1) (7)

Compound 7 was obtained as a yellow amorphous powder. Based on the HRESIMS ion peak at m/z 581 [M + H]+, the molecular formula of C26H28O17 was determined. Based on UV spectra, 8 was assigned to the flavone derivatives and showed a bathochromic shift of band I in the presence of NaOAc/H3BO3 (29 nm), indicating an ortho-dihydroxyl group in the B-ring (luteolin derivative) [14]. This was confirmed by 13C NMR data, which showed signals for 26 carbons. Comparing 1H NMR data of 6 and 7 showed two signals from glycosyl moieties at δ 5.09 (d, 1H, J = 9.79 Hz) and δ 4.98 (d, 1H, J = 9.79 Hz), indicating substitutions at C8 and C6, respectively. Furthermore, the mass fragmentation pattern in positive mode (180 V) was as follows: 563, 545, 527, and 497. This indicated a typical system for 6,8-C-glycosides [18,19]. The 13C NMR and 1H NMR signals of the compound were consistent with literature data [20,21]. Hence, the structure of 7 was established as 5,7,3′,4′-tetrahydroxyflavone-6-C-xyloside-8-C-β-d-glucoside (lucenin-1) (Figure 1).

2.1.3. 5,7,3′-Trihydroxyflavone-6-C-glucoside-8-C-β-d-glucoside (Vicenin-2) (8)

Compound 8, a yellow amorphous powder, exhibited a predominant ion peak at m/z 595 [M + H]+ in positive mode by HRESIMS, corresponding to the molecular formula C27H30O15. According to UV spectra, 8 is different from 7 by a lack of hydroxylation at C4′. This conclusion was supported by observations of a similar value of band I appearing with NaOAc/H3BO3 (347 nm) and in MeOH (345 nm) [14]. As described above, in 1H NMR spectra, two signals for saccharides bonds were observed—δ 5.08 (d, 1H, J = 9.79 Hz) and δ 4.98 (d, 1H, J = 9.79 Hz)—pointing out C6 and C8 as their binding sites. Furthermore, in the positive ESI mass spectrum, the fragments m/z 575, 503, 473, 383, and 353 provided the location and bond type for two hexose moieties [22]. Combining the information from the previous literature, fragmentation information, and spectral data, compound 8 was established as 5,7,3′-trihydroxyflavone-6-C-glucoside-8-C-β-d-glucoside (vicenin-2) (Figure 1) [21,22].

2.1.4. 5,7,4′-Trihydroxy-3′-methoxyflavone-6-C-β-d-glucopyranoside-8-C-α-arabinopyranoside (Chrysoeriol-6-C-β-d-glucopyranoside-8-C-α-arabinoside) (9)

Compound 9, isolated as a yellow amorphous powder, showed an [M + H]+ ion at m/z 595 in its HRESIMS spectrum, corresponding to the molecular formula C27H30O15. The UV spectra are typical of flavone derivatives with ortho-hydroxylation (bathochromic shift of band I in the presence of NaOAc/H3BO3) [14]. Moreover, the occurrence of signals δ 56.77 in 13C spectra and δ 3.97 in 1H spectra are characteristic of –CH3. HMBC correlation of δ 3.97 with δ 149.37 indicated that C3′ was methylated [23]. In the positive ESI-MS spectra of 9, the pattern observed was in agreement with those of C-glycoside derivatives: 577, 475, 409, 385, and 355 [22]. The 1H and 13C NMR data of compound 9 were consistent with literature data [24]. Thus, the structure was established as 5,7,4′-trihydroxy-3′-methoxyflavone-6-C-β-d-glucopyranoside-8-C-α-arabinopyranoside (chrysoeriol-6-C-β-d-glucopyranoside-8-C-α-arabinopyranoside) (Figure 1), which was previously isolated from the genus Silene (Caryophyllaceae family) [24].

2.2. Phytochemical Analysis of Extracts SP1SP3, SA1SA3 and Fractions SP4SP6, SA4SA6

HPLC-PDA-MSn analysis (Table 1) of all 12 extracts and fractions revealed the presence of 24 different phenolics, based on their characteristic UV and MSn spectra (Figures S8–S19), which were assigned to the groups of phenolic derivatives (I, II) or flavonoid derivatives (III–XXIV). The glycosidic derivatives present in the analyzed samples were characterized by the specific loss of a substituted or unsubstituted sugar neutral molecule, which indicates the presence of a C-glycosidic bond, as well as an O-glycosidic linkage. The second characteristic group of compounds are flavone glycosides, substituted in two places with C-bonds. The occurrence of the specific [M-120-H]/[M-90-H] ion pairs indicated that they were flavone 6,8-di-C-hexoses.
Besides compounds identified in the HPLC analysis, many other phytochemicals could be responsible for the biological effects of the investigated species. In this study, the values of total phenolic, phenolic acid, and tannin contents were determined, which are provided in Table 2. Total phenolics content of S. perennis extracts and fractions varied from 99.20 to 240.00 mg Peq/g, while those in extracts and fractions of S. annuus ranged from 95.72 to 217.20 mg Peq/g. According to the obtained results, SA5 (11.34 mg CAeq/g) and SA6 (9.19 mg CAeq/g) contained the highest total phenolic acids content, while the total tannins content was elevated in SP2 (20.16 mg Peq/g).
It has been disputed that total bioactive compounds content assays provide limited insight into the phytochemical composition, as compared with complete extract or fraction profiles. At this point, our ongoing study is concentrated on the quantification of compounds isolated from the aerial parts of the two Scleranthus species (SA1SA6, SP1SP6) using HPLC. As reported in Table 3, compound 3 (59.10 ± 0.08 mg/g of extract) was quantified as a dominant substance in SP5. The quantification results showed that SA5 and SP5 are rich sources of flavonoids. Considering the fact that compounds 7, 8, and 9 were not detected in SP5, they could be assumed as markers differentiating SA5 from SP5. Furthermore, the phenolic derivative (5) was present only in two samples from S. annuus (SA5, SA6), while only one fraction from S. perennis (SP4) did not contain compound 5.

2.3. Antioxidant Activities of SP1SP6, SA1SA6, and Compounds 19

DPPH and ABTS assays are two methods used to estimate radical scavenging activity (RSA). The RSA for SP1SP6, SA1SA6, and compounds 19 are provided in Table 4. The radical scavenging activity for DPPH ranged from 64.07–386.59 µM Teq (Trolox equivalent) for all extracts and 6.69–409.16 µM Teq for compounds. In the ABTS assay, it ranged from 67.94–459.29 µM Teq, and from 169.27–765.16 µM Teq for extracts and compounds, respectively. Therefore, fractions (SP4SP6, SA4SA6) possessed both higher DPPH and ABTS activities than extracts (SP1SP3, SA1SA3). Among all tested compounds, 1, 7, and 9 were found to be progressive antiradical agents. On the other hand, SP2 and compounds 3, 4, and 6 exhibited the lowest RSA values in the group of all tested samples. The reducing power of ions is another valid mechanism involved in the antioxidant pathway. To this end, FRAP and CUPRAC assays were evaluated at this point (see Table 4). As was observed in the DPPH and ABTS assays, fractions possessed higher-level antioxidant activity than extracts, both in FRAP and CUPRAC methods. The fractions were graded from the strongest to weakest, as follows: SP5 > SP6 > SA5 > SA6 in the CUPRAC assay, and SA6 > SA5 > SP5 > SP6 in the FRAP assay. The greatest activity of all compounds isolated from S. perennis was observed in compounds 1 (39.25 mM Fe2+/mL; 581.32 µM Teq) and 7 (45.30 mM Fe2+/mL; 116.16 µM Teq), while the weakest were compounds 3 (2.37 mM Fe2+/mL; 67.30 µM Teq) and 6 (3.05 mM Fe2+/mL; 18.57 µM Teq).
Based on the results outlined herein, the studied fractions containing the highest total phenolic, flavonoid, and phenolic acid contents (Table 2 and Table 3) likewise showed the highest antioxidant activity, which is in the agreement with the available literature [8,25,26]. Moreover, the improvement of the antioxidant capacity of all tested compounds can be associated with the C4′ hydroxyl group, as shown in compounds 1 and 7, and the degradation of their activity with methylation or acetylation (see compounds 3, 4, and 6) [27].

2.4. In Vitro Anti-Collagenase Inhibition

In a previous study, compounds 15 were investigated for their anti-collagenase activity [5]. The collagenase inhibition potential of compounds 69 isolated and identified during the present work was also established for the first time. Table 5 shows the activities of compounds 69 and their respective IC50 values.
Moreover, the collagenase inhibition activity of crude extracts (SP1SP3, SA1SA3) and fractions (SP4SP6, SA4SA6) from both S. perennis and S. annuus was assessed. The effect of their anti-collagenase potential, expressed as the percentage of anti-collagenase activity at 400 µg/mL, is summarized in Table 6.
Among the twelve extracts, all of them exhibited restrained anti-collagenase activity. At 400 µ/mL, SA1 showed 32.04 ± 0.45% inhibition, which was stronger than that of the other extracts. The inhibition activity (>15%) of extracts can be presented, in decreasing order, as follows: SA1 > SP1 > SA4 > SA5 > SP5. On the other hand, butanol extracts from both S. annuus (SA6) and S. perennis (SP6) exhibited minimum percentage inhibition of 7.11 ± 0.17% and 2.39 ± 0.07%, respectively. Meanwhile, SP2 and SP4 showed low activity (>7%). As has been described in previous studies, a high content of flavonoid compounds is not necessarily related to the collagenase inhibitory effect [28]. In the ongoing search for anti-collagenase substances, the compounds newly isolated from S. perennis (69) were tested. In agreement with our previous statement [5], flavonoid C-glycosides displayed moderate activity, with IC50 ranging from 39.59 ± 1.21 to 73.86 ± 1.03 µM. Previous studies have implied that topically applied flavonoids may protect against collagen degradation and contribute to the prevention of its degradation in inflamed as well as in photoaged skin. Nevertheless, this potential activity needs to be additionally explained, in order to clarify their effect on the skin through topical application [6].

3. Materials and Methods

3.1. General Experimental Procedures

All used solvents for extraction and fractionation process, reagents for antioxidant and anti-collagenase assays, and equipment are provided in the Supplementary Materials. Furthermore, luteolin (purity > 96%), as well as compounds 15, were isolated in the Department of Pharmacognosy, Medical University of Białystok [5,29].

3.2. Plant Material

The aboveground parts of S. perennis and S. annuus were collected from plants occurring in their natural habitat within the area of Bialystok from August through September in 2018 and 2019. The plant material was dried in a shaded and ventilated area. Stored S. perennis and S. annuus samples were recognized based on the scientific botanical bibliography [30]. Herbarium specimens were given voucher numbers (no. SP-18041 and no. SA-18042) and preserved in the Herbarium of the Department of Pharmacognosy at the Medical University of Białystok, Białystok, Poland.

3.3. Preparation of Extracts SP1SP3, SA1SA3 and Fractions SP4SP6, SA4SA6

The raw plant materials from S. annuus and S. perennis (10 g per sample) were powdered and subsequently extracted using an ultrasonication bath (5 × 30 min). All extractions were performed using 100 mL of one of the following solvents: MeOH (SP1, SA1), 50% MeOH (SP2, SA2), or H2O (SP3, SA3). After the evaporation of solvents under reduced pressure (temp. 30 ± 2 °C), residues were suspended in water and lyophilized. The following amounts of the samples were obtained: SP1, 1276 mg; SA1, 1970 mg; SP2, 880 mg; SA2, 1921 mg; SP3, 655 mg; and SA3, 2181 mg. Purification of the plant material (100 g) was conducted through the continuous extraction method using petrol (1.5 L × 20 h), and then CHCl3 (chloroform; 1.5 L × 20 h) in a Soxhlet apparatus. The purified raw material was exhaustively extracted with MeOH (20 × 1.5 L) and 50% MeOH (3 × 1.5 L) and H2O (1 × 1.5 L) for 1 h each time. After they were obtained, all extracts were combined, evaporated to dryness, and precipitated with water. Extracts obtained from both S. annuus and S. perennis were exhaustively fractionated by liquid–liquid extraction with different solvents of increasing polarity: CHCl3 (30 × 200 mL), Et2O (SP4, SA4; 35 × 200 mL), EtOAc (SP5, SA5; 100 × 200 mL), and n-BuOH (SP6, SA6; 60 × 200 mL). All fractions were evaporated, dissolved in water, and finally lyophilized using a freeze dryer. The six fractions were obtained in the following amounts: SP4, 850 mg; SA4, 100 mg; SP5, 821 mg; SA5, 632 mg; SP6, 563 mg; and SA6, 452 mg.

3.4. Phytochemical Analysis of Extracts SP1SP3, SA1SA3 and Fractions SP4SP6, SA4SA6

3.4.1. Determination of Total Phenol Content

Total phenol (TPC) content was examined using transformed Folin–Ciocalteu colorimetric analysis [26] by mixing 80 µL of extract or fraction solution (1 mg/mL), 80 µL of Folin–Ciocalteu (9:1 v/v) reagent, and 80 µL of 10% Na2CO3 (sodium carbonate). After 1 h of incubation at 25 °C, absorbance at 630 nm was measured. TPC is expressed as the equivalent of pyrogallol from the calibration curve. Each assay was repeated in triplicate.

3.4.2. Determination of Total Tannin Content

Determination of total tannin content (TTC) was evaluated using the difference between values of TPC, as described in the European Pharmacopoeia, 10th Edition [31]. In short, 1 mL of sample (1 mg/mL) was shaken with 10 mg of leather powder and then percolated. Then, 80 µL of the filtrate was mixed with 80 µL of Folin–Ciocalteu (9:1 v/v) reagent and 80 µL of sodium carbonate (10%). After 1 h, the absorbance was measured at 630 nm.

3.4.3. Determination of Phenolic Acid Content

Total phenolic acid content (TPAC) was determined using a previously described method with Arnov’s reagent [32]. Briefly, 30 µL of the sample (1 mg/mL) was mixed with 150 µL of distilled water, 30 µL of HCl (0.5 M), 30 µL of Arnov’s reagent, and 30 µL of NaOH (1 M). Absorbance was measured at 490 nm, and the values are expressed as equivalent of caffeic acid.

3.4.4. Qualitative HPLC-MSn Analysis

Screening of the metabolites in the extracts and fractions was performed using an Ultimate 3000 series HPLC system coupled with an Amazon SL (Bruker, Bremen, Germany) ion trap mass spectrometer. A C18 reversed-phase packing column with the security guard column (Kinetex XB-C18, 150 × 2.1 mm, 1.7 μm; Phenomenex, Torrance, CA, USA) was used for the separation. The column was thermostated at 45 ± 0.5 °C using a column oven. The acquisition of the UV–vis spectrum was set in the range of 190–600 nm, while the UV chromatogram was recorded at a wavelength of 270 nm for V and 348 nm for flavonoids. Gradient elution was performed using the mobile phase water–acetonitrile starting at 93:7 (v:v), both with 0.1% formic acid. After 3 min, there was an accumulation of solvent B to 10.5% in 6 min, 13% in 37 min, and 17.5% in 40 min. Then, the previous proportion was maintained for 90 min. The last two steps were followed by a linear gradient to 50% in 108 min and an isocratic elution in 2 min. Finally, it was equilibrated to the starting conditions for 10 min. The injection volume was 5.0 µL and the flow rate was 0.3 mL/min. The IT-MSn conditions were as follows: gas flow of 12 L/min with a temperature of 325 °C, a nebulizer pressure of 45 psi, capillary voltage of 2500 V with nozzle voltage 1000 V for negative ion mode, and electrospray ionization (ESI) source in ionization mode.

3.4.5. Quantitative Analysis

The stock solutions were made at a concentration of 1 mg in a final volume of 1 mL. Working solutions of mixed standards were in the concentration range of 0.05–10 μg/mL for 3 and 0.01–5 μg/mL for 5, which were made through the dilution of stock solution in volumetric flasks with the mobile phase. Then, the standards were injected into the HPLC-PDA system in six concentration levels. The 12 samples (SA1SA6, SP1SP6), prepared by accurately weighing, were dissolved and diluted with mobile phase to final 2 mg/mL. Then, 5 µL was directly injected into the HPLC-PDA system. The selectivity of the elution method and the linearity of each calibration curve (R2) were taken into consideration for the accuracy of the method. The LOD (limits of detection) and LOQ (limits of quantification) of analytes were evaluated using the standard deviation of the response (SDa) and the slope (b) of calibration curves. Consequently, LOD and LOQ are expressed as 3.3 × SDa/b and 10 × SDa/b, respectively. The repeatability and reproducibility of the following methods were confirmed by intra-day and inter-day precision analyses. Considering the intra-day precision, three replicates for each analyte at a specific concentration were carried out; while, for the inter-day precision, nine replicates were conducted over three days [33]. These parameters are given only for 3 as a dominant flavonoid compound isolated from S. perennis, as well as for 5, as a non-flavonoid compound with different absorption maxima (λ = 270 nm). All differences and linear regression parameters for the standard curve values are presented in Table 7.

3.5. Isolation of Flavone C-Glycosides (69)

To isolate the flavonoid compounds, air-dried samples of S. perennis (500 g) were pulverized and extracted exhaustively in a Soxhlet extractor, first with petrol and then with chloroform. Afterward, the samples were extracted with methanol (45 × 3 L), 50% methanol (10 × 3 L), and water (3 × 3 L) for 1 h each time. Combined extracts from S. perennis (108.38 g) were evaporated to dryness at 45 °C and fractionated by Sephadex LH-20 column chromatography using methanol, resulting in 33 fractions. The obtained fractions were combined, after TLC analysis, into 5 fractions (F1–F5). According to preliminary LC-MS analysis, fraction F3 was introduced for further investigation. It was dissolved in water and fractionated by liquid−liquid extraction with Et2O, EtOAc, and finally n-BuOH. After, to isolate the flavonoids, the ethyl acetate and n-butanol fractions were purified and lyophilized. The EtOAc (2 g) and BuOH (2 g) fractions were separated using preparative HPLC (0–35 min, 0–7% UPW-ACN, 20 mL/min) in order to receive compound 6 (5.32 mg) from EtOAc, and compounds 7 (7.65 mg), 8 (5.54 mg), and 9 (9.26 mg) from BuOH. The purified compounds (69) were subjected to spectral and chromatographical analyses in order to determine their full structural characteristics. Spectral measurements were performed using the UV–vis method with various complexing reagents and 1H, 13C, COSY, HSQC, and HMBC spectra in CD3OD. Sugars were identified based on a chromatographic product of acid hydrolysis. Optical rotation was conducted in DMSO. The final characteristics of all isolated compounds were also confirmed by product ion scan.

3.6. Identification of Compounds 69

5,7-dihydroxy-3′-methoxy-4′-acetoxyflavone-8-C-β-d-arabinopyranoside-2″-O-(4‴-acetoxy)-glucoside (6): yellow amorphous powder (mp.: 187.0–188.0 °C); [α]D −29.0 (DMSO; c 0.1); HPLC rt, 100.03 min; HRESIMS m/z = 679.205 [M + H]+ (calculated for C31H34O17); UV λmax nm: 263, 287; +NaOMe: 252, 304; +AlCl3: 249, 318; +NaOAc: 260, 301; +H3BO3: 263, 297); NMR spectral data (Bruker, Oxford, UK), 1H NMR (CD4OD, 400 MHz) H-C2′: δ 7.62 (s, 1H), H-C6′: δ 7.50 (d, 1H, J = 7.28), H-C5′: δ 6.95 (d, 1H, J = 7.28), H-C3: δ 6.58 (s, 1H), H-C6: δ 6.23 (s, 1H), H-C1″: δ 5.16 (d, 1H, J = 9.29), H-C1‴: δ 4.31 (d, 1H, J = 7.53), H-C4″: δ 4.18 (s, 2H), H-C4″: δ 4.09 (s, 2H), CH3: δ 4.03 (s, 3H), H-C2″: δ 3.90 (s, 2H), H-C3″: δ 3.78 (s, 2H), H-C6‴: δ 3.19 (s, 2H), H-C5‴: δ 3.17 (s, 2H), H-C3‴: δ 3.04 (s, 2H), H-C4‴: δ 2.95 (s, 2H), H-C2‴: δ 2.93 (s, 2H), OAc: δ 1.97 (s, 1H), OAc: δ 2.20 (s, 1H); 13C NMR (CD4OD, 400 MHz) C4: δ 182.74, Ac: δ 171.47, δ 170.72, C2: δ 164.83, C7: δ 163.11, C5: δ 161.39, C9: δ 155.59, C4′: δ 150.46, C3′: δ 148.06, C1′: δ 122.76, C6′: δ 120.45, C5′: δ 115.40, C2′: δ 109.73, C8: δ 104.59, C1‴: δ 104.08, C3: δ 102.87, C10: δ 102.53, C6: δ 99.43, C2″: δ 80.42, C3‴: δ 76.45, C1″: δ 74.72, C3″: δ 74.61, C5‴: δ 73.60, C2‴: δ 72.71, C5″: δ 71.38, C4‴: δ 69.20, C4″: δ 68.05, C6‴: δ 63.11, CH3: δ 55.32, Ac: δ 19.58, Ac: δ 19.32; see Figures S1–S7 in the Supplementary Materials.
5,7,3′,4′-tetrahydroxyflavone-6-C-xyloside-8-C-β-d-glucoside (lucenin-1) (7): yellow amorphous powder; HPLC rt, 17.44 min; HRESIMS m/z = 579.167 [M + H]+ (calculated for C26H28O15); UV λmax nm: 263, 287; +NaOMe: 252, 304; +AlCl3: 249, 318; +NaOAc: 260, 301; +H3BO3: 263, 297); NMR spectral data, see [20].
5,7,3′-trihydroxyflavone-6-C-glucoside-8-C-β-d-glucoside (vicenin-2) (8): yellow amorphous powder; HPLC rt, 29.15 min; HRESIMS m/z = 595.184 [M + H]+ (calculated for C27H30O15); UV λmax nm: 274, 345; +NaOMe: 285, 412; +AlCl3: 281, 362; +NaOAc: 283, 368; +H3BO3: 274, 247; NMR spectral data, see [34].
5,7,4′-trihydroxy-3′-methoxyflavone--6-C-β-d-glucopyranoside-8-C-α-arabinopyranoside (chrysoeriol-6-C-β-d-glucopyranoside-8-C-α-arabinopyranoside) (9): yellow amorphous powder; HPLC rt, 29.15 min; HRESIMS m/z = 595.184 [M + H]+ (calculated for C27H30O15); UV λmax nm: 274, 349; +NaOMe: 285, 414; +AlCl3: 281, 360; +NaOAc: 283, 377; +H3BO3: 274, 282; NMR spectral data, see [24].

3.7. Antioxidant Activity

3.7.1. DPPH Assay

Individual test compounds and extracts in methanol (130 µL) were added to 70 µL of a solution of DPPH (2,2-diphenyl-1-picrylhydrazyl). After 30 min of incubation, the absorbance was evaluated at 517 nm [26]. The determination was performed in triplicate and corrected to a blank sample (pure methanol). The radical scavenging activity of the tested samples was expressed as Trolox equivalents, calculated from the standard curve.

3.7.2. ABTS Assay

Suppression of the production of the radical cation was measured using an antioxidant assay kit (CS0790). In brief, 10 µL of the test sample, 20 µL of myoglobin working solution, and 150 µL of ABTS working solution (containing ABTS substrate solution and 3% hydrogen peroxide) were mixed into a clear, flat-bottom 96-well plate. After 5 min of incubation, 100 µL of stop solution was added and absorbance was measured at 405 nm. The antioxidant concentration of tested samples was calculated using the equation obtained through linear regression of the Trolox standard curve.

3.7.3. FRAP Assay

The chelating activity of the investigated substances toward ferrous ions was assessed using a ferric reducing antioxidant power assay kit. Briefly, 10 µL of each sample (SP1SP6, SA1SA6, 19) was mixed with 190 µL of supplied reaction mix (containing FRAP Assay Buffer, FeCl3 solution, and FRAP Probe). After 1 h of incubation at 37 °C, the absorbance was measured at 594 nm. A blank solution containing 10 µL of MeOH instead of extract/compound solution was used. For further calculations, the ferrous standard curve was evaluated. Values are given as mM Ferrous equivalents. All tests were performed in triplicate.

3.7.4. CUPRAC Assay

The reducing power of copper ions was evaluated using an antioxidant assay kit (MAK334). Briefly, 20 µL of sample and 100 µL of reaction mix were added into separate wells in a 96-well plate. After 10 min of incubation, the absorbance endpoint was measured at 570 nm. Total antioxidant capacity was determined using a standard curve evaluated for Trolox.

3.8. Anti-Collagenase Assay

The potential anti-collagenase activity was assessed as previously described [5]. In short, a solution including 25 µL of collagenase from Clostridium histolyticum, 25 µL of Tricine buffer, and 25 µL of various levels of the extracts (SP1–SP6, SA1–SA6) or compounds (69) were incubated at 37 °C. After 20 min, 75 µL of FALGPA was added. Then, absorbance was measured at 335 nm. The experiment was performed in 50 mM Tris buffer. The blank was evaluated using Tricine buffer, instead of sample, and the positive control was epigallocatechin gallate (EGCG). All measurements were conducted in triplicate and the IC50 for each sample was calculated. The percentage of collagenase inhibitory activity (CoInh) was calculated as follows:
Enzyme inhibition activity (%) = [1 − (B/S)] × 100%,
where B is the blank and S is the sample.

3.9. Statistical Analysis

All results obtained in the anti-collagenase test are represented as the mean ± standard deviation (SD) from at least three independent replicates. Statistical analysis was carried out using the GraphPad Prism 9 software (Trial, GraphPad Software, San Diego, CA, USA). Statistical differences and linear regression parameters for the standard curve were determined using ANOVA with corroboration of statistical significance. Calculations for regression parameters were conducted using the MS Excel 2019 software (Microsoft, Washington, DC, USA).

4. Conclusions

Plant metabolomics may deliver large data sets, which allow for a better understanding of the cellular processes occurring in plant organisms. The growing interest and development of metabolomics research in plants provide important indicators for the chemotaxonomic description of whole plant families. The identified compounds (69) isolated from S. perennis in this paper are newly found C-glycosylated flavones in Scleranthus plants. So far, flavone C-glycosides have only been reported in S. uncinatus Schur. [35]. It could be assumed that the two investigated species are chemically similar and partially clustered with other morphologically related species from the Caryophyllaceae family. Moreover, lucenin-1 (7), vicenin-2 (8), and chrysoeriol-6-C-β-d-glucopyranoside-8-C-α-arabinopyranoside (9) were previously isolated from Caryophyllaceae plants (e.g., Stellaria sp., Spergularia sp., Silene sp., or Lychnis sp.) [36]. Furthermore, to the best of our knowledge, compound 6 is a new chemical structure occurring in the whole plant kingdom, which extends the structural and chemical characterization of Scleranthus sp., as well as that of the Caryophyllaceae family. As phytochemical studies of both S. perennis and S. annuus have not been reported so far, we also performed qualitative and quantitative elucidation of all bioassay-guided extracts and fractions. All tested samples exhibited moderate anti-collagenase activity, and so, further biological models and the application of acylated C-diglycosyled flavones should be studied.

Supplementary Materials

The following supporting information can be downloaded at: https://www.mdpi.com/article/10.3390/molecules27062015/s1. Figure S1: Product ion scan in positive mode of compound 6; Figure S2: UV spectrum of compound 6; Figure S3: 1H NMR spectrum (400 MHz) of compound 6 in CD3OD; Figure S4: 13C NMR spectrum (400 MHz) of compound 6 in CD3OD; Figure S5: 1H–1H COSY spectrum of compound 6 in CD3OD; Figure S6: HSQC spectrum of compound 6 in CD3OD; Figure S7: HMBC spectrum of compound 6 in CD3OD; Figure S8: UV–vis chromatogram (λ = 348nm) of separated compounds 14, 69 obtained by LC-PDA-MS; Figure S9: UV–vis chromatogram (λ = 270 nm) of separated compounds 19 obtained by LC-PDA-MS. Figure S10: The qualitative assessment of SA1. UV–vis chromatogram (λ = 348 nm) obtained by LC-PDA-MS; Figure S11: The qualitative assessment of SA2. UV–vis chromatogram (λ = 348 nm) obtained by LC-PDA-MS; Figure S12: The qualitative assessment of SA3. UV–vis chromatogram (λ = 348 nm) obtained by LC-PDA-MS; Figure S13: The qualitative assessment of SA4. UV–vischromatogram (λ = 348 nm) obtained by LC-PDA-MS; Figure S14: The qualitative assessment of SA5. UV–vis chromatogram (λ = 348 nm and λ = 270 nm) obtained by LC-PDA-MS; Figure S15: The qualitative assessment of SA6. UV–vis chromatogram (λ = 348 nm and λ = 270 nm) obtained by LC-PDA-MS; Figure S16: The qualitative assessment of SP1. UV–vis chromatogram (λ = 348 nm and λ = 270 nm) obtained by LC-PDA-MS; Figure S17: The qualitative assessment of SP2. UV–vis chromatogram (λ = 348 nm and λ = 270 nm) obtained by LC-PDA-MS; Figure S18: The qualitative assessment of SP3. UV–vis chromatogram (λ = 348 nm and λ = 270 nm) obtained by LC-PDA-MS; Figure S19: The qualitative assessment of SP4. UV–vis chromatogram (λ = 348 nm) obtained by LC-PDA-MS.; Figure S20: The qualitative assessment of SP5. UV–vis chromatogram (λ = 348 nm and λ = 270 nm) obtained by LC-PDA-MS; Figure S21: The qualitative assessment of SP6. UV–vis chromatogram (λ = 348 nm and λ = 270 nm) obtained by LC-PDA-MS.

Author Contributions

Conceptualization, K.J. and M.T.; methodology, K.J., J.W.S., A.T. and S.G.; formal analysis, M.T. and M.L.; investigation, K.J., J.W.S., A.T. and S.G.; writing—original draft preparation, K.J. and J.W.S.; writing—review and editing, M.T.; visualization, K.J. and M.T.; supervision, M.T. All authors have read and agreed to the published version of the manuscript.

Funding

This study received no external funding.

Institutional Review Board Statement

Not applicable.

Informed Consent Statement

Not applicable.

Data Availability Statement

Data are contained within the article and Supplementary Materials.

Acknowledgments

Special thanks to Krzysztof Bielawski from the Medical University of Białystok for providing a laboratory to conduct the study of the melting point for the new compound.

Conflicts of Interest

The authors declare no conflict of interest.

Sample Availability

Samples of compounds 69 are available from the authors.

Abbreviations

NMRNuclear magnetic resonance
COSYCorrelation spectroscopy
HSQCHeteronuclear single quantum coherence
HMBCHeteronuclear multiple bond correlation
UVUltraviolet radiation
UV–visUltraviolet–visible spectroscopy
ESIElectrospray ionization
IC50Median inhibitory concentration
MSMass spectrometer
LC-MSLiquid chromatography mass spectrometry
HPLCHigh-performance liquid chromatography
HRESIMSHigh-resolution electrospray ionization mass spectrometry
TLCThin-layer chromatography
TPCTotal phenolic content
TFCTotal flavonoid content
TPACTotal phenolic acids content
TTCTotal tannins content
ABTS2,2′-azino-bis(3-ethylbenzthiazoline-6-sulfonic acid)
FRAPFerrous reducing antioxidant potential
DPPH2,2-diphenyl-1-picrylhydrazyl
CUPRACCUPric reducing antioxidant capacity
FALGPAN-[3-(2-furyl)acryloyl]-leu-gly-pro-ala
EGCGEpigallocatechin gallate
TOFTime-of-flight
CD3ODDeuterated methanol
DMSODimethyl sulfoxide
CCColumn chromatography
MeOHMethanol
Et2ODiethyl ether
EtOAcEthyl acetate
n-BuOHn-butanol
UPWUltra-pure water
ACNAcetonitrile
mpMelting point
SDStandard deviation
ANOVAAnalysis of variance
ECMExtracellular matrix
MMPMatrix metalloproteinases
hexHexose moiety
pentPentose moiety
LODLimits of detection
LOQLimits of detection quantification
SDaStandard deviation of the response

References

  1. Smissen, R.D.; Garnock-Jones, P.J. Relationships, classification and evolution of Scleranthus (Caryophyllaceae) as inferred from analysis of morphological characters. Bot. J. Linn. Soc. 2002, 140, 15–29. [Google Scholar] [CrossRef] [Green Version]
  2. Sell, P.D. Scleranthus (Caryophyllaceae). In Flora Europaea, 1st ed.; Tutin, T.G., Heywood, V.H., Burges, N.A., Valentine, D.H., Walters, S.M., Webb, D.A., Eds.; Cambridge University Press: London, UK, 1964; pp. 148–149. [Google Scholar]
  3. Zibareva, L.; Volodin, V.; Saatov, Z.; Savchenko, T.; Whiting, P.; Lafont, R.; Dinan, L. Distribution of phytoecdysteroids in the Caryophyllaceae. Phytochemistry 2003, 64, 499–517. [Google Scholar] [CrossRef]
  4. Zdraveva, P.; Gevrenova, R.; Dimitrova, B. Phenolic compounds of Scleranthus annuus L. (Caryophyllaceae). In Proceedings of the 3rd Conference on Medicinal and Aromatic Plants of Southeast European Countries, Nitra, Slovakia, 5–8 September 2004. [Google Scholar]
  5. Jakimiuk, K.; Strawa, J.W.; Granica, S.; Tomczyk, M. New Flavone C-glycosides from Scleranthus perennis and their anti-collagenase activity. Molecules 2021, 26, 5631. [Google Scholar] [CrossRef] [PubMed]
  6. Bo, Y.S.; Hyun, P.K. Inhibition of collagenase by naturally-occurring flavonoids. Arch. Pharm. Res. 2005, 28, 1152–1155. [Google Scholar] [CrossRef]
  7. Shahidi, F.; Ambigaipalan, P. Phenolics and polyphenolics in foods, beverages and spices: Antioxidant activity and health effects—A review. J. Funct. Foods 2015, 18, 820–897. [Google Scholar] [CrossRef]
  8. Mainka, M.; Czerwińska, M.E.; Osińska, E.; Ziaja, M.; Bazylko, A. Screening of antioxidative properties and inhibition of inflammation-linked enzymes by aqueous and ethanolic extracts of plants traditionally used in wound healing in Poland. Antioxidants 2021, 10, 698. [Google Scholar] [CrossRef]
  9. Kurtz, A.; Oh, S.J. Age related changes of the extracellular matrix and stem cell maintenance. Prev. Med. 2012, 54, S50–S56. [Google Scholar] [CrossRef]
  10. Visse, R.; Nagase, H. Matrix metalloproteinases and tissue inhibitors of metalloproteinases: Structure, function, and biochemistry. Circ. Res. 2003, 92, 827–839. [Google Scholar] [CrossRef] [Green Version]
  11. Löffek, S.; Schilling, O.; Franzke, C.W. Biological role of matrix metalloproteinases: A critical balance. Eur. Respir. J. 2011, 38, 191–208. [Google Scholar] [CrossRef] [Green Version]
  12. Jakimiuk, K.; Gesek, J.; Atanasov, A.G.; Tomczyk, M. Flavonoids as inhibitors of human neutrophil elastase. J. Enzyme Inhib. Med. Chem. 2021, 36, 1016–1028. [Google Scholar] [CrossRef]
  13. Mukherjee, P.K.; Maity, N.; Nema, N.K.; Sarkar, B.K. Bioactive compounds from natural resources against skin aging. Phytomedicine 2011, 19, 64–73. [Google Scholar] [CrossRef] [PubMed]
  14. Mabry, T.J.; Markham, K.R.; Thomas, M.B. The Systematic Identification of Flavonoids; Springer: Berlin/Heidelberg, Germany, 1970. [Google Scholar]
  15. Yayli, N.; Seymen, H.; Baltaci, C. Flavone C-glycosides from Scleranthus uncinatus. Phytochemistry 2001, 58, 607–610. [Google Scholar] [CrossRef]
  16. Markham, K.R.; Chari, V.M. Carbon-13 NMR spectroscopy of flavonoids. In The Flavonoids; Harborne, J.B., Mabry, T.J., Eds.; Springer: Boston, MA, USA, 1970. [Google Scholar]
  17. Agrawal, P.K. Carbon-13 NMR of Flavonoids; Elsevier Science: Amsterdam, The Netherlands, 1982. [Google Scholar]
  18. Kachlicki, P.; Piasecka, A.; Stobiecki, M.; Marczak, Ł. Structural characterization of flavonoid glycoconjugates and their derivatives with mass spectrometric techniques. Molecules 2016, 21, 1494. [Google Scholar] [CrossRef] [PubMed] [Green Version]
  19. Cummins, I.; Brazier-Hicks, M.; Stobiecki, M.; Frański, R.; Edwards, R. Selective disruption of wheat secondary metabolism by herbicide safeners. Phytochemistry 2006, 67, 1722–1730. [Google Scholar] [CrossRef] [PubMed]
  20. Sun, C.L.; Li, S.M.; Yu, S.L.; Yang, Y.X.; Zhang, Y.J.; Han, S.F.; Peng, X. Antioxidant capacity and quantification analysis of chemical constituents isolated from Tetrastigma hemsleyanum leaves. Acta Pol. Pharm. 2021, 78, 361–371. [Google Scholar] [CrossRef]
  21. Ferreres, F.; Gil-Izquierdo, A.; Vinholes, J.; Grosso, C.; Valentão, P.; Andrade, P.B. Approach to the study of C-glycosyl flavones acylated with aliphatic and aromatic acids from Spergularia rubra by high-performance liquid chromatography-photodiode array detection/electrospray ionization multi-stage mass spectrometry. Rapid Commun. Mass Spectrom. 2011, 25, 700–712. [Google Scholar] [CrossRef]
  22. Tsiokanos, E.; Tsafantakis, N.; Termentzi, A.; Aligiannis, N.; Skaltsounis, L.A.; Fokialakis, N. Phytochemical characteristics of bergamot oranges from the Ionian islands of Greece: A multi-analytical approach with emphasis in the distribution of neohesperidose flavanones. Food Chem. 2021, 343, 128400. [Google Scholar] [CrossRef]
  23. Chopin, J.; Dellamonica, G. The Flavonoids; Chapman and Hall: London, UK, 1988. [Google Scholar]
  24. Olennikov, D.N.; Kashchenko, N.I. Glycosylflavones from Silene armeria and S. compacta. Chem. Nat. Compd. 2019, 55, 934–936. [Google Scholar] [CrossRef]
  25. Sut, S.; Dall’Acqua, S.; Uysal, S.; Zengin, G.; Aktumsek, A.; Picot-Allain, C.; Mahomoodally, F. LC-MS, NMR fingerprint of Potentilla argentea and Potentilla recta extracts and their in vitro biopharmaceutical assessment. Ind. Crops Prod. 2019, 131, 125–133. [Google Scholar] [CrossRef]
  26. Ciganović, P.; Jakimiuk, K.; Tomczyk, M.; Zovko Končić, M. Glycerolic licorice extracts as active cosmeceutical ingredients: Extraction optimization, chemical characterization, and biological activity. Antioxidants 2019, 8, 445. [Google Scholar] [CrossRef] [Green Version]
  27. Spiegel, M.; Andruniów, T.; Sroka, Z. Flavones’ and flavonols’ antiradical structure–activity relationship—A quantum chemical study. Antioxidants 2020, 9, 461. [Google Scholar] [CrossRef] [PubMed]
  28. Pientaweeratch, S.; Panapisal, V.; Tansirikongkol, A. Antioxidant, anti-collagenase and anti-elastase activities of Phyllanthus emblica, Manilkara zapota and silymarin: An in vitro comparative study for anti-aging applications. Pharm. Biol. 2016, 54, 1865–1872. [Google Scholar] [CrossRef] [PubMed] [Green Version]
  29. Strawa, J.; Wajs-Bonikowska, A.; Jakimiuk, K.; Waluk, M.; Poslednik, M.; Nazaruk, J.; Tomczyk, M. Phytochemical examination of woolly burdock Arctium tomentosum leaves and flower heads. Chem. Nat. Compd. 2020, 56, 345–347. [Google Scholar] [CrossRef]
  30. Rutkowski, L. Klucz do Oznaczania Roślin Naczyniowych Polski Niżowej; Wydawnictwo Naukowe PWN: Warsaw, Poland, 2006. [Google Scholar]
  31. European Pharmacopoeia, 10th ed.; European Directorate for the Quality of Medicines and HealthCare of the Council of Europe (EDQM): Strasbourg, France, 2019; p. 1588.
  32. Krošlák, E.; Maliar, T.; Nemeček, P.; Viskupičová, J.; Maliarová, M.; Havrlentová, M.; Kraic, J. Antioxidant and proteinase inhibitory activities of selected poppy (Papaver somniferum L.) genotypes. Chem. Biodivers. 2017, 14, e1800374. [Google Scholar] [CrossRef]
  33. Okuda, M.; Kaihara, S.; Murakami, T.; Koide, D.; Ohe, K. Wiley StatsRef: Statistics Reference Online; John Wiley Sons, Ltd.: Chichester, UK, 2014; Volume 18, pp. 71–77. [Google Scholar]
  34. Siciliano, T.; De Tommasi, N.; Morelli, I.; Braca, A. Study of flavonoids of Sechium edule (Jacq) Swartz (Cucurbitaceae) different edible organs by liquid chromatography photodiode array mass spectrometry. J. Agric. Food Chem. 2004, 52, 6510–6515. [Google Scholar] [CrossRef]
  35. Yayli, N.; Baltaci, C.; Genç, H.; Terzioǧlu, S. Phenolic and flavone C-glycosides from Scleranthus uncinatus. Pharm. Biol. 2002, 40, 369–373. [Google Scholar] [CrossRef]
  36. Jakimiuk, K.; Wink, M.; Tomczyk, M. Flavonoids of the Caryophyllaceae. Phytochem. Rev. 2021, 20, 179–218. [Google Scholar] [CrossRef]
Figure 1. Chemical structures of compounds 69.
Molecules 27 02015 g001
Figure 2. Important 1H–1H COSY and HMBC correlations for compound 6.
Molecules 27 02015 g002
Table 1. Qualitative analysis of SP1SP6 and SA1SA6 by liquid chromatography photodiode array detection mass spectrometry (LC-PDA-MSn).
AnalyteRt
(Min)
UV Spectra
(Λ Max Nm)
-ESI–MS (m/z)Fragmentation APredicted Compounds
I7.6268, 302459293Apiopaeonoside (5) I
II7.9260, 300sh, 325385191Quinic acid derivative
III11.35270, 345579459, 399, 369, 313Flavone C-hex-C-pent derivative
IV12.8257, 273, 348579459, 399, 369Lucenin-1 (7) I
V17.51270, 348579459Flavone 6,8-di-C-glycoside derivative
VI18.01254, 270, 348593473vicenin-2 (8) I
VII19.45254, 270, 348593473, 383, 312Flavone 6,8-di-C-glycoside derivative
VIII21.86255, 273, 348593473, 383, 312Chrysoeriol-6-C-β-d-glucopyranoside-8-C-α-arabinoside (9) I
IX33.18275, 348593473, 383Flavone 6,8-di-C-glycoside derivative
X35.23270, 348593473, 383Flavone 6,8-di-C-glycoside derivative
XI40.13265, 348563473, 383Flavone C-hex-C-pent derivative
XII41.64270, 345579489, 399, 327Flavone C-hex-C-pent derivative
XIII42.4255, 270, 347635413, 308Flavone C-hex-C-pent derivative
XIV44.8255, 270, 348621579, 531, 399, 327scleranthoside A (1) I
XV46.2270, 345677413, 323Flavone-C-pent-O-hex derivative
XVI48.6255, 270, 348593413, 323scleranthoside B (2) I
XVII56.69255, 270, 349677413Flavone-C-pent-O-hex derivative
XVIII58.47254, 268, 348677545, 455, 413, 322scleranthoside C (3) I
XIX64.11268, 348635413Luteolin-8-C-pent-O-hex derivative
XX66.86268, 348635413Luteolin-8-C-pent-O-hex derivative
XXI74.55253, 270, 348677413, 323Luteolin-8-C-pent-O-hex derivative
XXII75.98252, 268, 348677413scleranthoside D (4) I
XXIII90.87270, 348677413Luteolin-8-C-pent-O-hex derivative
XXIV98.34252, 268, 348677635, 545 455, 413scleranthoside D (6) I
A bold, most abundant ion; hex, hexoside; pent, pentoside; I compounds 19 isolated from S. perennis.
Table 2. Phytochemical analysis of total phenolic (TPC), phenolic acid (TPAC), and tannin contents (TTC) of SA1SA6 and SP1SP6.
SampleTPC
(Mg Peq/G Extract) A
TPAC
(Mg Caeq/G Extract) B
TTC
(Mg Peq/G Extract) A
SA1
SP1
103.16 ± 0.80
122.96 ± 1.96
7.20 ± 0.19
4.68 ± 0.18
8.64 ± 0.15
9.78 ± 0.98
SA2
SP2
103.08 ± 1.84
107.76 ± 0.52
6.66 ± 0.18
6.03 ± 0.27
11.01 ± 0.98
20.16 ± 1.47
SA3
SP3
95.72 ± 1.69
99.20 ± 0.40
6.12 ± 0.17
4.95 ± 0.12
7.35 ± 0.18
1.6 ± 0.15
SA4
SP4
106.04 ± 2.71
165.16 ± 2.83
8.91 ± 0.27
5.58 ± 0.15
8.07 ± 1.35
12.57 ± 0.89
SA5
SP5
217.20 ± 1.60
240.00 ± 2.01
11.34 ± 0.63
7.47 ± 2.80
6.3 ± 0.90
6.69 ± 0.97
SA6
SP6
159.44 ± 1.40
161.32 ± 2.91
9.19 ± 0.54
5.67 ± 0.18
8.22 ± 0.45
1.74 ± 0.18
All data are represented as the mean with standard deviation from triplicate measurement; A expressed as pyrogallol equivalents (Peq); B expressed as caffeic acid equivalents (CAeq).
Table 3. Quantification of selected metabolites (19) in extracts and fractions (SA1SA6, SP1SP6).
Compound ASA1SP1SA2SP2SA3SP3SA4SP4SA5SP5SA6SP6
1BLQ0.12 ± 0.010.20 ± 0.010.23 ± 0.01ND0.11 ± 0.01BLQ0.17 ± 0.011.61 ± 0.011.61 ± 0.010.57 ± 0.030.52 ± 0.04
20.56 ± 0.011.66 ± 0.011.10 ± 0.072.20 ± 0.110.73 ± 0.012.09 ± 0.070.12 ± 0.011.26 ± 0.015.08 ± 0.0212.85 ± 0.011.28 ± 0.015.22 ± 0.01
30.36 ± 0.014.90 ± 0.050.94 ± 0.036.29 ± 0.130.62 ± 0.016.38 ± 0.060.34 ± 0.015.55 ± 0.012.03 ± 0.259.10 ± 0.080.32 ± 0.011.05 ± 0.02
4BLQ1.98 ± 0.02BLQ0.71 ± 0.01ND2.07 ± 0.010.24 ± 0.063.81 ± 0.018.14 ± 0.1418.97 ± 0.08NDND
61.05 ± 0.011.06 ± 0.020.58 ± 0.010.91 ± 0.040.68 ± 0.010.73 ± 0.010.36 ± 0.010.93 ± 0.013.79 ± 0.016.93 ± 0.04BLQND
70.72 ± 0.020.11 ± 0.010.56 ± 0.04BLQ0.46 ± 0.030.10 ± 0.01NDND0.25 ± 0.01ND3.40 ± 0.011.44 ± 0.02
80.19 ± 0.010.16 ± 0.010.16 ± 0.010.15 ± 0.010.13 ± 0.010.15 ± 0.01NDND0.28 ± 0.11ND0.90 ± 0.011.37 ± 0.01
90.11 ± 0.01NDBLQNDBLQNDNDND0.33 ± 0.12ND0.45 ± 0.050.50 ± 0.01
Total13.74 ± 0.117.4 ± 0.2713.49 ± 0.1818.69 ± 0.2111.27 ± 0.0518.97 ± 0.324.62 ± 0.1617.6 ± 0.2671.8 ± 3.1136.13 ± 0.3920.52 ± 0.7821.03 ± 0.36
5ND1.37 ± 0.04ND2.11 ± 0.04ND1.08 ± 0.02NDND0.98 ± 0.120.83 ± 0.110.74 ± 0.047.74 ± 0.13
A Content presented as mg/g of extract calculated in 3 equivalents for 14, 69; all data are represented as the mean with standard deviation from triplicate measurement; BLQ, below the limit of quantification; ND, not detected.
Table 4. Antioxidant activities of SP1SP6, SA1SA6, and compounds 19.
SampleDPPH A
(µM Teq)
ABTS A
(µM Teq)
FRAP B
(mM Fe2+/mL)
CUPRAC A
(µM Teq)
SA1
SP1
193.16 ± 2.56
140.43 ± 2.76
215.74 ± 2.46
196.95 ± 1.23
2.02 ± 0.49
1.92 ± 0.43
7.14 ± 1.32
5.82 ± 0.32
SA2
SP2
186.41 ± 1.93
64.07 ± 0.97
253.65 ± 3.72
67.94 ± 2.03
3.17 ± 0.66
1.57 ± 0.07
5.38 ± 0.76
9.34 ± 1.63
SA3
SP3
118.49 ± 1.46
122.28 ± 1.83
425.69 ± 2.33
56.11 ± 2.13
3.30 ± 0.15
2.64 ± 0.33
13.29 ± 0.76
17.69 ± 1.96
SA4
SP4
157.09 ± 0.97
273.53 ± 1.93
175.99 ± 2.03
443.96 ± 2.42
1.96 ± 0.53
4.65 ± 0.35
1.86 ± 0.32
5.33 ± 0.54
SA5
SP5
354.32 ± 2.90
269.31 ± 0.97
577. 82 ± 3.51
311.45 ± 3.05
6.74 ± 0.98
6.73 ± 0.41
67.80 ± 1.32
97.26 ± 1.87
SA6
SP6
386.59 ± 2.19
292.51 ± 2.03
459.29 ± 1.40
271.94 ± 1.68
7.50 ± 0.32
5. 78 ± 0.42
45.82 ± 1.01
70.44 ± 1.28
1405.15 ± 3.12765.16 ± 2.8339.25 ± 1.42581.32 ± 3.61
2198.43 ± 2.40188.57 ± 1.865.68 ± 0.68114.56 ± 2.04
37.11 ± 0.59198.57 ± 2.462.37 ± 0.3667.30 ± 1.30
49.64 ± 0.82302.05 ± 2.422.65 ± 0.4744.22 ± 1.35
561.96 ± 1.90444.23 ± 0.472.75 ± 0.1148.46 ± 1.75
66.69 ± 0.97169.27 ± 1.683.05 ± 0.2518.57 ± 0.76
7409.16 ± 2.03796.61 ± 1.2345.30 ± 2.49116.16 ± 0.76
8176.71 ± 0.97369.24 ± 3.055.16 ± 0.9627.15 ± 1.32
9407.05 ± 1.83586.69 ± 2.919.07 ± 0.4518.20 ± 0.76
All data are represented as the mean with standard deviation from triplicate measurement; A expressed as Trolox equivalents (Teq); B expressed as Fe2+ equivalents.
Table 5. Anti-collagenase activity of compounds 69 and their respective IC50 values.
CompoundIC50 (µM)
639.59 ± 1.21
773.86 ± 1.03
853.37 ± 0.88
971.06 ± 0.97
EGCG A34.82 ± 0.53
All data are represented as the mean of IC50 values with standard deviation from triplicate measurements; A epigallocatechin gallate, positive control.
Table 6. Percentage of anti-collagenase activity of SP1SP6 and SA1SA6 (at 400 µg/mL).
SamplePercentage of Inhibition (%) A
SA1
SP1
32.04 ± 0.45
22.06 ± 0.34
SA2
SP2
10.90 ± 0.11
6.46 ± 0.09
SA3
SP3
12.12 ± 0.41
11.13 ± 0.14
SA4
SP4
19.42 ± 0.22
6.69 ± 0.10
SA5
SP5
16.59 ± 0.19
15.40 ±0.32
SA6
SP6
7.11 ± 0.17
2.39 ± 0.07
A All data are represented as the mean of percentage values with standard deviation from triplicate measurements.
Table 7. Regression equation, linear range, limit of detection (LOD), limit of quantification (LOQ), accuracy, and precision obtained during optimization of the LC-PDA method.
CompoundRegression Equation AR2Linear Range (µg/mL)LOD
(µg/mL)
LOQ
(µg/mL)
Accuracy
(%)
Precision
(%) B
3y = 2374x + 63.1190.99990.05–100.030.0998.43 ± 3.701.3/1.95
5y = 4563.2x − 28.0980.99990.01–50.0030.01101.28 ± 3.950.97/1.23
A The value for y corresponds to the peak area and x to the concentration, respectively; B expressed as RSD measured intra- and inter-day, respectively.
Publisher’s Note: MDPI stays neutral with regard to jurisdictional claims in published maps and institutional affiliations.

