Article

Kinetic Study of the Oxidative Addition Reaction between Methyl Iodide and [Rh(imino-β-diketonato)(CO)(PPh)3] Complexes, Utilizing UV–Vis, IR Spectrophotometry, NMR Spectroscopy and DFT Calculations

by
Hendrik Ferreira
1,
Marrigje Marianne Conradie
1,* and
Jeanet Conradie
1,2
1
Department of Chemistry, University of the Free State, Bloemfontein 9300, South Africa
2
Department of Chemistry, UiT The Arctic University of Norway, N-9037 Tromsø, Norway
*
Author to whom correspondence should be addressed.
Molecules 2022, 27(6), 1931; https://doi.org/10.3390/molecules27061931
Submission received: 20 February 2022 / Revised: 9 March 2022 / Accepted: 10 March 2022 / Published: 16 March 2022
(This article belongs to the Special Issue Chemical Kinetics in Metal Complexes)

Abstract

:
The oxidative addition of methyl iodide to [Rh(β-diketonato)(CO)(PPh)3] complexes, as modal catalysts of the first step during the Monsanto process, are well-studied. The β-diketonato ligand is a bidentate (BID) ligand that bonds, through two O donor atoms (O,O-BID ligand), to rhodium. Imino-β-diketones are similar to β-diketones, though the donor atoms are N and O, referred to as an N,O-BID ligand. In this study, the oxidative addition of methyl iodide to [Rh(imino-β-diketonato)(CO)(PPh)3] complexes, as observed on UV–Vis spectrophotometry, IR spectrophotometry and NMR spectrometry, are presented. Experimentally, one isomer of [Rh(CH3COCHCNPhCH3)(CO)(PPh3)] and two isomers of [Rh(CH3COCHCNHCH3)(CO)(PPh3)] are observed—in agreement with density functional theory (DFT) calculations. Experimentally the [Rh(CH3COCHCNPhCH3)(CO)(PPh3)] + CH3I reaction proceeds through one reaction step, with a rhodium(III)-alkyl as the final reaction product. However, the [Rh(CH3COCHCNHCH3)(CO)(PPh3)] + CH3I reaction proceeds through two reaction steps, with a rhodium(III)-acyl as the final reaction product. DFT calculations of all the possible reaction products and transition states agree with experimental findings. Due to the smaller electronegativity of N, compared to O, the oxidative addition reaction rate of CH3I to the two [Rh(imino-β-diketonato)(CO)(PPh)3] complexes of this study was 7–11 times faster than the oxidative addition reaction rate of CH3I to [Rh(CH3COCHCOCH3)(CO)(PPh3)].

1. Introduction

Rhodium complexes are used in several industrial processes as catalysts [1,2,3]. Rhodium complexes, as catalysts, are used, for example, in the hydrosilylation crosslinking of silicone rubber [4], for making nitric acid [5] and in the hydrogenation of benzene to cyclohexane [6]. The [Rh(β-diketonato)(CO)(PPh)3] complex, with (β-diketonato = acetylacetono (acac)) as a hex-1-ene hydroformylation catalyst, produced 68% hex-2-ene [7]. Probably the most well-known example of a rhodium process used in the industry is the rhodium catalyzed carbonylation of methanol to produce acetic acid by the Monsanto process [8,9,10], where the first organometallic step involves the oxidative addition of methyl iodide to cis-[Rh(CO)2I2]. [Rh(β-diketonato)(CO)(PPh)3] complexes, as model catalysts of the first step of the Monsanto process, are well-studied [11,12]. It is found that more electronegative groups attached to the backbone of the β-diketonato ligand and slowed down the oxidative addition reaction rate of methyl iodide to [Rh(β-diketonato)(CO)(PPh)3] complexes [11]. The β-diketonato ligand is a bidentate (BID) ligand that bonds through two O donor atoms (O,O-BID ligand) to rhodium. Imino-β-diketones are similar to β-diketones, though the donor atoms are N and O, hereby referred to as a N,O-BID ligand. The influence of the electronegativity of the two donor atoms (O,O) vs. (N,O) on the rate of oxidative addition of methyl iodide to the [Rh(L,L′-BID)(CO)(PPh)3] complexes, [Rh(CH3COCHCNHCH3)(CO)(PPh3)] 3A and [Rh(CH3COCHCNPhCH3)(CO)(PPh3)] 3B (Scheme 1), is presented in this research article. Results obtained by different experimental methods (UV–Vis spectrophotometry, IR spectrophotometry and NMR spectrometry) are presented. A density functional theory (DFT) study shed further light on experimental findings.

2. Results and Discussion

2.1. Synthesis of Rhodium(I) Complexes

The Rh-dicarbonyl complexes [Rh(CH3COCHCNHCH3)(CO)2] 2A and [Rh(CH3COCHCNPhCH3)(CO)2] 2B were synthesized from μ-dichloro-tetracarbonyldirhodium (obtained from Sigma Aldrich, Dramstadt, Germany) and the appropriate ligands, (CH3COCH2CNHCH3) 1A and (CH3COCH2CNPhCH3) 1B, respectively, in a methanol solution, see Scheme 1. The red methanol solution of the dirhodium complex turned to a yellow colour after the addition of the ligands. The extraction of the dicarbonyl complexes was performed with n-hexane, until the organic solvent that was used to extract it was clear. The collected solvent containing the product was then concentrated by evaporation. After a fine powder crystallized, the solution was filtered again, and the complex crystallized slowly from the n-hexane solution. Varshavsky reported the synthesis and properties of 2A [13] and related Rh-dicarbonyl complexes containing β-aminivinyl ketones [14]. The structure of 2B was confirmed by solid state crystal analysis [15].
Synthesizing the triphenylphosphine, containing Rh complexes [Rh(CH3COCHCNHCH3)(CO)(PPh3)] 3A and [Rh(CH3COCHCNPhCH3)(CO)(PPh3)] 3B, was performed similarly to the method of various researchers, when synthesizing Rh-monocarbonyl-triphenylphosphine-β-diketonato complexes from Rh-dicarbonyl-β-diketonato complexes [16,17,18]. The slow addition of the triphenylphosphine hexane solution to the dicarbonyl Rh complex hexane solution yielded tiny bubbles of CO gas, formed during the reaction. The reaction was left approximately 5 min, until no more bubbles were formed and the flask was then left at room temperature (with a slight draft in open air). The crystallization of the final products was performed in a manner similar to the dicarbonyl complexes. Varshavsky reported the synthesis and properties of many related Rh-monocarbonyl-β-ketoiminato complexes containing tertiary phosphines [19]. Two isomers are possible for each of 3A and 3B—one with the Nβ-ketoiminato trans to CO (N-trans-CO) and one with Oβ-ketoiminato trans to CO (O-trans-CO), as shown in Scheme 1. On the 1H-NMR 8.6% 3A isomer, N-trans-CO and 91.4% 3A isomer O-trans-CO is observed, while 100% 3B isomer O-trans-CO and no 3B isomer N-trans-CO is observed. The major isomer of 3A and 3B, observed as the O-trans-CO form, agrees with the fact that the 3A isomer O-trans-CO [20] and molecules related to 3B isomer O-trans-CO [21,22,23,24], could be isolated and characterized by solid state crystal structures.
On IR, it was not possible to distinguish between the different isomers of 3A and 3B—only one peak, corresponding to the CO stretching, was observed, at 1952.7 (3A) and 1966.6 (3B) cm−1. The IR stretching frequencies of the carbonyl group in 3A and 3B are at lower wavenumbers than that of the dicarbonyl complexes 2A (2044.1 and 1971.0 cm−1) and 2B (2059.0 and 1997.7 cm−1), respectively. This is indicative of a strengthening of the CO bonds, due to the addition of the more electron-rich triphenylphosphine ligand to the complex. The more electronegative groups or atoms will attract electrons in a bond more towards themselves, therefore slightly shortening and, thus, strengthening the bonds—which shifts the stretching frequency to smaller values.

2.2. DFT Study of Rhodium(I) and Rhodium(III) Complexes

2.2.1. Rhodium(I)

The density functional theory (DFT) calculated optimized structures of the two possible isomers each of 3A and 3B are shown in Figure 1. The complexes have a square planar geometry, though the 3B isomer N-trans-CO exhibits a distorted square planar geometry—due to the steric stress between the phenyl ring that is attached to the N atom and the phenyl rings attached to the P atom. This stress causes the P atom to be pushed out of the plane and, therefore, 3B isomer N-trans-CO has a higher energy than 3B isomer O-trans-CO and is less stable. Using the electronic energies of the optimized molecules in the Boltzmann equation, 96.5% of 3A isomer O-trans-CO and 100% of 3B isomer O-trans-CO is predicted, in agreement with experimental observation. The rhodium(I) [Rh(N,O-BID)(CO)(PPh3)] complexes 3A and 3B are d8 complexes with electron occupation d x y 2 d x z 2 d y z 2 d z 2 2 d x 2 y 2 0 , see the selected d-based molecular orbitals (MOs) for [Rh(CH3COCHCNHCH3)(CO)(PPh3)] 3A in Figure 2. The highest occupied molecular orbitals (HOMOs) of both 3A and 3B are mainly of rhodium d z 2 character, see Figure 2. The d z 2 HOMO plays an important role during the oxidative addition reaction between rhodium(I) complexes with CH3I [25,26], as will be discussed in Section 2.3.4 (below).

2.2.2. Rhodium(III)

Oxidative addition to the two possible isomers of [Rh(CH3COCHCNHCH3)(CO)(PPh3)] 3A, can theoretically lead to 12 possible Rh(III)-alkyl products (indicated with 1a–12a in Table 1, as well as their enantiomers 1b–12b) and 6 possible Rh(III)-acyl products (indicated with 13a–18a, as well as their enantiomers 13b–18b, in Table 1). The relative electronic energies of the optimized geometries of all the possible Rh(III) isomers that could be optimized are also given in Table 1. Some of the Rh(III)-acyl geometries were converted during the optimization to the geometries of the lowest energy Rh(III)-acyl isomers. The structures and DFT-calculated energies of the possible alkyl and acyl reaction products of the [Rh(CH3COCHCNPhCH3)(CO)(PPh3)] 3B + CH3I reaction are given in Table 2. Since enantiomers have the same chemical properties and energies, we will only discuss the 12 possible Rh(III)-alkyl products (1a–12a) and 6 possible Rh(III)-acyl products (13a–18a). The energies obtained for the different Rh(III) products 1a–18a in Table 1 and Table 2 lead to the following insights:
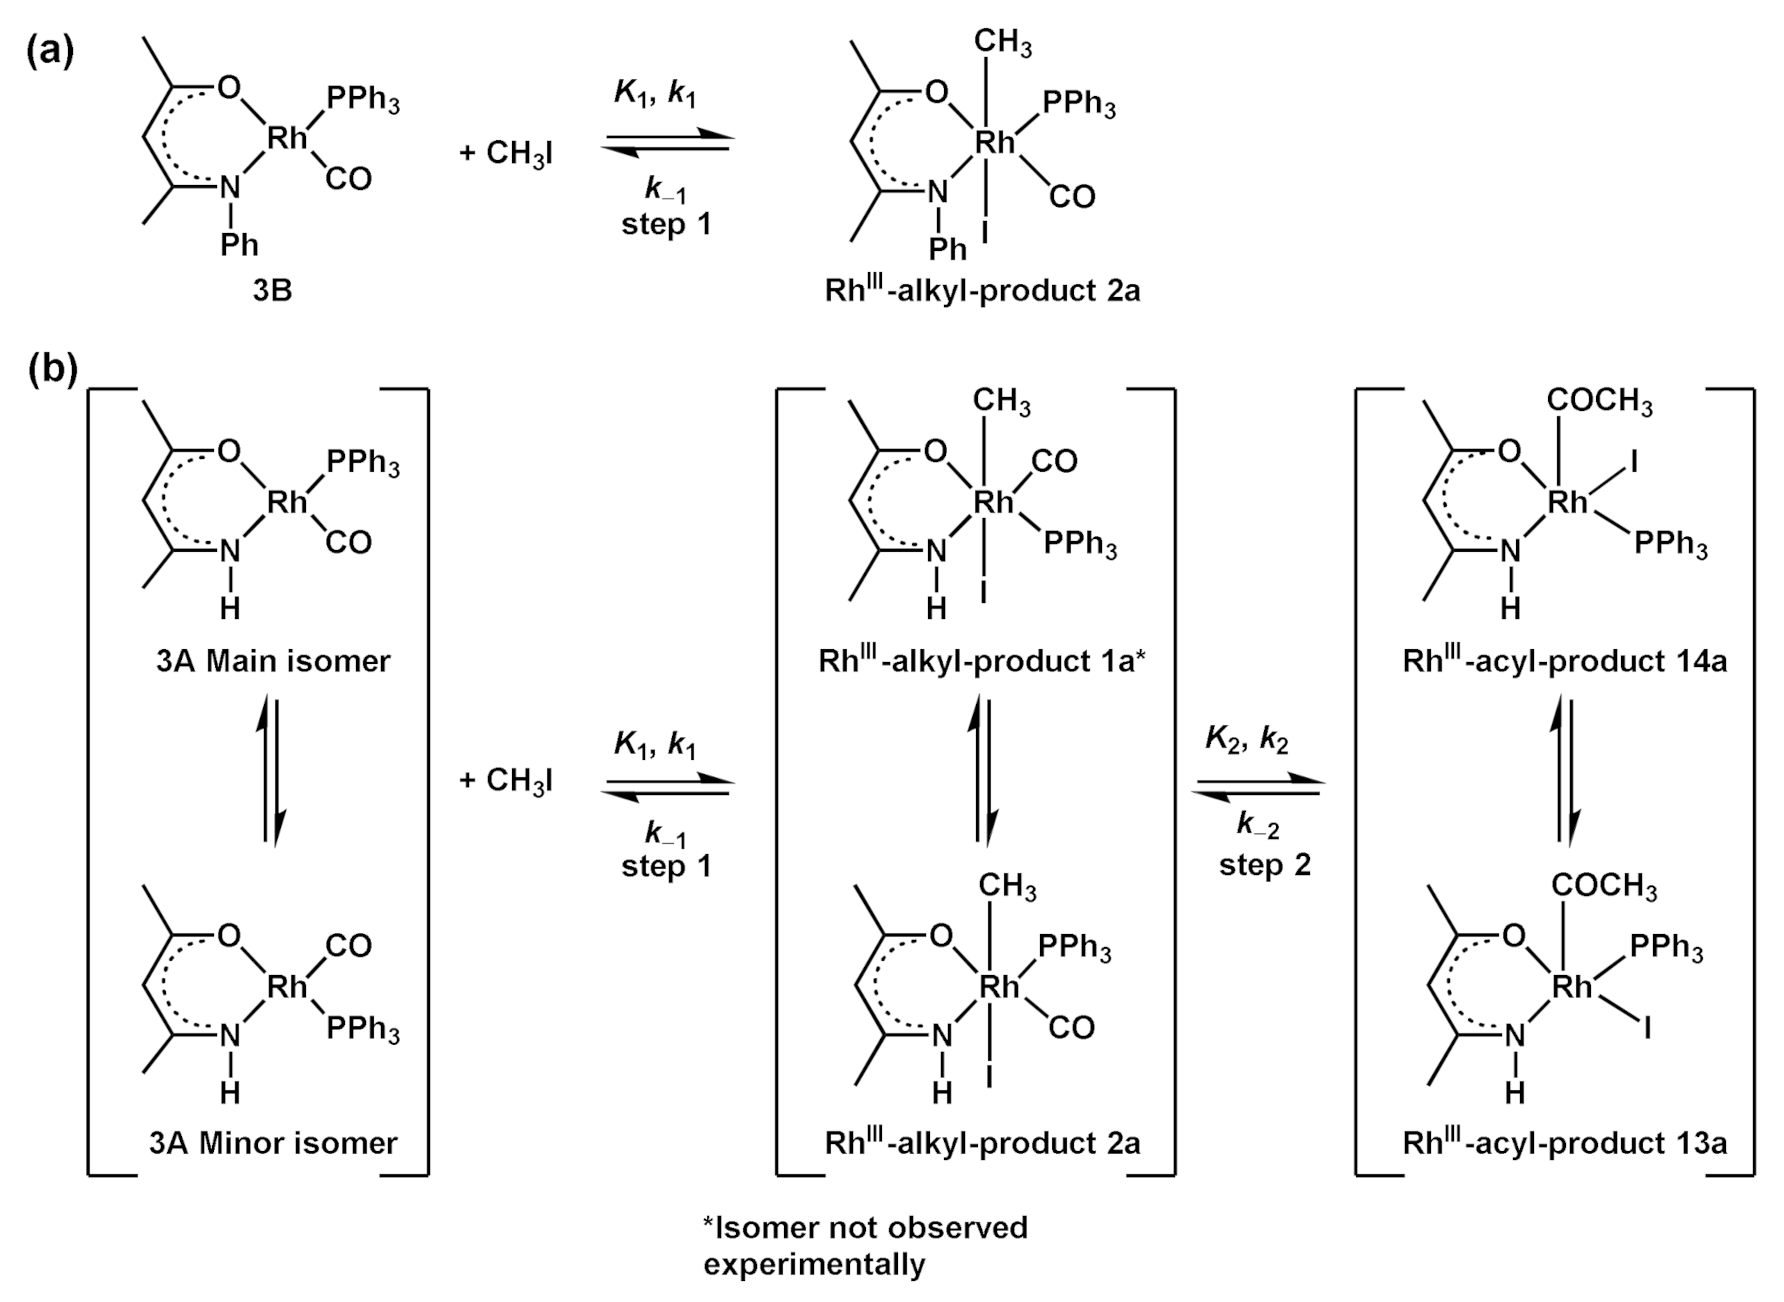
  • Products of [Rh(CH3COCHCNHCH3)(CO)(PPh3)] 3A + CH3I reaction (Table 1): Evaluating the energies of the different Rh(III)-alkyl isomers in Table 1, it can be seen that the most preferred orientation of the product geometry is with the Oβ-ketoiminato atom O atom of the ligand trans to CO (O-trans-CO) and the CH3 and I atoms bonded at the apical positions (top and bottom, with respect to the square planar geometry), since it has the lowest relative energy (2a, reaction product of CH3I and 3A isomer O-trans-CO). The Rh(III)-alkyl isomer with the Nβ-ketoiminato atom of the ligand trans to CO, and the CH3 and I atoms bonded at the apical positions (1a, reaction product of CH3I and 3A isomer N-trans-CO) is only slightly higher in energy (0.07 eV). The energetically-preferred Rh(III)-alkyl isomer to form is, thus, 2a, while 1a may form in very small amounts. Evaluation of the energies of the Rh(III)-acyl isomers in Table 1, indicates that the two Rh(III)-acyl isomers 13a and 14a with the COCH3 ligand in the apical position have the lowest energy. Furthermore, the energy of Rh(III)-acyl isomers 13a and 14a are ca. 0.3 eV lower than the energy of the lowest energy Rh(III)-alkyl isomers 1a and 2a. This indicates that the Rh(III)-alkyl product of oxidative addition could convert, via CO insertion, to the lower more stable Rh(III)-acyl product as the final reaction product. Rh(III)-acyl 13a has slightly higher energy (0.04 eV) than 14a, therefore, the amount of 13a will be less than 14a.
Table 1. Calculated energies (using different DFT methods) and structures of the possible alkyl (1–12) and acyl (13–18) products of the oxidative addition reaction [Rh(CH3COCHCNHCH3)(CO)(PPh3)] 3A + CH3I. In each cell the top entry gives PW91/TZP (PW91/TZP ZPE corrected in brackets), the middle entry TPSS-D3/TZ2P and bottom entry PBE-D3 DFT/TZ2P calculated energy.
ProductStructuresRelative
Energy
(eV)
ProductStructuresRelative
Energy
(eV)
ProductStructuresRelative
Energy
(eV)
1a Molecules 27 01931 i0010.34 (0.29)
0.32
0.49
7a Molecules 27 01931 i0020.41 (0.35)
0.38
0.52
13a Molecules 27 01931 i0030.04 (0.04)
0.00
0.01
1b Molecules 27 01931 i0040.34 (0.29)7b Molecules 27 01931 i0050.41 (0.35)13b Molecules 27 01931 i0060.04 (0.04)
2a Molecules 27 01931 i0070.26 (0.21)
0.22
0.38
8a Molecules 27 01931 i0080.64 (0.58)
0.55
0.71
14a Molecules 27 01931 i0090.00 (0.03)
0.01
0.00
2b Molecules 27 01931 i0100.26 (0.19)8b Molecules 27 01931 i0110.64 (0.58)14b Molecules 27 01931 i0120.00 (0.00)
3a Molecules 27 01931 i0130.43 (0.34)
0.32
0.46
9a Molecules 27 01931 i0140.44 (0.37)
0.42
0.56
15a Molecules 27 01931 i015-
3b Molecules 27 01931 i0160.43 (0.35)9b Molecules 27 01931 i0170.44 (0.37)15b Molecules 27 01931 i018-
4a Molecules 27 01931 i0190.72 (0.64)
0.59
0.77
10a Molecules 27 01931 i0200.35 (0.28)
0.30
0.44
16a Molecules 27 01931 i0210.79 (0.72)
0.68
0.68
4b Molecules 27 01931 i0220.72 (0.63)10b Molecules 27 01931 i0230.35 (0.28)16b Molecules 27 01931 i0240.79 (0.70)
5a Molecules 27 01931 i0250.46 (0.37)
0.22
0.38
11a Molecules 27 01931 i0260.87 (0.74)
0.51
0.69
17a Molecules 27 01931 i027-
5b Molecules 27 01931 i0280.46 (0.37)11b Molecules 27 01931 i0290.87 (0.74)17b Molecules 27 01931 i030-
6a Molecules 27 01931 i0310.66 (0.57)
0.52
0.70
12a Molecules 27 01931 i0320.68 (0.59)
0.48
0.63
18a Molecules 27 01931 i033-
6b Molecules 27 01931 i0340.66 (0.57)12b Molecules 27 01931 i0350.68 (0.62)18b Molecules 27 01931 i036-
Table 2. Calculated energies (using different DFT methods) and structures of the possible alkyl (1–12) and acyl (13–18) products of the oxidative addition reaction [Rh(CH3COCHCNPhCH3)(CO)(PPh3)] 3B + CH3I. In each cell, the top entry gives PW91/TZP (PW91/TZP ZPE, corrected in brackets), middle entry TPSS-D3/TZ2P, and bottom entry PBE-D3 DFT/TZ2P calculated energy.
ProductStructuresRelative
Energy
(eV)
ProductStructuresRelative
Energy
(eV)
ProductStructuresRelative
Energy
(eV)
1a Molecules 27 01931 i0370.49 (0.50)
0.33
0.48
7a Molecules 27 01931 i0380.15 (0.17)
0.07
0.19
13a Molecules 27 01931 i0390.00 (0.08)
0.00
0.00
1b Molecules 27 01931 i0400.49 (0.51)7b Molecules 27 01931 i0410.15 (0.16)13b Molecules 27 01931 i0420.00 (0.08)
2a Molecules 27 01931 i0430.02 (0.00)
0.00
0.15
8a Molecules 27 01931 i0440.64 (0.64)
0.47
0.60
14a Molecules 27 01931 i0450.28 (0.33)
0.20
0.19
2b Molecules 27 01931 i0460.02 (0.03)8b Molecules 27 01931 i0470.64 (0.64)14b Molecules 27 01931 i0480.28 (0.31)
3a Molecules 27 01931 i0490.57 (0.58)
0.41
0.59
9a Molecules 27 01931 i0500.34 (0.32)
0.27
0.41
15a Molecules 27 01931 i0510.37 (0.35)
0.25
0.24
3b Molecules 27 01931 i0520.57 (0.56)9b Molecules 27 01931 i0530.34 (0.34)15b Molecules 27 01931 i0540.37 (0.35)
4a Molecules 27 01931 i0550.85 (0.85)
0.66
0.84
10a Molecules 27 01931 i0560.26 (0.27)
0.18
0.30
16a Molecules 27 01931 i0570.71 (-)
0.52
0.49
4b Molecules 27 01931 i0580.85 (0.84)10b Molecules 27 01931 i0590.26 (0.27)16b Molecules 27 01931 i0600.71 (-)
5a Molecules 27 01931 i0610.44 (0.43)
0.22
0.38
11a Molecules 27 01931 i0620.48 (0.51)
0.31
0.46
17a Molecules 27 01931 i063-
5b Molecules 27 01931 i0640.44 (0.41)11b Molecules 27 01931 i0650.48 (0.51)17b Molecules 27 01931 i066-
6a Molecules 27 01931 i0670.15 (0.15)
0.03
0.16
12a Molecules 27 01931 i0680.66 (0.61)
0.43
0.59
18a Molecules 27 01931 i0690.36 (0.40)
0.32
0.29
6b Molecules 27 01931 i0700.15 (0.41)12b Molecules 27 01931 i0710.64 (0.66)18b Molecules 27 01931 i0720.36 (0.38)
  • Products of [Rh(CH3COCHCNPhCH3)(CO)(PPh3)] 3B + CH3I reaction (Table 2): From the energies presented in Table 2, it is clear that Rh(III)-alkyl 2a and Rh(III)-acyl 13a are equi-energetic—in other words, there is no driving force for the Rh(III)-alkyl 2a to convert via CO insertion to the Rh(III)-acyl 13a. The Rh(III)-alkyl 2a product, with the O atom of the ligand trans to the CO, and the CH3 and I atoms, bonded at the apical positions (top and bottom with respect to the square planar geometry), are predicted to be the final reaction product of the [Rh(CH3COCHCNPhCH3)(CO)(PPh3)] 3B + CH3I reaction.
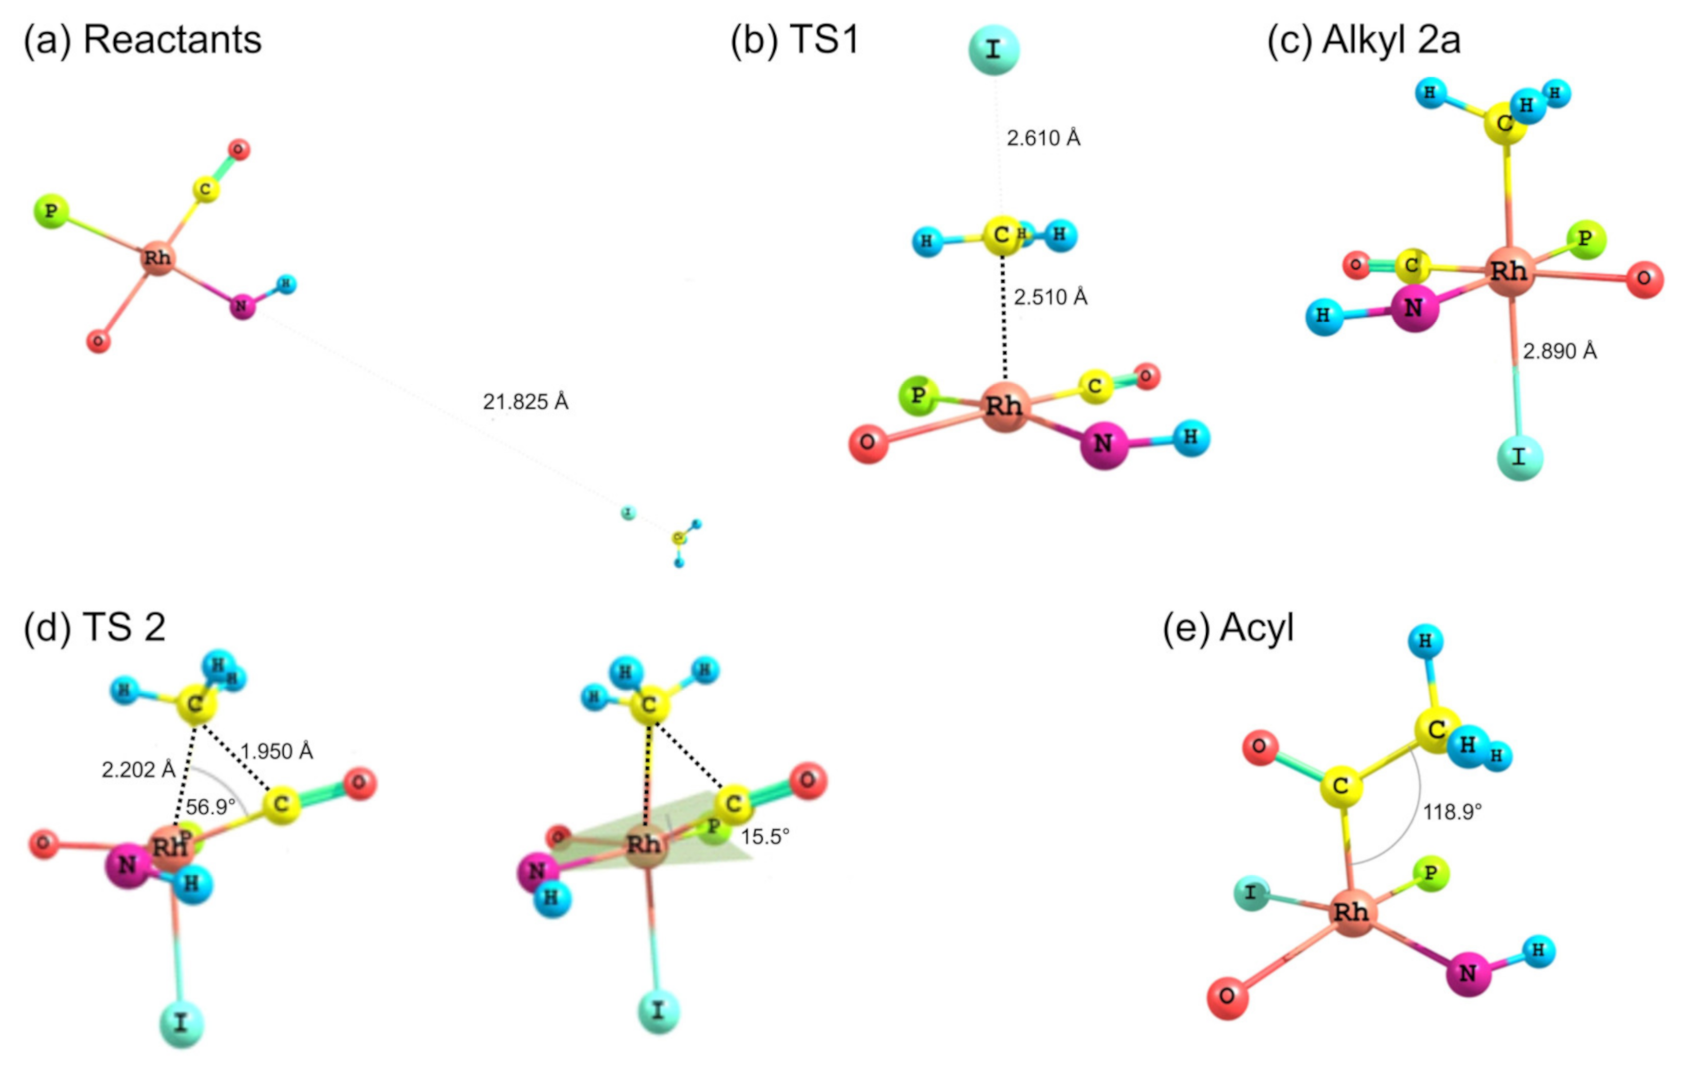
  • The [Rh(N,O-BID)(CO)(PPh3)] + CH3I oxidative addition reaction is theoretically only possible if the activation barrier of the transition state is low enough to form the product—in this case, a Rh(III)-alkyl product. Similarly the CO insertion reaction is theoretically only possible if there is a driving force to lower energy (to form the product) and the activation barrier of the transition state is low enough to form the Rh(III)-acyl product. A DFT study of the transition states will be presented in Section 2.3.4.

2.3. Kinetics of Iodomethane Oxidative Addition to Rhodium(I)

The oxidative addition reactions between the two [Rh(N,O-BID)(CO)(PPh3)] complexes 3A and 3B and CH3I are presented. The reaction is followed by IR, UV–Vis, and NMR. Additionally, a DFT study of the reaction will be presented to compliment the experimental findings. In each subsection, the results of 3B will be presented first, followed by the results for 3A, since it was experimentally found that 3B exhibited a single reaction step, while the 3A + CH3I reaction showed two steps.

2.3.1. IR Study

The oxidative addition reaction was first followed on IR, since this technique is ideal to distinguish between CO bonds in metal-CO complexes of Rh(I)-carbonyl and Rh(III)-complexes. CO groups in Rh(I)-carbonyl complexes resonate at ~1980–2000 cm−1, CO groups in Rh(III)-alkyl-carbonyl complexes resonate at ~2050–2100 cm−1 and CO groups in Rh(III)-acyl complexes resonate at ~1700–1750 cm1 [27].
In Figure 3a, which displays the IR spectra of the CH3I reaction with [Rh(CH3COCHCNPhCH3)(CO)(PPh3)] 3B, it can be seen that there are two main peaks that vary during the reaction. The first peak, at 1973.62 cm−1, is assigned to the disappearance of the Rh(I) complex as the reaction progresses and a product is formed, see Figure 3c. The second peak at 2059.72 cm−1 is assigned to the formation of the Rh(III)-alkyl reaction product. The rate constants determined from the IR kinetic experiments for different CH3I concentrations are given in Table 3. From Table 3, it can be seen that the rate of disappearance of [Rh(CH3COCHCNPhCH3)(CO)(PPh3)] 3B and rate of the formation of the Rh(III)-alkyl product show very good correlation, since the values are so close to each other. This trend is seen across all three concentrations. The increase in the observed kinetic rate constant with the increase in CH3I concentration indicates that this reaction step is concentration-dependent. From the results obtained from the IR study, the reaction step of the [Rh(CH3COCHCNPhCH3)(CO)(PPh3)] 3B + CH3I reaction can, thus, be presented as Scheme 2a.
In Figure 3b, which displays the IR spectra of the CH3I reaction with [Rh(CH3COCHCNHCH3)(CO)(PPh3)] 3A, it can be seen that there are three main peaks that vary during the reaction. The Rh(I) complex displays a CO stretching frequency peak at 1967.66 cm−1. This absorbance peak decreases as the reaction progresses, which is explained by the disappearance of the Rh(I) complex, as it reacts with CH3I, in order to form a Rh(III) complex. The first product that forms is seen at the increase of the absorbance peak position at 2061.30 cm−1. This is attributed to the formation of a Rh(III)-alkyl complex after the direct addition of the CH3I to the Rh centre. This peak shows an increase at first, which shows the formation of the Rh(III)-alkyl product, up to a maximum absorbance level, after which it starts to decrease in intensity, see Figure 3d. This is attributed to the formation of a second Rh(III) product. When the Rh(III)-alkyl product starts to decrease in intensity, the formation of a second Rh(III) product can be seen at an absorbance peak of 1713.74 cm−1, see Figure 3b. The peak at 1713.74 cm−1 is designated to the Rh(III)-acyl complex. The intensity of the peak at 1713.74 cm−1 increases, up to a maximum amount, Figure 3d. The formation of the Rh(III)-acyl is due to CO insertion of the Rh(III)-alkyl product, and this step is called the second reaction step. Rh(III)-acyl is the final product observed for the [Rh(CH3COCHCNHCH3)(CO)(PPh3)] 3A + CH3I reaction. The observed pseudo first-order reaction constant calculated at the indicated wavelengths for each reaction step is given in Table 3. From the data presented in Table 3 it can be seen that the observed rate constants for the loss of the [Rh(CH3COCHCNHCH3)(CO)(PPh3)] 3A complex and the formation of the Rh(III)-alkyl product (the first reaction step), indicates a CH3I concentration-dependent step. The small differences between the rate constants for the Rh(I) loss and the Rh(III)-alkyl gain are due to the fact that the Rh(III)-alkyl is already converted to Rh(III)-acyl, while the first reaction step proceeds. Thus, the Rh(III)-alkyl increase during the first reaction step is, thus, virtually smaller [18]. The observed rate constants for the loss of the Rh(III)-alkyl product and formation of the Rh(III)-acyl product show good correlation with each other. There is barely any significant change in the rate values over the concentration range for the second step, which indicates that it is independent of the CH3I concentration. This is expected, since the conversion between the two products is not dependent on the concentration of CH3I, but on the individual properties of the complexes themselves, i.e., the type of ligand system employed. From the results obtained from the IR study, the reaction steps of the [Rh(CH3COCHCNHCH3)(CO)(PPh3)] 3A + CH3I reaction can, thus, be presented as given in Scheme 2b.

2.3.2. UV–Vis Study

The in situ analysis of the oxidative addition reaction between the [Rh(N,O-BID)(CO)(PPh3)], with N,O-BID = (CH3COCHCNHCH3) 1A and (CH3COCHCNPhCH3) 1B, complexes and CH3I are also measured by UV–Vis spectroscopy. Only the first step of both reactions, the [CH3I] dependent step, was followed on UV–Vis.
The reaction between the [Rh(CH3COCHCNHCH3)(CO(PPh3)] 3A complex and CH3I yields spectra, as seen in Figure 4a. From Figure 4a, it is seen that there is a decrease of the absorption around a wavelength of 330 nm and increase of the absorption around 408 nm, as the reaction progresses. The decrease in the absorption (330 nm) is theorized to be the decrease in the concentration of the Rh(I) complex as it reacts with CH3I to form a Rh(III) complex. The increase in the absorption (408 nm) is identified as the Rh(III) product complex; however, the identification of the type of product is not possible. The Rh(III) products that are formed could either be the Rh(III)-alkyl, Rh(III)-acyl, or a mixture of both [17,28]. The absorbance changes, at both 330 nm and 408 nm, with time, are shown in Figure 4b.
The observed second-order reaction rate constants at different temperatures vs. the concentration of the CH3I in the oxidative addition reaction with [Rh(CH3COCHCNPhCH3)(CO)(PPh3)] 3B are shown in Figure 4c. The slope of the different lines give the second-order rate constant for the oxidative addition reaction, with [Rh(CH3COCHCNPhCH3)(CO)(PPh3)] 3B + CH3I at the indicated temperatures, summarized in Table 4, for the oxidative addition reaction of 3A and 3B. The activation enthalpy and entropy for the 3B and CH3I reaction in Figure 4c can be obtained from the Eyring plot in Figure 4d. The large and negative activation entropy for the first oxidative addition step is indicative of an associative mechanism, as commonly found for oxidative addition of CH3I to square planar d8 metal complexes, which is proposed to proceed via an SN2 mechanism [26,29,30,31].

2.3.3. NMR Study

The UV–Vis spectrophotometric analysis yielded the second-order rate constants for the two phosphine-containing Rh complexes, and the IR spectrophotometric analysis yielded information regarding the types of products formed (alkyl and/or acyl) during the reaction between the Rh(I) complexes and CH3I. In order to gather more information, regarding the types of products and possible isomers involved in the reaction, an in situ analysis of the reaction was performed through the use of 1H-NMR spectroscopy. All possible product structures, of which there are multiples for each product type, will be presented and discussed in this section.
The [Rh(CH3COCHCNPhCH3)(CO)(PPh3)] 3B and CH3I reaction yielded similar results, as with the IR study, in that there was only one product formed during the reaction, namely the Rh(III)-alkyl product. Only one Rh(I) reactant 3B and one Rh(III)-alkyl product isomer was observed on NMR. The methine and methyl proton signals were tabulated in Table 5, with the 1H-NMR region presented in Figure 5. From Figure 5 (left), it can be seen that the resonance peak for the methine proton of the starting [Rh(CH3COCHCNPhCH3)(CO)(PPh3)] 3B complex (5.018 ppm) decreased as the reaction progressed, and a resonance peak, representing the methine proton signal for the Rh(III)-alkyl product (5.004 ppm), increased during the course of the reaction [17,18,28]. Figure 5 (right) illustrates the change in the resonance peak intensities as the reaction progressed, with respect to the methyl proton signals. The [Rh(CH3COCHCNPhCH3)(CO)(PPh3)] 3B methyl resonances (blue arrows, 1.688 ppm and 1.567 ppm) decreased as the reaction proceeded, and the Rh(III)-alkyl product that formed has methyl resonances (green arrows, 1.869 ppm and 1.655 ppm) that increased as the reaction proceeded. The doublet of doublets that formed (~1.370 ppm) is attributed to the CH3 of the CH3I, attached to the Rh central atom (formation of an alkyl reaction product). The doublet of doublets signal of the CH3 group of the alkyl was due to coupling with Rh (spin ½) and P (spin ½) [18,28]. This doublet of doublets signal also increased as the reaction proceeded. Figure 5 show that only one isomer of the Rh(III)-alkyl product formed during the reaction from a single isomer of 3B. Table 5 contains the observed pseudo first-order reaction rate constants, obtained from the change in concentration with time, of both the methine and methyl resonance signals. The observed kinetic rate constants, obtained from the methine and methyl peaks, when compared with those obtained through UV–Vis and IR spectroscopy, show good correlation between the values, see Table 3, Table 4 and Table 5.
The [Rh(CH3COCHCNHCH3)(CO)(PPh3)] 3A and CH3I reaction yielded similar behaviour to those observed in the IR study, in that there were two reaction steps observed during the reaction on NMR, according to Scheme 2b. The methine and methyl proton signals are tabulated in Table 5, with the 1H-NMR region presented in Figure 6. Figure 6 (left) illustrates the methine proton signals as the reaction progressed. The pure [Rh(CH3COCHCNHCH3)(CO)(PPh3)] 3A isomer A (5.002 ppm) and isomer B (4.990 ppm) showed a decrease in the proton signal intensity as the reaction progressed, with the formation of Rh(III)-alkyl appearing at 4.881 ppm. Only one Rh(III)-alkyl isomer was observed, but the existence of a second Rh(III) isomer cannot be excluded. The second Rh(I) isomer B is minute; therefore, the alkyl that could formed from the small Rh(I) isomer B could not be observed, since the peak was too small, or possibly due to overlap with the Rh(III)-alkyl isomer observed. The resonance peaks of the Rh(III)-alkyl isomers increased for a short time during the reaction, up to a maximum intensity, after which it starts to decrease. This is due to the formation of the Rh(III)-acyl product isomers (4.976 ppm and 5.014 ppm), which caused a decrease in the Rh(III)-alkyl isomers’ signal intensity. It was observed that the intensity of the signals, due to the second Rh(III)-acyl isomer B, was very small and, although observed, the formation of the second Rh(III)-acyl isomer B could not be followed kinetically [26,27,32]. Figure 6 (right) displays the change in the methyl proton signals between the two isomers of the starting material, [Rh(CH3COCHCNHCH3)(CO)(PPh3)] 3A, and alkyl product that form as the reaction progresses. The Rh(I) starting material isomers (blue arrows, 2.056 ppm and 1.583 ppm, main isomer) showed a decrease in the two methyl proton signals, and Rh(III)-alkyl product (green arrows, 2.017 ppm and 1.862 ppm) showed an increase in the signal strength at first. As the reaction progressed, signals of the Rh(III)-alkyl product isomers decreased, and the Rh(III)-acyl product isomers (main isomer A, pink arrows, 2.861 ppm and 2.157 ppm and minor isomer B, black arrows, 2.555 ppm and 2.133 ppm) showed an increase in the signal strength as time progresses. The reason for the Rh(III)-alkyl methyl proton resonances showing an increase, and then a decrease, is the same as for the methine proton focussed analysis that is: the Rh(III)-alkyl product starts forming up to a maximum, after which it starts to convert to the Rh(III)-acyl product [27,32]. Table 5 contains the observed pseudo first-order reaction rate constants of both the methine and methyl resonance signals. The observed kinetic rate constants, obtained from the methine and methyl peaks, when compared with those obtained through UV–Vis and IR spectrophotometry, showed a good correlation between the values, as seen in Figure 7b.

2.3.4. DFT Study of Reaction Mechanism

A DFT study of the reactants, transition state, and the products of the [Rh(CH3COCHCNPhCH3)(CO)(PPh3)] 3B + CH3I oxidative addition reaction is presented in Figure 8, with the results summarized in Table 6 (results for the most stable O-trans-CO isomer of 3B is presented). Figure 8a contains the optimized geometries of the reactant molecule, [Rh(CH3COCHCNPhCH3)(CO)(PPh3)] 3B, complex’s reaction with CH3I, before the reaction starts. There was a large separation between the reactant molecules (d = 32.731 Å) at the moment of the mixture. The reactant molecules then move through the bulk solution, until the distance between them is short enough and orientation of the molecules is sufficient to facilitate a reaction to occur [26,32]. The oxidative addition reaction between CH3I and square planar Rh(I) complexes can theoretically proceed via three different transition state structures [33,34,35]. The three methods of addition are a linear/back addition (where there is a near 180° angle formed between the approaching CH3I and Rh (trans addition)), bent addition (where the angle is between 90° and 180° (trans addition)), and front addition (where the angle is less than 90° (cis addition)). DFT computations showed that the most preferred addition method was a linear/back approach of the CH3I to the Rh(I) metal centre. This method had an activation barrier that was ~7 times lower in energy than the other two methods [26]. Figure 8b contains the optimized geometry of the linear oxidative addition of the methyl group to the Rh(I) metal centre of the [Rh(CH3COCHCNPhCH3)(CO)(PPh3)] 3B complex. The CH3I molecule, when it is close enough to the Rh complex molecule, approaches linearly from the apical position (top as illustrated), with the methyl group closest to the Rh complex. This approach of the CH3I molecule, and subsequent bond formation between the methyl group and Rh metal centre, cause an increase in the total system energy, up to a maximum value, the activation energy. After the Rh-CCH3I bond is formed, the energy of the system decreases again, as the bond formed stabilizes and the I ion diffuses away [26,32]. The I ion is then free to diffuse away into the bulk solution to react with another five-coordinate Rh complex. The bond formation between the five-coordinate cationic intermediate and a I ion is a barrierless process, with the formation of the Rh(III)-alkyl 2a product with the Oβ-ketoiminat atom of the ligand trans to CO, and the CH3 and I atoms bonded at the apical positions (top and bottom with respect to the square planar geometry), see Figure 8c. The energies of the reaction steps calculated by DFT are summarized in Table 6. The energies are given relative to the final product in the reaction mechanism. The energy barrier of the transition state (TS) is 0.29 eV and 0.83 eV higher than the reactants and [Rh(CH3COCHCNPhCH3)(CO)(PPh3)(CH3)(I)]-alkyl 2a product, respectively. The energy profile is, thus, favourable for the product formation. All DFT attempts at determining a TS for formation of an acyl product through CO insertion at the Rh(III)-alkyl 2a failed. This fact, as well as the fact that Rh(III)-alkyl 2a and Rh(III)-acyl 13a are equi-energetic (see energies in Table 2), with no driving force for CO insertion to occur in 2a to form 13a, compliment the experimental findings that a Rh(III)-alkyl is the final reaction product of the [Rh(CH3COCHCNPhCH3)(CO)(PPh3)] 3B + CH3I reaction.
The DFT-calculated results for the [Rh(CH3COCHCNHCH3)(CO)(PPh3)] 3A + CH3I oxidative addition reaction are presented in Figure 9, with the results summarized in Table 6. The results related to the most stable reactant isomer, the isomer with Oβ-ketoiminato trans to CO (O-trans-CO), is presented. Figure 9a contains the optimized geometries of the reactant molecules, [Rh(CH3COCHCNHCH3)(CO)(PPh3)] 3A and CH3I, before the oxidative addition reaction proceeds. There is a large separation between the two molecules. The molecules merely move through the bulk solution until both the distance between the two is short enough and the orientation of the molecules is correct in order to facilitate a reaction. There is a distance between the two molecules >21.825 Å. As the molecules move through the bulk solution this distance decreases.
Figure 9b contains the optimized geometries of the first TS of the [Rh(CH3COCHCNHCH3)(CO)(PPh3)] 3A + CH3I reaction. The CH3I approaches the [Rh(CH3COCHCNHCH3)(CO)(PPh3)] 3A complex from the apical position linearly with the methyl group closest to the Rh metal centre. As the CH3I molecule approaches, the distance between the methyl group and I increases from 2.1736 Å (DFT optimized geometry of CH3I) to 2.610 Å, and the distance between the methyl group and Rh metal centre decreases, until a bond is formed. When the distance between the methyl group and the I atom reaches a certain length the bond between the two breaks, and the I ion is then free to diffuse back into the bulk solution in order to react with another five-coordinate Rh intermediate that is formed. As the Rh-CCH3I distance decreases, the total energy of the system increases up to a maximum point. At this maximum the transition state occurs, where the CH3I molecule breaks up into a methyl group and I ion, and the methyl group then forms a bond with the Rh metal centre to form a five-coordinate intermediate complex as seen in Figure 9b. After the bond is formed, the total system energy then starts to decrease. As the I ion approaches the Rh metal centre, the total energy of the system decreases, up until the bond formation occurs, after which the system reaches a point of stability, as shown in Figure 9c, with the formation of the Rh(III)-alkyl complex.
The next reaction step is the CO insertion of the CH3 migration step. The CH3 group, thus, starts moving towards the C atom of the CO group. As the CH3 migrates towards the CO group, the CO group gets lifted out of the plane formed between the N and O atoms of the ligand and P atom of the PPh3 ligand by 15.50°—effectively decreasing the Cmethyl-Rh-Cco bond angle even more. During the migration the Rh-Cmethyl bond length increases, and the Cmethyl-Cco distance decreases. These changes continue up to a certain point (Cmethyl-Rh-Cco = 56.92°), where the Rh-Cmethyl bond breaks and the Cmethyl-Cco bond forms [26,32]. As can be seen from Figure 9d, when the moment of the transition state is reached, the ligand starts shifting or flipping, in order to position the COCH3 group in an apical position. Figure 9e illustrates the final product’s geometry, optimized by DFT calculations, of the [Rh(CH3COCHCNHCH3)(CO)(PPh3)]-acyl product 14a. It can be seen that the acyl group is now in an apical position and I atom has taken the place of the PPh3 group from the [Rh(CH3COCHCNHCH3)(CO)(PPh3)]-alkyl product 2a, with the PPh3 group taking the place of the CO group of alkyl product 2a. This is due to this orientation having a smaller total system energy than any of the other orientations. After the bond is formed between the Cmethyl and the CCO atoms, the orientation starts to change. The six-membered ring, formed between the Rh metal centre and the L,L′-BID ligand, flips. The O atom moves in such a way as to allow for the I atom to be positioned trans to the N atom. During this shift the energy of the system decreases up to a minimum where the I atom is trans and no longer in an apical position until the final, stable geometry of the five-coordinate Rh(III) complex was obtained [26,32].
The energies of the two reaction steps (calculated by DFT) are summarized in Table 6. The energies are given relative to the final product in the reaction mechanism. From Table 6 it can be seen that the first transition state, the linear addition of CH3I, to the structure has an energy barrier of only 0.26 eV. This energy barrier calculated for the [Rh(CH3COCHCNHCH3)(CO)(PPh3)] 3A + CH3I reaction, is favourable for the reaction to occur and to proceed to the Rh(III)-alkyl reaction product that is 0.82 eV lower in energy than the TS1. The energy barrier of the second step is higher than the first step (0.91 eV vs. 0.26 eV), indicating that the second reaction is much slower than the first reaction step, in agreement with experimental results. The Rh(III)-acyl product has the lowest energy and, thus, most stable and constitutes the final reaction product. These computational results are, thus, corroborated by both the IR and NMR spectra illustrating the formation of an alkyl and acyl product, with the acyl product being the final product.

2.3.5. Summary of [Rh(L,L′-BID)(CO)(PPh3)] + CH3I Reactions

In Figure 7 the results for the second-order reaction rate constants of the [Rh(CH3COCHCNPhCH3)(CO)(PPh3)] 3B + CH3I reaction and the [Rh(CH3COCHCNHCH3)(CO)(PPh3)] 3A + CH3I reaction, respectively (as obtained by IR, UV–Vis and NMR), are compared. The second-order reaction rate constants obtained are comparable within experimental error. These results, along with the DFT-calculated results, suggest a one-step reaction, leading from [Rh(CH3COCHCNPhCH3)(CO)(PPh3)] 3B and CH3I, as reactants, to a [Rh(CH3COCHCNPhCH3)(CO)(PPh3)(CH3)(I)] alkyl product 2a, with no additional steps taking place in the reaction. The reaction scheme for this complex can be seen in Scheme 3a. The results obtained regarding the different reaction products from IR and NMR, along with the DFT-calculated results, suggest a two-step reaction leading from [Rh(CH3COCHCNHCH3)(CO)(PPh3)] 3A (both isomers) and CH3I as reactants, to two [Rh(CH3COCHCNHCH3)(CO)(PPh3)(CH3)(I)] alkyl products (2a and 1a, 1a currently not observed experimentally), to the formation of two [Rh(CH3COCHCNHCH3)(PPh3)(COCH3)(I)] acyl products (14a and 13a). The reaction scheme for this complex can be seen in Scheme 3b.
Considering the [Rh(L,L′-BID)(CO)(PPh3)] + CH3I oxidative addition reaction, where L,L′-BID = O,O-BID, a β-diketonato ligand (RCOCHCOR′), it is found that for more electronegative the groups R and R′ attached to the backbone of the ligand, a slower oxidative addition reaction rate is obtained [11,36]. For example, the reaction rate for the oxidation addition step of the [Rh(CF3COCHCOCF3)(CO)(PPh3)] + CH3I reaction (0.00013(1) mol−1 dm3 s−1 [37]) is more than 100 times smaller the [Rh(CH3COCHCOCH3)(CO)(PPh3)] + CH3I reaction (0.024(3) mol−1 dm3 s−1 [38]). This is because the two CF3 groups attached to the ligand in [Rh(CF3COCHCOCF3)(CO)(PPh3)] are more electronegative than the two CH3 groups ( χ C F 3   = 3.01   and   χ C H 3   = 3.34   [25]) in [Rh(CH3COCHCOCH3)(CO)(PPh3)].
The N,O-BID containing [Rh(CH3COCHCNRCH3)(CO)(PPh3)] complexes 3A (R = H) and 3B (R = Ph) of this study can be compared with the O,O-BID-containing [Rh(CH3COCHCOCH3)(CO)(PPh3)] complex. In agreement with the larger electronegativity of O (3.44 Pauling scale) than that of N (3.04 on the Pauling scale), it was found that the oxidative addition reaction rate of CH3I to [Rh(CH3COCHCOCH3)(CO)(PPh3)] (0.024(3) mol−1 dm3 s−1 [38]) is slower than the oxidative addition reaction rate of CH3I to 3A and 3B, 0.144(1) mol−1 dm3 s−1 and 0.213(5) mol−1 dm3 s−1, respectively. The more electronegative O atom in [Rh(CH3COCHCOCH3)(CO)(PPh3)] withdraws more electron density from it’s d z 2 , HOMO, than the N atom in 3A and 3B (Figure 2). The nucleophilic attack of the rhodium(I) centre on the CH3 of the CH3I group, thus, proceeds slower in the case of [Rh(CH3COCHCOCH3)(CO)(PPh3)] than for 3A and 3B.

3. Materials and Methods

3.1. Instrumentation

Characterization of the complexes were performed on a Bruker Avance DPX 300 NMR (Bruker, Hanau, Germany) utilizing CDCl3 as solvent at 298 K. Kinetic measurements were performed on a Bruker Avance 600 MHz NMR (Bruker, Hanau, Germany), utilizing CDCl3, passed through basic alumina, as solvent and the CH3I at concentrations of 10 times in excess.
Characterization of the complexes were carried out with a Bruker Tensor 27 FTIR infrared spectrophotometer (Bruker, Hanau, Germany) fitted with a Pike MIRacle single-bounce and diamond ATR. Kinetic measurements of the [Rh(N,O-BID)(CO)(PPh3)] complexes were carried out on a Bruker Tensor 27 FTIR infrared spectrophotometer (Bruker, Hanau, Germany), fitted for solution state analysis with a Rh complex concentration 0.005 mol dm−3, and the CH3I concentration varied between 10, 20, and 50 times in excess. Chloroform, passed through basic alumina, was utilized as solvent, and all measurements were performed at 25 °C.
Kinetic measurements of the [Rh(N,O-BID)(CO)(PPh3)] complexes were carried out with a Shimadzu UV-1650PC UV–Vis spectrophotometer (Shimadzu, Kyoto, Japan), fitted with a CPS-240A cell positioner and temperature controller. Chloroform, passed through basic alumina, was utilized as solvent and the Rh complex concentrations were 0.0003 mol dm−3, with the concentration of the CH3I at 5, 10, 50, and 100 times in excess. Measurements were taken at the temperatures indicated.
The ADF program (Software for Chemistry & Materials, Amsterdam, The Netherlands) [39] was utilized in the calculations of the complexes. A TZP basis set with the PW91 [40] functional was utilized in the optimization of the geometries. The theoretical IR frequencies were calculated with the selected basis set and functional to obtain zero point energy (ZPE) corrected electronic energies. Solvent effects were taken into account using chloroform as solvent, using the COSMO [41,42,43] model of solvation with an Esurf cavity [44]. Electronic energies for the rhodium(III) products were also calculated, using the optimized PW91 geometries and the TPSS [45,46] and PBE [47] functionals, respectively, both including Grimme’s D3 [48] dispersion correction and the TZ2P basis set. The optimized coordinates of the DFT calculations are provided in Supplementary Materials.

3.2. Synthesis

The synthesis of the ligands 1A and 1B was performed as published in literature [15].

3.2.1. [Rh(N,O-BID)(CO)2]

The synthesis of [Rh(CH3COCHCNHCH3)(CO)2] 2A and [Rh(CH3COCHCNPhCH3)(CO)2] 2B was performed as published in literature for 2B [15] and related complexes [16]. Di-µ-chloro-tetracarbonyldirhodium(I) (0.05 g, 0.1286 mmol) was dissolved in methanol (5 mL), and the ligand (0.2572 mmol), also dissolved in methanol (2 mL), was added dropwise over 10 min whilst stirring. The mixture was left to stir for 1 h. The mixture was then extracted with n-hexane, until the n-hexane was clear, solvents combined, and reduced under reduced pressure. The solid that precipitated out was then collected, recrystallized, and weighed.
Characterization data:
[Rh(CH3COCHCNHCH3)(CO)2] 2A: Yield = 69%. 1H-NMR: 5.3635–5.2933 ppm (d, C-H, J4 = 2.311 Hz); 2.1749–2.1720 ppm (d, CH3-CN, J4 = 0.74 Hz); 2.1060 ppm (CH3-CO). νCO: 2044.13 cm−1; 1971.02 cm−1.
[Rh(CH3COCHCNPhCH3)(CO)2] 2B: Yield = 78%. 1H-NMR: 7.3882–7.0605 ppm (m, C6H5-N); 5.2977 ppm (s, C-H); 2.1949 ppm (s, CH3-CN); 2.1414 ppm (s, CH3-CO). νCO: 2058.98 cm−1; 1997.69 cm−1.

3.2.2. [Rh(N,O-BID)(CO)(PPh3)]

[Rh(N,O-BID)(CO)2] (0.2 mmol) was dissolved in n-hexane (3 mL). Triphenylphosphine (0.23 mmol) was dissolved in n-hexane (3 mL) and added dropwise over 10 min to the dicarbonyl complex solution whilst stirring. The mixture was then left to stir, until no more bubbles evolved. The precipitate that formed was filtered off, recrystallized, and weighed.
Characterization data:
3A: Yield = 77%. 1H-NMR: Isomer A: 7.7153–7.3524 ppm (m, C6H5-P); 5.1005–5.0925 ppm (d, C-H, J4 = 0.93 Hz); 2.1520–2.1490 ppm (d, CH3-CN, J4 = 2.43 Hz); 1.6758 ppm (s, CH3-CO). Isomer B: 7.7153–7.3524 ppm (m, 3 × C6H5-P); 5.0635 ppm (s, C-H); 2.0617 ppm (s, CH3-CN); 1.9335 ppm (s, CH3-CO). νCO: 1952.67 cm−1.
3B: Yield = 65%. 1H-NMR: 7.3890–7.0608 ppm (m, C6H5-N; 3 × C6H5-P); 5.2982 ppm (s, C-H); 2.1417 ppm (s, CH3-CN); 1.7852 ppm (s, CH3-CO). νCO: 1966.60 cm−1.

3.3. Kinetics

Oxidative addition reactions between the triphenylphosphine-containing Rh complexes, 3A and 3B, and iodomethane, CH3I, were monitored on UV–Vis spectrophotometry, IR spectrophotometry and 1H-NMR spectrometry, as described in our previous publications [11,36]. All kinetic measurements were performed under the indicated pseudo first-order conditions (CH3I being in excess, with respect to the concentration of the rhodium complex). The observed first-order rate constants kobs were obtained from the slope of the graph of ln(Ainf − At) vs. time data, according to the first-order kinetic equation:
ln(Ainf − At) = −kobst + ln(Ainf − A0)
where At = absorbance of a complex at time t, Ainf and A0 is absorbance of complex at time infinite and zero, respectively. The second-order rate constants, k2 (in dm3 mol−1 s−1), were obtained from the slope of the graph of kobs against the concentration of CH3I:
kobs = k2[CH3I] + k2
where k2 (k2) is the second-order rate constant of the forward (backward) reaction of the kinetic reaction between the Rh complexes 3A and 3B and CH3I.
Activation parameters were obtained from the Eyring relationship:
l n k 1 T = H # RT + S # R + l n k B h
where ∆H# = activation enthalpy, ∆S# = activation entropy, T = temperature, k2 = second-order rate constant of the first kinetic step at temperature T, kB = Boltzmann’s constant, h = Planck’s constant, R = universal gas constant.

4. Conclusions

Experimentally, one isomer of [Rh(CH3COCHCNPhCH3)(CO)(PPh3)] 3B and two isomers of [Rh(CH3COCHCNHCH3)(CO)(PPh3)] 3A were observed. DFT calculations showed that the 3B isomer N-trans-CO exhibited a distorted square planar geometry, due to the steric stress between the phenyl ring, which is attached to the N atom and phenyl rings attached to the P atom, causing the 3B isomer N-trans-CO to be less stable. The electronic energies of the optimized molecules, in the Boltzmann equation, predicted 100% of 3B isomer O-trans-CO (no 3B isomer N-trans-CO) and 96.5% of 3A isomer O-trans-CO, in agreement with experimental observation.
Experimentally, the [Rh(CH3COCHCNPhCH3)(CO)(PPh3)] (3B) + CH3I reaction proceeds through one reaction step, with a rhodium(III)-alkyl as final reaction product. The DFT calculations of all the possible reaction products and transition states, in agreement with experimental findings, showed that, for the experimentally observed one-step reaction [Rh(CH3COCHCNPhCH3)(CO)(PPh3)] (3B) + CH3I, the lowest energy Rh(III)-alkyl 2a and Rh(III)-acyl 13a reaction products are equi-energetic. There is, thus, no driving force for CO insertion to occur in 2a to form 13a.
Experimentally, the [Rh(CH3COCHCNHCH3)(CO)(PPh3)] (3A) + CH3I reaction proceeds through two reaction steps, with rhodium(III)-acyl as the final reaction product. The DFT calculations of all the possible reaction products and transition states, in agreement with experimental findings, showed that, for the experimentally observed two-step reaction [Rh(CH3COCHCNHCH3)(CO)(PPh3)] (3A) + CH3I, the lowest energy Rh(III)-acyl isomers, 13a and 14a, were ca. 0.3 eV lower in energy than the energy of the lowest energy Rh(III)-alkyl isomers, 1a and 2a, providing a driving force for CO insertion to occur in the 1a and 2a to form 13a and 14a, respectively.
The kinetic rate of the oxidative addition of methyl iodide to the two [Rh(imino-β-diketonato)(CO)(PPh)3] complexes, [Rh(CH3COCHCNHCH3)(CO)(PPh3)] 3A and [Rh(CH3COCHCNPhCH3)(CO)(PPh3)] 3B, is 7–11 times faster than the oxidative addition reaction rate of CH3I to [Rh(CH3COCHCOCH3)(CO)(PPh3)], due to the smaller electronegativity of N in the N,O-BID ligand (complexes 3A and 3B), compared to O in the O,O-BID ligand ([Rh(CH3COCHCOCH3)(CO)(PPh3)] complex).

Supplementary Materials

The following supporting information can be downloaded at https://www.mdpi.com/article/10.3390/molecules27061931/s1. Optimized coordinates of the DFT calculations.

Author Contributions

Conceptualization, M.M.C.; methodology, M.M.C.; software, H.F. and M.M.C.; validation, H.F., M.M.C., and J.C.; formal analysis, H.F. and M.M.C.; investigation, H.F. and M.M.C.; resources, J.C.; data curation, H.F.; writing—original draft preparation, M.M.C.; writing—review and editing, M.M.C. and J.C.; visualization, H.F. and M.M.C.; supervision, M.M.C.; project administration, M.M.C.; funding acquisition, M.M.C. and J.C. All authors have read and agreed to the published version of the manuscript.

Funding

This research was funded by South African National Research Foundation, grant number 129270 (J.C.) and 108960 (M.M.C.). The Centre for High-Performance Computing (CHPC) of South Africa for the simulation facilities, High-Performance Computing facility of the UFS (program CHEM0947), and Norwegian Supercomputing Program (UNINETT Sigma2, Grant No. NN9684K) are acknowledged for computer time.

Institutional Review Board Statement

Not applicable.

Informed Consent Statement

Not applicable.

Data Availability Statement

Within the article and the Supplementary Materials.

Conflicts of Interest

The authors declare no conflict of interest.

Sample Availability

Samples of the compounds are not available from the authors.

References

  1. Trzeciak, A.M.; Ziółkowski, J.J. Perspectives of rhodium organometallic catalysis. Fundamental and applied aspects of hydroformylation. Coord. Chem. Rev. 1999, 190–192, 883–900. [Google Scholar] [CrossRef]
  2. Li, C.; Wang, W.; Yan, L.; Ding, Y. A mini review on strategies for heterogenization of rhodium-based hydroformylation catalysts. Front. Chem. Sci. Eng. 2018, 12, 113–123. [Google Scholar] [CrossRef]
  3. Crabtree, R.H. Rhodium and Iridium in Organometallic Catalysis. Platin. Met. Rev. 2006, 50, 171–176. [Google Scholar] [CrossRef]
  4. Heidingsfeldova, M.; Capca, M. Rhodium Complexes as Catalysts for Hydrosilylation Crosslinking of Silicone Rubber. J. Appl. Polym. Sci. 1985, 30, 1837–1846. [Google Scholar] [CrossRef]
  5. Chernyshov, B.V.I.; Kisil, I.M. Platinum metals catalvtic systems in nitric acid production system optimisation in non-concentrated acid plants. Platin. Met. Rev. 1993, 37, 136–143. [Google Scholar]
  6. Halligudi, S.B.; Bajaj, H.C.; Bhatt, K.N.; Krishnaratnam, M. Hydrogenation of benzene to cyclohexane catalyzed by rhodium (I) complex supported on montmorillonite clay. React. Kinet. Mech. Catal. 1992, 48, 547–552. [Google Scholar] [CrossRef]
  7. Mieczy, E.; Trzeciak, A.M.; Ziolkowski, J.J. Hydroformylation and isomerization of hex-1-ene catalyzed by [Rh(acac)(CO)(PPh3)]: Effect of modifying ligands. J. Mol. Catal. 1992, 73, 1–8. [Google Scholar]
  8. Roth, B.J.F. The Production of Acetic Acid. Rhodium catalyzed carbonylation of methanol. Platin. Met. Rev. 1975, 19, 12–14. [Google Scholar]
  9. Jones, J.H. The CativaTM Process for the Manufacture of Acetic Acid: Iridium catalyst improves productivity in an established industrial process. Platin. Met. Rev. 2000, 44, 94–105. [Google Scholar]
  10. Maitlis, P.M.; Haynes, A.; Sunley, G.J.; Howard, M.J. Methanol carbonylation revisited: Thirty years on. J. Chem. Soc. Dalton Trans. 1996, 11, 2187–2196. [Google Scholar] [CrossRef]
  11. Stuurman, N.F.; Buitendach, B.E.; Twigge, L.; Swarts, P.J.; Conradie, J. Rhodium(triphenylphosphine)carbonyl-2,4-dioxo-3-pentyl-4-decanyloxybenzoate: Synthesis, electrochemistry and oxidative addition kinetics. New J. Chem. 2018, 42, 4121–4132. [Google Scholar] [CrossRef]
  12. Brink, A.; Roodt, A.; Steyl, G.; Visser, H.G. Steric vs. electronic anomaly observed from iodomethane oxidative addition to tertiary phosphine modified rhodium(i) acetylacetonato complexes following progressive phenyl replacement by cyclohexyl [PR3 = PPh3, PPh2Cy, PPhCy2 and PCy3]. Dalton Trans. 2010, 39, 5572–5578. [Google Scholar] [CrossRef] [PubMed]
  13. Ruballo, A.; Selina, V..; Cherkasova, T.G.; Varshavskii, Y.S. IR-spectroscopic study of dicarbonyl complexes of rhodium (I) with β-aminovinyl ketones by Ruballo Selina Cherkasova Varshavskii. Koord. Khimiya 1992, 17, 530–536. [Google Scholar]
  14. Galding, M.R.; Cherkasova, T.G.; Osetrova, L.V.; Varshavsky, Y.S. 31P NMR Spectra of beta-Aminovinylketonato Rhodium (I) Carbonyl-Phosphine Complexes Rh(AVK)(PPh3) (CO). Rhodium Express 1993, 1, 14–17. [Google Scholar]
  15. Ferreira, H.; Conradie, M.M.; van Rooyen, P.H.; Conradie, J. Packing polymorphism of dicarbonyl-[2-(phenylamino)pent-3-en-4-onato]rhodium(I). J. Organomet. Chem. 2017, 851, 235–247. [Google Scholar] [CrossRef] [Green Version]
  16. Bonati, F.; Wilkinson, G. 600. Dicarbonyl-β-diketonato- and related complexes of rhodium(I). J. Chem. Soc. 1964, 3156–3160. [Google Scholar] [CrossRef]
  17. Conradie, M.M.; Conradie, J. A kinetic study of the oxidative addition of methyl iodide to [Rh((C4H3S)COCHCOCF3)(CO)(PPh3)] utilizing UV/vis and IR spectrophotometry and 1H, 19F and 31P NMR spectroscopy. Synthesis of [Rh((C4H3S)COCHCOCF3)(CO)(PPh3)(CH3)(I)]. Inorg. Chim. Acta 2008, 361, 208–218. [Google Scholar] [CrossRef]
  18. Stuurman, N.F.; Conradie, J. Iodomethane oxidative addition and CO migratory insertion in monocarbonylphosphine complexes of the type [Rh((C6H5)COCHCO((CH2)nCH3))(CO)(PPh3)]: Steric and electronic effects. J. Organomet. Chem. 2009, 694, 259–268. [Google Scholar] [CrossRef]
  19. Varshavsky, Y.S.; Galding, M.R.; Cherkasova, T.G.; Podkorytov, I.S.; Nikol’skii, A.B.; Trzeciak, A.M.; Olejnik, Z.; Lis, T.; Ziółkowski, J.J. 31P-NMR and X-ray studies of new rhodium(I) β-ketoiminato complexes Rh(R1C(O)CHC(NH)R2)(CO)(PZ3) where PZ3=PPh3, PCy3, P(OPh)3 or P(NC4H4)3. J. Organomet. Chem. 2001, 628, 195–210. [Google Scholar] [CrossRef]
  20. Damoense, L.; Purcell, W.; Roodt, A.; Leipoldt, J.G. The Crystal Structure of (2-Aminovinyl-4-pentanonato-KO, KN)-carbonyl-triphenylphosphinerhodium (I). Rhodium Express 1994, 5, 10–13. [Google Scholar]
  21. Venter, G.J.S.; Steyl, G.; Roodt, A. Crystal structure of carbonyl-(4-(2,6-dichlorophenylamino)pent-3-en-2-onato-κ2N,O)-(triphenylphosphine-κP)-rhodium(I) acetone solvate, C31.5H28Cl2NO2.5PRh. Z. Krist.—New Cryst. Struct. 2013, 228, 410–412. [Google Scholar] [CrossRef] [Green Version]
  22. Venter, G.J.S. The crystal structure of carbonyl-[4-(2,4-dichlorophenylamino)pent-3-en-2-onato-κ2N,O]-(triphenylphosphine-κP)rhodium(I), RhC30H25Cl2NO2P. Z. Krist.—New Cryst. Struct. 2017, 232, 901–903. [Google Scholar] [CrossRef]
  23. Venter, G.J.S.; Steyl, G.; Roodt, A. Carbonyl[4-(2,3-dimethylphenylamino)pent-3-en-2-onato-κ2N,O](triphenylphosphine-κP)rhodium(I). Acta Crystallogr. Sect. E Struct. Reports Online 2009, 65, m1321–m1322. [Google Scholar] [CrossRef] [Green Version]
  24. Venter, G.J.S.; Steyl, G.; Roodt, A. Carbonyl[4-(2,6-dimethylphenylamino)pent-3-en-2-onato-κ2N,O](triphenylphosphine-κP)rhodium(I) acetone hemisolvate. Acta Crystallogr. Sect. E Struct. Reports Online 2009, 65, m1606–m1607. [Google Scholar] [CrossRef] [Green Version]
  25. Conradie, J. Density functional theory calculations of Rh-β-diketonato complexes. Dalton Trans. 2015, 44, 1503–1515. [Google Scholar] [CrossRef] [PubMed]
  26. Conradie, M.M.; Conradie, J. Methyl iodide oxidative addition to [Rh(acac)(CO)(PPh3)]: An experimental and theoretical study of the stereochemistry of the products and the reaction mechanism. Dalton Trans. 2011, 40, 8226–8237. [Google Scholar] [CrossRef]
  27. Conradie, J.; Lamprecht, G.J.; Otto, S.; Swarts, J.C. Synthesis and characterisation of ferrocene-containing β-diketonato complexes of rhodium(I) and rhodium(III). Inorg. Chim. Acta 2002, 328, 191–203. [Google Scholar] [CrossRef]
  28. Conradie, J.; Lamprecht, G.J.; Roodt, A.; Swarts, J.C. Kinetic study of the oxidative addition reaction between methyl iodide and [Rh(FcCOCHCOCF3)(CO)(PPh3)]: Structure of [Rh(FcCOCHCOCF3)(CO)(PPh3)(CH3)(I)]. Polyhedron 2007, 26, 5075–5087. [Google Scholar] [CrossRef]
  29. Wilson, J.M.; Sunley, G.J.; Adams, H.; Haynes, A. Oxidative addition of MeI to cationic Rh(I) carbonyl complexes with pyridyl bis(carbene) ligands. J. Organomet. Chem. 2005, 690, 6089–6095. [Google Scholar] [CrossRef]
  30. Van Zyl, G.J.; Lamprecht, G.J.; Leipoldt, J.G.; Swaddle, T.W. Kinetics and mechanism of the oxidative addition of iodomethane to β-diketonatobis(triphenylphosphite)rhodium(I) complexes. Inorg. Chim. Acta 1988, 143, 223–227. [Google Scholar] [CrossRef]
  31. Leipoldt, J.G.; Basson, S.S.; Botha, L.J. The oxidative addition of iodomethane to thioacetylacetonatocarbonylphosphine-rhodium(I) complexes. Inorg. Chim. Acta 1990, 168, 215–220. [Google Scholar] [CrossRef]
  32. Conradie, M.M.; Conradie, J. Stereochemistry of the reaction products of the oxidative addition reaction of methyl iodide to [Rh((C4H3S)COCHCOR)(CO)(PPh3)]: A NMR and computational study. R = CF3, C6H5, C4H3S. Inorg. Chim. Acta 2009, 362, 519–530. [Google Scholar] [CrossRef]
  33. Conradie, M.M.; Conradie, J. A density functional theory study of the oxidative addition of methyl iodide to square planar [Rh(acac)(P(OPh)3)2] complex and simplified model systems. J. Organomet. Chem. 2010, 695, 2126–2133. [Google Scholar] [CrossRef]
  34. Griffin, T.R.; Cook, D.B.; Haynes, A.; Pearson, J.M.; Monti, D.; Morris, G.E. Theoretical and Experimental Evidence for SN2 Transition States in Oxidative Addition of Methyl Iodide to cis-[M(CO)2I2] (M = Rh, Ir). J. Am. Chem. Soc. 1996, 118, 3029–3030. [Google Scholar] [CrossRef]
  35. Feliz, M.; Freixa, Z.; van Leeuwen, P.W.N.M.; Bo, C. Revisiting the Methyl Iodide Oxidative Addition to Rhodium Complexes: A DFT Study of the Activation Parameters. Organometallics 2005, 24, 5718–5723. [Google Scholar] [CrossRef]
  36. Mateyise, N.G.S.; Conradie, J.; Conradie, M.M. Synthesis, characterization, electrochemistry, DFT and kinetic study of the oligothiophene-containing complex [Rh((C4H3S-C4H2S)COCHCOCF3)(CO)(PPh3)]. Polyhedron 2021, 199, 115095. [Google Scholar] [CrossRef]
  37. Basson, S.S.; Leipoldt, J.G.; Nel, J.T. The oxidative addition of methyl iodide to β-diketonecarbonyltriphenylphosphinerhodium(I) complexes. Inorg. Chim. Acta 1984, 84, 167–172. [Google Scholar] [CrossRef]
  38. Basson, S.S.; Leipoldt, J.G.; Roodt, A.; Venter, J.A.; van der Walt, T.J. The oxidative addition of iodomethane to acetylacetonatocarbonylphosphinerhodium(I) complexes. Inorg. Chim. Acta 1986, 119, 35–38. [Google Scholar] [CrossRef]
  39. Pye, C.C.; Ziegler, T. An implementation of the conductor-like screening model of solvation within the Amsterdam density functional package. Theor. Chem. Acc. 1999, 101, 396–408. [Google Scholar] [CrossRef]
  40. Perdew, J.P.; Chevary, J.A.; Vosko, S.H.; Jackson, K.A.; Pederson, M.R.; Singh, D.J.; Fiolhais, C. Atoms, molecules, solids, and surfaces: Applications of the generalized gradient approximation for exchange and correlation. Phys. Rev. B 1992, 46, 6671–6687, Erratum in: Phys. Rev. B 1993, 48, 4978. [Google Scholar] [CrossRef] [PubMed]
  41. Klamt, A.; Schüürmann, G. COSMO: A new approach to dielectric screening in solvents with explicit expressions for the screening energy and its gradient. J. Chem. Soc. Perkin Trans. 2 1993, 5, 799–805. [Google Scholar] [CrossRef]
  42. Klamt, A. Conductor-like Screening Model for Real Solvents: A New Approach to the Quantitative Calculation of Solvation Phenomena. J. Phys. Chem. 1995, 99, 2224–2235. [Google Scholar] [CrossRef]
  43. Klamt, A.; Jonas, V. Treatment of the outlying charge in continuum solvation models. J. Chem. Phys. 1996, 105, 9972–9981. [Google Scholar] [CrossRef]
  44. Pascual-ahuir, J.L.; Silla, E.; Tuñon, I. GEPOL: An improved description of molecular surfaces. III. A new algorithm for the computation of a solvent-excluding surface. J. Comput. Chem. 1994, 15, 1127–1138. [Google Scholar] [CrossRef]
  45. Tao, J.; Perdew, J.P.; Staroverov, V.N.; Scuseria, G.E. Climbing the Density Functional Ladder: Nonempirical Meta–Generalized Gradient Approximation Designed for Molecules and Solids. Phys. Rev. Lett. 2003, 91, 146401. [Google Scholar] [CrossRef] [PubMed] [Green Version]
  46. Staroverov, V.N.; Scuseria, G.E.; Tao, J.; Perdew, J.P. Comparative assessment of a new nonempirical density functional: Molecules and hydrogen-bonded complexes. J. Chem. Phys. 2003, 119, 12129–12137. [Google Scholar] [CrossRef]
  47. Perdew, J.P.; Burke, K.; Ernzerhof, M. Generalized gradient approximation made simple. Phys. Rev. Lett. 1996, 77, 3865–3868. [Google Scholar] [CrossRef] [PubMed] [Green Version]
  48. Grimme, S.; Antony, J.; Ehrlich, S.; Krieg, H. A consistent and accurate ab initio parametrization of density functional dispersion correction (DFT-D) for the 94 elements H-Pu. J. Chem. Phys. 2010, 132, 154104. [Google Scholar] [CrossRef] [Green Version]
Scheme 1. Synthesis of Rh complexes [Rh(CH3COCHCNHCH3)(CO)2] 2A [Rh(CH3COCHCNPhCH3)(CO)2] 2B, [Rh(CH3COCHCNHCH3)(CO)(PPh3)] 3A and [Rh(CH3COCHCNPhCH3)(CO)(PPh3)] 3B from (CH3COCH2CNHCH3) 1A and (CH3COCH2CNPhCH3) 1B.
Molecules 27 01931 sch001
Figure 1. PW91/TZP DFT optimized structures of the possible isomers of the indicated [Rh(N,O-BID)(CO)(PPh3)] complexes with selected bond distances (in angstrom) and bonding angles (in degrees).
Molecules 27 01931 g001
Figure 2. Selected Kohn-Sham frontier orbitals of the DFT PW91/TZP optimized geometry of the main isomers (O-trans-CO) of [Rh(CH3COCHCNHCH3)(CO)(PPh3)] 3A and [Rh(CH3COCHCNPhCH3)(CO)(PPh3)] 3B.
Molecules 27 01931 g002
Scheme 2. Reaction scheme for the (a) [Rh(CH3COCHCNPhCH3)(CO)(PPh3)] 3B + CH3I reaction and (b) [Rh(CH3COCHCNHCH3)(CO)(PPh3)] 3A + CH3I reaction.
Molecules 27 01931 sch002
Figure 3. IR spectra of the reaction between (a) [Rh(CH3COCHCNPhCH3)(CO)(PPh3)] 3B and 0.0272 mol dm−3 CH3I and (b) [Rh(CH3COCHCNHCH3)(CO)(PPh3)] 3A and 0.0537 mol dm−3 CH3I, both at at 25 °C, with the CH3I concentration at 10× excess, with respect rhodium concentration at the indicated time in s. (c) The [Rh(CH3COCHCNPhCH3)(CO)(PPh3)] 3B + CH3I reaction, as monitored at 1973.62 and 2059.72 cm−1, with time. (d) The [Rh(CH3COCHCNHCH3)(CO)(PPh3)] 3A + CH3I reaction, as monitored at 1967.66, 2061.30 and 1713.74 cm−1, with time.
Molecules 27 01931 g003
Figure 4. (a) UV–Vis spectra of the reaction between [Rh(CH3COCHCNHCH3)(CO)(PPh3)] 3A and 0.008384 mol dm−3 CH3I concentration in 50× excess, with respect rhodium concentration at the indicated time in s. (b) The [Rh(CH3COCHCNHCH3)(CO)(PPh3)] 3A + CH3I reaction, as monitored at the indicated wavelengths with time. (c) Graph of the observed kinetic rate constants against the concentrations of the reaction between [Rh(CH3COCHCNPhCH3)(CO)(PPh3)] 3B and CH3I at 15, 20, 25, 30, and 35 °C, obtained from UV–Vis data at 404 nm. (d) Eyring plot of the 3B and CH3I reaction in (c).
Molecules 27 01931 g004
Figure 5. Stacked 1H-NMR spectra of the reaction between the [Rh(CH3COCHCNPhCH3)(CO)(PPh3)] 3B complex and CH3I, focusing on the methine (left) and methyl (right) proton signals at 25 °C. The CH3I concentration (0.0502 mol dm−3) was in a 10× excess.
Molecules 27 01931 g005
Figure 6. Stacked 1H-NMR spectra of the reaction between the [Rh(CH3COCHCNHCH3)(CO)(PPh3)] 3A complex and CH3I, focusing on the methine (left) and methyl (right) proton signals at 25 °C. The CH3I concentration (0.0301 mol dm−3) was in a 6× excess.
Molecules 27 01931 g006
Figure 7. Observed kinetic rate constants for obtained through UV–Vis spectroscopy, IR spectroscopy, and NMR spectroscopy, at 25 °C, for the reaction between CH3I and (a) [Rh(CH3COCHCNHCH3)(CO)(PPh3)] 3B and (b) [Rh(CH3COCHCNPhCH3)(CO)(PPh3)] 3A.
Molecules 27 01931 g007
Figure 8. (a) DFT-calculated optimized geometries of the [Rh(CH3COCHCNPhCH3)(CO)(PPh3)] 3B complex (isomer O-trans-CO) and CH3I, with a large separation between the reactant molecules, referred to as reactants. (b) DFT-calculated transition state of the linear oxidative addition reaction between the [Rh(CH3COCHCNPhCH3)(CO)(PPh3)] 3B and CH3I. Referred to as TS1. The bonds, associated with the imaginary frequency of the transition state, are indicated with black dotted lines. (c) DFT-calculated optimized geometry of the Rh(III)-alkyl 2a product, referred to as Alkyl 2a. The three Ph groups of the PPh3 ligand and CH3CCHCCH3 backbone of [CH3COCHCNPhCH3] ligand are excluded for clarity.
Molecules 27 01931 g008
Figure 9. (a) DFT-calculated optimized geometries of the [Rh(CH3COCHCNHCH3)(CO)(PPh3)] 3A (isomer O-trans-CO) complex and CH3I with a large separation between the reactant molecules, referred to as Reactants. (b) DFT-calculated optimized geometry of the linear oxidative addition reaction between the [Rh(CH3COCHCNHCH3)(CO)(PPh3)] 3A and CH3I. The methyl group of the CH3I moves towards the Rh metal centre in order to form a bond and the distance between the methyl group and the I atom increases, referred to as TS1. (c) DFT-calculated optimized geometry of the Rh(III)-alkyl 2a product formed during step 1, referred to as Alkyl-2a. (d) Left: Geometry of the DFT-calculated transition state of the methyl migration towards the CO group in the formation of the [Rh(CH3COCHCNHCH3)(CO)(PPh3)] 3A acyl 14a product. Right: Deviation of the CO group from the square planar geometry, referred to as TS2. (e) DFT-calculated optimized geometry of the [Rh(CH3COCHCNHCH3)(CO)(PPh3)]-acyl product, after the migration of the methyl group towards the CO group, referred to as Acyl. The three Ph groups of the PPh3 ligand and CH3CCHCCH3 backbone of [CH3COCHCNHCH3] ligand were excluded for clarity. The bonds associated with the imaginary frequency of TS1 and TS2 are indicated with black dotted lines.
Molecules 27 01931 g009
Scheme 3. Reaction scheme for the oxidative addition reaction of (a) [Rh(CH3COCHCNPhCH3)(CO)(PPh3)] 3B and CH3I and (b) [Rh(CH3COCHCNHCH3)(CO)(PPh3)] 3A and CH3I.
Molecules 27 01931 sch003
Table 3. Observed kinetic rate constants, wavelengths, and concentrations utilized in the IR study of the oxidative addition reaction between the indicated [Rh(N,O-BID)(CO)(PPh3)] and CH3I at 25 °C.
Concentration CH3I
(mol dm−3)
Reaction StepWavelength (cm−1)kobs (s−1)
[Rh(CH3COCHCNPhCH3)(CO)(PPh3)] 3B + CH3I
0.02720Rh(I) loss1972.620.00720(5)
Rh(III)-alkyl gain2059.720.007(3)
0.05383Rh(I) loss1972.620.0132(2)
Rh(III)-alkyl gain2059.720.0124(1)
0.12780Rh(I) loss1972.620.02338(4)
Rh(III)-alkyl gain2059.720.0242(2)
[Rh(CH3COCHCNHCH3)(CO)(PPh3)] 3A + CH3I
0.0236Rh(I) loss1967.660.00227(5)
Rh(III)-alkyl gain2061.300.0077(4)
Rh(III)-alkyl loss2061.300.00103(2)
Rh(III)-acyl gain1713.740.0014(5)
0.0537Rh(I) loss1967.660.0059(1)
Rh(III)-alkyl gain2061.300.015(1)
Rh(III)-alkyl loss2061.300.00174(3)
Rh(III)-acyl gain1713.740.00185(3)
0.1283Rh(I) loss1967.660.0158(2)
Rh(III)-alkyl gain2061.300.029(1)
Rh(III)-alkyl loss2061.300.00191(3)
Rh(III)-acyl gain1713.740.00181(2)
Table 4. Second-order reaction rate constants at different temperatures of the oxidative addition reaction between the [Rh(N,O-BID)(CO)(PPh3)] complexes and CH3I, as obtained from a UV–Vis kinetic study.
ComplexTemperature (K)k2 (mol−1 dm3 s−1)
[Rh(CH3COCHCNHCH3)(CO)(PPh3)] 3A2980.144(1)
[Rh(CH3COCHCNPhCH3)(CO)(PPh3)] 3B2880.125(3)
2930.188(4)
2980.213(5)
3030.29(2)
3080.44(2)
Table 5. Pseudo first-order reaction rate constant of the methine and methyl resonance signals of the oxidative addition reaction between CH3I and [Rh(N,O-BID)(CO)(PPh3)], as obtained from an NMR kinetic study.
Reaction StepResonance Signalppmkobs (s−1)Average kobs (s−1)
[Rh(CH3COCHCNPhCH3)(CO)(PPh3)] 3B + 0.0502 M CH3I
Rh(I)-loss (one isomer)Methine 5.0180.0112(6)0.011(1)
O-CH31.5670.0111(7)
N-CH31.6880.0111(6)
Rh(III)-alkyl gain (one isomer)Methine 5.0040.014(1)0.014(1)
O-CH31.6550.014(1)
N-CH31.8690.014(1)
[Rh(CH3COCHCNHCH3)(CO)(PPh3)] 3A + 0.0301 M CH3I
Rh(I)-loss (two isomers)Methine5.002 and 4.9900.0040(2)0.0043(2)
O-CH31.583 (a) and 1.838 (b)0.0047(1)
N-CH32.056 (a) and 1.965 (b)0.0042(2)
Rh(III)-alkyl gain (one isomer)Methine4.881- a- a
O-CH32.017; 1.862- a
N-CH3 - a
Rh(III)-alkyl loss (one isomer)Methine4.8810.00171(4)0.00170(4)
O-CH32.017; 1.8620.00170(4)
N-CH3 0.00168(4)
Rh(III)-acyl gain (isomer A) bMethine4.976 and 5.0140.00157(2)0.00152(1)
O-CH32.157 (a) and 2.133 (b)0.00150(1)
N-CH32.861 (a) and 2.555 (b)0.00150(1)
a Unable to obtain sufficient statistical data. b Two Rh(III)-acyl isomers observed—the peaks of Rh(III)-acyl B were too small to obtain sufficient statistical data.
Table 6. PW91/TZP DFT-calculated energies (eV) for the reaction mechanism of the oxidative addition of CH3I to the applicable [Rh(N,O-BID)(CO)(PPh3)] complex.
ComplexEnergy (eV)
[Rh(CH3COCHCNPhCH3)(CO)(PPh3)] 3B
Reactants: 3B and CH3I0.54
TS10.83 (imaginary frequency 270.0i cm−1)
Alkyl: [Rh(III)-alkyl 2a]0.00
[Rh(CH3COCHCNHCH3)(CO)(PPh3)] 3A
Reactants: 3A and CH3I0.82
TS11.08 (imaginary frequency 266.0i cm−1)
Alkyl: [Rh(III)-alkyl product 2a]0.26
TS21.17 (imaginary frequency 419.0i cm−1)
Acyl: [Rh(III)-acyl product 14a]0.00
Publisher’s Note: MDPI stays neutral with regard to jurisdictional claims in published maps and institutional affiliations.

