
A Water Soluble 2-Phenyl-5-(pyridin-3-yl)-1,3,4-oxadiazole Based Probe: Antimicrobial Activity and Colorimetric/Fluorescence pH Response


 ,
,  ,
,  ,
,  ,
,  and
and 
Abstract
:1. Introduction
2. Results and Discussion
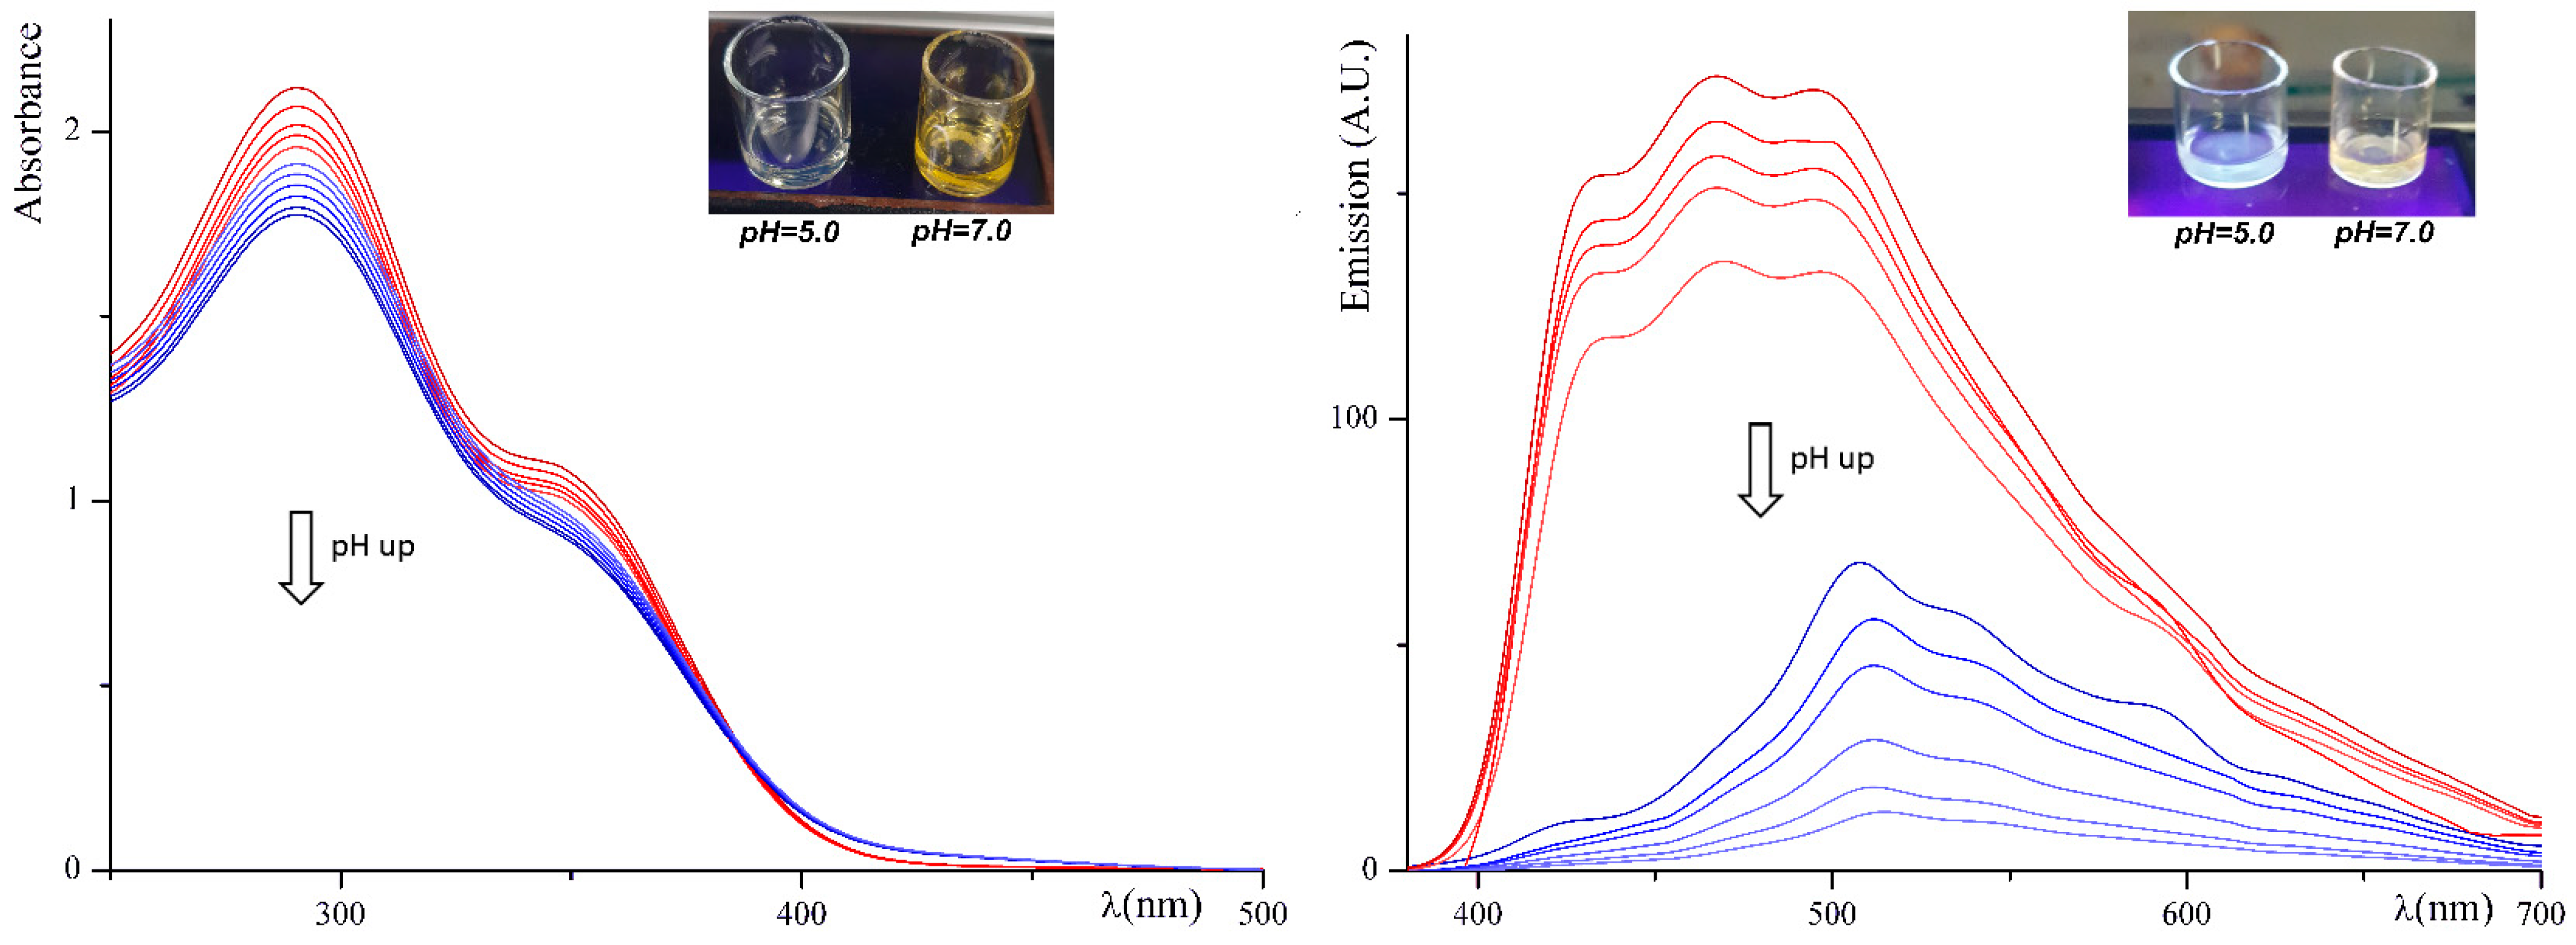
2.1. Design and Spectroscopic Behavior of C1
2.2. Antibacterial Activity
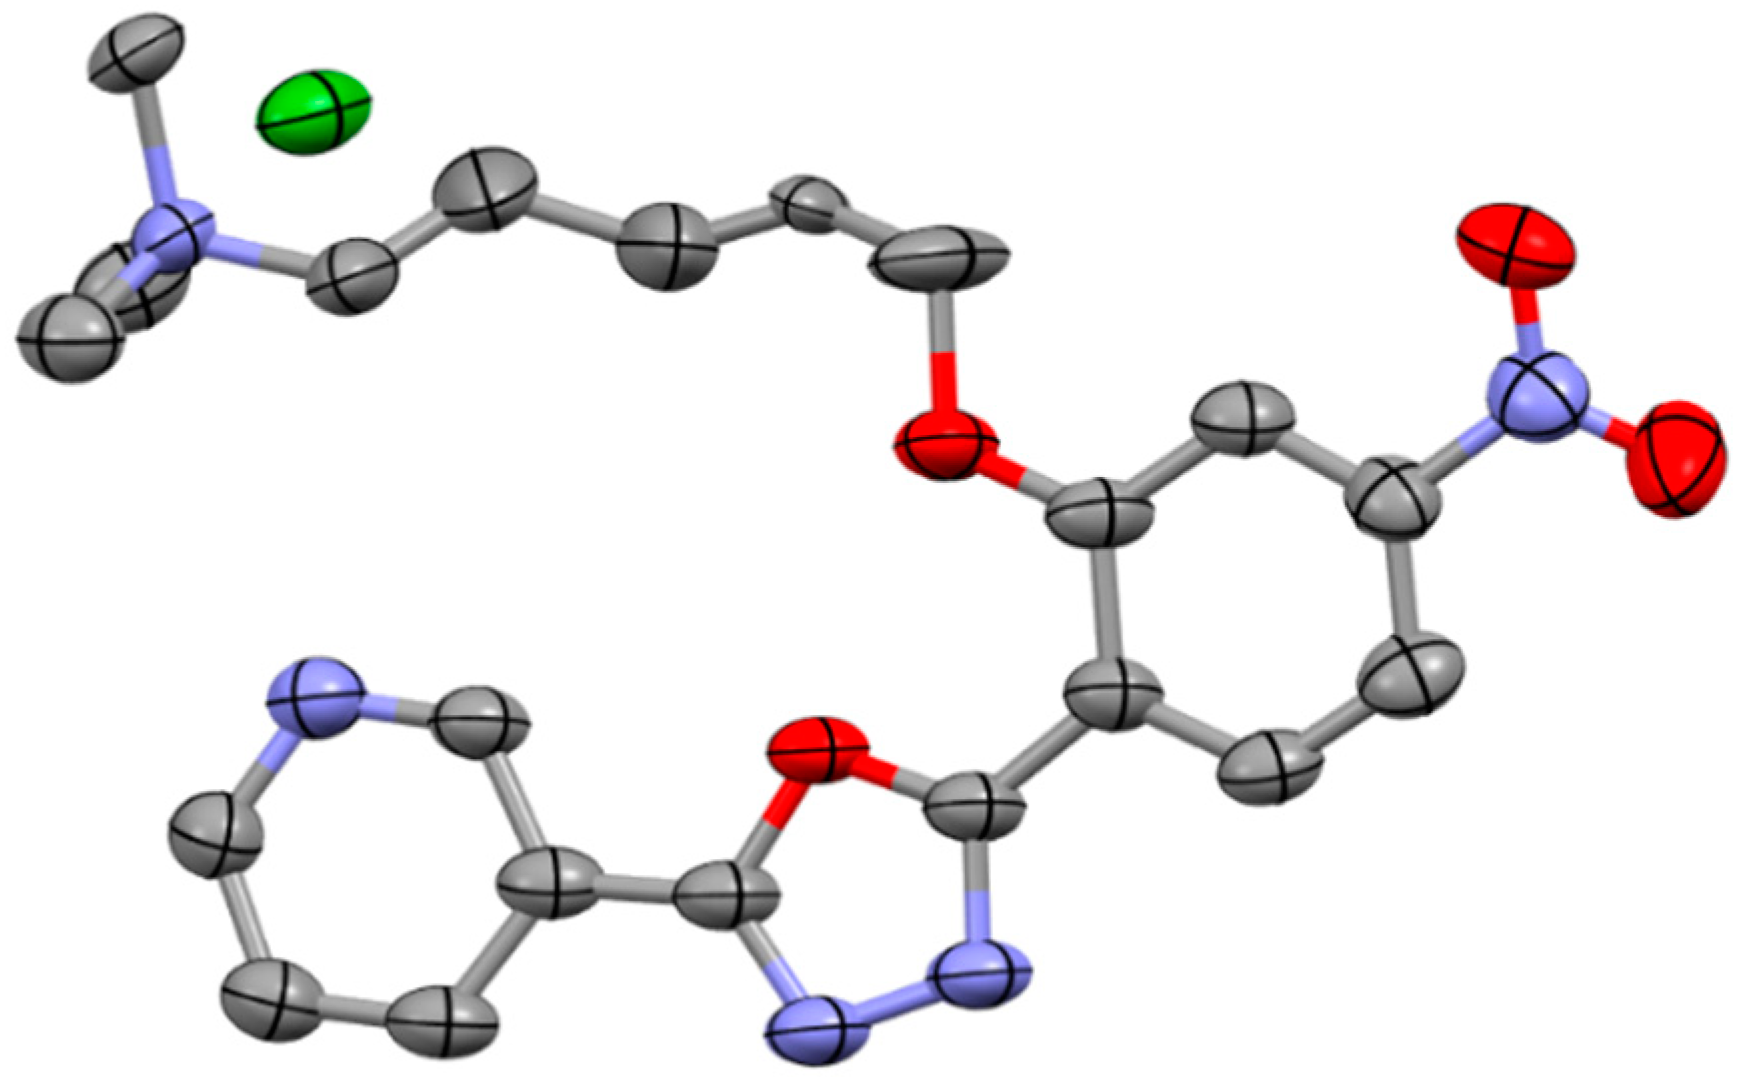
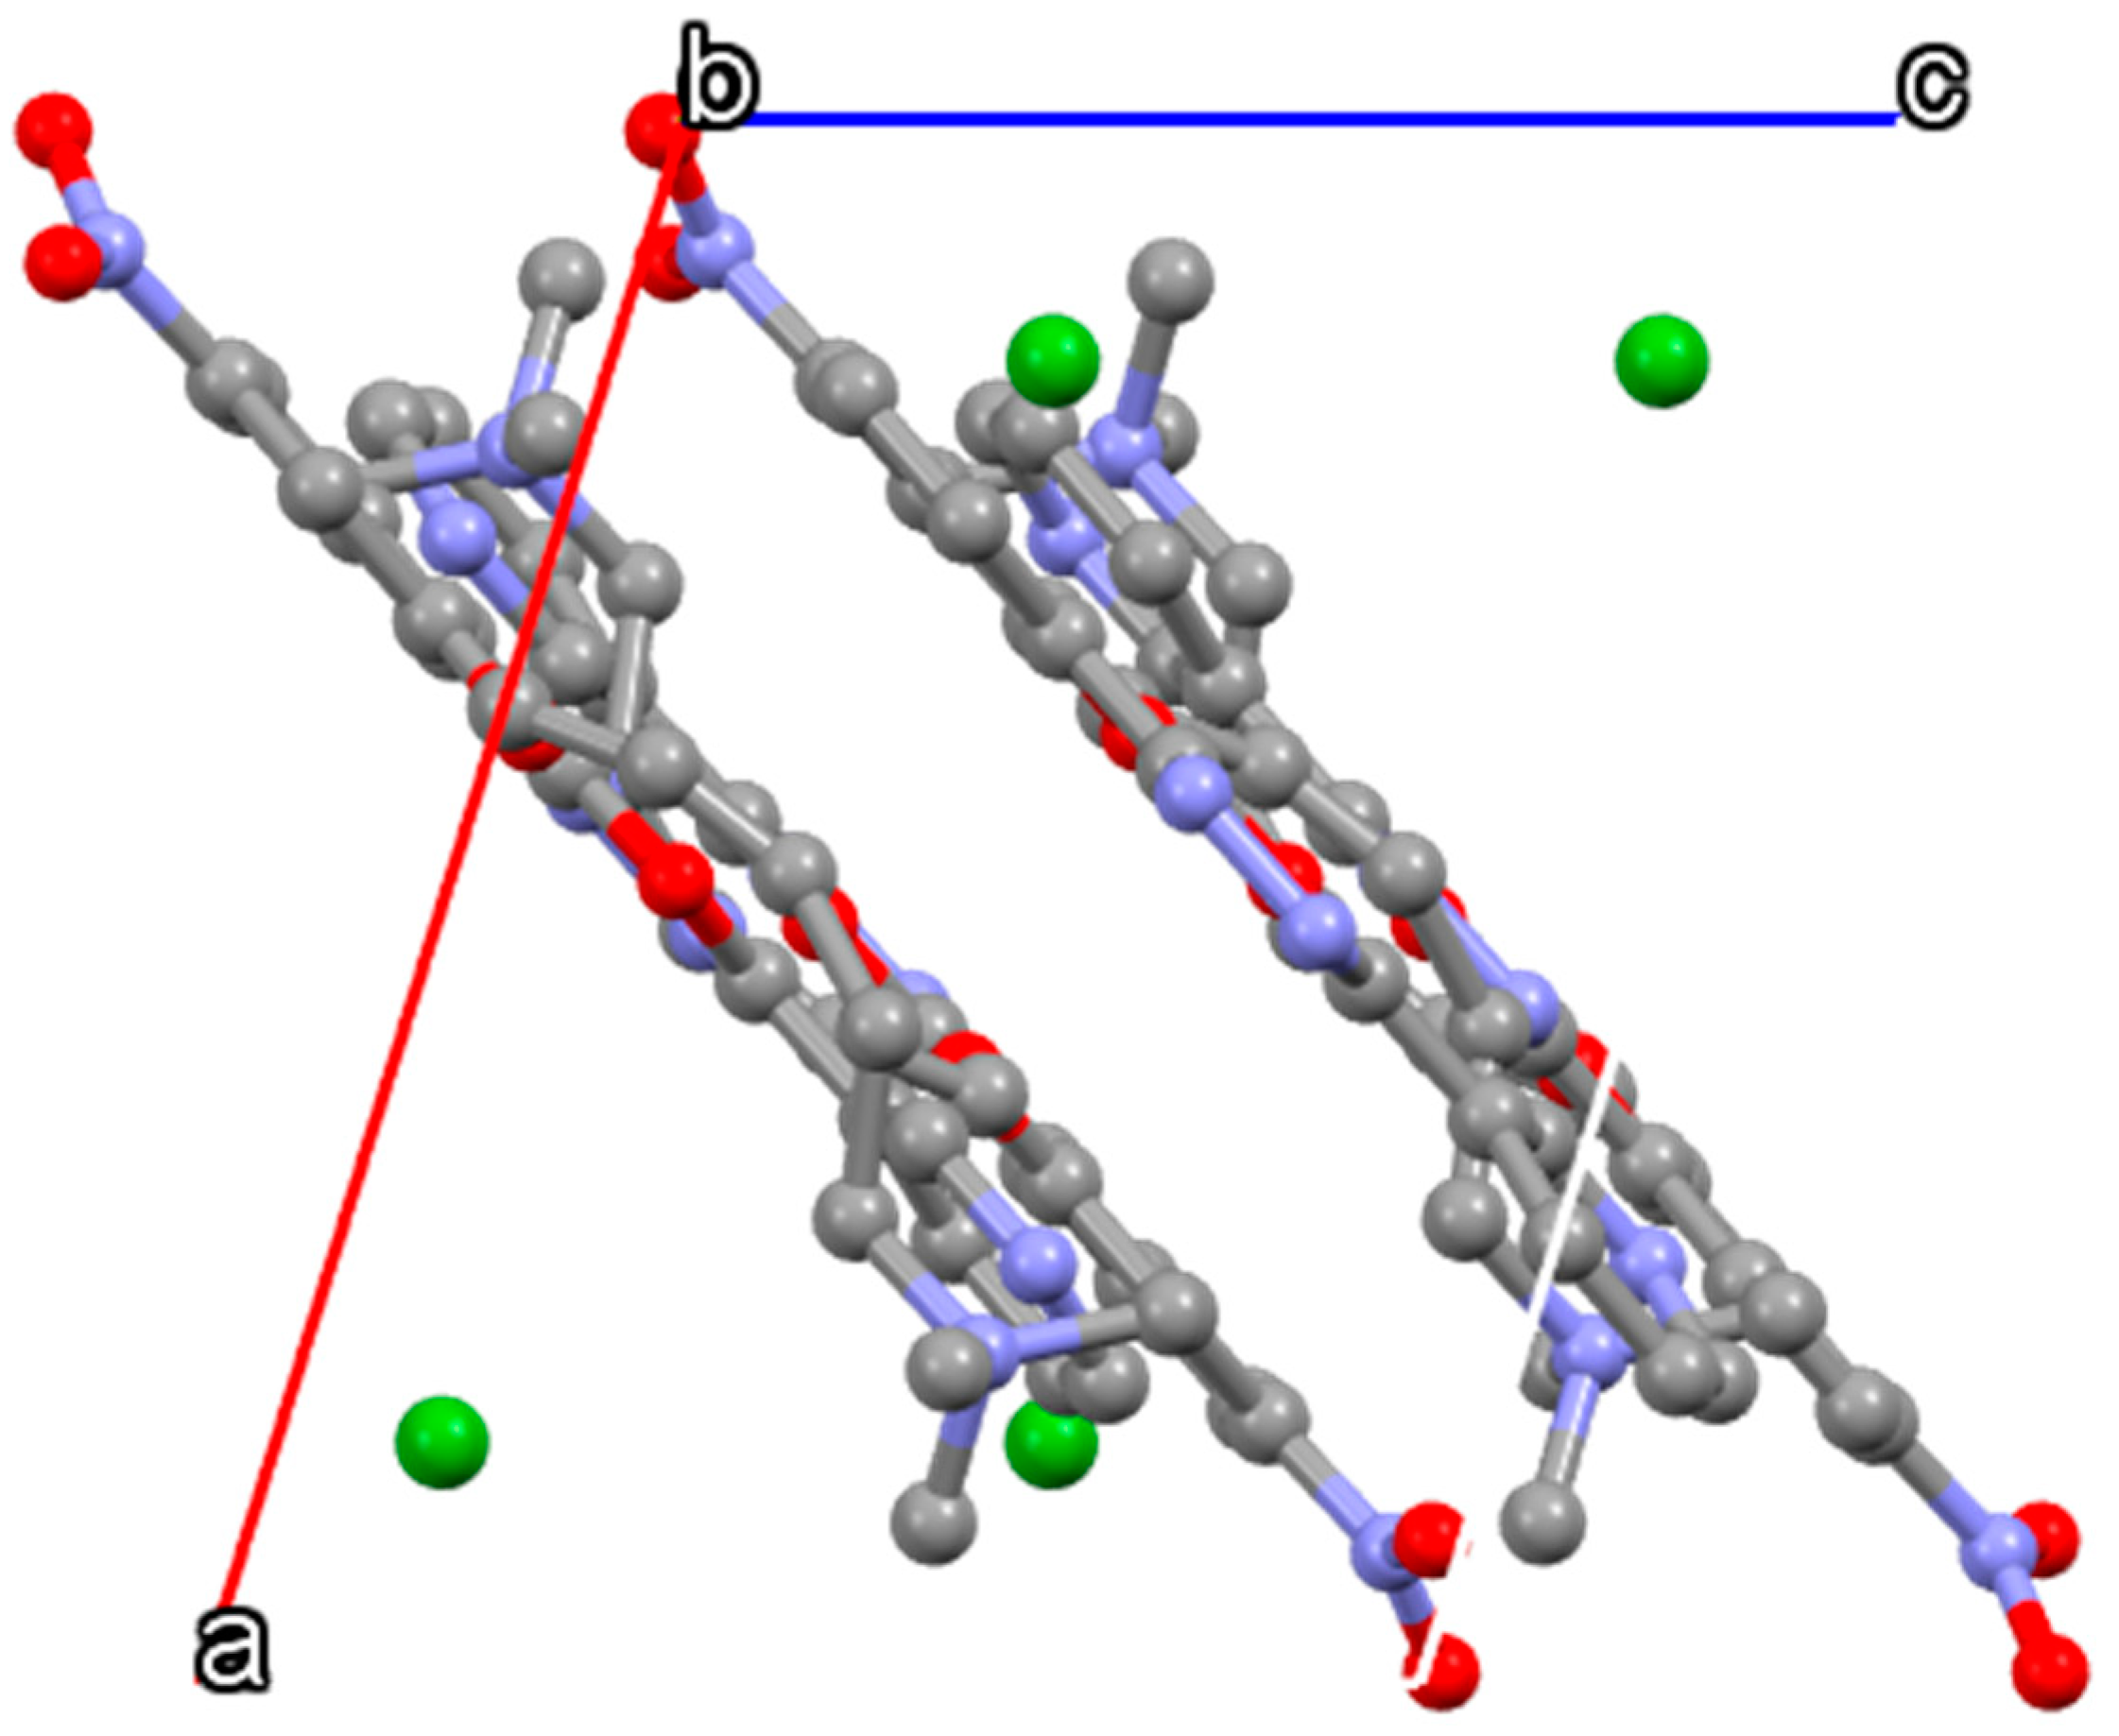
2.3. X-ray Structural Characterization of C1
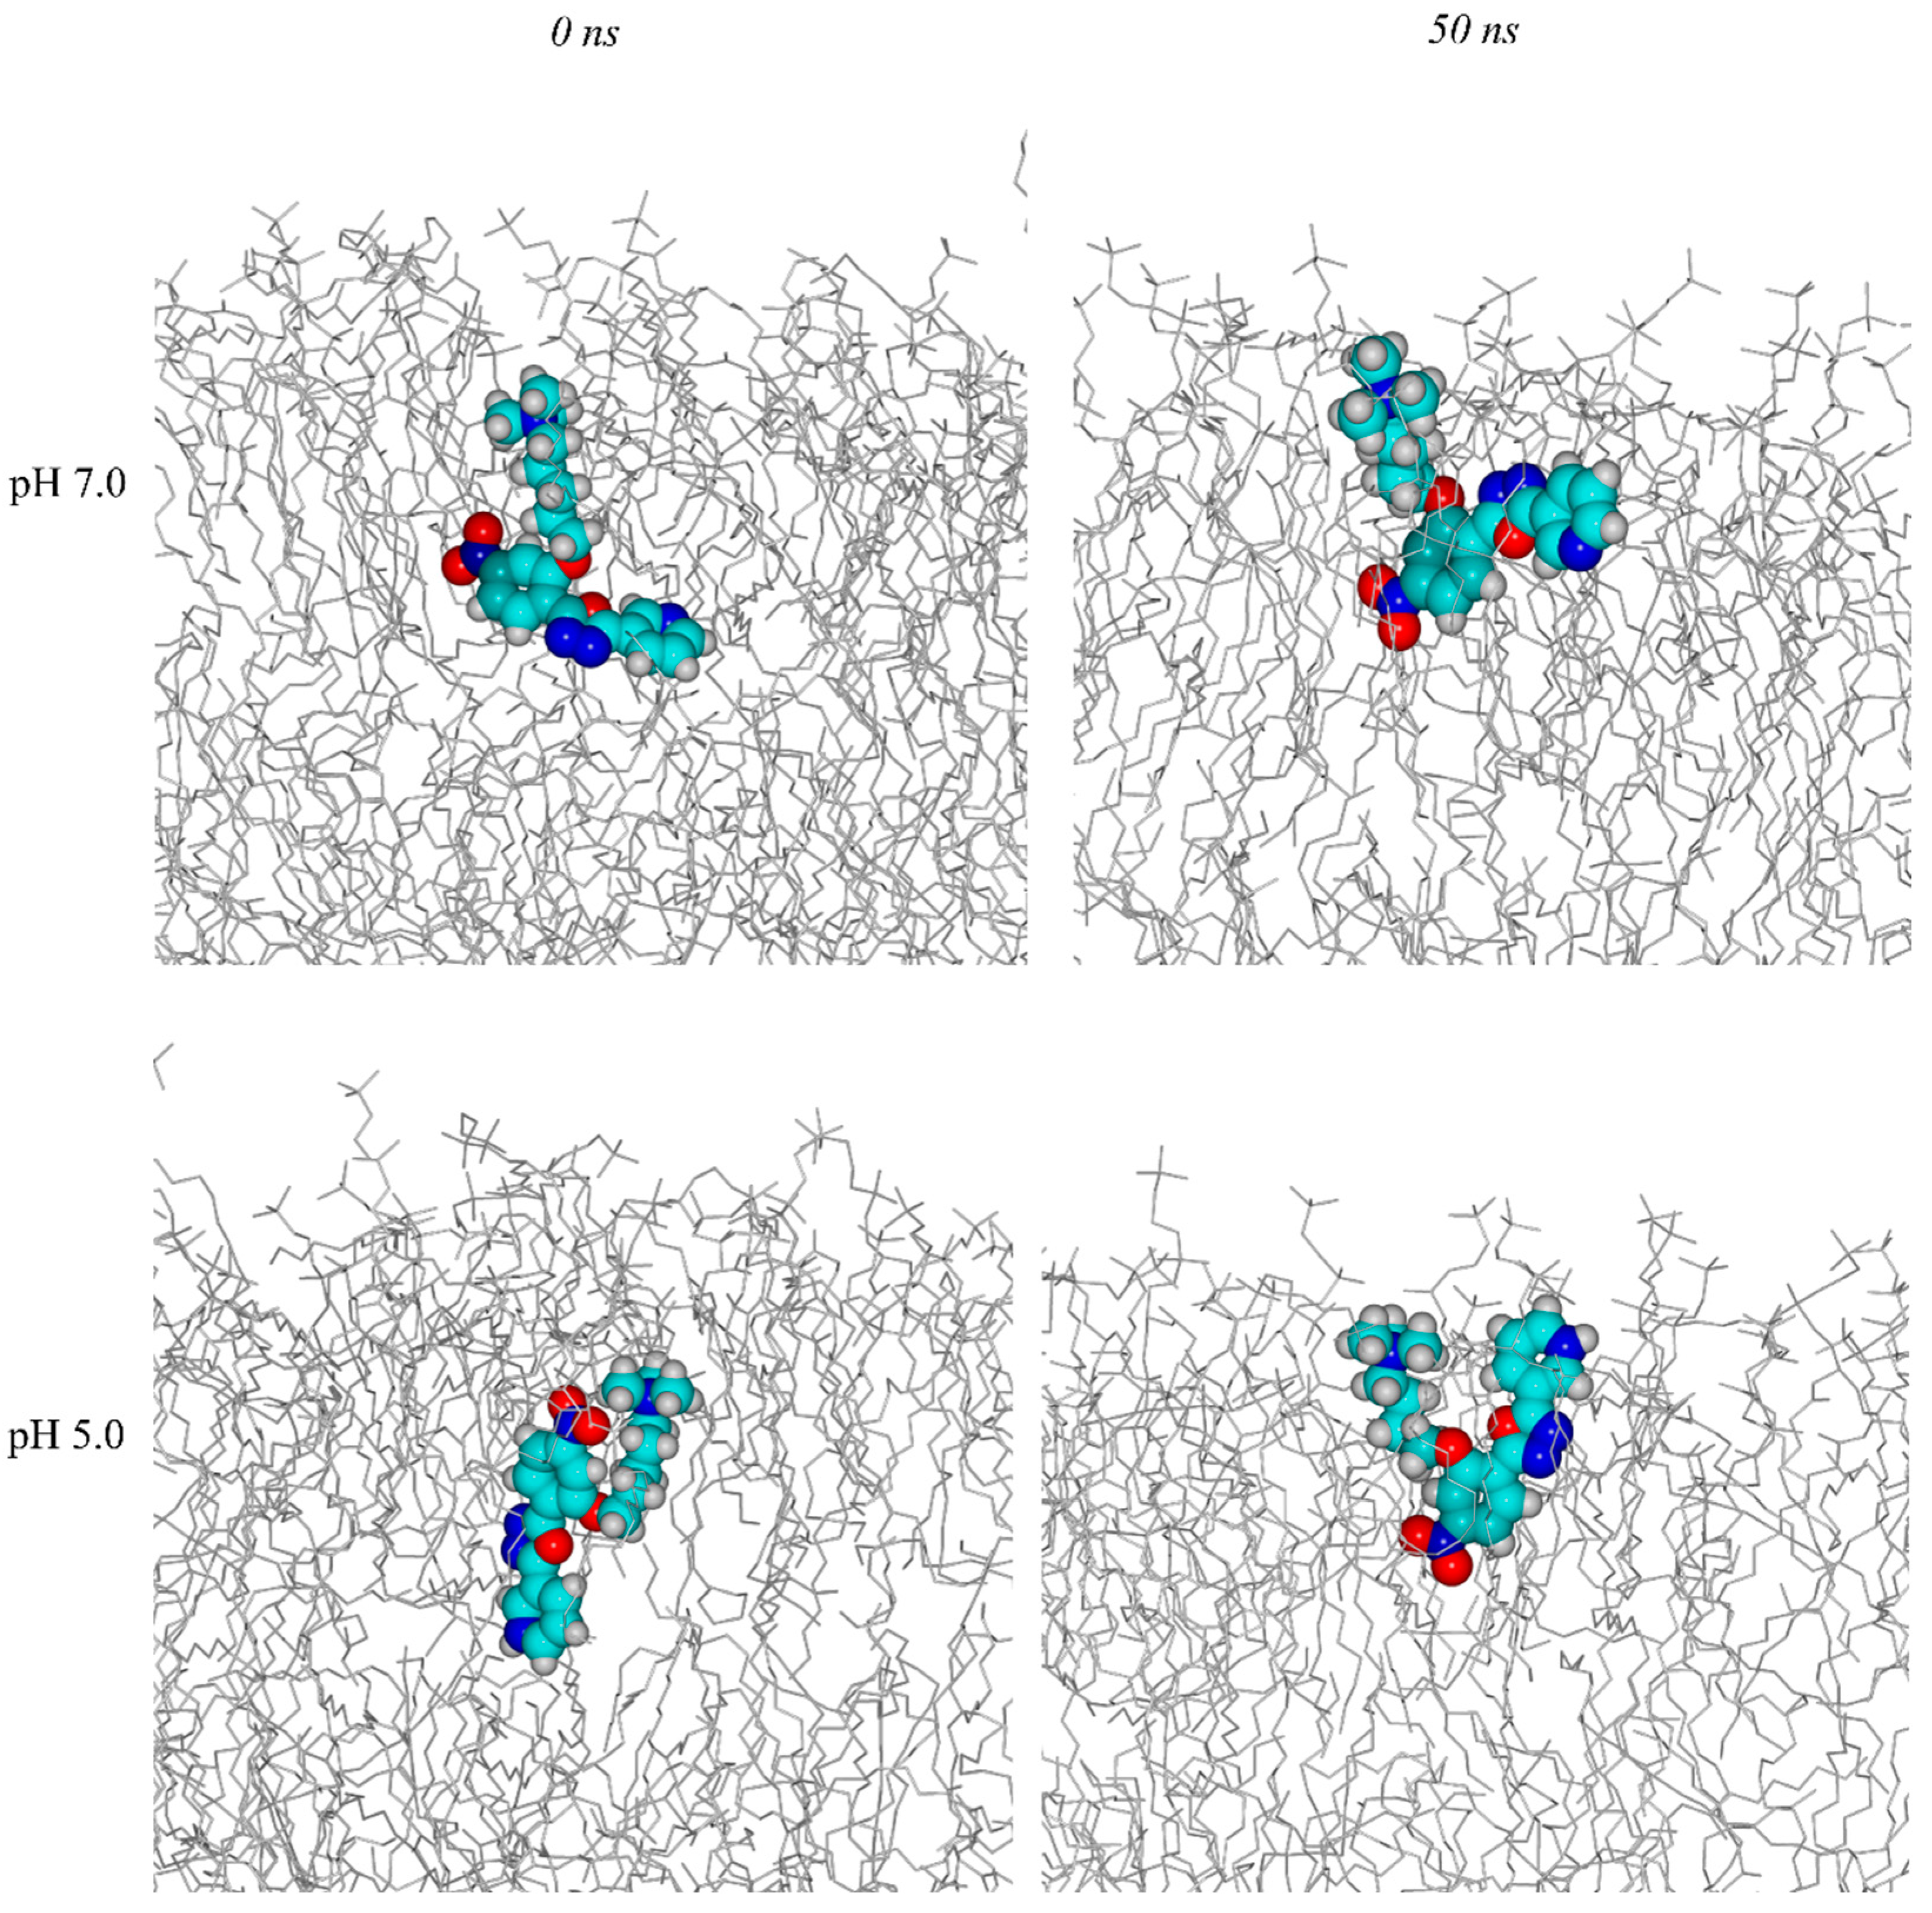
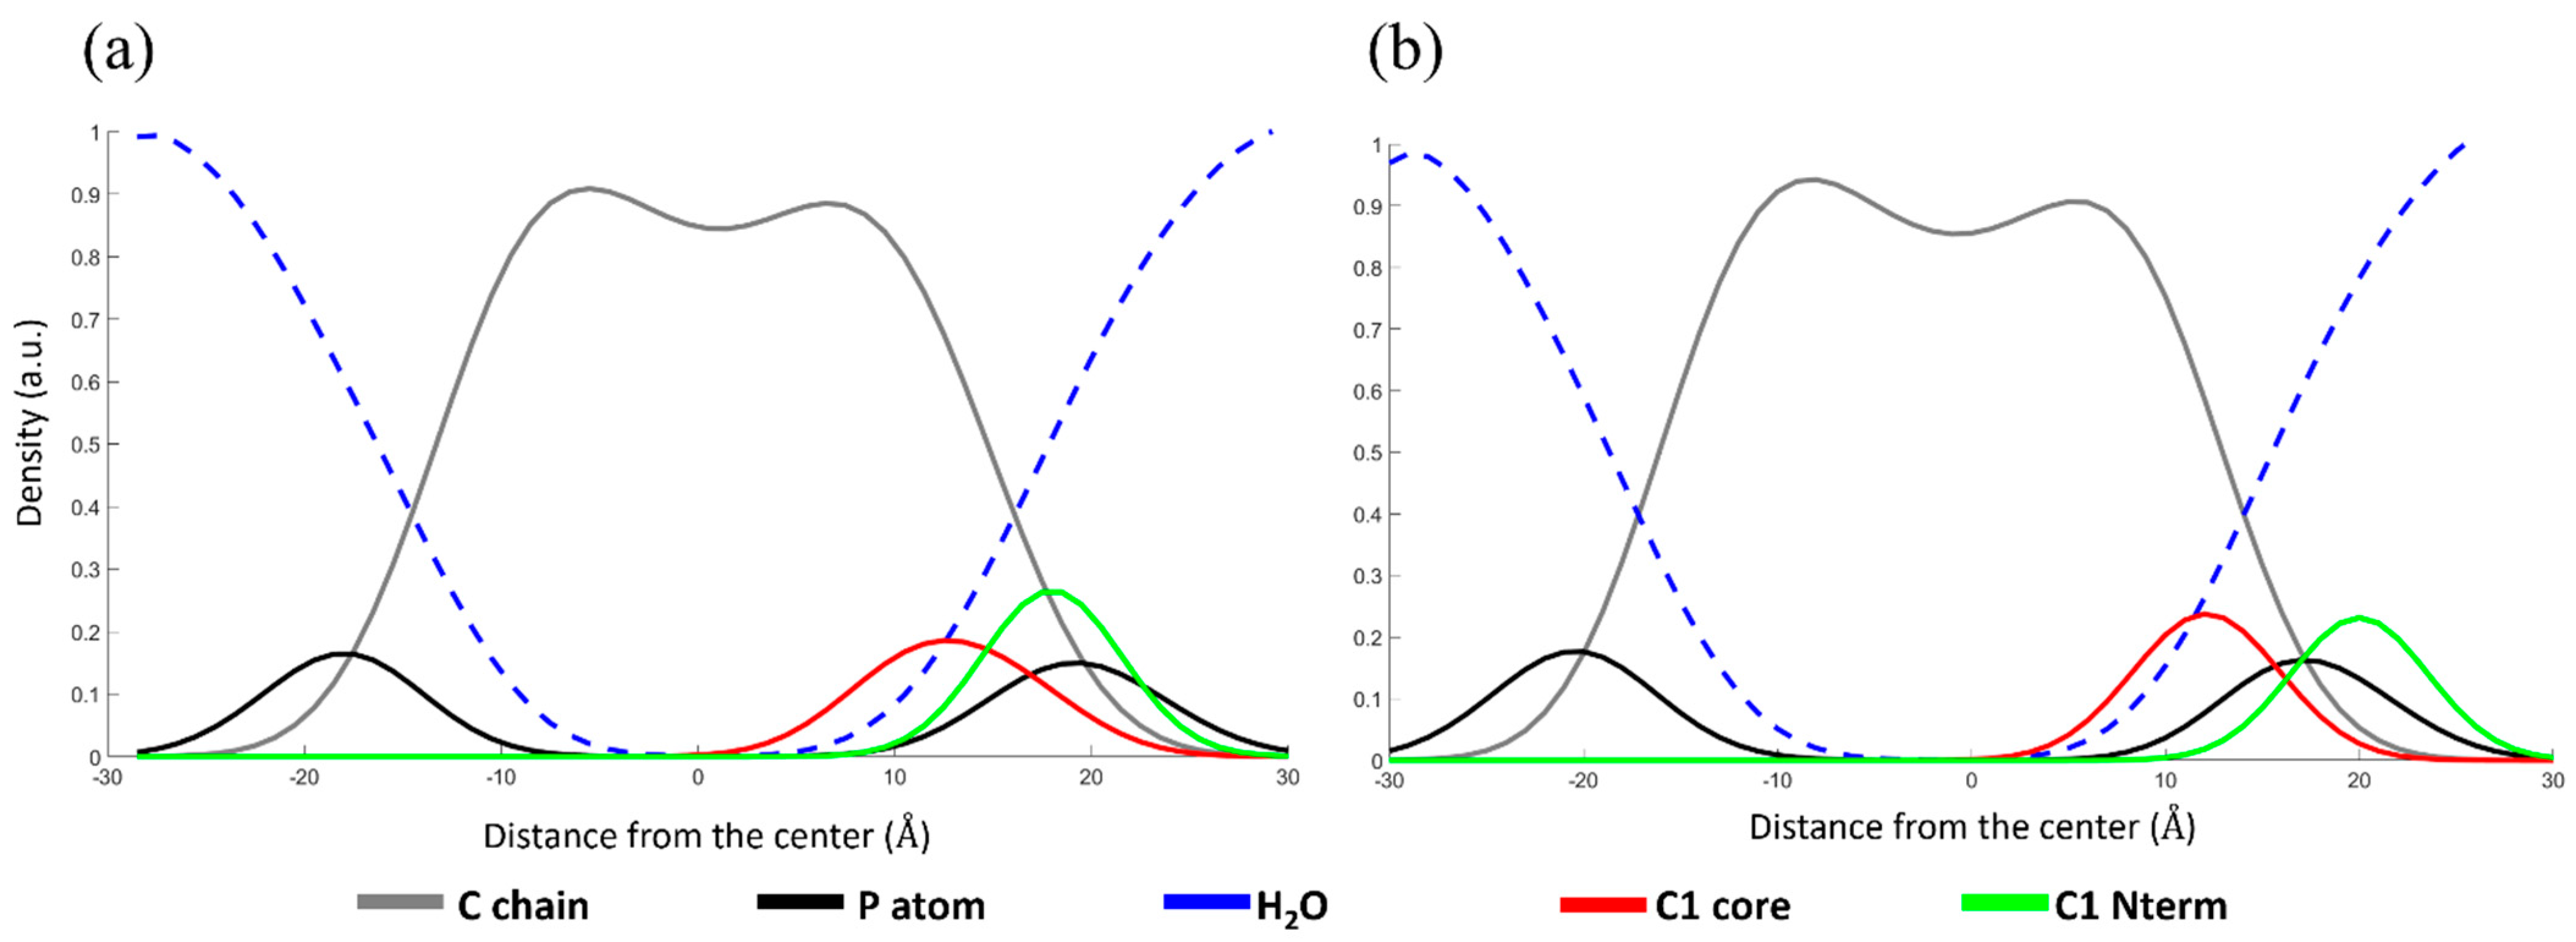
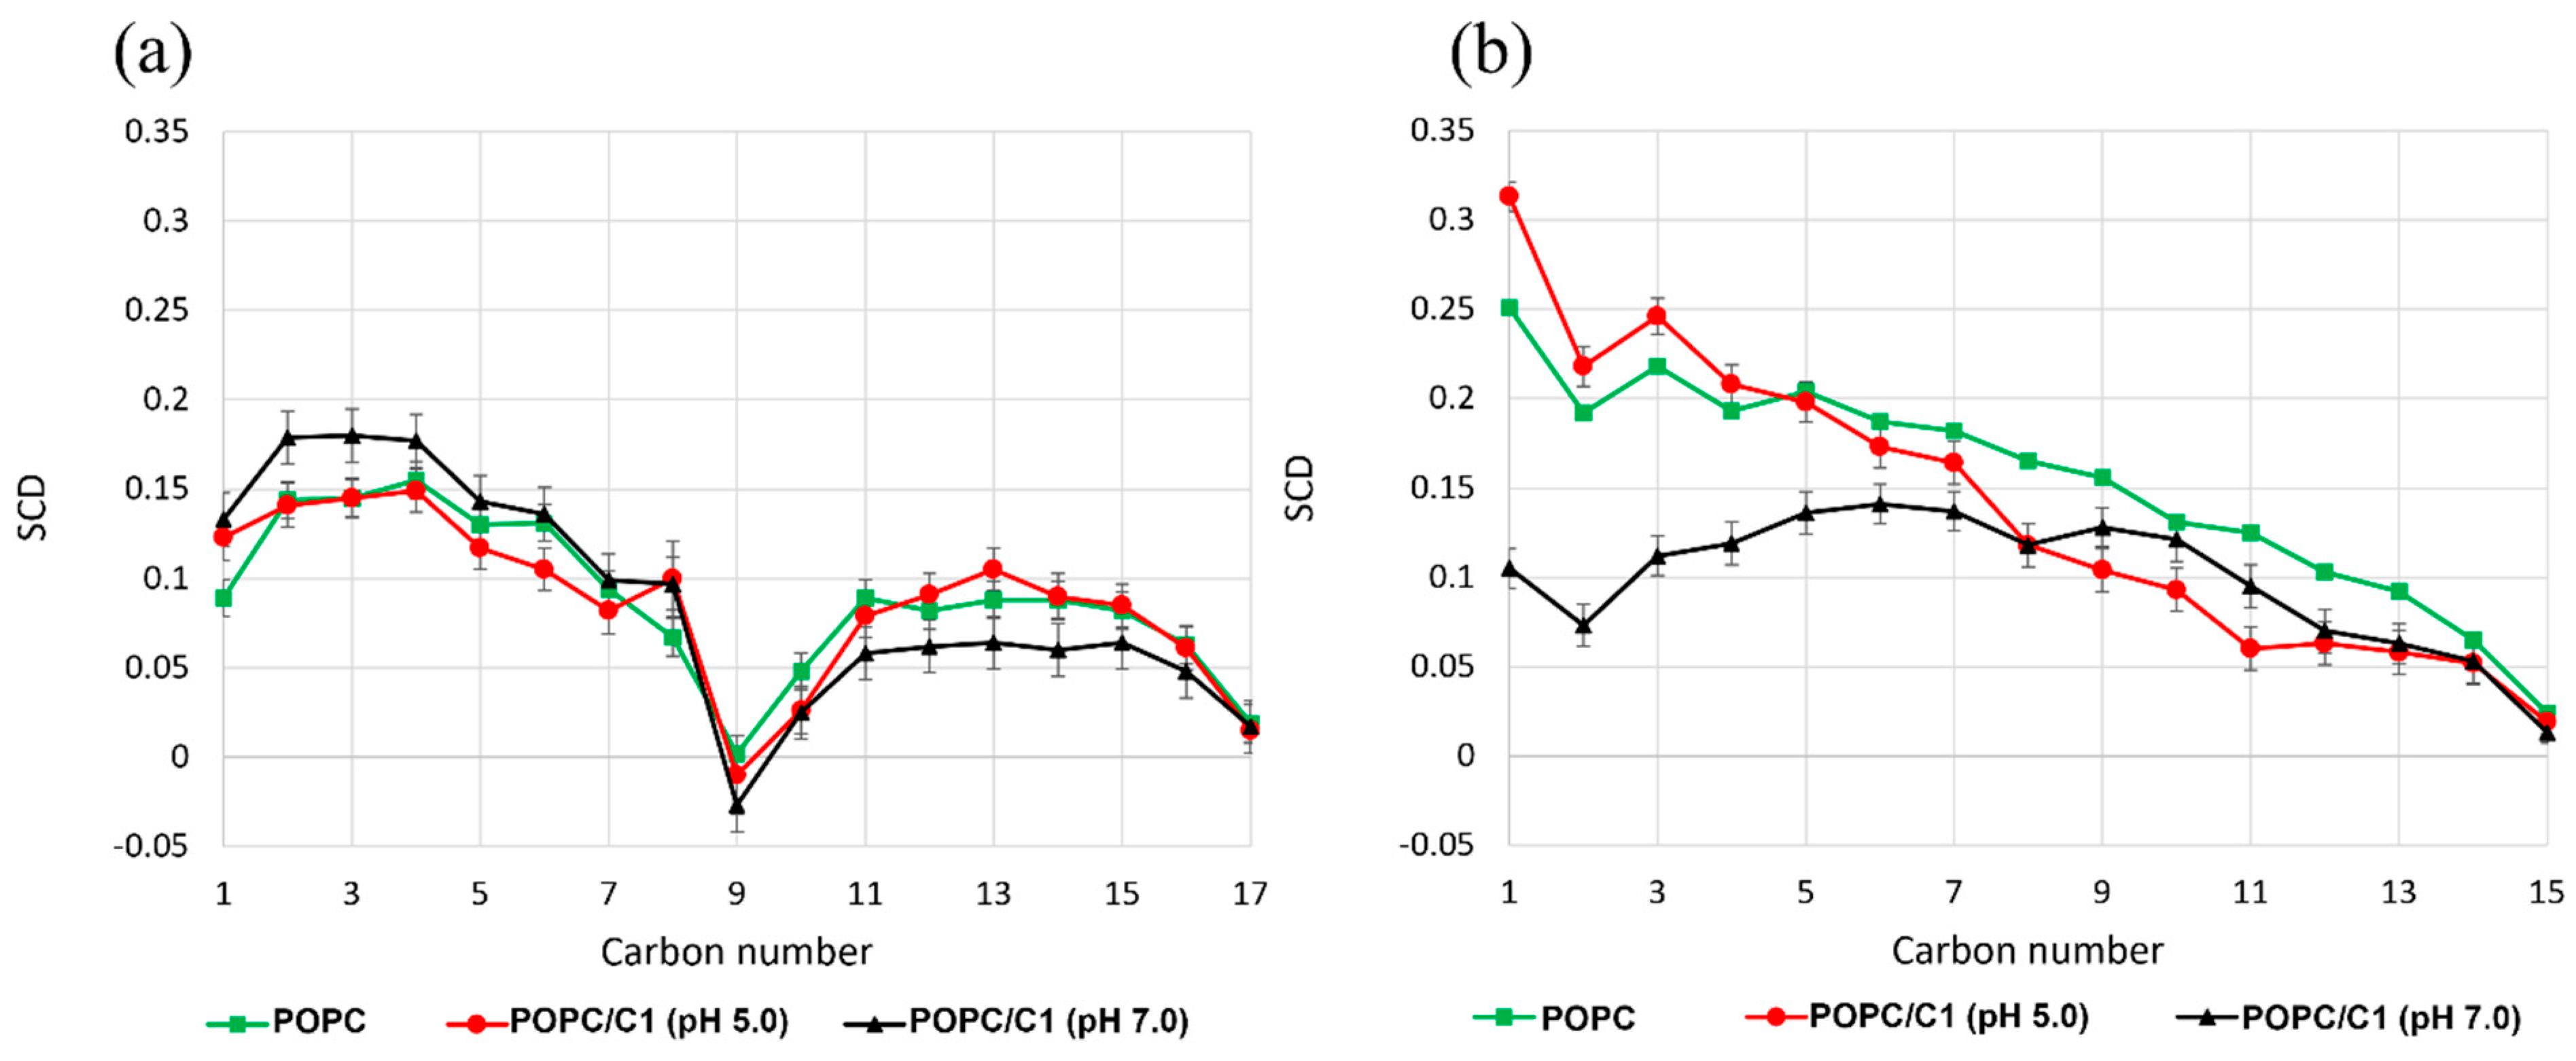
2.4. Molecular Dynamics Simulations
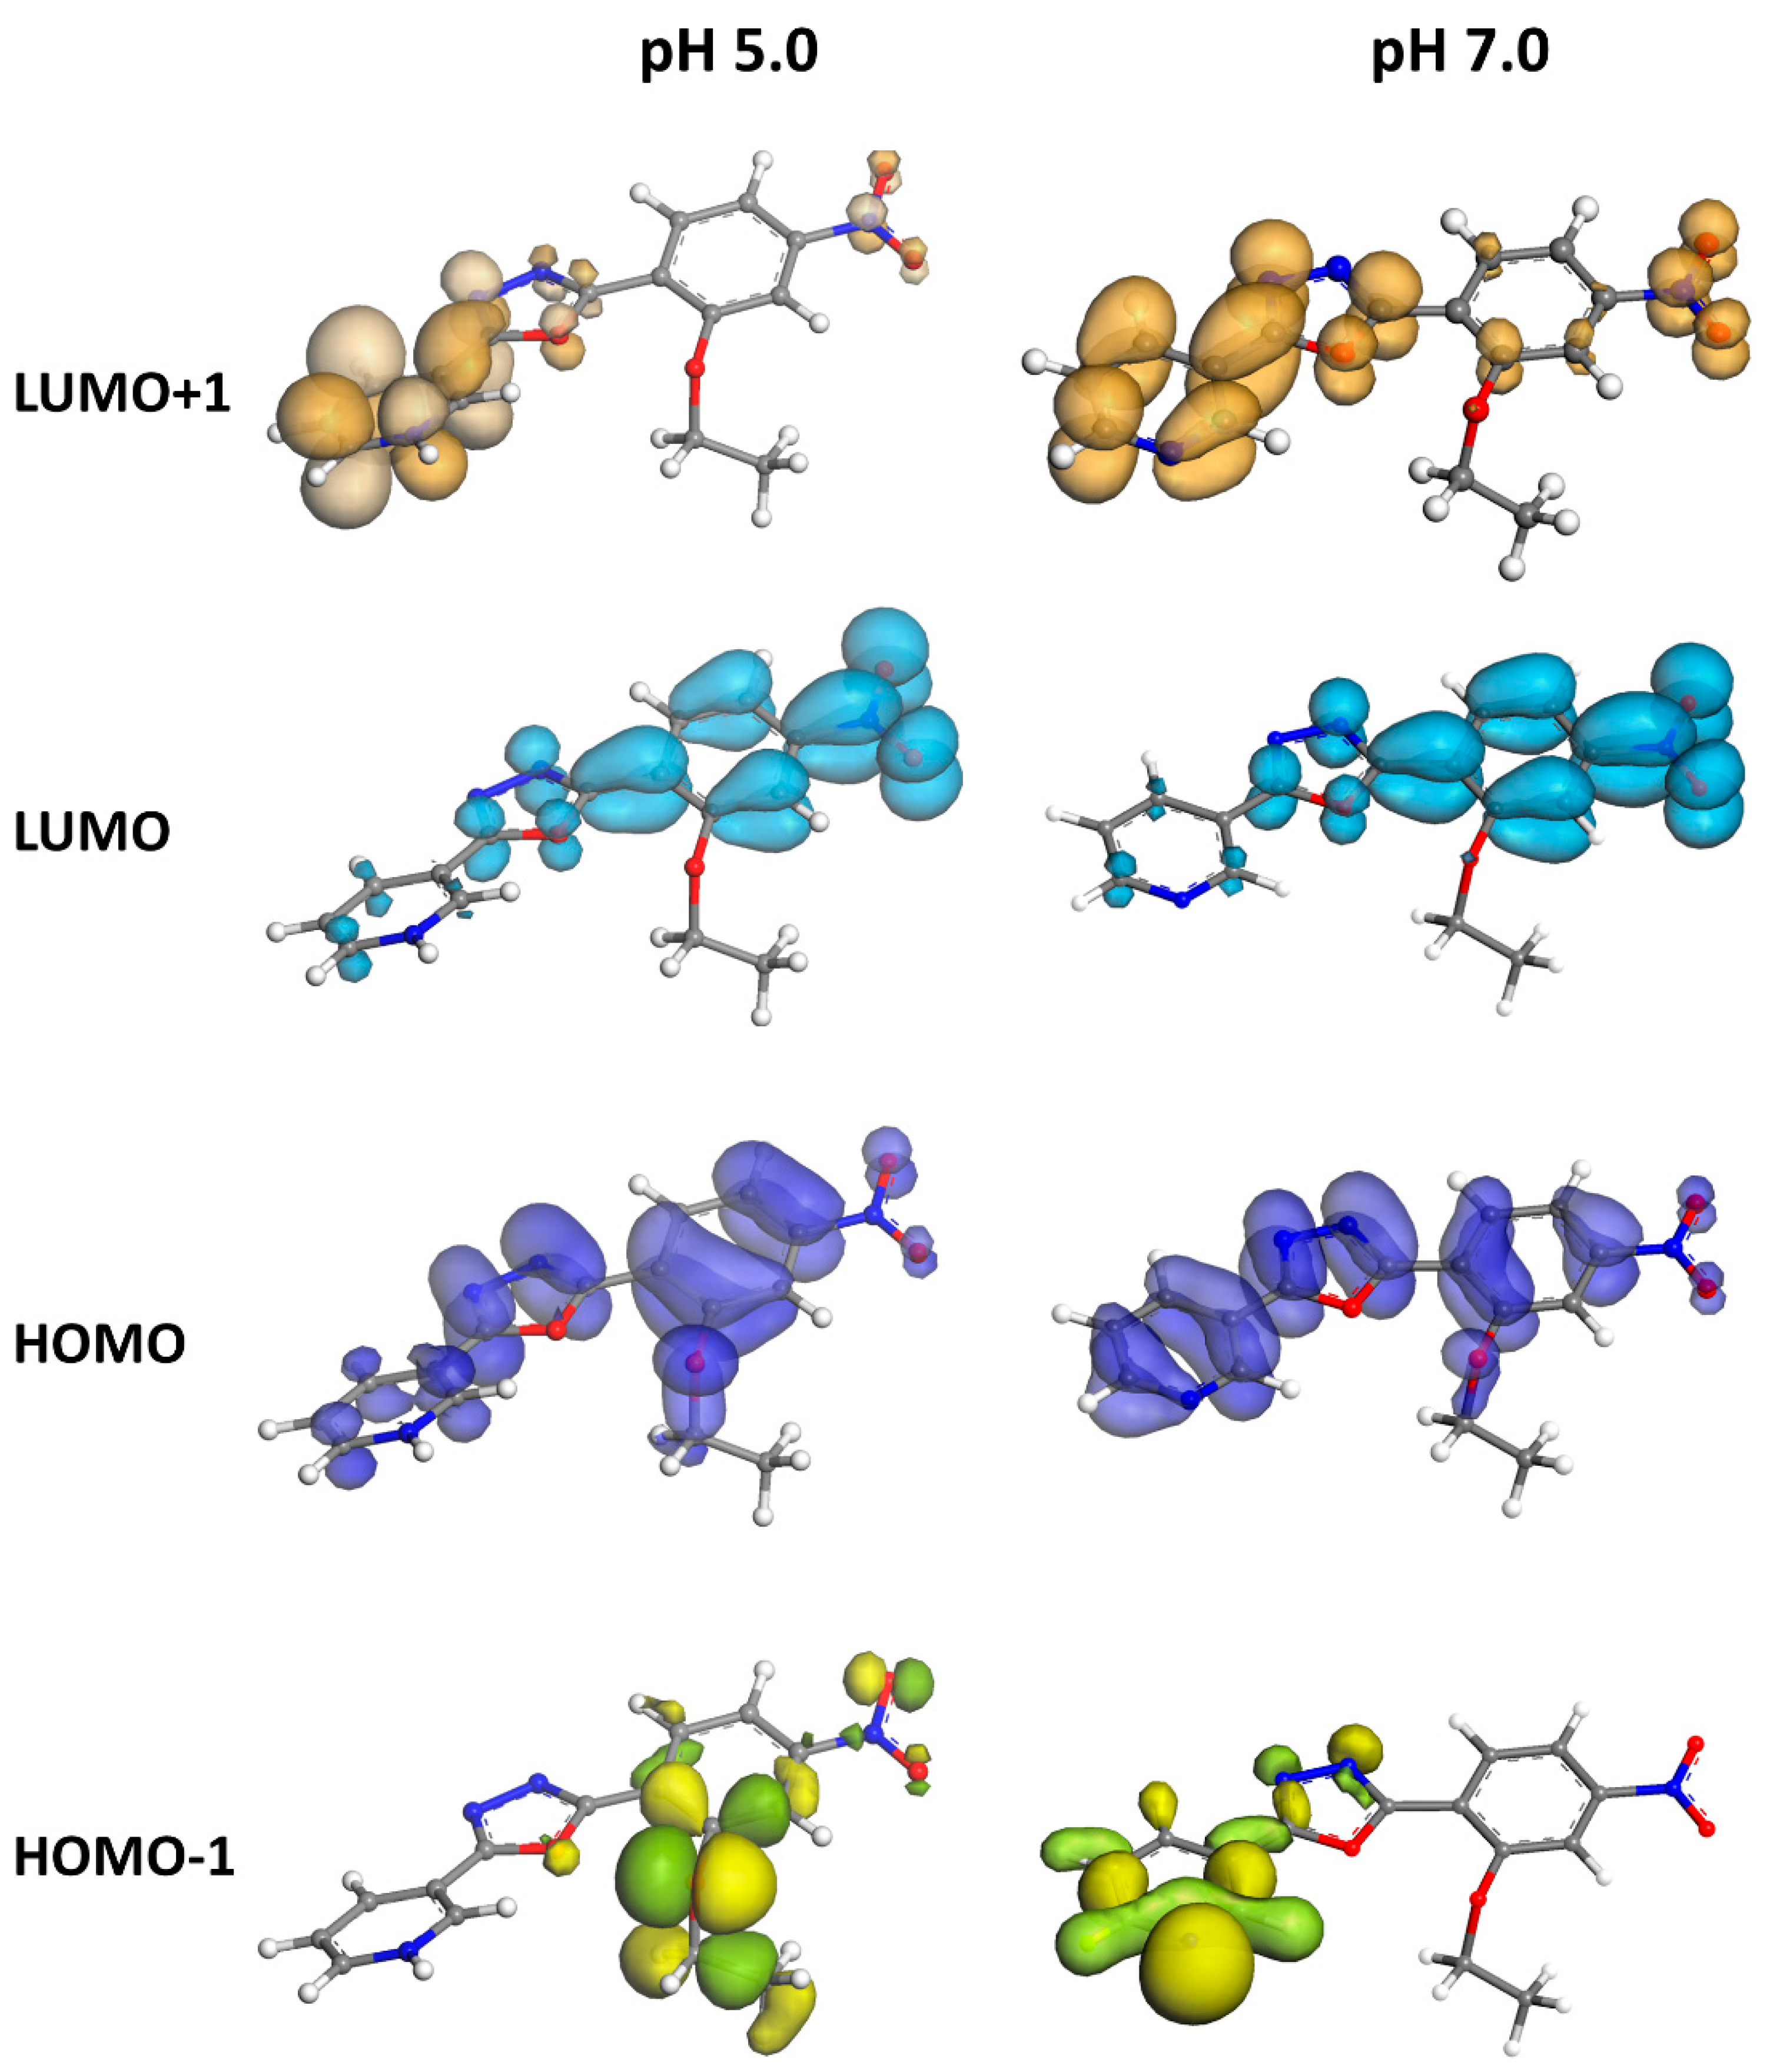
2.5. DFT Calculations
3. Experimental
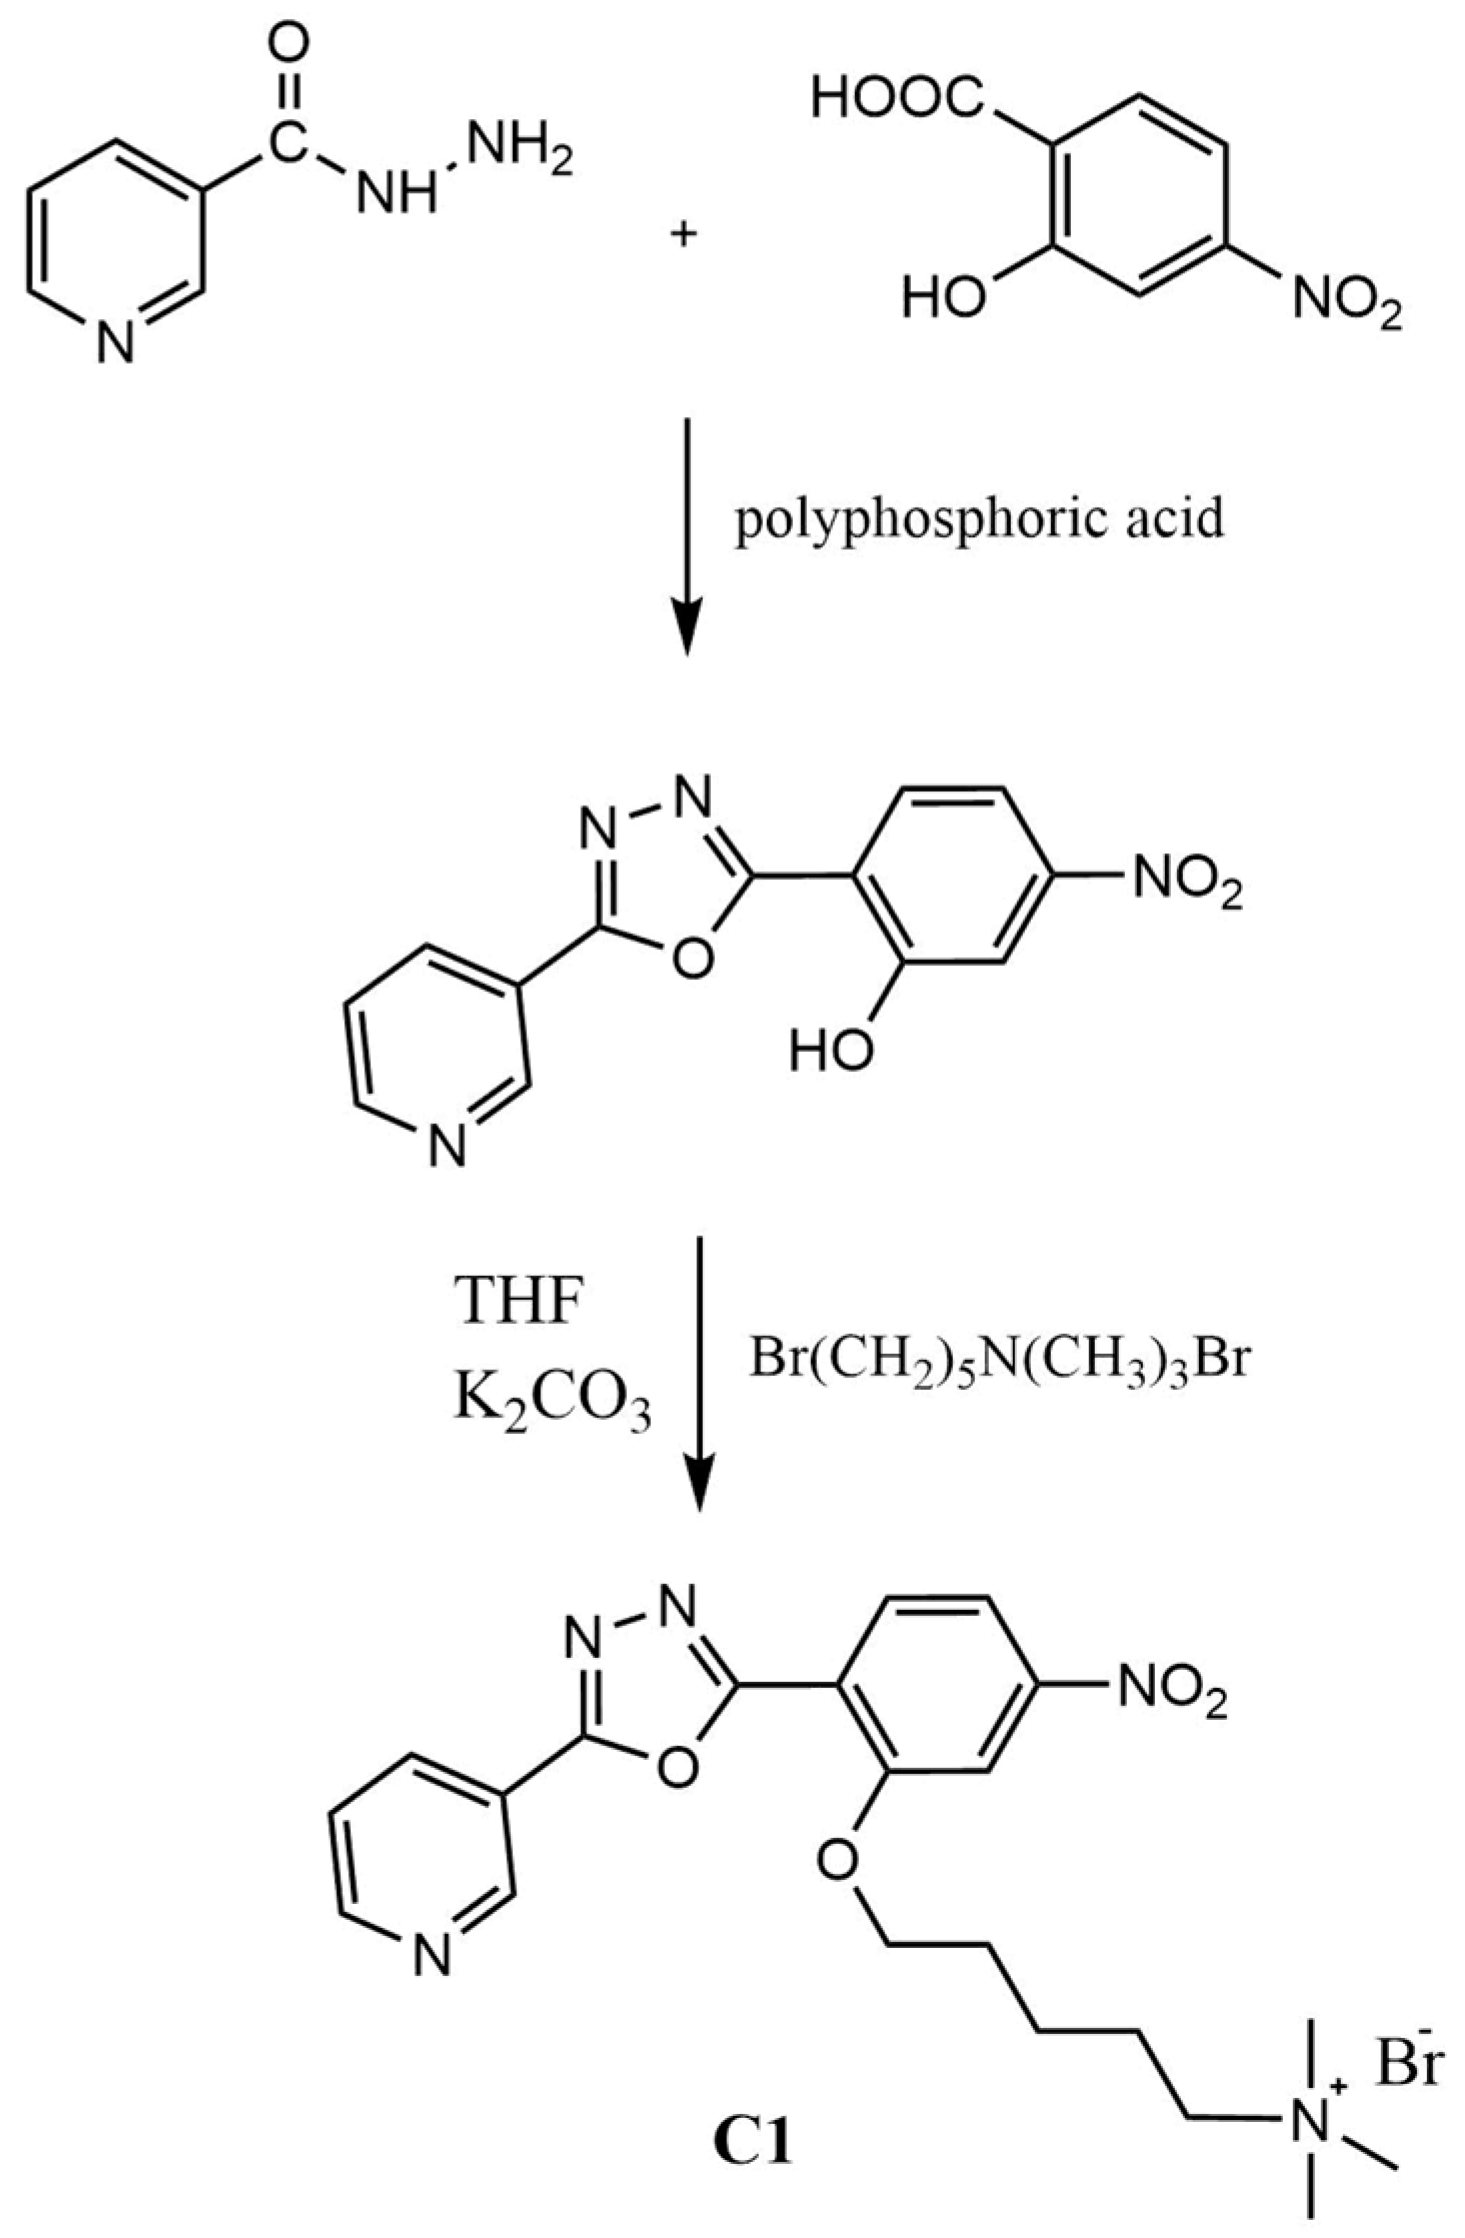
3.1. Synthesis of C1
3.2. Single-Crystal X-ray Analysis
3.3. Molecular Dynamics
Trajectory Analysis
3.4. DFT Calculations
3.5. UV–Vis and Fluorescence pH Titrations and Naked-Eye Detection
3.6. In Vitro Antibacterial Activity Methods
4. Conclusions
Supplementary Materials
Author Contributions
Funding
Institutional Review Board Statement
Informed Consent Statement
Data Availability Statement
Conflicts of Interest
Sample Availability
References
- Li, D.; Dong, Y.; Li, B.; Wu, Y.; Wang, K.; Zhang, S. Colorimetric sensor array with unmodified noble metal nanoparticles for naked-eye detection of proteins and bacteria. Analyst 2015, 140, 7672–7677. [Google Scholar] [CrossRef] [PubMed]
- Di Costanzo, L.; Panunzi, B. Visual pH sensors: From a chemical perspective to new bioen-gineered materials. Molecules 2021, 26, 2952. [Google Scholar] [CrossRef] [PubMed]
- Tan, Y.; Liu, P.; Li, D.; Wang, D.; Tang, B.Z. NIR-II Aggregation-Induced Emission Luminogens for Tumor Phototheranostics. Biosensors 2022, 12, 46. [Google Scholar] [CrossRef] [PubMed]
- Urano, Y.; Asanuma, D.; Hama, Y.; Koyama, Y.; Barrett, T.; Kamiya, M.; Nagano, T.; Watanabe, T.; Hasegawa, A.; Choyke, P.L.; et al. Selective molecular imaging of viable cancer cells with pH-activatable fluorescence probes. Nat. Med. 2009, 15, 104–109. [Google Scholar] [CrossRef] [Green Version]
- Hedde, P.N.; Nienhaus, G.U. Optical imaging of nanoscale cellular structures. Biophys. Rev. 2010, 2, 147–158. [Google Scholar] [CrossRef] [Green Version]
- Diana, R.; Sessa, L.; Concilio, S.; Piotto, S.; Panunzi, B. Luminescent Zn (II)-Based Nanoprobes: A Highly Symmetric Supramolecular Platform for Sensing of Biological Targets and Living Cell Imaging. Front. Mater. 2021, 8, 750247. [Google Scholar] [CrossRef]
- Song, W.; Li, Y.; Geng, L.; Feng, G.; Ren, J.; Yu, X. Polydiacetylene-based gels for solvent discrimination and formation of Au/Ag nanoparticles with embedded photocatalytic performance. Mater. Des. 2021, 205, 109744. [Google Scholar] [CrossRef]
- Caruso, U.; Panunzi, B.; Roviello, A.; Tuzi, A. Fluorescent metallopolymers with Zn(II) in a Schiff base/phenoxide coordination environment. Inorg. Chem. Commun. 2013, 29, 138–140. [Google Scholar] [CrossRef]
- Qiao, M.; Fan, J.; Ding, L.; Fang, Y. Fluorescent Ensemble Sensors and Arrays Based on Surfactant Aggregates Encapsulating Pyrene-Derived Fluorophores for Differentiation Applications. ACS Appl. Mater. Interfaces 2021, 13, 18395–18412. [Google Scholar] [CrossRef] [PubMed]
- Diana, R.; Panunzi, B.; Concilio, S.; Marrafino, F.; Shikler, R.; Caruso, T.; Caruso, U. The effect of bulky substituents on two π-conjugated mesogenic fluorophores. Their organic polymers and zinc-bridged luminescent networks. Polymers 2019, 11, 1379. [Google Scholar] [CrossRef] [Green Version]
- Li, Z.; Askim, J.R.; Suslick, K.S. The Optoelectronic Nose: Colorimetric and Fluorometric Sensor Arrays. Chem. Rev. 2019, 119, 231–292. [Google Scholar] [CrossRef]
- Diana, R.; Panunzi, B.; Shikler, R.; Nabha, S.; Caruso, U. Highly efficient dicyano-phenylenevinylene fluorophore as polymer dopant or zinc-driven self-assembling building block. Inorg. Chem. Commun. 2019, 104, 145–149. [Google Scholar] [CrossRef]
- Dey, N.; Kumari, N.; Bhattacharya, S. FRET-based ‘ratiometric’ molecular switch for multiple ions with efficacy towards real-time sampling and logic gate applications. Tetrahedron 2021, 85, 132007. [Google Scholar] [CrossRef]
- Diana, R.; Panunzi, B.; Shikler, R.; Nabha, S.; Caruso, U. A symmetrical azo-based fluorophore and the derived salen multipurpose framework for emissive layers. Inorg. Chem. Commun. 2019, 104, 186–189. [Google Scholar] [CrossRef]
- Caruso, U.; Diana, R.; Panunzi, B.; Roviello, A.; Tingoli, M.; Tuzi, A. Facile synthesis of new Pd(II) and Cu(II) based metallomesogens from ligands containing thiophene rings. Inorg. Chem. Commun. 2009, 12, 1135–1138. [Google Scholar] [CrossRef]
- Kaur, N.; Kaur, B. Recent development in anthracene possessing chemosensors for cations and anions. Microchem. J. 2020, 158, 105131. [Google Scholar] [CrossRef]
- Panunzi, B.; Borbone, F.; Capobianco, A.; Concilio, S.; Diana, R.; Peluso, A.; Piotto, S.; Tuzi, A.; Velardo, A.; Caruso, U. Synthesis, spectroscopic properties and DFT calculations of a novel multipolar azo dye and its zinc(II) complex. Inorg. Chem. 2017, 84, 103–108. [Google Scholar] [CrossRef]
- Jiang, Y.; Wu, S.; Jin, C.; Wang, B.; Shen, J. Novel diaminomaleonitrile-based fluorescent probe for ratiometric detection and bioimaging of hypochlorite. Sens. Actuators B Chem. 2018, 265, 365–370. [Google Scholar] [CrossRef]
- Panunzi, B.; Diana, R.; Concilio, S.; Sessa, L.; Shikler, R.; Nabha, S.; Tuzi, A.; Caruso, U.; Piotto, S. Solid-state highly efficient dr mono and poly-dicyano-phenylenevinylene fluorophores. Molecules 2018, 23, 1505. [Google Scholar] [CrossRef]
- Borbone, F.; Caruso, U.; Palma, S.D.; Fusco, S.; Nabha, S.; Panunzi, B.; Shikler, R. High solid state photoluminescence quantum yields and effective color tuning in polyvinylpyridine based zinc(II) metallopolymers. Macromol. Chem. Phys. 2015, 216, 1516–1522. [Google Scholar] [CrossRef]
- Shi, C.T.; Huang, Z.Y.; Wu, A.B.; Hu, Y.X.; Wang, N.C.; Zhang, Y.; Shu, W.M.; Yu, W.C. Recent progress in cadmium fluorescent and colorimetric probes. RSC Advances 2021, 11, 29632–29660. [Google Scholar] [CrossRef]
- Aderinto, S.O. Fluorescent, colourimetric, and ratiometric probes based on diverse fluorophore motifs for mercuric(II) ion (Hg2+) sensing: Highlights from 2011 to 2019. Chem. Pap. 2020, 74, 3195–3232. [Google Scholar]
- Wang, Z.G.; Ding, X.J.; Huang, Y.Y.; Yan, X.J.; Ding, B.; Li, Q.Z.; Xie, C.Z.; Xu, J.Y. The development of coumarin Schiff base system applied as highly selective fluorescent/colorimetric probes for Cu2+ and tumor biomarker glutathione detection. Dye. Pigment. 2020, 175, 108156. [Google Scholar] [CrossRef]
- Borbone, F.; Caruso, U.; Causà, M.; Fusco, S.; Panunzi, B.; Roviello, A.; Shikler, R.; Tuzi, A. Series of O,N,O-tridentate ligands zinc(II) complexes with high solid-state photoluminescence quantum yield. Eur. J. Inorg. Chem. 2014, 2014, 2695–2703. [Google Scholar] [CrossRef]
- Hu, T.; Cheng, J.; Li, L.; Zhan, Y.; Li, W.; Chang, Z.; Sun, C. A new Schiff base fluorescent-colorimetric probe containing fluorene-naphthalene structure: Multifunction detection. Inorg. Chim. Acta 2019, 498, 119131. [Google Scholar] [CrossRef]
- Diana, R.; Panunzi, B.; Tuzi, A.; Caruso, U. Two tridentate pyridinyl-hydrazone zinc(II) complexes as fluorophores for blue emitting layers. J. Mol. Struct. 2019, 1197, 672–680. [Google Scholar] [CrossRef]
- Specht, E.A.; Braselmann, E.; Palmer, A.E. A Critical and Comparative Review of Fluorescent Tools for Live-Cell Imaging. In Annual Review of Physiology; Annual Reviews: Palo Alto, CA, USA, 2017; pp. 93–117. [Google Scholar]
- Diana, R.; Panunzi, B.; Tuzi, A.; Piotto, S.; Concilio, S.; Caruso, U. An amphiphilic pyridinoyl-hydrazone probe for colorimetric and fluorescence pH sensing. Molecules 2019, 24, 3816. [Google Scholar] [CrossRef] [Green Version]
- Borbone, F.; Caruso, U.; Diana, R.; Panunzi, B.; Roviello, A.; Tingoli, M.; Tuzi, A. Second order nonlinear optical networks with excellent poling stability from a new trifunctional thiophene based chromophore. Org. Electron. 2009, 10, 53–60. [Google Scholar] [CrossRef]
- Proksch, E. pH in nature, humans and skin. J. Dermatol. 2018, 45, 1044–1052. [Google Scholar] [CrossRef] [PubMed]
- Shi, X.L.; Mao, G.J.; Zhang, X.B.; Liu, H.W.; Gong, Y.J.; Wu, Y.X.; Zhou, L.Y.; Zhang, J.; Tan, W. Rhodamine-based fluorescent probe for direct bio-imaging of lysosomal pH changes. Talanta 2014, 130, 356–362. [Google Scholar] [CrossRef]
- Alfarouk, K.O.; Ahmed, S.B.M.; Elliott, R.L.; Benoit, A.; Alqahtani, S.S.; Ibrahim, M.E.; Bashir, A.H.H.; Alhoufie, S.T.S.; Elhassan, G.O.; Wales, C.C.; et al. The pentose phosphate pathway dynamics in cancer and its dependency on intracellular pH. Metabolites 2020, 10, 285. [Google Scholar] [CrossRef] [PubMed]
- Liu, H.; Sun, Y.; Li, Z.; Yang, R.; Yang, J.; Aryee, A.A.; Zhang, X.; Ge, J.; Qu, L.; Lin, Y. SciFinder-guided rational design of fluorescent carbon dots for ratiometric monitoring intracellular pH fluctuations under heat shock. Chin. Chem. Lett. 2019, 30, 1647–1651. [Google Scholar] [CrossRef]
- Panunzi, B.; Diana, R.; Concilio, S.; Sessa, L.; Tuzi, A.; Piotto, S.; Caruso, U. Fluorescence pH-dependent sensing of Zn(II)by a tripodal ligand. A comparative X-ray and DFT study. J. Lumin. 2019, 212, 200–206. [Google Scholar] [CrossRef]
- Han, J.; Burgess, K. Fluorescent indicators for intracellular pH. Chem. Rev. 2010, 110, 2709–2728. [Google Scholar] [CrossRef]
- Kirkegaard, T.; Jäättelä, M. Lysosomal involvement in cell death and cancer. Biochim. Biophys. Acta-Mol. Cell Res. 2009, 1793, 746–754. [Google Scholar] [CrossRef] [Green Version]
- Sun, X.Y.; Ouyang, J.M. New view in cell death mode: Effect of crystal size in renal epithelial cells. Cell Death Dis. 2015, 6, e2013. [Google Scholar] [CrossRef] [PubMed] [Green Version]
- Repnik, U.; Stoka, V.; Turk, V.; Turk, B. Lysosomes and lysosomal cathepsins in cell death. Biochim. Biophys. Acta–Proteins Proteom. 2012, 1824, 22–33. [Google Scholar] [CrossRef] [PubMed]
- Repnik, U.; Česen, M.H.; Turk, B. The endolysosomal system in cell death and survival. Cold Spring Harb. Perspect. Biol. 2013, 5, a008755. [Google Scholar] [CrossRef] [PubMed] [Green Version]
- Caruso, U.; Panunzi, B.; Diana, R.; Concilio, S.; Sessa, L.; Shikler, R.; Nabha, S.; Tuzi, A.; Piotto, S. AIE/ACQ effects in two DR/NIR emitters: A structural and DFT comparative analysis. Molecules 2018, 23, 1947. [Google Scholar] [CrossRef] [Green Version]
- Bi, X.; Hao, W.; Liu, H.; Chen, X.; Xie, M.; Wang, Y.; Zhao, Y. Water-soluble host-guest fluorescent systems based on fluorophores and cucurbiturils with AIE or ACQ effects. Dye. Pigment. 2021, 189, 109267. [Google Scholar] [CrossRef]
- Borbone, F.; Caruso, U.; Concilio, S.; Nabha, S.; Piotto, S.; Shikler, R.; Tuzi, A.; Panunzi, B. From cadmium(II)-aroylhydrazone complexes to metallopolymers with enhanced photoluminescence. A structural and DFT study. Inorg. Chim. Acta 2017, 458, 129–137. [Google Scholar] [CrossRef]
- Wang, N.; Zhang, J.; Xu, X.-D.; Feng, S. Turn-on fluorescence in a pyridine-decorated tetraphenylethylene: The cooperative effect of coordination-driven rigidification and silver ion induced aggregation. Dalton Trans. 2020, 49, 1883–1890. [Google Scholar] [CrossRef]
- Roviello, A.; Borbone, F.; Carella, A.; Diana, R.; Roviello, G.; Panunzi, B.; Ambrosio, A.; Maddalena, P. High quantum yield photoluminescence of new polyamides containing oligo-PPV amino derivatives and related oligomers. J. Polym. Sci. Part. A Polym. Chem. 2009, 47, 2677–2689. [Google Scholar] [CrossRef]
- Diana, R.; Caruso, U.; Di Costanzo, L.; Bakayoko, G.; Panunzi, B. A novel DR/NIR T-shaped aiegen: Synthesis and x-ray crystal structure study. Crystals 2020, 10, 269. [Google Scholar] [CrossRef] [Green Version]
- Roy, A.; Roy, S. Spontaneous Formation of Vesicles by Self-Assembly of Nicotinyl Amino Acid Amphiphiles: Application as “Turn-On” Fluorescent Sensors for the Selective Detection of Trace-Level Hg(II) in Water. Ind. Eng. Chem. Res. 2016, 55, 10104–10113. [Google Scholar] [CrossRef]
- Albertazzi, L.; Storti, B.; Marchetti, L.; Beltram, F. Delivery and Subcellular Targeting of Dendrimer-Based Fluorescent pH Sensors in Living Cells. J. Am. Chem. Soc. 2010, 132, 18158–18167. [Google Scholar] [CrossRef]
- Ahmed, S.R.; Kim, J.; Tran, V.T.; Suzuki, T.; Neethirajan, S.; Lee, J.; Park, E.Y. In situ self-assembly of gold nanoparticles on hydrophilic and hydrophobic substrates for influenza virus-sensing platform. Sci. Rep. 2017, 7, 44495. [Google Scholar] [CrossRef] [Green Version]
- Faggi, E.; Serra-Vinardell, J.; Pandey, M.D.; Casas, J.; Fabriàs, G.; Luis, S.V.; Alfonso, I. Pseudopeptidic fluorescent on-off pH sensor based on pyrene excimer emission: Imaging of acidic cellular organelles. Sens. Actuators B Chem. 2016, 234, 633–640. [Google Scholar] [CrossRef]
- Yuan, C.; Zhang, Y.; Xi, H.; Tao, X. An acidic pH fluorescent probe based on Tröger’s base. RSC Adv. 2017, 7, 55577–55581. [Google Scholar] [CrossRef] [Green Version]
- Verma, G.; Khan, M.F.; Akhtar, W.; Alam, M.M.; Akhter, M.; Shaquiquzzaman, M. A review exploring therapeutic worth of 1,3,4-Oxadiazole tailored compounds. Mini-Rev. Med. Chem. 2019, 19, 477–509. [Google Scholar] [PubMed]
- Boström, J.; Hogner, A.; Llinàs, A.; Wellner, E.; Plowright, A.T. Oxadiazoles in medicinal chemistry. J. Med. Chem. 2012, 55, 1817–1830. [Google Scholar] [CrossRef] [PubMed]
- Pace, A.; Pierro, P. The new era of 1,2,4-oxadiazoles. Org. Biomol. Chem. 2009, 7, 4337–4348. [Google Scholar] [CrossRef] [PubMed]
- Caruso, U.; Panunzi, B.; Roviello, G.N.; Roviello, G.; Tingoli, M.; Tuzi, A. Synthesis, structure and reactivity of amino-benzodifurane derivatives. Comptes Rendus Chim. 2009, 12, 622–634. [Google Scholar] [CrossRef]
- Kenny, P.W. Prediction of hydrogen bond basicity from computed molecular electrostatic properties: Implications for comparative molecular field analysis. J. Chem. Soc. Perkin Trans. 2 1994, 2, 199–202. [Google Scholar] [CrossRef]
- Kumar, D.; Sundaree, S.; Johnson, E.O.; Shah, K. An efficient synthesis and biological study of novel indolyl-1,3,4-oxadiazoles as potent anticancer agents. Bioorganic Med. Chem. Lett. 2009, 19, 4492–4494. [Google Scholar] [CrossRef] [PubMed]
- Eckhardt, S. Recent progress in the development of anticancer agents. Curr. Med. Chem. Anti-Cancer Agents 2002, 2, 419–439. [Google Scholar] [CrossRef]
- Bala, S.; Kamboj, S.; Kajal, A.; Saini, V.; Prasad, D.N. 1,3,4-Oxadiazole Derivatives: Synthesis, Characterization, Antimicrobial Potential, and Computational Studies. BioMed Res. Int. 2014, 2014, 172791. [Google Scholar] [CrossRef] [PubMed]
- Liu, P.; Xu, L.Q.; Xu, G.; Pranantyo, D.; Neoh, K.-G.; Kang, E.-T. pH-Sensitive Theranostic Nanoparticles for Targeting Bacteria with Fluorescence Imaging and Dual-Modal Antimicrobial Therapy. ACS Appl. Nano Mater. 2018, 1, 6187–6196. [Google Scholar] [CrossRef]
- Shi, C.; Sun, Y.; Zheng, Z.; Zhang, X.; Song, K.; Jia, Z.; Chen, Y.; Yang, M.; Liu, X.; Dong, R.; et al. Antimicrobial activity of syringic acid against Cronobacter sakazakii and its effect on cell membrane. Food Chem. 2016, 197, 100–106. [Google Scholar] [CrossRef] [PubMed]
- Staneva, D.; Vasileva-Tonkova, E.; Grabchev, I. pH sensor potential and antimicrobial activity of a new PPA dendrimer modified with benzanthrone fluorophores in solution and on viscose fabric. J. Photochem. Photobiol. A Chem. 2019, 375, 24–29. [Google Scholar] [CrossRef]
- Kumar, I.S.A. Synthesis and antibacterial activity of 2-(substituted phenyl)-5-(pyridin-4-yl)-1,3,4-oxadiazoles. Chem. Sci. Trans. 2015, 133–136. [Google Scholar]
- Parthiban, P.; Alagarsamy, V.; Jacob, J.; Singh, H.J.; Kumar, S.S.; Bose, S.C. Synthesis, characrerization and antimicrobial screening of 3-(5-substituted phenyl-1,3,4-oxadiazol-2-yl) pyridines. Int. J. Pharm. Sci. Res. 2010, 1, 109–114. [Google Scholar]
- Rania, E.; Parameshwara, R.; Babu, V.H.; Ranganatha, Y.S.; Naveen, B.; Kumar, A. Synthesis and antibacterial screening of some novel N-(3-choro-2-oxo-4-substituted phenyl azetin-1-yl) isonicotinamide and 4-(5-substituted phenyl-1,3,4-oxadiazol-2-yl) pyridine derivatives. Int. J. Pharm. Pharm. Sci. 2012, 4, 424–427. [Google Scholar]
- Bhaskar, V.H.; Francis, P.; Balakrishnan, S.; Jayakar, B. Synthesis and antimicrobial activity of 3-(5-substituted phenyl-1,3,4-oxadiazol-2-yl) pyridines. Indian J. Heterocycl. Chem. 2006, 15, 409–410. [Google Scholar]
- Panunzi, B.; Concilio, S.; Diana, R.; Shikler, R.; Nabha, S.; Piotto, S.; Sessa, L.; Tuzi, A.; Caruso, U. Photophysical Properties of Luminescent Zinc(II)—Pyridinyloxadiazole Complexes and their Glassy Self-Assembly Networks. Eur. J. Inorg. Chem. 2018, 2018, 2709–2716. [Google Scholar] [CrossRef]
- Panunzi, B.; Diana, R.; Caruso, U. A highly efficient white luminescent zinc (II) based metallopolymer by RGB approach. Polymers 2019, 11, 1712. [Google Scholar] [CrossRef] [PubMed] [Green Version]
- Gentile, F.S.; Pannico, M.; Causà, M.; Mensitieri, G.; Di Palma, G.; Scherillo, G.; Musto, P. Metal defects in HKUST-1 MOF revealed by vibrational spectroscopy: A combined quantum mechanical and experimental study. J. Mater. Chem. A 2020, 8, 10796–10812. [Google Scholar] [CrossRef]
- Caruso, U.; Panunzi, B.; Roviello, A.; Tingoli, M.; Tuzi, A. Two aminobenzothiazole derivatives for Pd(II) and Zn(II) coordination: Synthesis, characterization and solid state fluorescence. Inorg. Chem. Commun. 2011, 14, 46–48. [Google Scholar] [CrossRef]
- Diana, R.; Caruso, U.; Tuzi, A.; Panunzi, B. A highly water-soluble fluorescent and colorimetric pH probe. Crystals 2020, 10, 83. [Google Scholar] [CrossRef] [Green Version]
- Sun, X.; Wang, Y.; Lei, Y. Fluorescence based explosive detection: From mechanisms to sensory materials. Chem. Soc. Rev. 2015, 44, 8019–8061. [Google Scholar] [CrossRef] [Green Version]
- Taraba, L.; Křížek, T.; Kozlík, P.; Hodek, O.; Coufal, P. Protonation of polyaniline-coated silica stationary phase affects the retention behavior of neutral hydrophobic solutes in reversed-phase capillary liquid chromatography. J. Sep. Sci. 2018, 41, 2886–2894. [Google Scholar] [CrossRef] [PubMed]
- Hou, S.S.; Fan, N.S.; Tseng, Y.C.; Jan, J.S. Self-Assembly and Hydrogelation of Coil-Sheet Poly(l -lysine)- block-poly(l -threonine) Block Copolypeptides. Macromolecules 2018, 51, 8054–8063. [Google Scholar] [CrossRef]
- Patil, V.S.; Padalkar, V.S.; Tathe, A.B.; Sekar, N. ESIPT-inspired benzothiazole fluorescein: Photophysics of microenvironment pH and viscosity. Dye. Pigment. 2013, 98, 507–517. [Google Scholar] [CrossRef]
- Yushchenko, D.A.; Shvadchak, V.V.; Klymchenko, A.S.; Duportail, G.; Pivovarenko, V.G.; Mély, Y. Modulation of excited-state intramolecular proton transfer by viscosity in protic media. J. Phys. Chem. A 2007, 111, 10435–10438. [Google Scholar] [CrossRef] [PubMed]
- Lu, B.; Yin, J.; Liu, C.; Lin, W. NIR fluorescence imaging of lipid drops viscosity in liver organs of diabetic mice. Dye. Pigment. 2021, 187, 109120. [Google Scholar] [CrossRef]
- Ning, Y.; Wang, X.; Sheng, K.; Yang, L.; Han, W.; Xiao, C.; Li, J.; Zhang, Y.; Wu, S. A novel colorimetric and fluorescence turn-on pH sensor with a notably large Stokes shift for its application. New J. Chem. 2018, 42, 14510–14516. [Google Scholar] [CrossRef]
- Kučerka, N.; Nieh, M.-P.; Katsaras, J. Fluid phase lipid areas and bilayer thicknesses of commonly used phosphatidylcholines as a function of temperature. Biochim. Biophys. Acta (BBA)-Biomembr. 2011, 1808, 2761–2771. [Google Scholar] [CrossRef] [PubMed]
- Concilio, S.; Ferrentino, I.; Sessa, L.; Massa, A.; Iannelli, P.; Diana, R.; Panunzi, B.; Rella, A.; Piotto, S. A novel fluorescent solvatochromic probe for lipid bilayers. Supramol. Chem. 2017, 29, 887–895. [Google Scholar] [CrossRef]
- Warschawski, D.E.; Devaux, P.F. Order parameters of unsaturated phospholipids in membranes and the effect of cholesterol: A 1 H–13 C solid-state NMR study at natural abundance. Eur. Biophys. J. 2005, 34, 987–996. [Google Scholar] [CrossRef]
- Khodov, I.A.; Belov, K.V.; Pogonin, A.E.; Savenkova, M.A.; Gamov, G.A. Spatial structure and conformations of hydrazones derived from pyridoxal 5′-phosphate and 2-, 3-pyridinecarbohydrazide in the light of NMR study and quantum chemical calculations. J. Mol. Liq. 2021, 342, 117372. [Google Scholar] [CrossRef]
- Diana, R.; Caruso, U.; Di Costanzo, L.; Gentile, F.S.; Panunzi, B. Colorimetric recognition of multiple first-row transition metals: A single water-soluble chemosensor in acidic and basic conditions. Dye. Pigment. 2021, 184, 108832. [Google Scholar] [CrossRef]
- Melhuish, W.H. Quantum efficiencies of fluorescence of organic substan ces: Effect of solvent and concentration of the fluorescent solute. J. Phys. Chem. 1961, 65, 229–235. [Google Scholar] [CrossRef]
- Kabsch, W. Integration, scaling, space-group assignment and post-refinement. Acta Crystallogr. Sect. D Biol. Crystallogr. 2010, 66, 133–144. [Google Scholar] [CrossRef] [PubMed] [Green Version]
- Sheldrick, G.M. A short history of SHELX. Acta Crystallogr. Sect. A Found. Crystallogr. 2008, 64, 112–122. [Google Scholar] [CrossRef] [Green Version]
- Sheldrick, G.M. SHELXT-Integrated space-group and crystal-structure determination. Acta Crystallogr. Sect. A Found. Crystallogr. 2015, 71, 3–8. [Google Scholar] [CrossRef] [Green Version]
- Farrugia, L.J. WinGX and ORTEP for Windows: An update. J. Appl. Crystallogr. 2012, 45, 849–854. [Google Scholar] [CrossRef]
- MacRae, C.F.; Sovago, I.; Cottrell, S.J.; Galek, P.T.A.; McCabe, P.; Pidcock, E.; Platings, M.; Shields, G.P.; Stevens, J.S.; Towler, M.; et al. Mercury 4.0: From visualization to analysis, design and prediction. J. Appl. Crystallogr. 2020, 53, 226–235. [Google Scholar] [CrossRef] [Green Version]
- Krieger, E.; Vriend, G. YASARA View—Molecular graphics for all devices—from smartphones to workstations. Bioinformatics 2014, 30, 2981–2982. [Google Scholar] [CrossRef] [Green Version]
- Bochevarov, A.D.; Harder, E.; Hughes, T.F.; Greenwood, J.R.; Braden, D.A.; Philipp, D.M.; Rinaldo, D.; Halls, M.D.; Zhang, J.; Friesner, R.A. Jaguar: A high-performance quantum chemistry software program with strengths in life and materials sciences. Int. J. Quantum Chem. 2013, 113, 2110–2142. [Google Scholar] [CrossRef]
- Grimme, S.; Antony, J.; Ehrlich, S.; Krieg, H. A consistent and accurate ab initio parametrization of density functional dispersion correction (DFT-D) for the 94 elements H-Pu. J. Chem. Phys. 2010, 132, 154104. [Google Scholar] [CrossRef] [Green Version]
- Fetter, A.L.; Walecka, J.D. Quantum Theory of Many-Particle Systems; Courier Corporation: North Chelmsford, MA, USA, 2012. [Google Scholar]
- Marten, B.; Kim, K.; Cortis, C.; Friesner, R.A.; Murphy, R.B.; Ringnalda, M.N.; Sitkoff, D.; Honig, B. New model for calculation of solvation free energies: Correction of self-consistent reaction field continuum dielectric theory for short-range hydrogen-bonding effects. J. Phys. Chem. 1996, 100, 11775–11788. [Google Scholar] [CrossRef]
- Yu, H.S.; Watson, M.A.; Bochevarov, A.D. Weighted Averaging Scheme and Local Atomic Descriptor for p K a Prediction Based on Density Functional Theory. J. Chem. Inf. Model. 2018, 58, 271–286. [Google Scholar] [CrossRef] [PubMed]
- Britton, H.T.S.; Robinson, R.A. Universal buffer solutions and the dissociation constant of veronal. J. Chem. Soc. (Resumed) 1931, 1456–1462. [Google Scholar] [CrossRef]

| Sample | λab (a) | λem (b) | PLQY% (e) | λab (c) | λem (d) | PLQY% (e) |
|---|---|---|---|---|---|---|
| C1 | Water | DMSO | ||||
| pH = 5.0 | 291 | 467 | 3.0 | 292 | 486 | 12.5 |
| pH = 7.0 | 290 | 508 | 0.4 | 292 | 547 | 3.1 |
| POPC (Exp) | POPC | POPC/C1 (pH = 5.0) | POPC/C1 (pH = 7.0) |
|---|---|---|---|
| 39.8 ± 0.8 | 37. 5 ± 0.3 | 37.7 ± 0.2 | 37.5 ± 0.2 |
| POPC (Exp) | POPC | POPC/C1 (pH = 5.0) | POPC/C1 (pH = 7.0) |
|---|---|---|---|
| 68.3 | 70.3 ± 0.5 | 68. 6 ± 0.6 | 69.2 ± 0.4 |
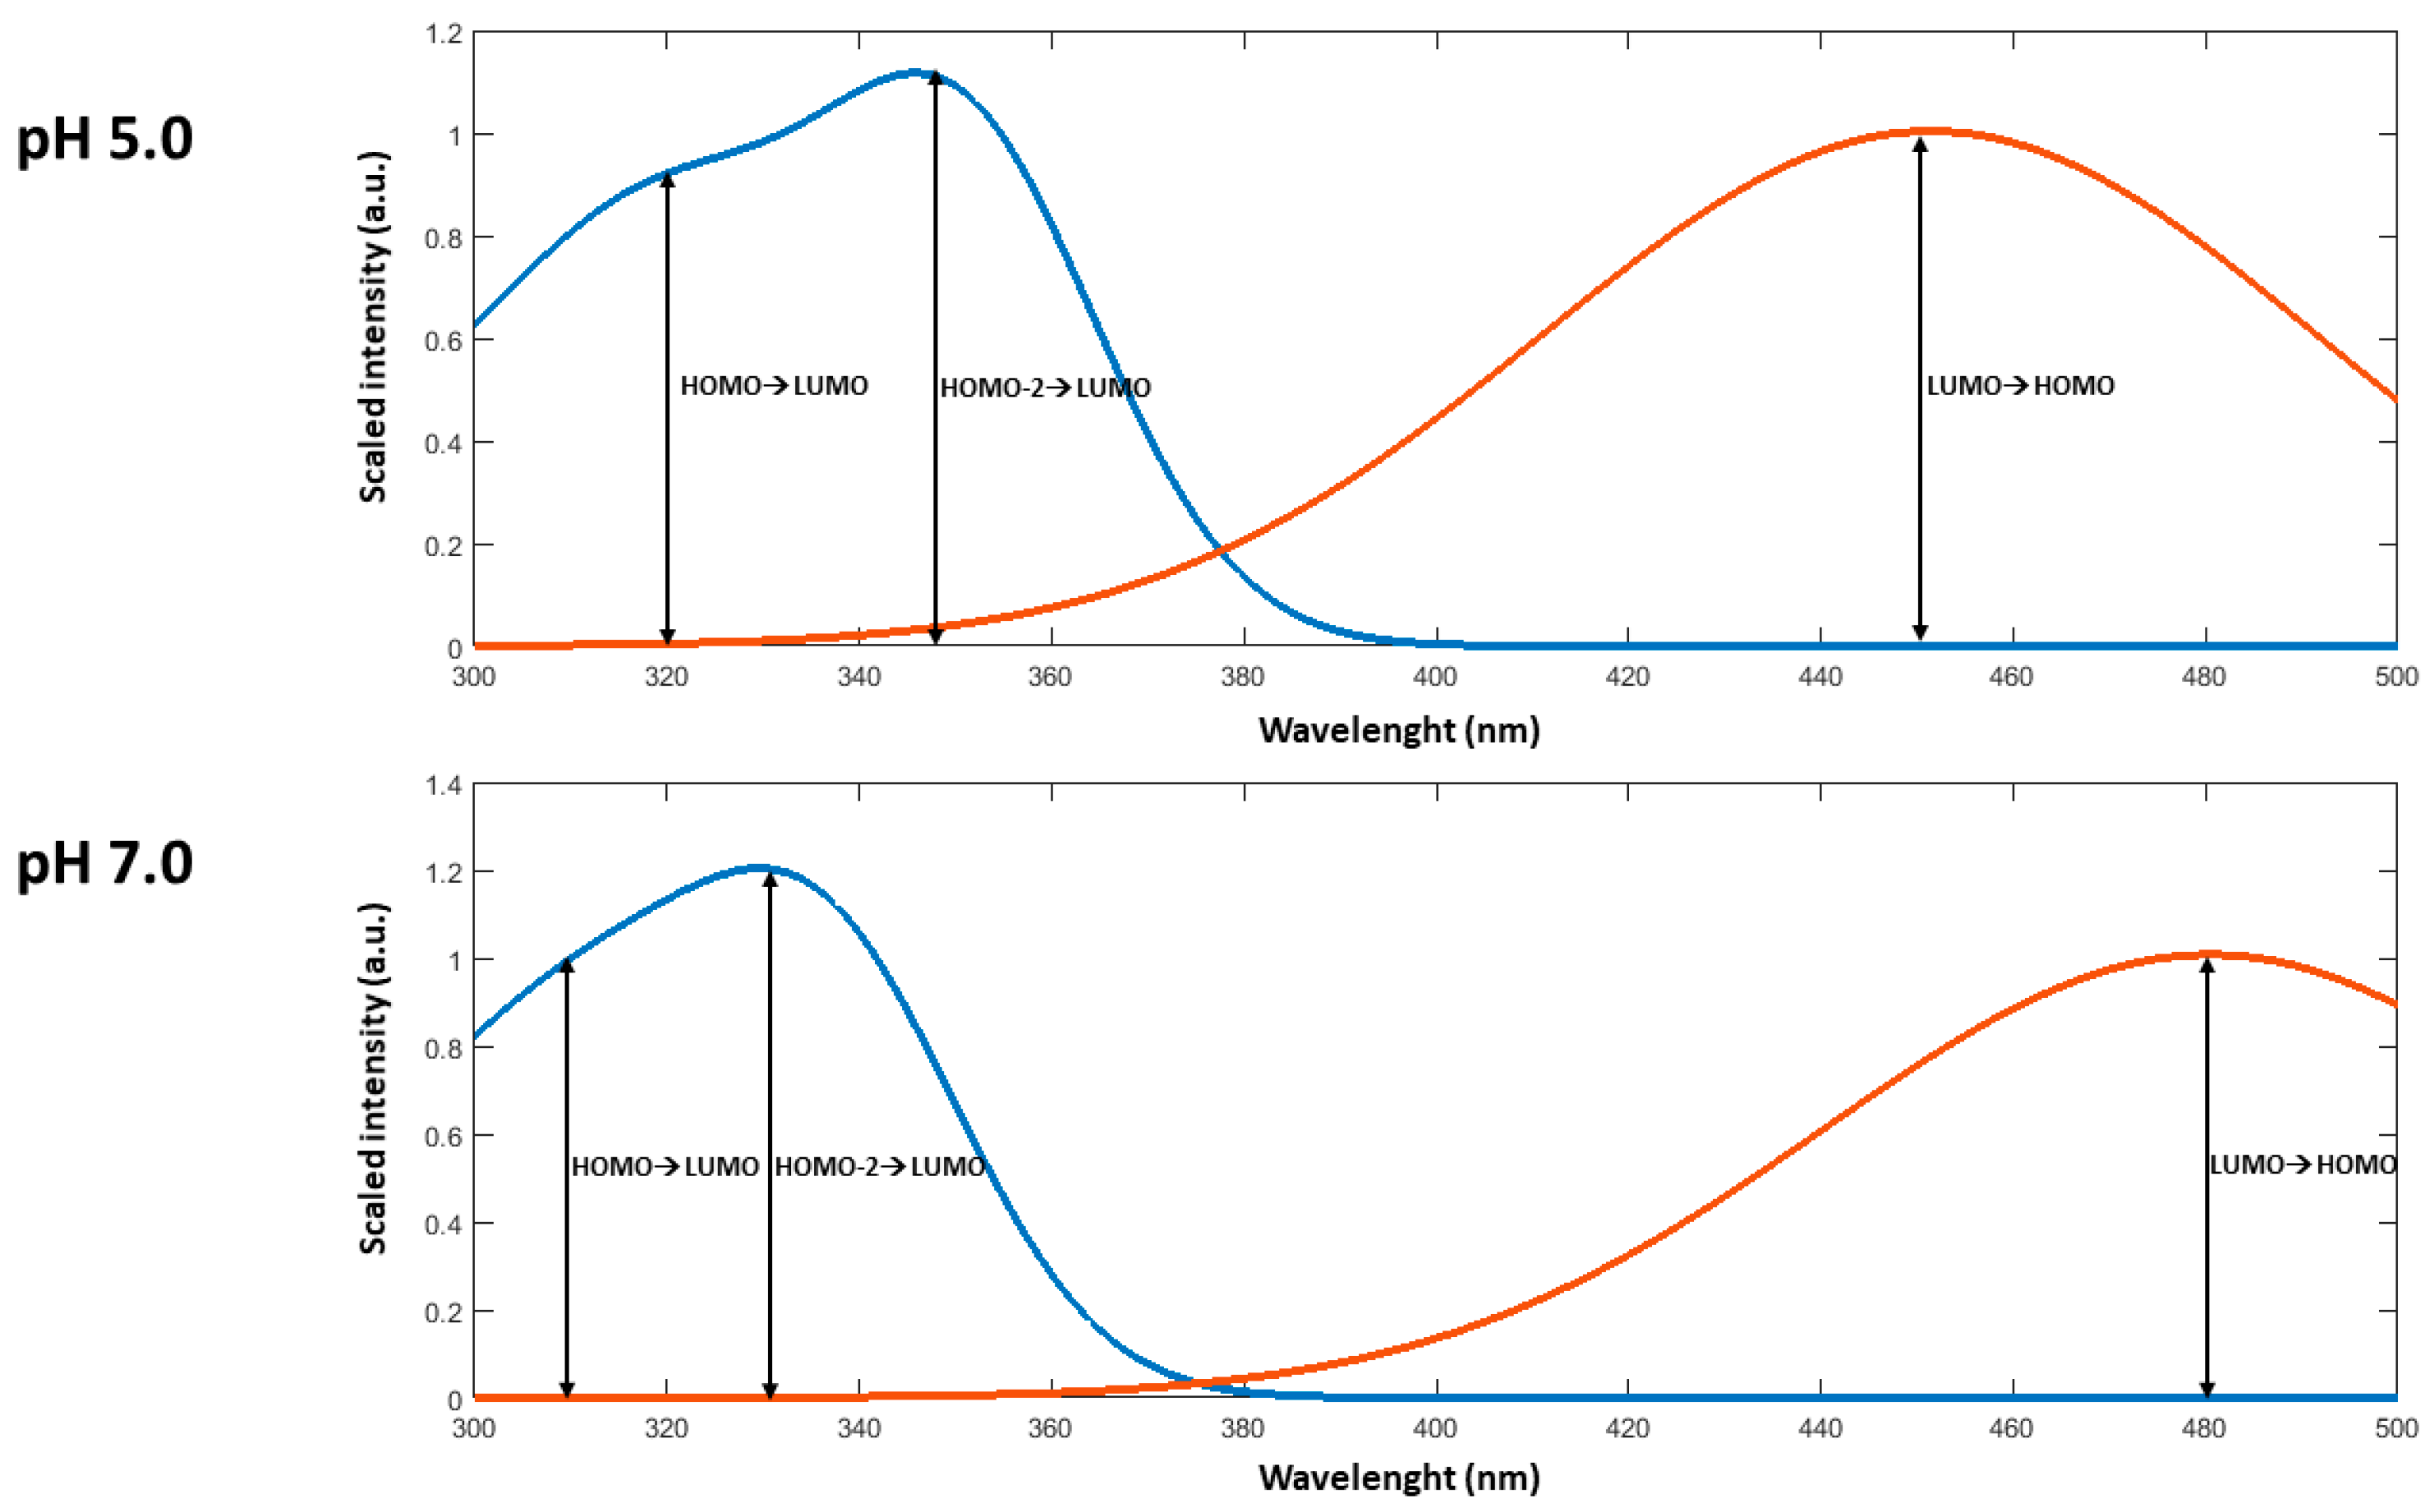
| Sample | λab (a) | λem (b) |
|---|---|---|
| C1 | ||
| pH = 5.0 | 350 (HOMO-2→LUMO) 320 (HOMO→LUMO) | 451 (LUMO→HOMO) |
| pH = 7.0 | 336 (HOMO-2→LUMO) 310 (HOMO→LUMO) | 485 (LUMO→HOMO) |
| C1 | |
|---|---|
| CCDC number | 2067327 |
| Asymmetric unit content | C1•Br•H2O |
| Color | Bright yellow |
| Temperature (K) | 100 |
| Wavelength (Å) | 0.7000 |
| Crystal system | Monoclinic |
| Space group | P 21/c |
| a (Å) | 12.204 (2) |
| b (Å) | 21.977 (4) |
| c (Å) | 9.075 (2) |
| β (°) | 107.19 (3) |
| Theta (°) | 30.2–1.7 |
| R-merge | 0.118 |
| I/s(I) | 11.2 |
| Completeness (%) | 94.3 |
| Multiplicity | 6.5 |
| Mosaicity (°) | 0.26 |
| Volume | 2325 Å3 |
| Z | 1 |
| Calculated density | 1.20 g/cm3 |
| q max (°) | 29.746 |
| Reflections unique | 4081 |
| Data/restraints/parameters | 4081/0/301 |
| R1 indices (I > 2s(I)) | 0.0625 (0.103, all data) |
| wR2 | 0.219 (0.193, all data) |
| F000 | 862 |
| Largest diff. peak and hole | 0.48 and −0.63 e-/Å3 |
| Goodness-of-fit on |F2| | 1.01 |
Publisher’s Note: MDPI stays neutral with regard to jurisdictional claims in published maps and institutional affiliations. |
© 2022 by the authors. Licensee MDPI, Basel, Switzerland. This article is an open access article distributed under the terms and conditions of the Creative Commons Attribution (CC BY) license (https://creativecommons.org/licenses/by/4.0/).
Share and Cite
Diana, R.; Caruso, U.; Di Costanzo, L.; Concilio, S.; Piotto, S.; Sessa, L.; Panunzi, B. A Water Soluble 2-Phenyl-5-(pyridin-3-yl)-1,3,4-oxadiazole Based Probe: Antimicrobial Activity and Colorimetric/Fluorescence pH Response. Molecules 2022, 27, 1824. https://doi.org/10.3390/molecules27061824
Diana R, Caruso U, Di Costanzo L, Concilio S, Piotto S, Sessa L, Panunzi B. A Water Soluble 2-Phenyl-5-(pyridin-3-yl)-1,3,4-oxadiazole Based Probe: Antimicrobial Activity and Colorimetric/Fluorescence pH Response. Molecules. 2022; 27(6):1824. https://doi.org/10.3390/molecules27061824
Chicago/Turabian StyleDiana, Rosita, Ugo Caruso, Luigi Di Costanzo, Simona Concilio, Stefano Piotto, Lucia Sessa, and Barbara Panunzi. 2022. "A Water Soluble 2-Phenyl-5-(pyridin-3-yl)-1,3,4-oxadiazole Based Probe: Antimicrobial Activity and Colorimetric/Fluorescence pH Response" Molecules 27, no. 6: 1824. https://doi.org/10.3390/molecules27061824
APA StyleDiana, R., Caruso, U., Di Costanzo, L., Concilio, S., Piotto, S., Sessa, L., & Panunzi, B. (2022). A Water Soluble 2-Phenyl-5-(pyridin-3-yl)-1,3,4-oxadiazole Based Probe: Antimicrobial Activity and Colorimetric/Fluorescence pH Response. Molecules, 27(6), 1824. https://doi.org/10.3390/molecules27061824