
Analytical Techniques for Phytocannabinoid Profiling of Cannabis and Cannabis-Based Products—A Comprehensive Review

 ,
,  ,
,  , and
, and
Abstract
:1. Introduction
1.1. Botany of C. sativa
1.2. Phytocannabinoids
1.3. Use of C. sativa
1.4. Legal Aspect of C. sativa
1.5. Incentive for Investigating Phytocannabinoids in C. sativa and Cannabis-Based Products
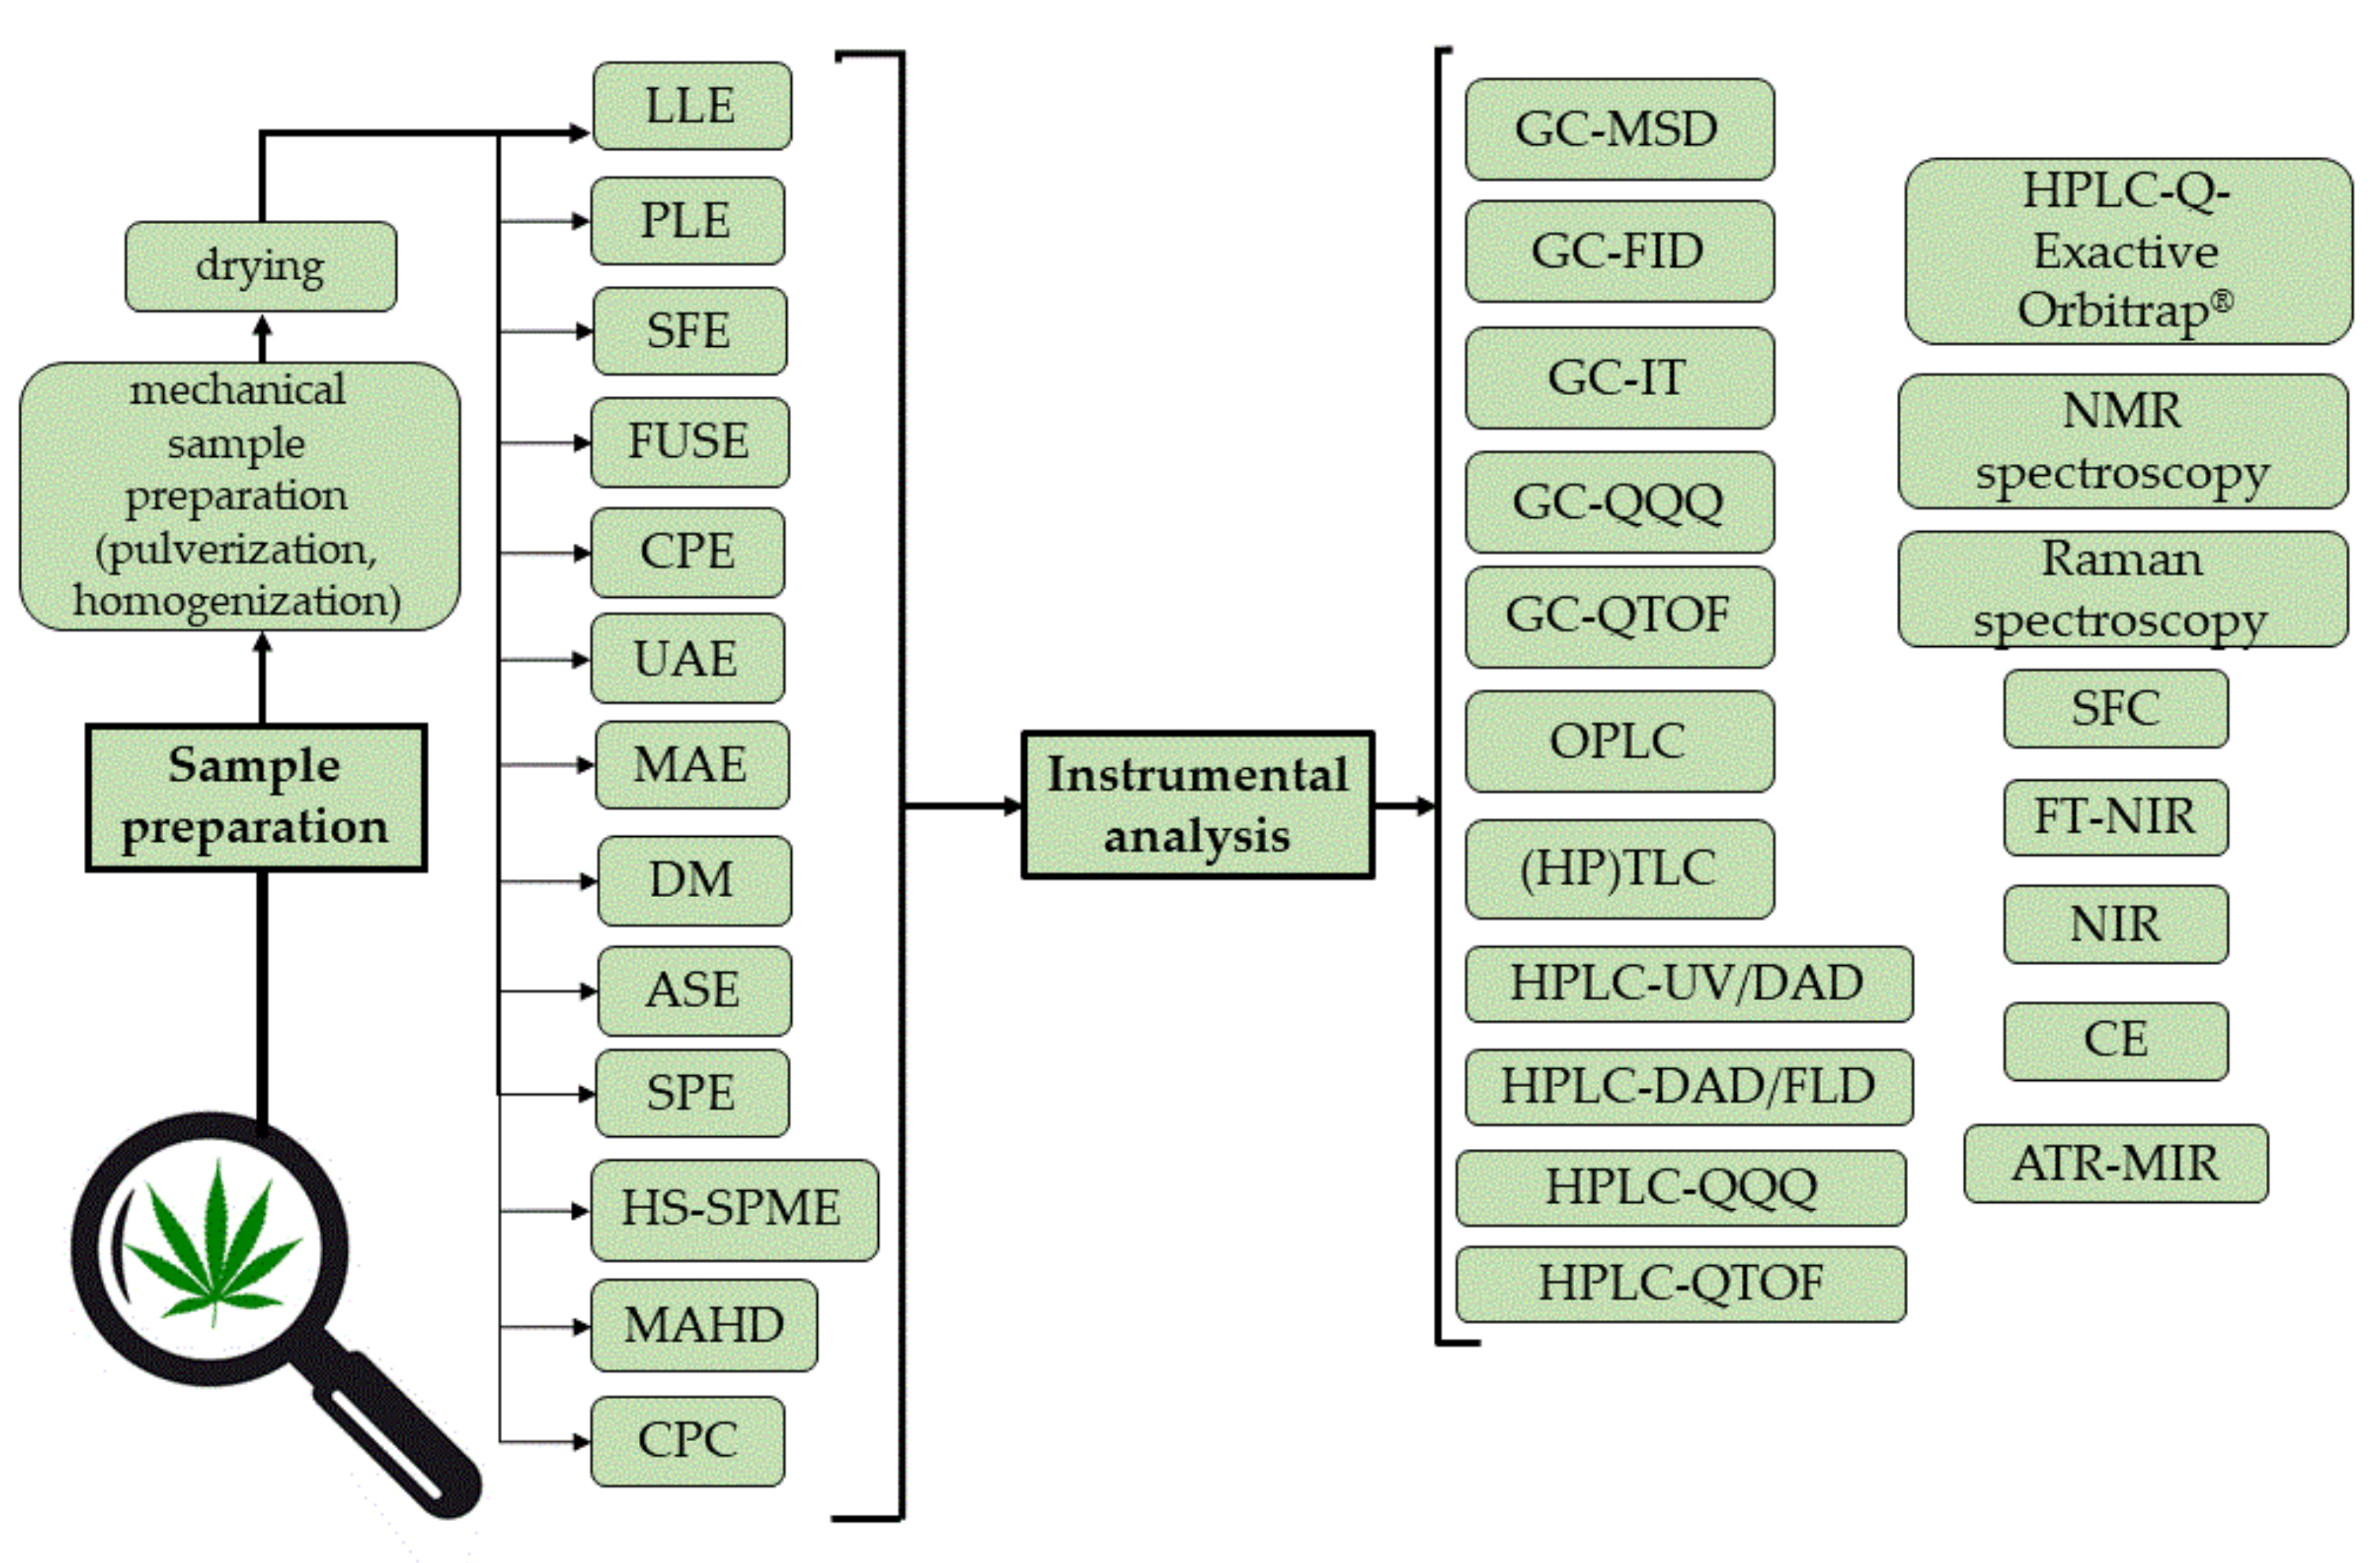
2. Analytical Methods for Phytocannabinoid Profiling
2.1. Sample Preparation Techniques
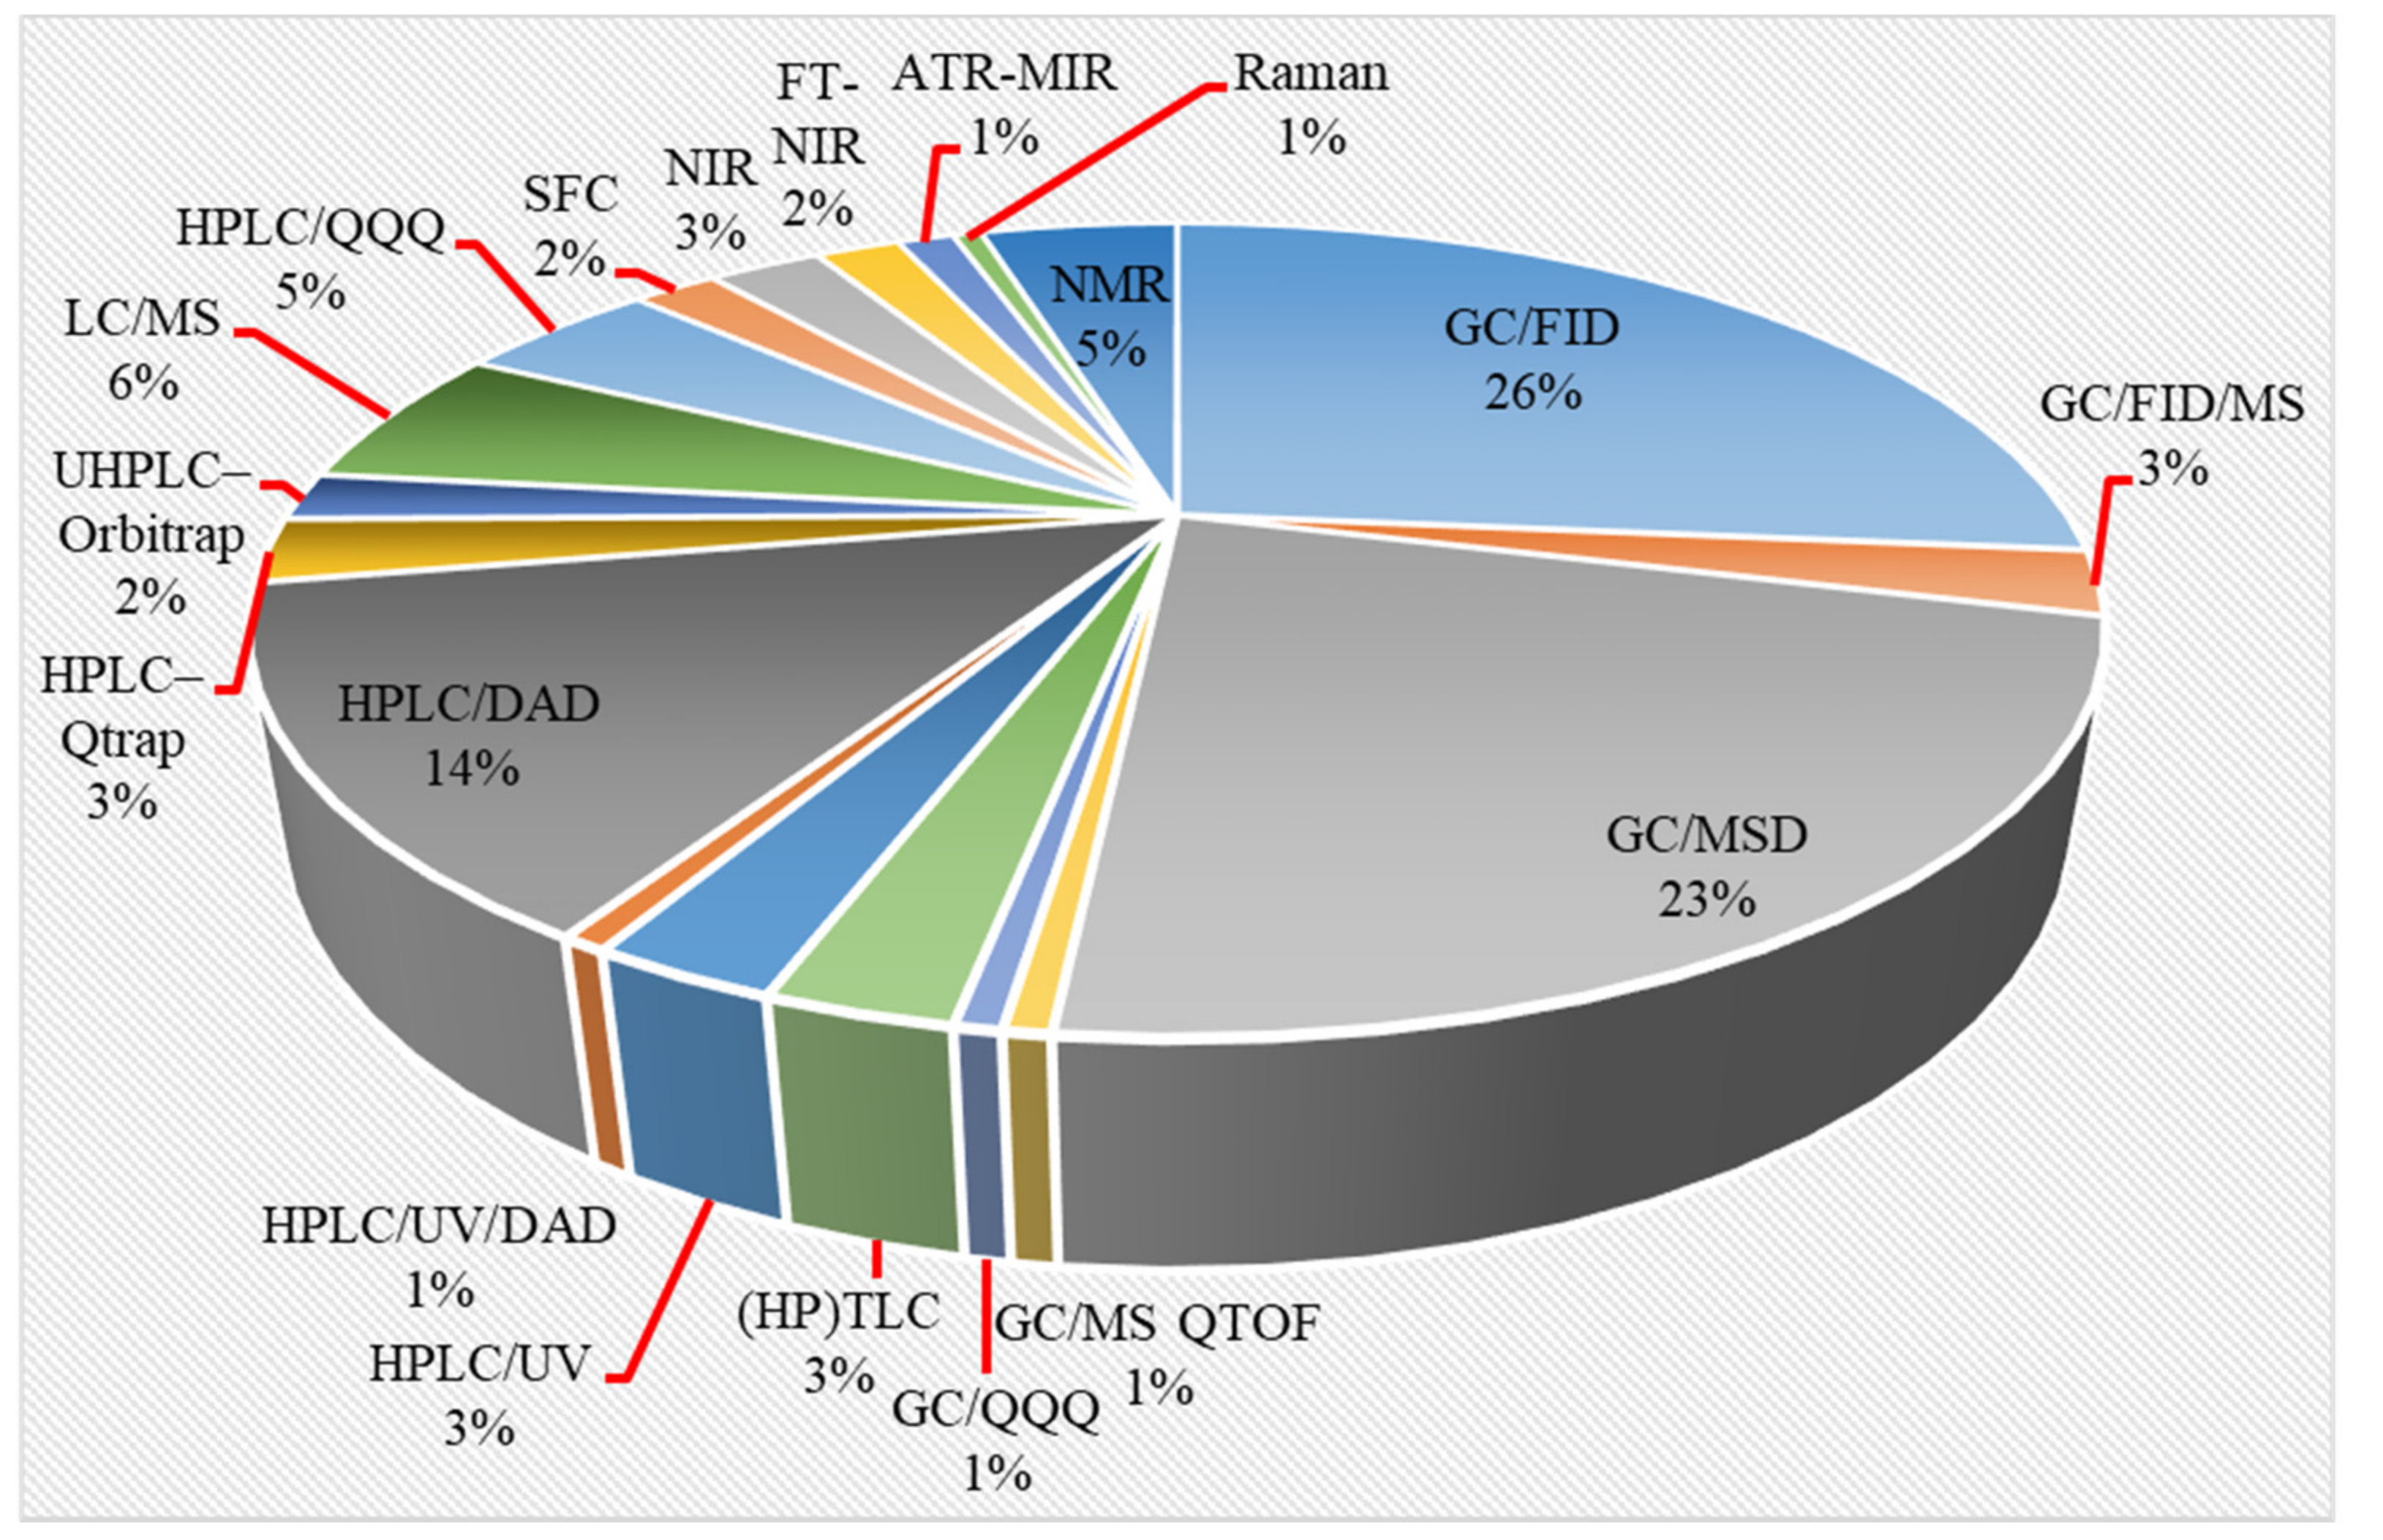
2.2. Instrumental Analysis
2.2.1. GC-Based Methods
- Derivatizationof Phytocannabinoids
- GC Columns
- GC Detectors
2.2.2. LC-Based Methods
- TLC and HPTLC Methods
- HPLC Methods
- HPLC Mobile Phases
- HPLC Columns
- HPLC Detectors
- Matrix Effect
2.2.3. SFC Methods
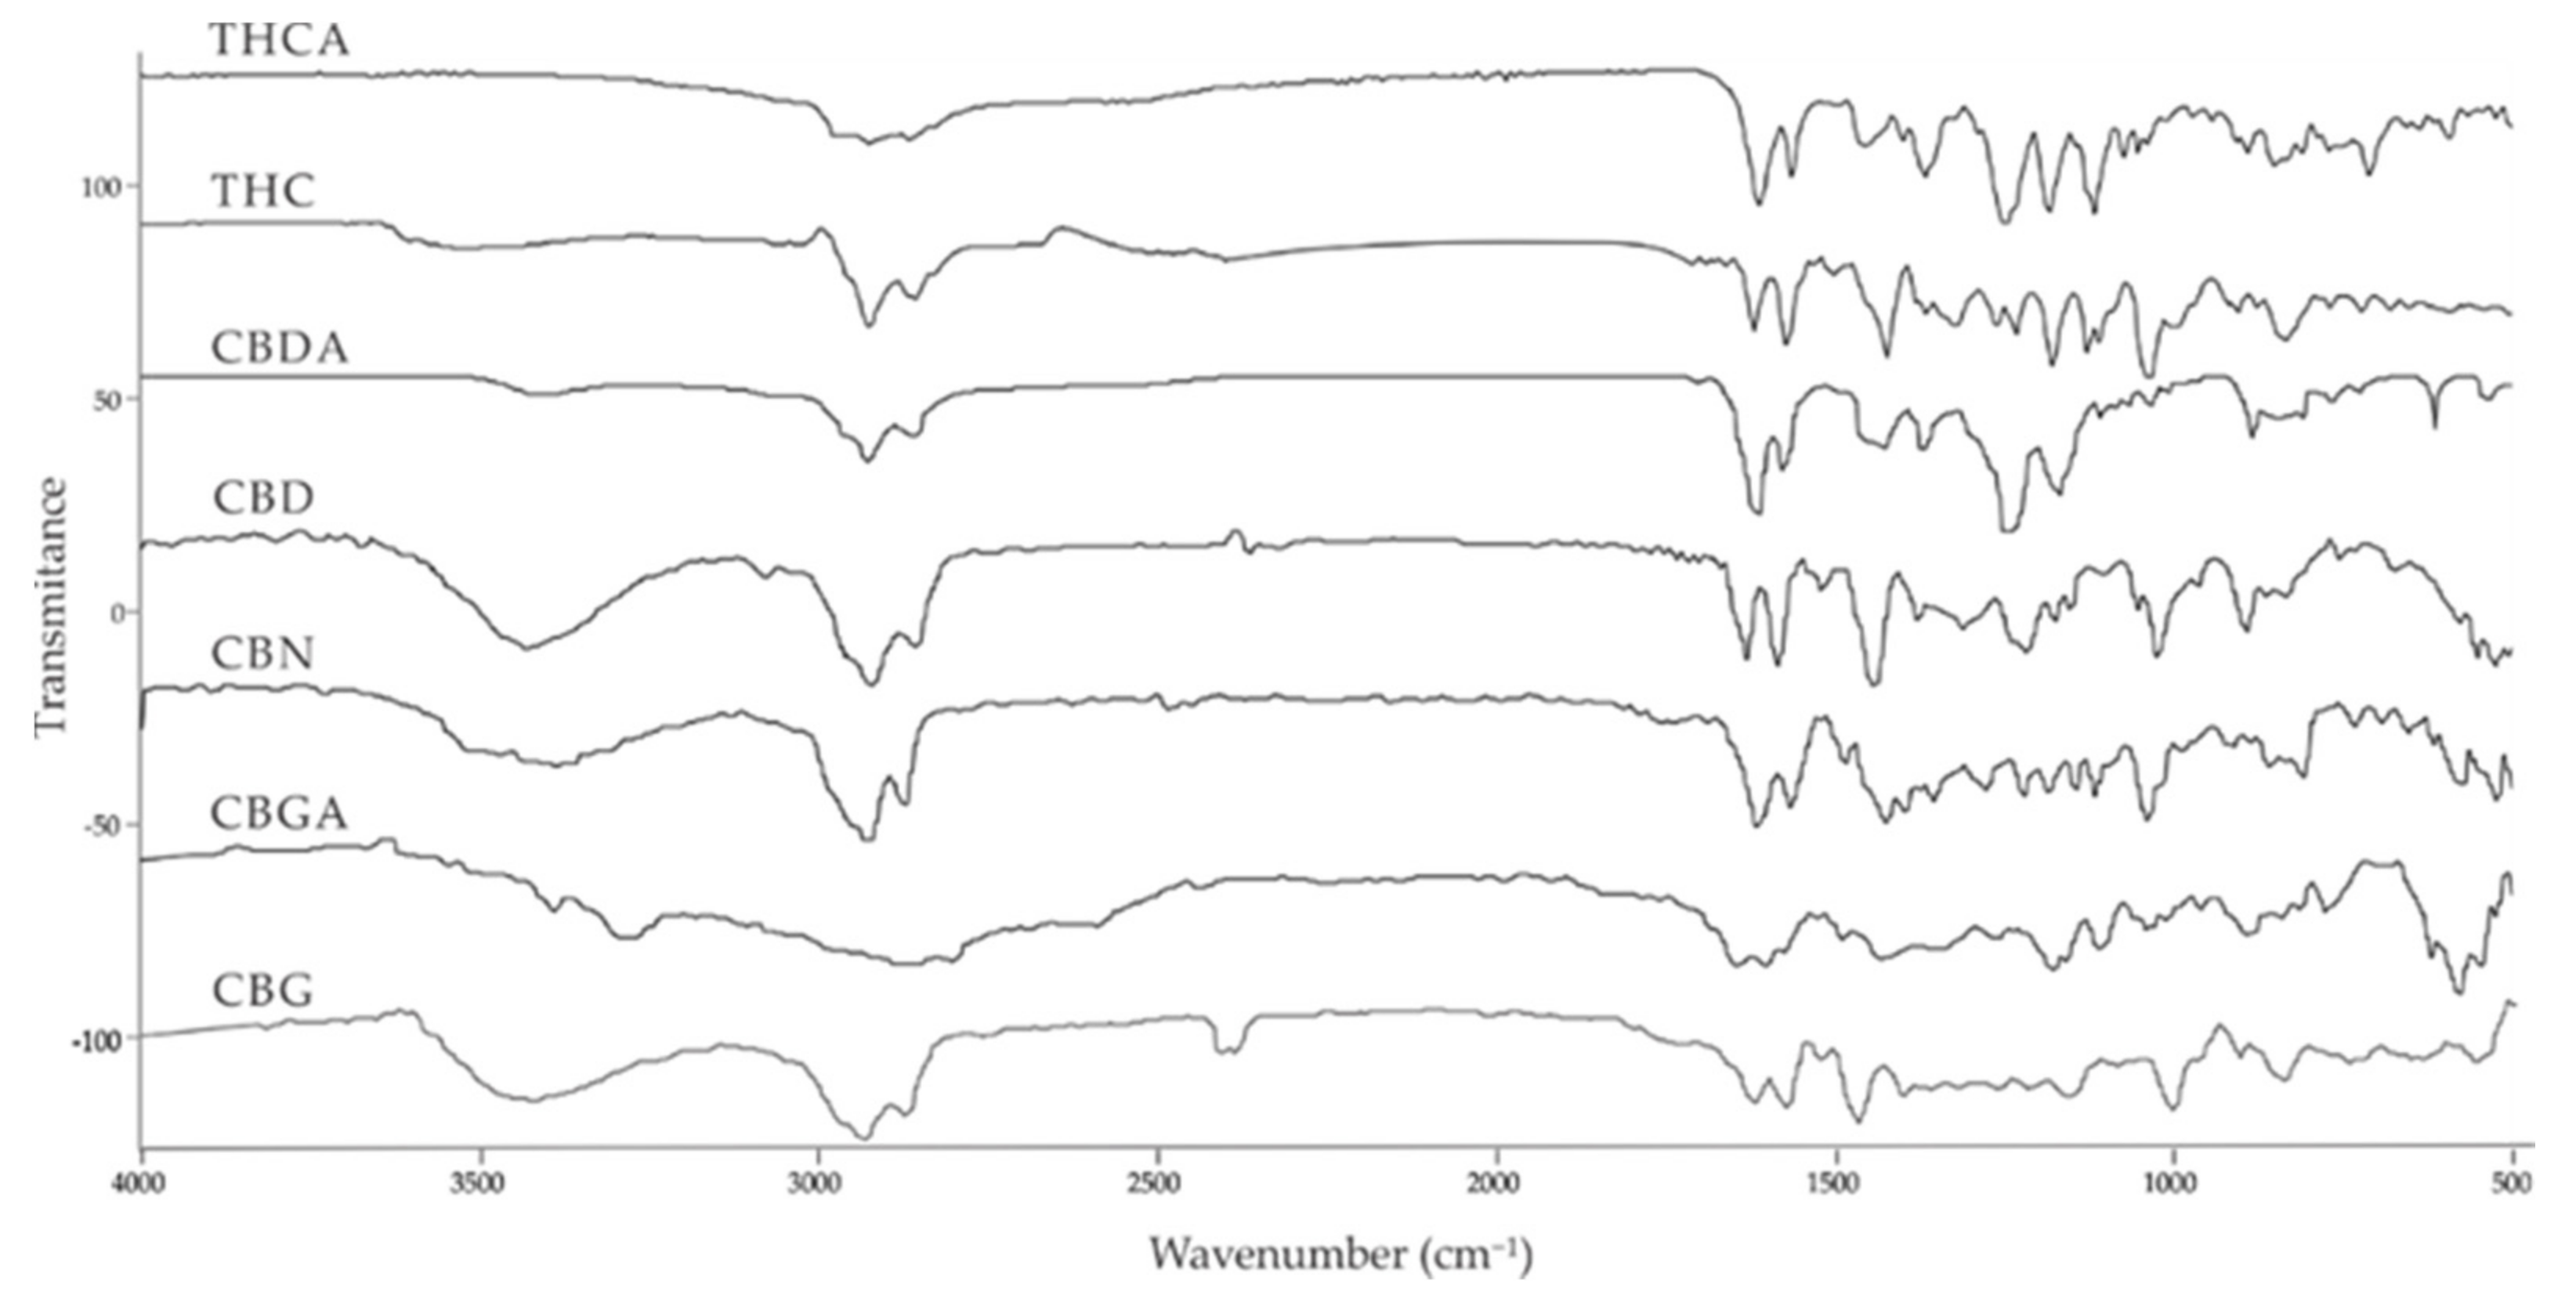
2.2.4. Vibrational Spectroscopy Methods
2.2.5. Other Analytical Techniques
- CE
- NMR Spectroscopy
3. Conclusions and Future Directions
Supplementary Materials
Author Contributions
Funding
Conflicts of Interest
Sample Availability
References
- Citti, C.; Braghiroli, D.; Vandelli, M.A.; Cannazza, G. Pharmaceutical and biomedical analysis of cannabinoids: A critical review. J. Pharm. Biomed. Anal. 2018, 147, 565–579. [Google Scholar] [CrossRef] [PubMed]
- Borille, B.T.; González, M.; Steffens, L.; Ortiz, R.S.; Limberger, R.P. Cannabis sativa: A systematic review of plant analysis. Drug Anal. Res. 2017, 1, 1–23. [Google Scholar] [CrossRef]
- Sawler, J.; Stout, J.M.; Gardner, K.M.; Hudson, D.; Vidmar, J.; Butler, L.; Page, J.E.; Myles, S. The Genetic Structure of Marijuana and Hemp. PLoS ONE 2015, 10, e0133292. [Google Scholar] [CrossRef] [PubMed] [Green Version]
- Ramirez, C.L.; Fanovich, M.A.; Churio, M.S. Cannabinoids: Extraction Methods, Analysis, and Physicochemical Characterization. In Studies in Natural Products Chemistry; Elsevier: Amsterdam, The Netherlands, 2019; pp. 143–173. [Google Scholar] [CrossRef]
- United Nations Office on Drugs and Crime. Recommended Methods for the Identification and Analysis of Cannabis and Cannabis Products Manual for Use by National Drug Analysis Laboratories; United Nations: New York, NY, USA, 2009; Available online: http://search.ebscohost.com/login.aspx?direct=true&scope=site&db=nlebk&db=nlabk&AN=450863 (accessed on 5 July 2020).
- Small, E.; Cronquist, A. A Practical and Natural Taxonomy for Cannabis. Taxon 1976, 25, 405–435. [Google Scholar] [CrossRef]
- Small, E. Evolution and Classification of Cannabis sativa (Marijuana, Hemp) in Relation to Human Utilization. Bot. Rev. 2015, 81, 189–294. [Google Scholar] [CrossRef]
- ElSohly, M.A.; Slade, D. Chemical constituents of marijuana: The complex mixture of natural cannabinoids. Life Sci. 2005, 78, 539–548. [Google Scholar] [CrossRef]
- Mehmedic, Z.; Chandra, S.; Slade, D.; Denham, H.; Foster, S.; Patel, A.S.; Ross, S.A.; Khan, I.A.; ElSohly, M.A. Potency Trends of Δ9-THC and Other Cannabinoids in Confiscated Cannabis Preparations from 1993 to 2008*. J. Forensic Sci. 2010, 55, 1209–1217. [Google Scholar] [CrossRef] [PubMed]
- de Meijer, E.P.M.; Bagatta, M.; Carboni, A.; Crucitiit, P.; Moliterni, C.V.M.; Ranalli, P.; Mandolino, G. The Inheritance of Chemical Phenotype in Cannabis sativa L. Genetics 2003, 163, 335–346. [Google Scholar] [CrossRef] [PubMed]
- Aizpurua-Olaizola, O.; Omar, J.; Navarro, P.; Olivares, M.; Etxebarria, N.; Usobiaga, A. Identification and quantification of cannabinoids in Cannabis sativa L. plants by high performance liquid chromatography-mass spectrometry. Anal. Bioanal. Chem. 2014, 406, 7549–7560. [Google Scholar] [CrossRef]
- Mechoulam, R.; Shvo, Y. The structure of cannabidiol. Tetrahedron 1963, 19, 2073–2078. [Google Scholar] [CrossRef]
- Gaoni, Y.; Mechoulam, R. Isolation, Structure, and Partial Synthesis of an Active Constituent of Hashish. J. Am. Chem. Soc. 1964, 86, 1646–1647. [Google Scholar] [CrossRef]
- Gaoni, Y.; Mechoulam, R. Cannabichromene, a new active principle in hashish. Chem. Commun. 1966, 20–21. [Google Scholar] [CrossRef]
- Vollner, L.; Bieniek, D.; Korte, F. Cannabidivarin, ein neur Haschisch-Inhalsstoff. Tetrahedron Lett. 1969, 10, 145–147. [Google Scholar] [CrossRef]
- Gill, E.W.; Paton, W.D.M.; Pertwee, R.G. Preliminary Experiments on the Chemistry and Pharmacology of Cannabis. Nature 1970, 228, 134–136. [Google Scholar] [CrossRef]
- Tipparat, P.; Kunkaew, W.; Julsrigival, S.; Pinmanee, S.; Natakankitkul, S. Classification of Cannabis Plants Grown in Northern Thailand using physico-chemical properties. J. Nat. Sci. Res. 2014, 10, 46–54. [Google Scholar]
- Hazekamp, A.; Peltenburg, A.; Verpoorte, R.; Giroud, C. Chromatographic and Spectroscopic Data of Cannabinoids from Cannabis sativa L. J. Liq. Chromatogr. Relat. Technol. 2005, 28, 2361–2382. [Google Scholar] [CrossRef]
- Berman, P.; Futoran, K.; Lewitus, G.M.; Mukha, D.; Benami, M.; Shlomi, T.; Meiri, D. A new ESI-LC/MS approach for comprehensive metabolic profiling of phytocannabinoids in Cannabis. Sci. Rep. 2018, 8, 14280. [Google Scholar] [CrossRef] [Green Version]
- Choi, Y.H.; Hazekamp, A.; Peltenburg-Looman, A.M.G.; Frédérich, M.; Erkelens, C.; Lefeber, A.W.M.; Verpoorte, R. NMR assignments of the major cannabinoids and cannabiflavonoids isolated from flowers of Cannabis sativa. Phytochem. Anal. 2004, 15, 345–354. [Google Scholar] [CrossRef]
- Geskovski, N.; Stefkov, G.; Gigopulu, O.; Stefov, S.; Huck, C.W.; Makreski, P. Mid-infrared spectroscopy as process analytical technology tool for estimation of THC and CBD content in Cannabis flowers and extracts. Spectrochim. Acta Part A Mol. Biomol. Spectrosc. 2021, 251, 119422. [Google Scholar] [CrossRef]
- Gigopulu, O.; Geskovski, N.; Stefkov, G.; Stoilkovska, V.; Spirevska, I.S.; Huck, C.W.; Makreski, P. Synergistic use of FTIR spectroscopy and TG to elucidate the solid state THCA decarboxylation reaction kinetics in THCA standard and cannabis flower. Anal. Chem. 2022, 267, 18. [Google Scholar]
- Russo, E.B. History of Cannabis and Its Preparations in Saga, Science, and Sobriquet. Chem. Biodivers. 2007, 4, 1614–1648. [Google Scholar] [CrossRef]
- Pertwee, R.G. Handbook of Cannabis. In Oxford Scholarship; Oxford University Press: London, UK, 2014. [Google Scholar]
- Leonard, W.; Zhang, P.; Ying, D.; Fang, Z. Hempseed in food industry: Nutritional value, health benefits, and industrial applications. Compr. Rev. Food Sci. Food Saf. 2020, 19, 282–308. [Google Scholar] [CrossRef] [Green Version]
- Geshtakovska, G.; Stefkov, G. Routes of cannabis administration: A brief review. In Modern Pharmacist-Bridging Science with Practice; Macedonian Pharmaceutical Bulletin; Macedonian Pharmaceutical Association: Ohrid, Macedonia, 2016; pp. 515–516. [Google Scholar]
- Muscarà, C.; Smeriglio, A.; Trombetta, D.; Mandalari, G.; la Camera, E.; Grassi, G.; Circosta, C. Phytochemical characterization and biological properties of two standardized extracts from a non-psychotropic Cannabis sativa L. cannabidiol (CBD)-chemotype. Phytother. Res. 2021, 35, 5269–5281. [Google Scholar] [CrossRef]
- Klein, R.F.X. Analysis of “Marijuana Edibles”—Food Products Containing Marijuana or Marijuana Extracts—An Overview, Review, and Literature Survey. Microgram J. 2017, 14, 24. [Google Scholar]
- Johnson, R. Hemp as an Agricultural Commodity; Congressional Research Service: Washington, DC, USA, 2018. [Google Scholar]
- European Commission. Common Catalogue of Varieties of Agricultural Plant Species. In Official Journal of the European Union; European Commission: Brussels, Belgium, 2012; p. 39. [Google Scholar]
- European Commission. Commission Regulation (EC) No. 327/2002. In Official Journal of the European Communities; European Commission: Brussels, Belgium, 2002. [Google Scholar]
- Vereinte Nationen, Büro für Drogenkontrolle und Verbrechensbekämpfung. World Drug Report; Vereinte Nationen: New York, NY, USA, 2018. [Google Scholar]
- Upton, R.; Craker, L.; ElSohly, M.; Romm, A.; Russo, E.; Sexton, M. American Herbal Pharmacopoeia, Cannabis Inflorescence: Cannabis spp.; Standards of Identity, Analysis, and Quality Control; American Herbal Pharmacopoeia: Scotts Valley, CA, USA, 2013. [Google Scholar]
- Swissmedic Swiss Agency for Therapeutic Products Pharmacopoeia Division. Fleur de Cannabis. In Pharmacopoeia Helvetica, 11th ed.; Supplement 11.3; Swissmedic Swiss Agency for Therapeutic Products Pharmacopoeia Division: Bern, Switzerland, 2019. [Google Scholar]
- Council of Europe. Cannabis flos Monograph N°: 3028. In European Pharmacopoeia, 10th ed.; Council of Europe: Strasbourg, France, 2020. [Google Scholar]
- Geschäftsstelle der Arzneibuch-Kommissionen. Bundesinstitut fur Arzneimittel und Miedizinprodukte, Monografie Cannabisblüten. In German Pharmacopoeia, 2020th ed.; Geschäftsstelle der Arzneibuch-Kommissionen: Bundesinstitut fur Arzneimittel und Miedizinprodukte: Bonn, German, 2020. [Google Scholar]
- Fernandez, E.B.; Peterseil, V.; Hackl, G.; Menges, S.; de Meijer, E.; Staginnus, C. Distribution of Chemical Phenotypes (Chemotypes) in European Agricultural Hemp (Cannabis sativa L.) Cultivars. J. Forensic Sci. 2020, 65, 715–721. [Google Scholar] [CrossRef]
- Geschäftsstelle der Arzneibuch-Kommissionen. Bundesinstitut fur Arzneimittel und Miedizinprodukte, Monografie Cannabis extractum normatum (Eingestellter Cannabis-Extrakt). In German Pharmacopoeia; Geschäftsstelle der Arzneibuch-Kommissionen, Bundesinstitut fur Arzneimittel und Miedizinprodukte: Bern, Switzerland, 2020. [Google Scholar]
- Nahar, L.; Guo, M.; Sarker, S.D. Gas chromatographic analysis of naturally occurring cannabinoids: A review of literature published during the past decade. Phytochem. Anal. 2020, 31, 135–146. [Google Scholar] [CrossRef]
- Brighenti, V.; Pellati, F.; Steinbach, M.; Maran, D.; Benvenuti, S. Development of a new extraction technique and HPLC method for the analysis of non-psychoactive cannabinoids in fibre-type Cannabis sativa L. (hemp). J. Pharm. Biomed. Anal. 2017, 143, 228–236. [Google Scholar] [CrossRef]
- Naviglio, D.; Scarano, P.; Ciaravolo, M.; Gallo, M. Rapid Solid-Liquid Dynamic Extraction (RSLDE): A Powerful and Greener Alternative to the Latest Solid-Liquid Extraction Techniques. Foods 2019, 8, 245. [Google Scholar] [CrossRef] [Green Version]
- Knezevic, F.; Nikolai, A.; Marchart, R.; Sosa, S.; Tubaro, A.; Novak, J. Residues of herbal hemp leaf teas—How much of the cannabinoids remain? Food Control. 2021, 127, 108146. [Google Scholar] [CrossRef]
- Omar, J.; Olivares, M.; Alzaga, M.; Etxebarria, N. Optimisation and characterisation of marihuana extracts obtained by supercritical fluid extraction and focused ultrasound extraction and retention time locking GC-MS: Gas Chromatography. J. Sep. Sci. 2013, 36, 1397–1404. [Google Scholar] [CrossRef] [PubMed]
- Fairbairn, J.W.; Liebmann, J.A. The extraction and estimation of the cannabinoids in Cannabis sativa L. and its products. J. Pharm. Pharmacol. 1973, 25, 150–155. [Google Scholar] [CrossRef] [PubMed]
- Lewis, R.; Ward, S.; Johnson, R.; Burns, D.T. Distribution of the principal cannabinoids within bars of compressed cannabis resin. Anal. Chim. Acta. 2005, 538, 399–405. [Google Scholar] [CrossRef]
- UNODC. Bulletin on Narcotics; Issue 1—005, Office on Drugs and Crime: Vienna, Austria, 1971. [Google Scholar]
- Mechtler, K.; Bailer, J.; de Hueber, K. Variations of ∆9-THC Content in Single Plants of Hemp Varieties. Ind. Crops Prod. 2004, 19, 19–24. [Google Scholar] [CrossRef]
- Niesink, R.J.M.; Rigter, S.; Koeter, M.W.; Brunt, T.M. Potency trends of Δ9-tetrahydrocannabinol, cannabidiol and cannabinol in cannabis in the Netherlands: 2005-15: Potency trends of Dutch cannabis. Addiction 2015, 110, 1941–1950. [Google Scholar] [CrossRef]
- Tsumura, Y.; Aoki, R.; Tokieda, Y.; Akutsu, M.; Kawase, Y.; Kataoka, T.; Takagi, T.; Mizuno, T.; Fukada, M.; Fujii, H.; et al. A survey of the potency of Japanese illicit cannabis in fiscal year 2010. Forensic Sci. Int. 2012, 221, 77–83. [Google Scholar] [CrossRef]
- Jin, D.; Dai, K.; Xie, Z.; Chen, J. Secondary Metabolites Profiled in Cannabis Inflorescences, Leaves, Stem Barks, and Roots for Medicinal Purposes. Sci. Rep. 2020, 10, 3309. [Google Scholar] [CrossRef]
- Fischedick, J.T.; Hazekamp, A.; Erkelens, T.; Choi, Y.H.; Verpoorte, R. Metabolic fingerprinting of Cannabis sativa L., cannabinoids and terpenoids for chemotaxonomic and drug standardization purposes. Phytochemistry 2010, 71, 2058–2073. [Google Scholar] [CrossRef]
- Hillig, K.W.; Mahlberg, P.G. A chemotaxonomic analysis of cannabinoid variation in Cannabis (Cannabaceae). Am. J. Bot. 2004, 91, 966–975. [Google Scholar] [CrossRef] [Green Version]
- Hazekamp, A.; Tejkalová, K.; Papadimitriou, S. Cannabis: From Cultivar to Chemovar II—A Metabolomics Approach to Cannabis Classification. Cannabis Cannabinoid Res. 2016, 1, 202–215. [Google Scholar] [CrossRef]
- Bruci, Z.; Papoutsis, I.; Athanaselis, S.; Nikolaou, P.; Pazari, E.; Spiliopoulou, C.; Vyshka, G. First systematic evaluation of the potency of Cannabis sativa plants grown in Albania. Forensic Sci. Int. 2012, 222, 40–46. [Google Scholar] [CrossRef]
- Béres, T.; Černochová, L.; Zeljković, S.Ć.; Benická, S.; Gucký, T.; Berčák, M.; Tarkowski, P. Intralaboratory comparison of analytical methods for quantification of major phytocannabinoids. Anal. Bioanal. Chem. 2019, 411, 3069–3079. [Google Scholar] [CrossRef]
- Gröger, T.; Schäffer, M.; Pütz, M.; Ahrens, B.; Drew, K.; Eschner, M.; Zimmermann, R. Application of two-dimensional gas chromatography combined with pixel-based chemometric processing for the chemical profiling of illicit drug samples. J. Chromatogr. A 2008, 1200, 8–16. [Google Scholar] [CrossRef]
- Janatová, A.; Fraňková, A.; Tlustoš, P.; Hamouz, K.; Božik, M.; Klouček, P. Yield and cannabinoids contents in different cannabis (Cannabis sativa L.) genotypes for medical use. Ind. Crops Prod. 2018, 112, 363–367. [Google Scholar] [CrossRef]
- Field, B.I.; Arndt, R.R. Cannabinoid compounds in South African Cannabis sativa L. J. Pharm. Pharmacol. 1980, 32, 21–24. [Google Scholar] [CrossRef] [PubMed]
- Ilias, Y.; Rudaz, S.; Mathieu, P.; Christen, P.; Veuthey, J.-L. Extraction and analysis of different Cannabis samples by headspace solid-phase microextraction combined with gas chromatography-mass spectrometry. J. Sep. Sci. 2005, 28, 2293–2300. [Google Scholar] [CrossRef] [PubMed]
- Pavlovic, R.; Nenna, G.; Calvi, L.; Panseri, S.; Borgonovo, G.; Giupponi, L.; Cannazza, G.; Giorgi, A. Quality Traits of “Cannabidiol Oils”: Cannabinoids Content, Terpene Fingerprint and Oxidation Stability of European Commercially Available Preparations. Molecules 2018, 23, 1230. [Google Scholar] [CrossRef] [Green Version]
- Giupponi, L.; Leoni, V.; Pavlovic, R.; Giorgi, A. Influence of Altitude on Phytochemical Composition of Hemp Inflorescence: A Metabolomic Approach. Molecules 2020, 25, 1381. [Google Scholar] [CrossRef] [Green Version]
- Pavlovic, R.; Panseri, S.; Giupponi, L.; Leoni, V.; Citti, C.; Cattaneo, C.; Cavaletto, M.; Giorgi, A. Phytochemical and Ecological Analysis of Two Varieties of Hemp (Cannabis sativa L.) Grown in a Mountain Environment of Italian Alps. Front. Plant Sci. 2019, 10, 1265. [Google Scholar] [CrossRef]
- Calvi, L.; Pentimalli, D.; Panseri, S.; Giupponi, L.; Gelmini, F.; Beretta, G.; Vitali, D.; Bruno, M.; Zilio, E.; Pavlovic, R.; et al. Comprehensive quality evaluation of medical Cannabis sativa L. inflorescence and macerated oils based on HS-SPME coupled to GC–MS and LC-HRMS (q-exactive orbitrap®) approach. J. Pharm. Biomed. Anal. 2018, 150, 208–219. [Google Scholar] [CrossRef]
- Pisciottano, I.D.M.; Guadagnuolo, G.; Soprano, V.; Esposito, M.; Gallo, P. A survey of Δ9-THC and relevant cannabinoids in products from the Italian market: A study by LC–MS/MS of food, beverages and feed. Food Chem. 2021, 346, 128898. [Google Scholar] [CrossRef]
- Reyes-Garcés, N.; Myers, C. Analysis of the California list of pesticides, mycotoxins, and cannabinoids in chocolate using liquid chromatography and low-pressure gas chromatography-based platforms. J. Sep. Sci. 2021, 44, 2564–2576. [Google Scholar] [CrossRef]
- Namdar, D.; Mazuz, M.; Ion, A.; Koltai, H. Variation in the compositions of cannabinoid and terpenoids in Cannabis sativa derived from inflorescence position along the stem and extraction methods. Ind. Crops Prod. 2018, 113, 376–382. [Google Scholar] [CrossRef]
- Stambouli, H.; Bouri, A.E.; Bellimam, M.A.; Bouayoun, T.; Karni, N.E. Cultivation of Cannabis sativa L. in northern Morocco. Bull. Narc. 2005, 57, 79–118. [Google Scholar] [PubMed]
- Zaripov, E.A.; Lee, T.; Dou, Y.; Harris, C.S.; Egorov, A.; Berezovski, M.V. Single-Run Separation and Quantification of 14 Cannabinoids Using Capillary Electrophoresis. Separations 2021, 8, 30. [Google Scholar] [CrossRef]
- Kalinová, J.P.; Vrchotová, N.; Tříska, J.; Hellerová, Š. Industrial hemp (Cannabis sativa L.) as a possible source of cannabidiol. J. Cent. Eur. Agric. 2021, 22, 110–118. [Google Scholar] [CrossRef]
- European Commission. Union method for the quantitative determination of the Δ9-tetrahydrocannabinol content in hemp varieties. Delegated regulation (EU) No 639/2014, Annex III as amended by Regulation (EU) 2017/1155. In Official Journal of the European Communities; 2017; Volume 167, pp. 1–15. Available online: http://data.europa.eu/eli/reg_del/2017/1155/oj (accessed on 8 February 2021).
- Hewavitharana, A.K.; Golding, G.; Tempany, G.; King, G.; Holling, N. Quantitative GC-MS Analysis of Δ9-Tetrahydrocannabinol in Fiber Hemp Varieties. J. Anal. Toxicol. 2005, 29, 258–261. [Google Scholar] [CrossRef] [Green Version]
- Chandra, S.; Lata, H.; Mehmedic, Z.; Khan, I.; ElSohly, M. Assessment of Cannabinoids Content in Micropropagated Plants of Cannabis sativa and Their Comparison with Conventionally Propagated Plants and Mother Plant during Developmental Stages of Growth. Planta Med. 2010, 76, 743–750. [Google Scholar] [CrossRef] [Green Version]
- Delta9-THC determination by the EU official method: Evaluation of Measurement Uncertainty and Compliance Assessment of Hemp Samples|SpringerLink, (n.d.). Available online: https://link.springer.com/article/10.1007/s00216-021-03283-x (accessed on 18 July 2021).
- Florian-Ramirez, N.M.; Parada-Alfonso, F.; Garzon-Mendez, W.F. Estudio del contenido de cannabinoids en muestras de marihuana (Cannabis sativa L.) cultivadas en varies regiones de Colombia, Vitae. Rev. De La Faculdad De Quim. Farm. 2009, 16, 237–244. [Google Scholar]
- Pacifico, D.; Miselli, F.; Micheler, M.; Carboni, A.; Ranalli, P.; Mandolino, G. Genetics and Marker-assisted Selection of the Chemotype in Cannabis sativa L. Mol. Breed. 2006, 17, 257–268. [Google Scholar] [CrossRef]
- Pacifico, D.; Miselli, F.; Carboni, A.; Moschella, A.; Mandolino, G. Time course of cannabinoid accumulation and chemotype development during the growth of Cannabis sativa L. Euphytica 2008, 160, 231–240. [Google Scholar] [CrossRef]
- Turner, J.C.; Hemphill, J.K.; Mahlberg, P.G. Gland distribution and cannabinoid content in clones of Cannabis sativa L. Am. J. Bot. 1977, 64, 687–693. [Google Scholar] [CrossRef]
- Delgado-Povedano, M.M.; Callado, C.S.; Priego-Capote, F.; Ferreiro-Vera, C. Untargeted characterization of extracts from Cannabis sativa L. cultivars by gas and liquid chromatography coupled to mass spectrometry in high resolution mode. Talanta 2020, 208, 120384. [Google Scholar] [CrossRef]
- Tipparat, P.; Natakankitkul, S.; Chamnivikaipong, P.; Chutiwat, S. Characteristics of cannabinoids composition of Cannabis plants grown in Northern Thailand and its forensic application. Forensic Sci. Int. 2012, 215, 164–170. [Google Scholar] [CrossRef]
- Nuapia, Y.; Maraba, K.; Tutu, H.; Chimuka, L.; Cukrowska, E. In Situ Decarboxylation-Pressurized Hot Water Extraction for Selective Extraction of Cannabinoids from Cannabis sativa. Chemometric Approach. Molecules 2021, 26, 3343. [Google Scholar] [CrossRef] [PubMed]
- Cadola, L.; Broséus, J.; Esseiva, P. Chemical profiling of different hashish seizures by gas chromatography–mass spectrometry and statistical methodology: A case report. Forensic Sci. Int. 2013, 232, e24–e27. [Google Scholar] [CrossRef] [PubMed]
- Zamengo, L.; Frison, G.; Bettin, C.; Sciarrone, R. Variability of cannabis potency in the Venice area (Italy): A survey over the period 2010–2012: Variability of cannabis potency in the Venice area (Italy): A survey over the period 2010–2012. Drug Test. Anal. 2014, 6, 46–51. [Google Scholar] [CrossRef] [PubMed]
- de Backer, B.; Debrus, B.; Lebrun, P.; Theunis, L.; Dubois, N.; Decock, L.; Verstraete, A.; Hubert, P.; Charlier, C. Innovative development and validation of an HPLC/DAD method for the qualitative and quantitative determination of major cannabinoids in cannabis plant material. J. Chromatogr. B 2009, 877, 4115–4124. [Google Scholar] [CrossRef] [PubMed]
- Cardenia, V.; Toschi, T.G.; Scappini, S.; Rubino, R.C.; Rodriguez-Estrada, M.T. Development and validation of a Fast gas chromatography/mass spectrometry method for the determination of cannabinoids in Cannabis sativa L. J. Food Drug Anal. 2018, 26, 1283–1292. [Google Scholar] [CrossRef]
- Kaa, E. Cannabis plants illicitly grown in Jutland (Denmark). Z. Rechtsmed. 1989, 102, 367–375. [Google Scholar] [CrossRef]
- de CássiaMariotti, K.; Marcelo, M.C.A.; Ortiz, R.S.; Borille, B.T.; Reis, M.d.; Fett, M.S.; Ferrão, M.F.; Limberger, R.P. Seized cannabis seeds cultivated in greenhouse: A chemical study by gas chromatography–mass spectrometry and chemometric analysis. Sci. Justice 2016, 56, 35–41. [Google Scholar] [CrossRef]
- Hazekamp, A.; Simons, R.; Peltenburg-Looman, A.; Sengers, M.; van Zweden, R.; Verpoorte, R. Preparative Isolation of Cannabinoids from Cannabis sativa by Centrifugal Partition Chromatography. J. Liq. Chromatogr. Relat. Technol. 2004, 27, 2421–2439. [Google Scholar] [CrossRef]
- Fodor, B.; Boldizsár, I.; Molnár-Perl, I. Alkylsilyl speciation and direct sample preparation of plant cannabinoids prior to their analysis by GC-MS. Anal. Chim. Acta 2018, 1021, 51–59. [Google Scholar] [CrossRef] [PubMed]
- Jang, E.; Kim, H.; Jang, S.; Lee, J.; Baeck, S.; In, S.; Kim, E.; Kim, Y.; Han, E. Concentrations of THC, CBD, and CBN in commercial hemp seeds and hempseed oil sold in Korea | Elsevier Enhanced Reader. Forensic Sci. Int. 2020, 306, 110064. [Google Scholar] [CrossRef]
- Ciolino, L.A.; Ranieri, T.L.; Taylor, A.M. Commercial cannabis consumer products part 1: GC–MS qualitative analysis of cannabis cannabinoids. Forensic Sci. Int. 2018, 289, 429–437. [Google Scholar] [CrossRef]
- Yotoriyama, M.; Ishiharajima, E.; Kato, Y.; Nagato, A.; Sekita, S.; Watanabe, K.; Yamamoto, I. Identification and Determination of Cannabinoids in both Commercially Available and Cannabis Oils Stored Long Term. J. Health Sci. 2005, 51, 483–487. [Google Scholar] [CrossRef] [Green Version]
- Scheunemann, A.; Elsner, K.; Germerott, T.; Hess, C.; Zörntlein, S.; Röhrich, J. Extensive phytocannabinoid profiles of seized cannabis and cannabis-based medicines—Identification of potential distinguishing markers. Forensic Sci. Int. 2021, 322, 110773. [Google Scholar] [CrossRef] [PubMed]
- Pitts, J.E.; O’Neil, P.J.; Leggo, K.P. Variation in the THC Content of Illicitly Imported Cannabis* Products-1984–1989. J. Pharm. Pharmacol. 1990, 42, 817–820. [Google Scholar] [CrossRef] [PubMed]
- Casiraghi, A.; Roda, G.; Casagni, E.; Cristina, C.; Musazzi, U.; Franzè, S.; Rocco, P.; Giuliani, C.; Fico, G.; Minghetti, P.; et al. Extraction Method and Analysis of Cannabinoids in Cannabis Olive Oil Preparations. Planta Med. 2018, 84, 242–249. [Google Scholar] [CrossRef] [Green Version]
- Wianowska, D.; Dawidowicz, A.L.; Kowalczyk, M. Transformations of Tetrahydrocannabinol, tetrahydrocannabinolic acid and cannabinol during their extraction from Cannabis sativa L. J. Anal. Chem. 2015, 70, 920–925. [Google Scholar] [CrossRef]
- Trofin, I.G.; Vlad, C.C.; Noja, V.V.; Dabija, G. Identification and characterization of special types of herbal Cannabis. UPB Sci. Bull. 2012, 74, 13. [Google Scholar]
- Mölleken, H.; Husmann, H. Cannabinoids in seed extracts of Cannabis sativa cultivars. J. Int. Hemp Assoc. 1997, 4, 76–79. Available online: http://www.druglibrary.org/olsen/hemp/IHA/jiha4201.html (accessed on 5 July 2020).
- Gambaro, V.; Dell’Acqua, L.; Farè, F.; Froldi, R.; Saligari, E.; Tassoni, G. Determination of primary active constituents in Cannabis preparations by high-resolution gas chromatography/flame ionization detection and high-performance liquid chromatography/UV detection. Anal. Chim. Acta 2002, 468, 245–254. [Google Scholar] [CrossRef]
- Lachenmeier, D.W.; Kroener, L.; Musshoff, F.; Madea, B. Determination of cannabinoids in hemp food products by use of headspace solid-phase microextraction and gas chromatography-mass spectrometry. Anal. Bioanal. Chem. 2004, 378, 183–189. [Google Scholar] [CrossRef] [PubMed]
- Galettis, P.; Williams, M.; Gordon, R.; Martin, J.H. A Simple Isocratic HPLC Method for the Quantitation of 17 Cannabinoids. Aust. J. Chem. 2021, 74, 453. [Google Scholar] [CrossRef]
- de Oliveira, G.L.; Voloch, M.H.; Sztulman, G.B.; Neto, O.N.; Yonamine, M. Cannabinoid contents in cannabis products seized in São Paulo, Brazil, 2006–2007. Forensic Toxicol. 2008, 26, 31–35. [Google Scholar] [CrossRef]
- Potter, D.J.; Hammond, K.; Tuffnell, S.; Walker, C.; di Forti, M. Potency of Δ9-tetrahydrocannabinol and other cannabinoids in cannabis in England in 2016: Implications for public health and pharmacology. Drug Test. Anal. 2018, 10, 628–635. [Google Scholar] [CrossRef] [PubMed] [Green Version]
- Hazekamp, A.; Fischedick, J.T. Cannabis—From cultivar to chemovar: Towards a better definition of Cannabis potency. Drug Test. Anal. 2012, 4, 660–667. [Google Scholar] [CrossRef] [PubMed]
- Potter, D.J.; Clark, P.; Brown, M.B. Potency of Δ9–THC and Other Cannabinoids in Cannabis in England in 2005: Implications for Psychoactivity and Pharmacology. J. Forensic Sci. 2008, 53, 90–94. [Google Scholar] [CrossRef] [Green Version]
- Knight, G.; Hansen, S.; Connor, M.; Poulsen, H.; McGovern, C.; Stacey, J. The results of an experimental indoor hydroponic Cannabis growing study, using the ‘Screen of Green’ (ScrOG) method—Yield, tetrahydrocannabinol (THC) and DNA analysis. Forensic Sci. Int. 2010, 202, 36–44. [Google Scholar] [CrossRef]
- de Meijer, E.P.M.; Hammond, K.M.; Sutton, A. The inheritance of chemical phenotype in Cannabis sativa L. (IV): Cannabinoid-free plants. Euphytica 2009, 168, 95–112. [Google Scholar] [CrossRef] [Green Version]
- Florian-Ramirez, N.M.; Garzon-Mendez, W.F.; Parada-Alfonso, F. Gas Chromatography in Forensic Chemistry: Cannabinoids Content in Marijuana Leaves (Cannabis sativa L.) from Colombia. In Gas Chromatography—Biochemicals Narcotics and Essential Oils; Salih, B., Ed.; InTech: London, UK, 2012. [Google Scholar] [CrossRef] [Green Version]
- Poulsen, H.A.; Sutherland, G.J. The potency of cannabis in New Zealand from 1976 to 1996. Sci. Justice 2000, 40, 171–176. [Google Scholar] [CrossRef]
- Tremlová, B.; Mikulášková, H.K.; Hajduchová, K.; Jancikova, S.; Kaczorová, D.; Zeljković, S.Ć.; Dordevic, D. Influence of Technological Maturity on the Secondary Metabolites of Hemp Concentrate (Cannabis sativa L.). Foods 2021, 10, 1418. [Google Scholar] [CrossRef]
- Fischedick, J.T.; Glas, R.; Hazekamp, A.; Verpoorte, R. A qualitative and quantitative HPTLC densitometry method for the analysis of cannabinoids in Cannabis sativa L. Phytochem. Anal. 2009, 20, 421–426. [Google Scholar] [CrossRef] [PubMed]
- Dubrow, G.A.; Pawar, R.S.; Srigley, C.; Sam, J.F.; Talavera, C.; Parker, C.H.; Noonan, G.O. A survey of cannabinoids and toxic elements in hemp-derived products from the United States marketplace. J. Food Compos. Anal. 2021, 97, 103800. [Google Scholar] [CrossRef]
- Glivar, T.; Eržen, J.; Kreft, S.; Zagožen, M.; Čerenak, A.; Čeh, B.; Benković, E.T. Cannabinoid content in industrial hemp (Cannabis sativa L.) varieties grown in Slovenia. Ind. Crops Prod. 2020, 145, 112082. [Google Scholar] [CrossRef]
- Saloner, A.; Bernstein, N. Nitrogen supply affects cannabinoid and terpenoid profile in medical cannabis (Cannabis sativa L.). Ind. Crops Prod. 2021, 167, 113516. [Google Scholar] [CrossRef]
- Zamengo, L.; Frison, G.; Bettin, C.; Sciarrone, R. Cannabis potency in the Venice area (Italy): Update 2013: Cannabis potency in the Venice area (Italy): Update 2013. Drug Test. Anal. 2015, 7, 255–258. [Google Scholar] [CrossRef] [PubMed]
- Dussy, F.E.; Hamberg, C.; Luginbühl, M.; Schwerzmann, T.; Briellmann, T.A. Isolation of Δ9-THCA-A from hemp and analytical aspects concerning the determination of Δ9-THC in cannabis products. Forensic Sci. Int. 2005, 149, 3–10. [Google Scholar] [CrossRef] [PubMed]
- Harvey, D.J. Cyclic alkylboronates as derivatives for the characterization of cannabinolic acids by combined gas chromatography and mass spectrometry. Biol. Mass Spectrom. 1977, 4, 88–93. [Google Scholar] [CrossRef] [PubMed]
- Pandohee, J.; Holland, B.J.; Li, B.; Tsuzuki, T.; Stevenson, P.G.; Barnett, N.W.; Pearson, J.R.; Jones, O.A.H.; Conlan, X.A. Screening of cannabinoids in industrial-grade hemp using two-dimensional liquid chromatography coupled with acidic potassium permanganate chemiluminescence detection: Liquid Chromatography. J. Sep. Sci. 2015, 38, 2024–2032. [Google Scholar] [CrossRef] [PubMed]
- Fetterman, P.S.; Doorenbos, N.J. A simple gas liquid chromatography procedure for determination of cannabinoldlc Acids In Cannabis sativa L. Experimentia 1971, 27, 988–990. [Google Scholar] [CrossRef] [PubMed]
- Tucker, R.B.; Graham, B.F. Cannabinoid Content of Colombian Cannabis. Can. Soc. Forensic Sci. J. 1981, 14, 41–45. [Google Scholar] [CrossRef]
- Krishnamurty, H.G.; Kaushal, R. Analysis of Indian Marihuana. Indian J. Pharmacol. 1974, 36, 152–154. [Google Scholar]
- Stefanidou, M.; Dona, A.; Athanaselis, S.; Papoutsis, I.; Koutselinis, A. The cannabinoid content of marihuana samples seized in Greece and its forensic application. Forensic Sci. Int. 1998, 95, 153–162. [Google Scholar] [CrossRef]
- Stefanidou, M.; Athanaselis, S.; Alevisopolous, G.; Papoutsis, I.; Koutselinis, A. Delta9-tetrahydrocannabinol content in cannabis plants of Greek origin. Chem. Pharm. Bull. 2000, 48, 743–745. [Google Scholar] [CrossRef] [Green Version]
- Tayyab, M.; Shahwar, D. GCMS analysis of Cannabis sativa L. from four different areas of Pakistan. Egypt. J. Forensic Sci. 2015, 5, 114–125. [Google Scholar] [CrossRef] [Green Version]
- Kladar, N.; Čonić, B.S.; Božin, B.; Torović, L. European hemp-based food products—Health concerning cannabinoids exposure assessment. Food Control. 2021, 129, 108233. [Google Scholar] [CrossRef]
- Galand, N.; Ernouf, D.; Montigny, F.; Dollet, J.; Pothier, J. Separation and Identification of Cannabis Components by Different Planar Chromatography Techniques (TLC, AMD, OPLC). J. Chromatogr. Sci. 2004, 42, 130–134. [Google Scholar] [CrossRef] [Green Version]
- dos Santos, N.A.; Souza, L.M.; Domingos, E.; França, H.S.; Lacerda, V.; Beatriz, A.; Vaz, B.G.; Rodrigues, R.R.T.; Carvalho, V.V.; Merlo, B.B.; et al. Evaluating the selectivity of colorimetric test (Fast Blue BB salt) for the cannabinoids identification in marijuana street samples by UV–Vis, TLC, ESI(+)FT-ICR MS and ESI(+)MS/MS. Forensic Chem. 2016, 1, 13–21. [Google Scholar] [CrossRef]
- Liu, Y.; Brettell, T.A.; Victoria, J.; Wood, M.R.; Staretz, M.E. High performance thin-layer chromatography (HPTLC) analysis of cannabinoids in cannabis extracts. Forensic Chem. 2020, 19, 1–11. [Google Scholar] [CrossRef]
- Caligiani, A.; Palla, G.; Bernardelli, B. GC-MS Analysis of Hashish Samples: A Case of Adulteration with Colophony. J. Forensic Sci. 2006, 51, 1096–1100. [Google Scholar] [CrossRef]
- Vollner, L.; Bieniek, D.; Korte, F. Review of analytical methods for identification and quantification of Cannabis products. Regul. Toxicol. Pharmacol. 1986, 6, 348–358. [Google Scholar] [CrossRef]
- Matsunaga, T.; Nagatomo, H.; Yamamoto, I.; Yoshimura, H. Identification and determination of cannabinoids in commercially available cannabis seeds. Eisei Kagaku 1990, 36, 545–547. [Google Scholar] [CrossRef] [Green Version]
- Tewari, S.N.; Harpalani, S.P.; Sharma, S.C. Separation and identification of the constituents of hashish (cannabis indica linn.) by thin-layer chromatography and its application in forensic analysis. Mikrochim Acta 1974, 62, 991–995. [Google Scholar] [CrossRef]
- Ibrahim, E.; Gul, W.; Gul, S.; Stamper, B.; Hadad, G.; Salam, R.A.; Ibrahim, A.; Ahmed, S.; Chandra, S.; Lata, H.; et al. Determination of Acid and Neutral Cannabinoids in Extracts of Different Strains of Cannabis sativa Using GC-FID. Planta Med. 2018, 84, 250–259. [Google Scholar] [CrossRef] [PubMed]
- Schettino, L.; Prieto, M.; Benedé, J.L.; Chisvert, A.; Salvador, A. A Rapid and Sensitive Method for the Determination of Cannabidiol in Cosmetic Products by Liquid Chromatography–Tandem Mass Spectrometry. Cosmetics 2021, 8, 30. [Google Scholar] [CrossRef]
- Piccolella, S.; Formato, M.; Pecoraro, M.T.; Crescente, G.; Pacifico, S. Discrimination of CBD-, THC- and CBC-type acid cannabinoids through diagnostic ions by UHPLC-HR-MS/MS in negative ion mode. J. Pharm. Biomed. Anal. 2021, 201, 114125. [Google Scholar] [CrossRef]
- UNODC. Bulletin on Narcotics; Issue 2—008, United Nations, Office on Drugs and Crime: Vienna, Austria, 1994. [Google Scholar]
- Baker, P.B.; Taylor, B.J.; Gough, T.A. The tetrahydrocannabinol and tetrahydrocannabinolic acid content of cannabis products. J. Pharm. Pharmacol. 1981, 33, 369–372. [Google Scholar] [CrossRef] [PubMed]
- ElSohly, M.A.; Mehmedic, Z.; Foster, S.; Gon, C.; Chandra, S.; Church, J.C. Changes in Cannabis Potency Over the Last 2 Decades (1995–2014): Analysis of Current Data in the United States. Biol. Psychiatry 2016, 79, 613–619. [Google Scholar] [CrossRef] [PubMed] [Green Version]
- Stambouli, H.; el Bouri, A.; Bouayoun, T. Évolution de la teneur en Δ9-THC dans les saisies de résines de cannabis au Maroc de 2005 à 2014. Toxicol. Anal. Et Clin. 2016, 28, 146–152. [Google Scholar] [CrossRef]
- Ross, S.A.; Mehmedic, Z.; Murphy, T.P.; Elsohly, M.A. GC-MS Analysis of the total delta9-THC content of bBoth drug- and fiber-type cannabis seeds. J. Anal. Toxicol. 2000, 24, 715–717. [Google Scholar] [CrossRef] [Green Version]
- Petrović, M.; Debeljak, Ž.; Kezić, N.; Džidara, P. Relationship between cannabinoids content and composition of fatty acids in hempseed oils. Food Chem. 2015, 170, 218–225. [Google Scholar] [CrossRef]
- Licata, M.; Verri, P.; Beduschi, G. δ9 THC content in illicit cannabis products. Ann. Ist Super Sanita 2005, 41, 483–485. [Google Scholar]
- Swift, W.; Wong, A.; Li, K.M.; Arnold, J.C.; McGregor, I.S. Analysis of Cannabis Seizures in NSW, Australia: Cannabis Potency and Cannabinoid Profile. PLoS ONE 2013, 8, e70052. [Google Scholar] [CrossRef] [PubMed]
- Rovetto, L.J.; Aieta, N.V. Supercritical carbon dioxide extraction of cannabinoids from Cannabis sativa L. J. Supercrit. Fluids 2017, 129, 16–27. [Google Scholar] [CrossRef]
- Christinat, N.; Savoy, M.-C.; Mottier, P. Development, validation and application of a LC-MS/MS method for quantification of 15 cannabinoids in food. Food Chem. 2020, 318, 126469. [Google Scholar] [CrossRef]
- Ameur, S.; Haddou, B.; Derriche, Z.; Canselier, J.P.; Gourdon, C. Cloud point extraction of Δ9-tetrahydrocannabinol from cannabis resin. Anal. Bioanal. Chem. 2013, 405, 3117–3123. [Google Scholar] [CrossRef] [PubMed] [Green Version]
- Gunjević, V.; Grillo, G.; Carnaroglio, D.; Binello, A.; Barge, A.; Cravotto, G. Selective recovery of terpenes, polyphenols and cannabinoids from Cannabis sativa L. inflorescences under microwaves. Ind. Crops Prod. 2021, 162, 113247. [Google Scholar] [CrossRef]
- Poddar, M.K.; Ghosh, J.J.; Datta, J. Micromethod for the estimation of Cannabis components. Sci. Cult. 1975, 41, 492–495. [Google Scholar]
- Ilias, Y.; Rudaz, S.; Mathieu, P.; Veuthey, J.-L.; Christen, P. Analysis of Cannabis Material by Headspace Solid-Phase Microextraction Combined with Gas Chromatography-Mass Spectrometry. Chim. Int. J. Chem. 2004, 58, 219–221. [Google Scholar] [CrossRef] [Green Version]
- Qamar, S.; Manrique, Y.J.; Parekh, H.S.; Falconer, J.R. Development and Optimization of Supercritical Fluid Extraction Setup Leading to Quantification of 11 Cannabinoids Derived from Medicinal Cannabis. Biology 2021, 10, 481. [Google Scholar] [CrossRef]
- Omar, J.; Olivares, M.; Amigo, J.M.; Etxebarria, N. Resolution of co-eluting compounds of Cannabis Sativa in comprehensive two-dimensional gas chromatography/mass spectrometry detection with Multivariate Curve Resolution-Alternating Least Squares. Talanta 2014, 121, 273–280. [Google Scholar] [CrossRef] [PubMed]
- Grijó, D.R.; Osorio, I.A.V.; Cardozo-Filho, L. Supercritical Extraction Strategies Using CO2 and Ethanol to Obtain Cannabinoid Compounds from Cannabis Hybrid Flowers. J. CO2 Util. 2019, 30, 241–248. [Google Scholar] [CrossRef]
- Micalizzi, G.; Alibrando, F.; Vento, F.; Trovato, E.; Zoccali, M.; Guarnaccia, P.; Dugo, P.; Mondello, L. Development of a Novel Microwave Distillation Technique for the Isolation of Cannabis sativa L. Essential Oil and Gas Chromatography Analyses for the Comprehensive Characterization of Terpenes and Terpenoids, Including Their Enantio-Distribution. Molecules 2021, 26, 1588. [Google Scholar] [CrossRef]
- Pellegrini, M.; Marchei, E.; Pacifici, R.; Pichini, S. A rapid and simple procedure for the determination of cannabinoids in hemp food products by gas chromatography-mass spectrometry. J. Pharm. Biomed. Anal. 2005, 36, 939–946. [Google Scholar] [CrossRef]
- Broséus, J.; Anglada, F.; Esseiva, P. The differentiation of fibre- and drug type Cannabis seedlings by gas chromatography/mass spectrometry and chemometric tools. Forensic Sci. Int. 2010, 200, 87–92. [Google Scholar] [CrossRef] [PubMed] [Green Version]
- Chandra, S.; Radwan, M.M.; Majumdar, C.G.; Church, J.C.; Freeman, T.P.; ElSohly, M.A. New trends in cannabis potency in USA and Europe during the last decade (2008–2017). Eur. Arch. Psychiatry Clin. Neurosci. 2019, 269, 5–15. [Google Scholar] [CrossRef] [PubMed]
- Qureshi, M.N.; Kanwal, F.; Siddique, M.; Akram, M. Estimation of Biologically Active Cannabinoids in Cannabis indica by Gas Chromatography-mass Spectrometry (GC-MS). World Appl. Sci. J. 2012, 19, 918–923. [Google Scholar] [CrossRef]
- Pijlman, F.; Rigter, S.; Hoek, J.; Goldschmidt, H.; Niesink, R. Strong increase in total delta-THC in cannabis preparations sold in Dutch coffee shops. Addict. Biol. 2005, 10, 171–180. [Google Scholar] [CrossRef]
- Vanhove, W.; van Damme, P.; Meert, N. Factors determining yield and quality of illicit indoor cannabis (Cannabis spp.) production. Forensic Sci. Int. 2011, 212, 158–163. [Google Scholar] [CrossRef]
- Thomsen, K.R.; Lindholst, C.; Thylstrup, B.; Kvamme, S.; Reitzel, L.A.; Worm-Leonhard, M.; Englund, A.; Freeman, T.P.; Hesse, M. Changes in the composition of cannabis from 2000–2017 in Denmark: Analysis of confiscated samples of cannabis resin. Exp. Clin. Psychopharmacol. 2019, 27, 402–411. [Google Scholar] [CrossRef] [Green Version]
- dos Santos, N.; Tose, L.; da Silva, S.; Murgu, M.; Kuster, R.; Ortiz, R.; Camargo, F.; Vaz, B.; Lacerda, V., Jr.; Romão, W. Analysis of Isomeric Cannabinoid Standards and Cannabis Products by UPLC-ESI-TWIM-MS: A Comparison with GC-MS and GC × GC-QMS. J. Braz. Chem. Soc. 2019, 30, 60–70. [Google Scholar] [CrossRef]
- Leghissa, A.; Smuts, J.; Qiu, C.; Hildenbrand, Z.L.; Schug, K.A. Detection of cannabinoids and cannabinoid metabolites using gas chromatography with vacuum ultraviolet spectroscopy. Sep. Sci. Plus. 2018, 1, 37–42. [Google Scholar] [CrossRef]
- Giese, M.W.; Lewis, M.A.; Giese, L.; Smith, K.M. Method for the Analysis of Cannabinoids and Terpenes in Cannabis. J. AOAC Int. 2015, 98, 1503–1522. [Google Scholar] [CrossRef] [Green Version]
- Trigg, S. Development of Gas and Liquid Chromatographic Methods for the Separation and Quantification of 11 Cannabinoids. Bachelor Thesis, Murdoch University, Perth, Australia, 2017. [Google Scholar]
- Sherma, J.; Rabel, F. Thin layer chromatography in the analysis of cannabis and its components and synthetic cannabinoids. J. Liq. Chromatogr. Relat. Technol. 2019, 42, 613–628. [Google Scholar] [CrossRef]
- Mandrioli, M.; Tura, M.; Scotti, S.; Gallina, T. Fast Detection of 10 Cannabinoids by RP-HPLC-UV Method in Cannabis sativa L. Molecules 2019, 24, 2113. [Google Scholar] [CrossRef] [Green Version]
- Amirav, A.; Neumark, B.; Eren, K.J.M.; Fialkov, A.B.; Tal, N. Cannabis and its cannabinoids analysis by gas chromatography–mass spectrometry with Cold EI. J. Mass Spectrom. 2021, 6, 56. [Google Scholar] [CrossRef]
- Kowalska, T.; Sajewicz, M.; Sherma, J. Planar Chromatography—Mass Spectrometry; CRC Press: Boca Raton, FL, USA, 2020. [Google Scholar]
- Sherma, J.; Fried, B. (Eds.) Handbook of Thin-Layer Chromatography, 3rd ed.; rev.expanded; Marcel Dekker: New York, NY, USA, 2003. [Google Scholar]
- de Carvalho, T.C.; Tosato, F.; Souza, L.M.; Santos, H.; Merlo, B.B.; Ortiz, R.S.; Rodrigues, R.R.T.; Filgueiras, P.R.; França, H.S.; Augusti, R.; et al. Thin layer chromatography coupled to paper spray ionization mass spectrometry for cocaine and its adulterants analysis. Forensic Sci. Int. 2016, 262, 56–65. [Google Scholar] [CrossRef]
- National Research Council (U.S.) (Ed.) Strengthening Forensic Science in the United States: A Path Forward; National Academies Press: Washington, DC, USA, 2009. [Google Scholar]
- Hanus, L. Our Experience with Identification and Separation of Compounds from Marijuana (Cannabis Sativa L.) by Thin Layer Chromatography. Acta Univ. Palacki. Olomuc. Fac. Med. 1987, 116, 15–24. [Google Scholar] [PubMed]
- Mano-Sousa, B.J.; Maia, G.A.S.; Lima, P.L.; Campos, V.A.; Negri, G.; Chequer, F.M.D.; Duarte-Almeida, J.M. Color determination method and evaluation of methods for the detection of cannabinoids by thin-layer chromatography (TLC). J. Forensic Sci. 2021, 66, 854–865. [Google Scholar] [CrossRef]
- Meng, Q.; Buchanan, B.; Zuccolo, J.; Poulin, M.-M.; Gabriele, J.; Baranowski, D.C. A reliable and validated LC-MS/MS method for the simultaneous quantification of 4 cannabinoids in 40 consumer products. PLoS ONE 2018, 13, e0196396. [Google Scholar] [CrossRef] [PubMed]
- Fan, X.-H.; Cheng, Y.-Y.; Ye, Z.-L.; Lin, R.-C.; Qian, Z.-Z. Multiple chromatographic fingerprinting and its application to the quality control of herbal medicines. Anal. Chim. Acta 2006, 555, 217–224. [Google Scholar] [CrossRef]
- Cheng, Y.; Chen, M.; Tong, W. An Approach to Comparative Analysis of Chromatographic Fingerprints for Assuring the Quality of Botanical Drugs. J. Chem. Inf. Comput. Sci. 2003, 43, 1068–1076. [Google Scholar] [CrossRef] [PubMed]
- Patel, B.; Wene, D.; Fan, Z. Qualitative and quantitative measurement of cannabinoids in cannabis using modified HPLC/DAD method. J. Pharm. Biomed. Anal. 2017, 146, 15–23. [Google Scholar] [CrossRef]
- Gul, W.; Gul, S.W.; Radwan, M.M.; Wanas, A.S.; Mehmedic, Z.; Khan, I.I.; Sharaf, M.H.M.; ElSohly, M.A. Determination of 11 Cannabinoids in Biomass and Extracts of Different Varieties of Cannabis Using High-Performance Liquid Chromatography. J. AOAC Int. 2015, 98, 1523–1528. [Google Scholar] [CrossRef] [PubMed]
- Pellati, F.; Brighenti, V.; Sperlea, J.; Marchetti, L.; Bertelli, D.; Benvenuti, S. New Methods for the Comprehensive Analysis of Bioactive Compounds in Cannabis sativa L. (hemp). Molecules 2018, 23, 2639. [Google Scholar] [CrossRef] [PubMed] [Green Version]
- Citti, C.; Pacchetti, B.; Vandelli, M.A.; Forni, F.; Cannazza, G. Analysis of cannabinoids in commercial hemp seed oil and decarboxylation kinetics studies of cannabidiolic acid (CBDA). J. Pharm. Biomed. Anal. 2018, 149, 532–540. [Google Scholar] [CrossRef] [PubMed]
- Pacifici, R.; Marchei, E.; Salvatore, F.; Guandalini, L.; Busardò, F.P.; Pichini, S. Evaluation of cannabinoids concentration and stability in standardized preparations of cannabis tea and cannabis oil by ultra-high performance liquid chromatography tandem mass spectrometry. Clin. Chem. Lab. Med. 2017, 55, 1555–1563. [Google Scholar] [CrossRef] [PubMed]
- Yang, Y.; Lewis, M.M.; Bello, A.M.; Wasilewski, E.; Clarke, H.A.; Kotra, L.P. Cannabis sativa (Hemp) Seeds, Δ9-Tetrahydrocannabinol, and Potential Overdose. Cannabis Cannabinoid Res. 2017, 2, 274–281. [Google Scholar] [CrossRef] [Green Version]
- Citti, C.; Ciccarella, G.; Braghiroli, D.; Parenti, C.; Vandelli, M.A.; Cannazza, G. Medicinal cannabis: Principal cannabinoids concentration and their stability evaluated by a high performance liquid chromatography coupled to diode array and quadrupole time of flight mass spectrometry method. J. Pharm. Biomed. Anal. 2016, 128, 201–209. [Google Scholar] [CrossRef] [PubMed]
- Palermiti, A.; Cafaro, A.; Barco, S.; Bucchioni, P.; Franceschini, P.; Cusato, J.; de Nicolò, A.; Manca, A.; de Vivo, E.D.; Russo, E.; et al. Analysis of Cannabinoids Concentration in Cannabis Oil Galenic Preparations: Harmonization between Three Laboratories in Northern Italy. Pharmaceuticals 2021, 14, 462. [Google Scholar] [CrossRef] [PubMed]
- Carcieri, C.; Tomasello, C.; Simiele, M.; de Nicolò, A.; Avataneo, V.; Canzoneri, L.; Cusato, J.; di Perri, G.; D’Avolio, A. Cannabinoids concentration variability in cannabis olive oil galenic preparations. J. Pharm. Pharmacol. 2018, 70, 143–149. [Google Scholar] [CrossRef] [PubMed]
- Burnier, C.; Esseiva, P.; Roussel, C. Quantification of THC in Cannabis plants by fast-HPLC-DAD: A promising method for routine analyses. Talanta 2019, 192, 135–141. [Google Scholar] [CrossRef]
- Peace, M.R.; Butler, K.E.; Wolf, C.E.; Poklis, J.L.; Poklis, A. Evaluation of Two Commercially Available Cannabidiol Formulations for Use in Electronic Cigarettes. Front. Pharmacol. 2016, 7, 279. [Google Scholar] [CrossRef] [Green Version]
- Yangsud, J.; Santasanasuwan, S.; Ahkkarachinoreh, P.; Maha, A.; Madaka, F.; Suksaeree, J.; Songsak, T.; Vutthipong, A.; Monton, C. Stability of cannabidiol, ∆9-tetrahydrocannabinol, and cannabinol under stress conditions. Adv. Tradit. Med. 2021, 21, 475–484. [Google Scholar] [CrossRef]
- Deidda, R.; Schelling, C.; Roussel, J.-M.; Dispas, A.; Bleye, C.D.; Ziemons, É.; Hubert, P.; Veuthey, J.-L. The analysis of cannabinoids in cannabis samples by supercritical fluid chromatography and ultra-high-performance liquid chromatography: A comparison study. Anal. Sci. Adv. 2021, 2, 2–14. [Google Scholar] [CrossRef]
- Deidda, R.; Coppey, F.; Damergi, D.; Schelling, C.; Coïc, L.; Veuthey, J.-L.; Sacré, P.-Y.; de Bleye, C.; Hubert, P.; Esseiva, P.; et al. New perspective for the in-field analysis of cannabis samples using handheld near-infrared spectroscopy: A case study focusing on the determination of Δ9-tetrahydrocannabinol. J. Pharm. Biomed. Anal. 2021, 202, 114150. [Google Scholar] [CrossRef]
- Ciolino, L.A.; Ranieri, T.L.; Taylor, A.M. Commercial cannabis consumer products part 2: HPLC-DAD quantitative analysis of cannabis cannabinoids. Forensic Sci. Int. 2018, 289, 438–447. [Google Scholar] [CrossRef]
- Ambach, L.; Penitschka, F.; Broillet, A.; König, S.; Weinmann, W.; Bernhard, W. Simultaneous quantification of delta-9-THC, THC-acid A, CBN and CBD in seized drugs using HPLC-DAD. Forensic Sci. Int. 2014, 243, 107–111. [Google Scholar] [CrossRef]
- Wakshlag, J.J.; Cital, S.; Eaton, S.J.; Prussin, R.; Hudalla, C. Cannabinoid, Terpene, and Heavy Metal Analysis of 29 Over-the-Counter Commercial Veterinary Hemp Supplements. VMRR 2020, 11, 45–55. [Google Scholar] [CrossRef] [Green Version]
- Tolomeo, F.; Russo, F.; Vandelli, M.A.; Biagini, G.; Capriotti, A.L.; Laganà, A.; Carbone, L.; Gigli, G.; Cannazza, G.; Citti, C. HPLC-UV-HRMS analysis of cannabigerovarin and cannabigerobutol, the two impurities of cannabigerol extracted from hemp. J. Pharm. Biomed. Anal. 2021, 203, 114215. [Google Scholar] [CrossRef]
- Brighenti, V.; Licata, M.; Pedrazzi, T.; Maran, D.; Bertelli, D.; Pellati, F.; Benvenuti, S. Development of a new method for the analysis of cannabinoids in honey by means of high-performance liquid chromatography coupled with electrospray ionisation-tandem mass spectrometry detection. J. Chromatogr. A 2019, 1597, 179–186. [Google Scholar] [CrossRef] [PubMed]
- Wang, M.; Wang, Y.-H.; Avula, B.; Radwan, M.M.; Wanas, A.S.; van Antwerp, J.; Parcher, J.F.; ElSohly, M.A.; Khan, I.A. Decarboxylation Study of Acidic Cannabinoids: A Novel Approach Using Ultra-High-Performance Supercritical Fluid Chromatography/Photodiode Array-Mass Spectrometry. Cannabis Cannabinoid Res. 2016, 1, 262–271. [Google Scholar] [CrossRef] [Green Version]
- mzCloud—Advanced Mass Spectral Database (n.d.). Available online: https://www.mzcloud.org/ (accessed on 28 October 2020).
- Pence, H.E.; Williams, A. ChemSpider: An Online Chemical Information Resource. J. Chem. Educ. 2010, 87, 1123–1124. [Google Scholar] [CrossRef]
- Wishart, D.S.; Feunang, Y.D.; Marcu, A.; Guo, A.C.; Liang, K.; Vázquez-Fresno, R.; Sajed, T.; Johnson, D.; Li, C.; Karu, N.; et al. HMDB 4.0: The human metabolome database for 2018. Nucleic Acids Res. 2018, 46, D608–D617. [Google Scholar] [CrossRef]
- Bäckström, B.; Cole, M.D.; Carrott, M.J.; Jones, D.C.; Davidson, G.; Coleman, K. A preliminary study of the analysis of Cannabis by supercritical fluid chromatography with atmospheric pressure chemical ionisation mass spectroscopic detection. Sci. Justice 1997, 37, 91–97. [Google Scholar] [CrossRef]
- Wang, M.; Wang, Y.-H.; Avula, B.; Radwan, M.M.; Wanas, A.S.; Mehmedic, Z.; van Antwerp, J.; ElSohly, M.A.; Khan, I.A. Quantitative Determination of Cannabinoids in Cannabis and Cannabis Products Using Ultra-High-Performance Supercritical Fluid Chromatography and Diode Array/Mass Spectrometric Detection. J. Forensic Sci. 2017, 62, 602–611. [Google Scholar] [CrossRef] [PubMed]
- U.S. Department of Health and Human Services, Food and Drug Administration. Guidance for Industry PAT—A Framework for Innovative Pharmaceutical Development, Manufacturing, and Quality Assurance; Food and Drug Administration: Silver Spring, MD, USA, 2004. [Google Scholar]
- Griffiths, P.R.; de Haseth, J.A. Fourier Transform Infrared Spectrometry, 2nd ed.; Wiley: Hoboken, NJ, USA, 2007. [Google Scholar]
- Borille, B.T.; Marcelo, M.C.A.; Ortiz, R.S.; Mariotti, K.d.; Ferrão, M.F.; Limberger, R.P. Near infrared spectroscopy combined with chemometrics for growth stage classification of cannabis cultivated in a greenhouse from seized seeds. Spectrochim. Acta Part A: Mol. Biomol. Spectrosc. 2017, 173, 318–323. [Google Scholar] [CrossRef]
- Mendez, J.; Francisco, S. Optimization of Cannabis Grows Using Introduction Fourier Transform Mid-Infrared Spectroscopy; Perkin Elmer Inc.: Waltham, MA, USA, 2016. [Google Scholar]
- Callado, C.S.; Núñez-Sánchez, N.; Casano, S.; Ferreiro-Vera, C. The potential of near infrared spectroscopy to estimate the content of cannabinoids in Cannabis sativa L.: A comparative study. Talanta 2018, 190, 147–157. [Google Scholar] [CrossRef]
- Grekopoulos, J.E. Construction and Validation of Quantification Methods for Determining the Cannabidiol Content in Liquid Pharma-Grade Formulations by Means of Near-Infrared Spectroscopy and Partial Least Squares Regression. Med. Cannabis Cannabinoids 2019, 2, 43–55. [Google Scholar] [CrossRef]
- Duchateau, C.; Kauffmann, J.; Canfyn, M.; Stévigny, C.; de Braekeleer, K.; Deconinck, E. Discrimination of legal and illegal Cannabis spp. according to European legislation using near infrared spectroscopy and chemometrics. Drug Test. Anal. 2020, 12, 1309–1319. [Google Scholar] [CrossRef]
- Lu, G.; Fei, B. Medical hyperspectral imaging: A review. J. Biomed. Opt. 2014, 19, 010901. [Google Scholar] [CrossRef] [PubMed]
- Politi, M.; Peschel, W.; Wilson, N.; Zloh, M.; Prieto, J.M.; Heinrich, M. Direct NMR analysis of cannabis water extracts and tinctures and semi-quantitative data on Δ9-THC and Δ9-THC-acid. Phytochemistry 2008, 69, 562–570. [Google Scholar] [CrossRef] [PubMed]
- Martin, F.L. Shining a new light into molecular workings. Nat. Methods 2011, 8, 385–387. [Google Scholar] [CrossRef]
- Sanchez, L.; Baltensperger, D.; Kurouski, D. Raman-Based Differentiation of Hemp, Cannabidiol-Rich Hemp, and Cannabis. Anal. Chem. 2020, 92, 7733–7737. [Google Scholar] [CrossRef] [PubMed]
- Sanchez, L.; Filter, C.; Baltensperger, D.; Kurouski, D. Confirmatory non-invasive and non-destructive differentiation between hemp and cannabis using a hand-held Raman spectrometer. RSC Adv. 2020, 10, 3212–3216. [Google Scholar] [CrossRef]
- Ebersbach, P.; Stehle, F.; Kayser, O.; Freier, E. Chemical fingerprinting of single glandular trichomes of Cannabis sativa by Coherent anti-Stokes Raman scattering (CARS) microscopy. BMC Plant Biol. 2018, 18, 275. [Google Scholar] [CrossRef]
- Lurie, I.S.; Meyers, R.P.; Conver, T.S. Capillary Electrochromatography of Cannabinoids. Anal. Chem. 1998, 70, 3255–3260. [Google Scholar] [CrossRef]
- Peschel, W.; Politi, M. 1 H NMR and HPLC/DAD for Cannabis sativa L. chemotype distinction, extract profiling and specification. Talanta 2015, 140, 150–165. [Google Scholar] [CrossRef]
- Isahq, M.S.; Afridi, M.S.; Ali, J.; Hussain, M.M.; Ahmad, S.; Kanwal, F. Proximate composition, phytochemical screening, GC-MS studies of biologically active cannabinoids and antimicrobial activities of Cannabis indica. Asian Pac. J. Trop. Dis. 2015, 5, 897–902. [Google Scholar] [CrossRef]
- Uziel, A.; Gelfand, A.; Amsalem, K.; Berman, P.; Lewitus, G.M.; Meiri, D.; Lewitus, D.Y. Full-Spectrum Cannabis Extract Microdepots Support Controlled Release of Multiple Phytocannabinoids for Extended Therapeutic Effect. ACS Appl. Mater. Interfaces 2020, 12, 23707–23716. [Google Scholar] [CrossRef]
- Risoluti, R.; Gullifa, G.; Battistini, A.; Materazzi, S. The Detection of Cannabinoids in Veterinary Feeds by MicroNIR/Chemometrics: A New Analytical Platform. Analyst 2020, 145, 1777–1782. [Google Scholar] [CrossRef] [PubMed]
- Hazekamp, A.; Choi, Y.H.; Verpoorte, R. Quantitative Analysis of Cannabinoids from Cannabis sativa Using 1H-NMR. Chem. Pharm. Bull. 2004, 52, 718–721. [Google Scholar] [CrossRef] [PubMed] [Green Version]
- Happyana, N.; Agnolet, S.; Muntendam, R.; van Dam, A.; Schneider, B.; Kayser, O. Analysis of cannabinoids in laser-microdissected trichomes of medicinal Cannabis sativa using LCMS and cryogenic NMR. Phytochemistry 2013, 87, 51–59. [Google Scholar] [CrossRef]
- Choi, Y.H.; Kim, H.K.; Hazekamp, A.; Erkelens, C.; Lefeber, A.W.M.; Verpoorte, R. Metabolomic Differentiation of Cannabis sativa Cultivars Using 1H NMR Spectroscopy and Principal Component Analysis. J. Nat. Prod. 2004, 67, 953–957. [Google Scholar] [CrossRef] [PubMed]
- van der Pol, P.; Liebregts, N.; de Graaf, R.; Korf, D.J.; van den Brink, W.; van Laar, M. Validation of Self-Reported Cannabis Dose and Potency: An Ecological Study: Self-Reported Cannabis Dose and Potency. Addiction 2013, 108, 1801–1808. [Google Scholar] [CrossRef]
- van der Pol, P.; Liebregts, N.; Brunt, T.; van Amsterdam, J.; de Graaf, R.; Korf, D.J.; van den Brink, W.; van Laar, M. Cross-Sectional and Prospective Relation of Cannabis Potency, Dosing and Smoking Behaviour with Cannabis Dependence: An Ecological Study: Cannabis Potency, Titration and Dependence. Addiction 2014, 109, 1101–1109. [Google Scholar] [CrossRef] [Green Version]
- Leghissa, A. Method Development for Qualification and Quantification of Cannabinoids and Terpenes in Extracts by Gas Chromatography-Mass Spectrometry. 91. Available online: https://rc.library.uta.edu/uta-ir/handle/10106/26115?show=full (accessed on 8 January 2022).

| Compound [18] | Molecular Formula and Mr [18] | [M-H]− [MF1-H]− [MF2-H]− [MF3-H]− [19] | Structure [19] | UV-VIS Spectra [18] Acidic HPLC Systems/ Basic HPLC Systems | 1H NMR in Deuterated Chloroform [4,20] |
|---|---|---|---|---|---|
| Δ9-THC | C21H30O2 314.472 | C21H29O2, 313.2173 C16H21O2, 245.1547 C12H15O2, 191.1078 C11H15O22, 179.1067 | 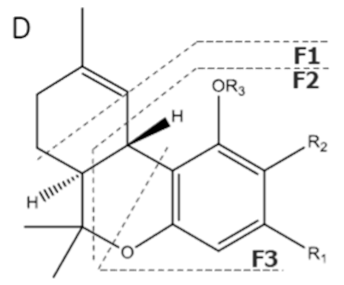 R1-C5H11, R2-H, R3-H |   | 3.20 (1H, dm, 10.9 Hz) 6.31 (1H, q, 1.6 Hz) 1.68 (3H, s) 2.16 (2H, m) 1.90 (1H, m), 1.40 (m) 1.69 (m) 1.41 (3H, s) 1.09 (3H, s) 6.14 (1H, d, 1.6Hz) 6.27 (1H, d, 1.6 Hz) 2.42 (2H, t, 7.3 Hz, 1.6 Hz), 1.55 (2H, q, 7.8 Hz) 1.29 (m) 1.29 (m) d 0.87 (3H, t, 7.0 Hz) 4.87 (1H, s) |
| Δ8-THC | C21H30O2 314.472 | C21H29O2, 313.2173 C16H21O2, 245.1547 C12H15O2, 191.1078 C11H15O2, 179.1067 |  - |   | |
| THV | C19H26O2 286.418 | C19H25O2, 285.1860 C14H17O2, 217.1234 C10H11O2, 163.0765 C9H11O2, 151.0765 | 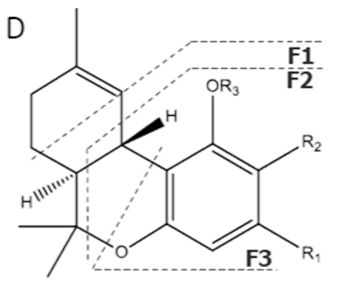 R1-C3H17, R2-H, R3-H | - - | |
| CBD | C21H30O2 314.472 | C21H29O2, 313.2173 C16H21O2, 245.1547 C12H15O2, 191.1078 C11H15O2, 179.1067 | 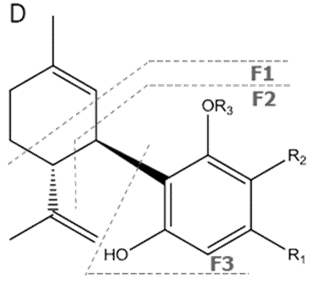 R1-C5H11, R2-H, R3-H | 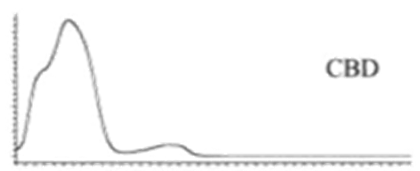 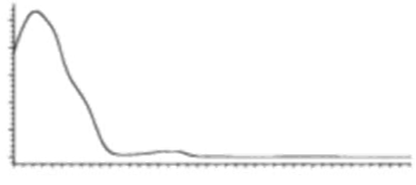 | 3.90 (1H, dm, 11.8Hz) 5.57 (1H, s) 2.21 (1H, m), 2.09 (1H, m) 1.84 (m) 2.40 (m) 1.79 (3H, s) 4.64 (trans, 1H, m), 4.54 (cis, 1H, m) 1.66 (3H, s) 6.26 (1H, brs) 6.16 (1H, brs) 2.43 (2H, t, 7.5Hz) 1.55 (2H, q, 7.6Hz) 1.29 (m) 1.29 (m) 0.88 (3H, t, 6.8Hz) 5.99 (1H, s) 5.02 (1H, s) |
| CBN | C21H26O2 310.440 | C21H25O2, 309.1860 C19H19O2, 279.1391 C12H11O2, 171.0815 | 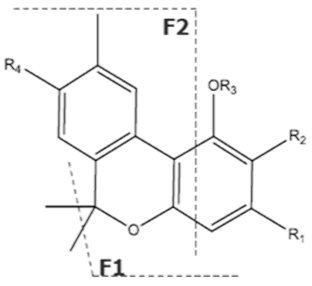 R1-C5H11, R2-H, R3-H, R4-H |   | 8.16 (1H, s) 2.38 (3H, s) 7.07 (1H, d, 7.9Hz) 7.14 (1H, d, 7.9Hz) 1.60 (6H, s) 1.60 (6H, s) 6.29 (1H, d, 1.1Hz) 6.44 (1H, d, 1.1Hz) 2.50 (2H, t, 7.5Hz) 1.63 (m) 1.32 (m) g 1.32 (m) g 0.89 (3H, t, 6.8Hz)5.13 (1H, s) |
| CBG | C21H32O2 316.488 | C21H31O2, 315.2329 C16H21O2, 245.1547 C12H15O2, 191.1078 C11H15O2, 179.1067 | 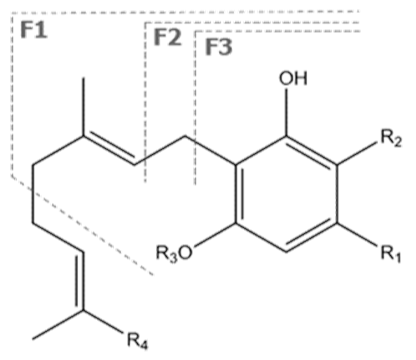 R1-C5H11, R2-H, R3-H, R4-H |   | 6.26 (2H, s) d 6. (2H, s) d 3.41 (2H, d, 7.0 Hz) 5.29 (1H, m) 1.82 (3H, s) 2.09 (4H, m) 2.09 (4H, m) 5.07 (1H, m) 1.60 (3H, s) 1.69 (3H, s) 2.45 (2H, t, 7.5 Hz) 1.56 (2H, q, 7.8 Hz) 1.33 (4H, m) 1.33 (4H, m) 0.90 (3H, t, 6.9 Hz) 5.36 (2H, s) |
| CBC | C21H30O2 314.172 | C12H29O2, 313.2173 C16H19O2, 243.1391 C12H15O2, 191.1078 C11H15O2, 179.1067 |  R1-C5H11, R2-H |   | N/A |
| CBL | C21H30O2 314.472 | C21H29O2, 313.2173 C16H19O2, 243.1391 C12H15O2, 191.1078 C11H15O2, 179.1067 |  | N/A | N/A |
| Δ9-THCA | C22H30O24 358.482 | C22H29O4, 357.2071 C21H30O2, 245.1547 C12H15O2, 191.1078 C11H15O22, 179.1067 |  R1-C5H11, R2-COOH, R3-H | 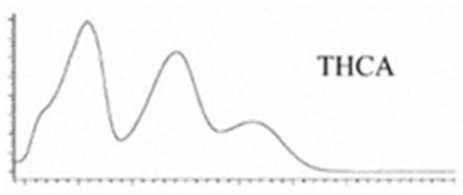  | 3.23 (1H, dm, 7.0 Hz), 6.39(1H, brs), 1.68 (3H, s), 2.17 (2H, m) 1.92 (1H, m) 1.35 (m) 1.67 (m) 1.44 (3H, s) 1.11 (3H, s) 6.26 (1H, s) 2.94 (1H, m) 2.78 (1H, m) 1.57 (2H, 1.35 (m) 1.35 (m) 0.90 (3H, t, 6.9 Hz) 12.19 (1H, s) |
| Δ9-THCA-C4 | C21H28O4 344.455 | C21H27O4, 343.1915 C15H19O2, 231.1391 C11H13O2, 177.0921 C10H13O2, 165.0921 | 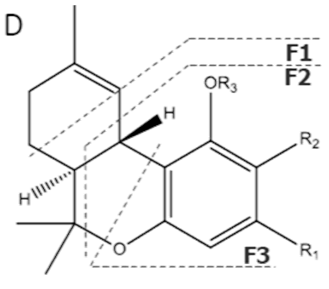 R1-C4H9, R2-COOH, R3-H | 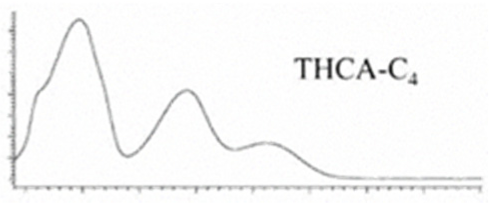  | N/A |
| THVA | C20H26O4 330.428 | C20H25O4, 329.1758 C14H17O2, 217.1234 C10H11O2, 163.0765 C9H11O2, 151.0765 |  R1-C3H7, R2-COOH, R3-H |   | N/A |
| CBDA | C22H30O4 358.482 | C22H29O4, 357.2071 C16H2102, 245.1547 C12H1502, 191.1078 C11H1502, 179.1067 |  R1-C5H11, R2-COOH, R3-H | 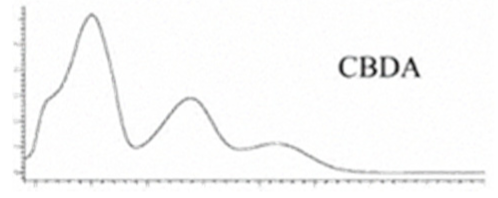 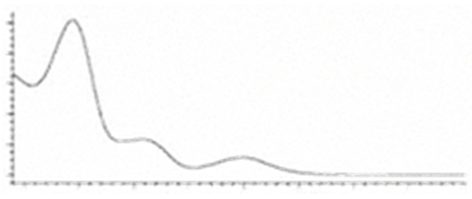 | N/A |
| CBNA | C22H26O4 354.450 | C22H25O4, 353.175 C19H1902, 279.1391 C12H1102, 171.0815 C21H2502, 309.1860 | 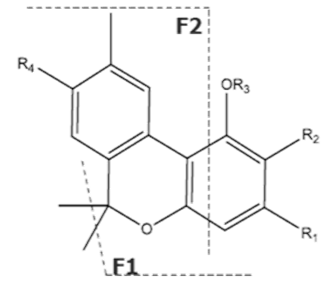 R1-C5H11, R2-COOH, R3-H, R4-H | 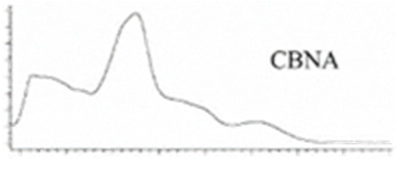  | N/A |
| CBGA | C22H32O4 360.498 | C22H31O4, 359.2228 C16H21O2, 245.1547 C12H15O2, 191.1078 C11H15O2, 179.1067 | 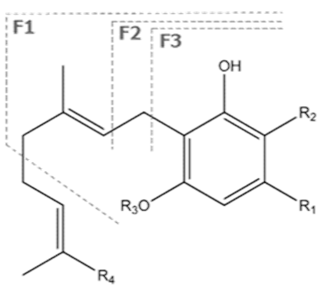 R1-C5H11, R2-COOH, R3-H, R4-H |   | N/A |
| CBCA | C22H30O4 358.482 | C22H29O4, 357.2071 C16H19O2, 243.1391 C12H15O2, 191.1078 C11H15O2, 179.1067 | R1-C5H11, R2-COOH, 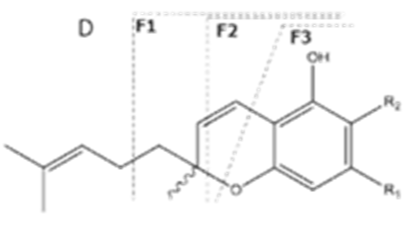 | 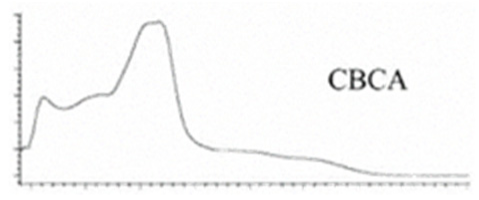 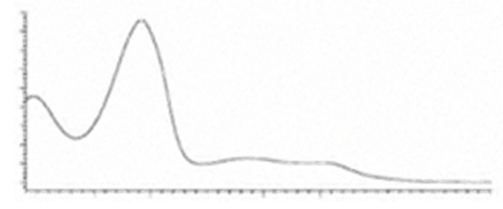 | N/A |
| CBLA | C22H30O4 358.482 | - - - - | 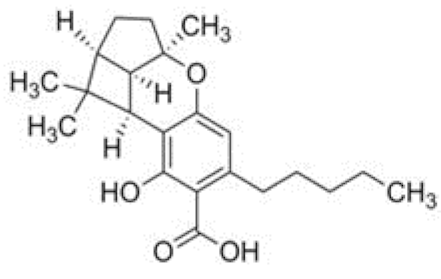 |   | N/A |
| Sample Preparation Technique | Advantages | Disadvantages |
|---|---|---|
| LLE |
|
|
| PLE |
|
|
| HS-SPME |
|
|
| SFE |
|
|
| FUSE, UAE |
|
|
| SPE |
|
|
| MHD |
|
|
| CPE |
|
|
| CPC |
|
|
| Solvent/Solvent Mixture | References |
|---|---|
| MeCN | [89,90] |
| MeCN + 1% acetic acid | [65] |
| MeCN saturated with n-hexane | [91] |
| MeOH | [38,42,50,54,56,68,78,79,85,89,92,93,94,95,96,97,98,99,100,101] |
| absolute ethanol (99.7%, v/v) | [10,49,51,53,66,90,102,103,104,105,106,107,108] |
| EtOH(96%, v/v) | [40,54,55,66,90,92,100,109,110,111,112,113] |
| isopropanol | [63,108] |
| cyclohexane | [82,114] |
| EtAc | [69,89,115,116,117] |
| CHCl3 | [44,52,58,77,118,119,120] |
| n-hexane | [40,47,54,66,75,76,78,86,87,101,121,122,123,124,125] |
| light petroleum | [46] |
| petroleum ether | [126,127,128] |
| toluene | [129] |
| benzene | [130] |
| CCl4 (later evaporated and extracts reconstituted in chloroform) | [131] |
| MeCN/MeOH (8:2, v/v) | [132] |
| hexane/isopropanol (9:1, v/v) | [57,94,106,133] |
| hexane/EtAc (9:1, v/v), (7:3, v/v), (6:4, v/v) | [54,57,66,94,104] |
| hexane/CHCl3 (1:1, v/v) | [134,135] |
| MeOH/CHCl3 (4:1, v/v) | [48,136] |
| MeOH/CHCl3 (9:1, v/v), (99:1, v/v) | [57,67,86,106,137] |
| MeOH/hexane (9:1, v/v) | [138] |
| petroleum ether/MeOH (9:1, v/v) | [45] |
| EtOH/H2O (1:1, v/v) | [133] |
| KOH in MeOH and hexane/EtAc (9:1, v/v) | [139] |
| IS (tribenzylamine) in 96% EtOH | [57] |
| IS (tribenzylamine) in MeCN | [140] |
| IS (nonadecane) in EtOH | [138] |
| IS (diphenylhydramine) in EtOH | [74] |
| IS (4-androstene-3,17-dione) in EtOH | [9,137] |
| IS (docosane) in petroleum ether | [128,141] |
| IS (nonadecane) in MeOH/CHCl3 (9:1, v/v) | [67] |
| IS (squalane) in hexane | [76,89,142] |
| IS (chrysene-d12) in hexane | [71] |
| IS (ketamine hydrochloride) in MeCN | [124] |
| IS (4-androstene-3,17-dione) in MeOH/CHCl3 (9:1, v/v) | [9,75,86,87,143,144,145] |
| Analytical Techniques | Advantages | Disadvantages | Note |
|---|---|---|---|
| GC-FID |
|
|
|
| GC-MSD |
|
| / |
| GC-QQQ/QTOF |
| / | / |
| (HP)TLC |
|
|
|
| HPLC-UV/DAD |
|
| / |
| HPLC-QQQ |
|
|
|
| HPLC-Q-Exactive Orbitrap® |
| ||
| SFC |
|
| / |
| NMR |
|
| / |
| RAMAN |
| / | / |
| FTIR, NIR, MIR |
|
| / |
Publisher’s Note: MDPI stays neutral with regard to jurisdictional claims in published maps and institutional affiliations. |
© 2022 by the authors. Licensee MDPI, Basel, Switzerland. This article is an open access article distributed under the terms and conditions of the Creative Commons Attribution (CC BY) license (https://creativecommons.org/licenses/by/4.0/).
Share and Cite
Stefkov, G.; Cvetkovikj Karanfilova, I.; Stoilkovska Gjorgievska, V.; Trajkovska, A.; Geskovski, N.; Karapandzova, M.; Kulevanova, S. Analytical Techniques for Phytocannabinoid Profiling of Cannabis and Cannabis-Based Products—A Comprehensive Review. Molecules 2022, 27, 975. https://doi.org/10.3390/molecules27030975
Stefkov G, Cvetkovikj Karanfilova I, Stoilkovska Gjorgievska V, Trajkovska A, Geskovski N, Karapandzova M, Kulevanova S. Analytical Techniques for Phytocannabinoid Profiling of Cannabis and Cannabis-Based Products—A Comprehensive Review. Molecules. 2022; 27(3):975. https://doi.org/10.3390/molecules27030975
Chicago/Turabian StyleStefkov, Gjoshe, Ivana Cvetkovikj Karanfilova, Veronika Stoilkovska Gjorgievska, Ana Trajkovska, Nikola Geskovski, Marija Karapandzova, and Svetlana Kulevanova. 2022. "Analytical Techniques for Phytocannabinoid Profiling of Cannabis and Cannabis-Based Products—A Comprehensive Review" Molecules 27, no. 3: 975. https://doi.org/10.3390/molecules27030975
APA StyleStefkov, G., Cvetkovikj Karanfilova, I., Stoilkovska Gjorgievska, V., Trajkovska, A., Geskovski, N., Karapandzova, M., & Kulevanova, S. (2022). Analytical Techniques for Phytocannabinoid Profiling of Cannabis and Cannabis-Based Products—A Comprehensive Review. Molecules, 27(3), 975. https://doi.org/10.3390/molecules27030975