
Structure and Flocculation of Ion Associates of Carrageenan and Poly(diallyldimethylammonium chloride) Depending on the Component Ratio

Abstract
1. Introduction
2. Results and Discussion
2.1. Structure and Composition of the Polyionic Complexes by XRD and FTIR
2.2. Sedimentation Stability by Turbiscan

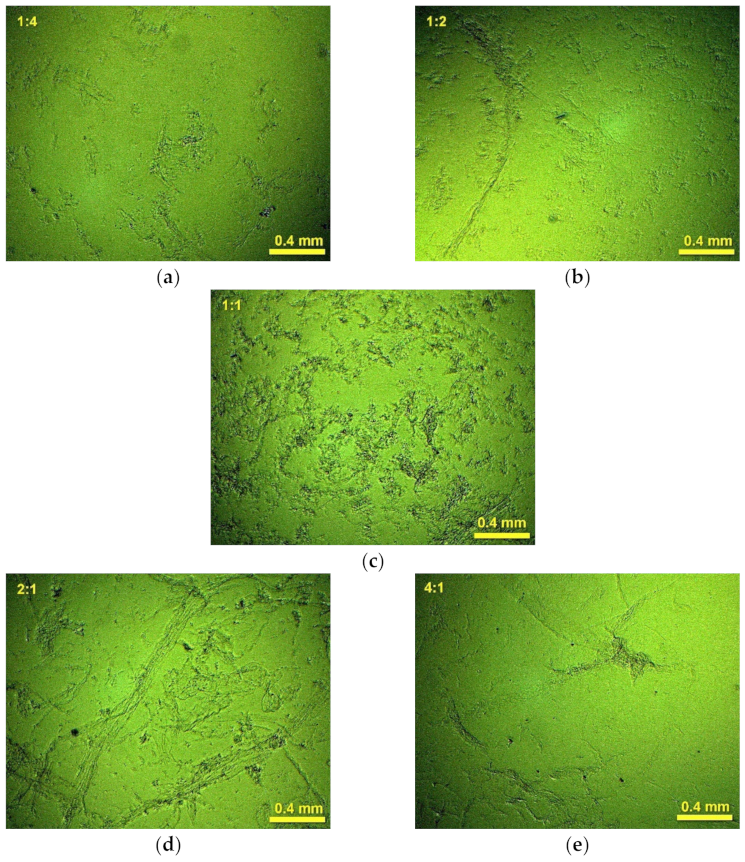
2.3. Investigation of Floc Sizes by Optical Microscopy and Laser Particle Sizing
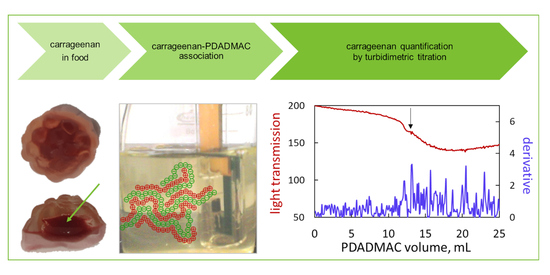
2.4. Turbidimetric Titration
2.5. Titrimetric Determination of Carrageenan in Commercial Candy Samples

| Product | polyDADMAC Titrant | NMB Dye Titrant | ||
|---|---|---|---|---|
| Detector | Content | Content | Ref. | |
| Colorless jelly dessert—Delecta | external | 2.56 | 2.52–3.09 | [4] |
| Red Band | external | 2.01 | 2.00 | [32] |
| Jelly In Chocolate (core) | external | 1.72 | 1.60 | [32] |
| Milky Splash (shell) | external | 0.84 | not applicable | [32] |
| Milky Splash (core) | external | 0.63 | not applicable | [32] |
| Golden Lilly (chocolate core) | external | 1.65 | not applicable | [32] |
| Haribo (core) | immersion | 0.54 | 0.78 | [32] |
| Energy gel cola Concap | immersion | 0.10 | 0.15–0.20 | [4] |


3. Materials and Methods
3.1. Materials
3.2. Methods
3.2.1. X-ray Diffractometry and FTIR Spectrometry
3.2.2. Sedimentation Rate
3.2.3. Microscopy and Particle Size Distribution
3.2.4. Turbidimetric Titration
4. Conclusions
Author Contributions
Funding
Institutional Review Board Statement
Informed Consent Statement
Data Availability Statement
Conflicts of Interest
Sample Availability
References
- Neamtu, B.; Barbu, A.; Negrea, M.O.; Berghea-Neamțu, C.Ș.; Popescu, D.; Zăhan, M.; Mireșan, V. Carrageenan-Based Compounds as Wound Healing Materials. Int. J. Mol. Sci. 2022, 23, 9117. [Google Scholar] [CrossRef] [PubMed]
- Qiu, S.M.; Aweya, J.J.; Liu, X.; Liu, Y.; Tang, S.; Zhang, W.; Cheong, K.L. Bioactive Polysaccharides from Red Seaweed as Potent Food Supplements: A Systematic Review of Their Extraction, Purification, and Biological Activities. Carbohydr. Polym. 2022, 275, 118696. [Google Scholar] [CrossRef] [PubMed]
- Ziółkowska, D.; Kaniewska, A.; Lamkiewicz, J.; Shyichuk, A. Determination of Carrageenan by Means of Photometric Titration with Methylene Blue and Toluidine Blue Dyes. Carbohydr. Polym. 2017, 165, 1–6. [Google Scholar] [CrossRef] [PubMed]
- Bartlová, M.; Ziółkowska, D.; Pospiech, M.; Shyichuk, A.; Tremlová, B. Determination of Carrageenan in Jellies with New Methylene Blue Dye Using Spectrophotometry, Smartphone-Based Colorimetry and Spectrophotometric Titration. Food Sci. Technol. 2021, 41, 81–90. [Google Scholar] [CrossRef]
- Ziółkowska, D.; Lamkiewicz, J.; Syrotynska, I. Ion Association of Carrageenan with Pinacyanol Dye for Analytical Purpose. Mol. Cryst. Liq. Cryst. 2020, 716, 41–49. [Google Scholar] [CrossRef]
- Sayko, R.; Tian, Y.; Liang, H.; Dobrynin, A.V. Charged Polymers: From Polyelectrolyte Solutions to Polyelectrolyte Complexes. Macromolecules 2021, 54, 7183–7192. [Google Scholar] [CrossRef]
- Chen, S.; Wang, Z.G. Driving force and pathway in polyelectrolyte complex coacervation. Proc. Natl. Acad. Sci. USA 2022, 119, e2209975119. [Google Scholar] [CrossRef]
- Chen, S.; Zhang, P.; Wang, Z. Complexation between Oppositely Charged Polyelectrolytes in Dilute Solution: Effects of Charge Asymmetry. Macromolecules 2022, 55, 3898–3909. [Google Scholar] [CrossRef]
- Gao, J.; Zhan, Q.; Tang, Z.; Huang, Y. The Critical Transition from Soluble Complexes to Colloidal Aggregates of Polyelectrolyte Complexes at Non-Stoichiometric Charge Ratios. Macromol. Rapid Commun. 2022, 43, 2100880. [Google Scholar] [CrossRef]
- Zhang, P.; Alsaifi, N.M.; Wu, J.; Wang, Z. Polyelectrolyte complex coacervation: Effects of concentration asymmetry. J. Chem. Phys. 2018, 149, 163303. [Google Scholar] [CrossRef]
- Zhang, P.; Wang, Z. Supernatant Phase in Polyelectrolyte Complex Coacervation: Cluster Formation, Binodal, and Nucleation. Macromolecules 2022, 55, 3910–3923. [Google Scholar] [CrossRef]
- Friedowitz, S.; Lou, J.; Barker, K.P.; Will, K.; Xia, Y.; Qin, Y. Looping-in complexation and ion partitioning in nonstoichiometric polyelectrolyte mixtures. Sci. Adv. 2021, 7, eabg8654. [Google Scholar] [CrossRef]
- Xu, M.; Wang, X.; Zhou, B.; Zhou, L. Pre-coagulation with cationic flocculant-composited titanium xerogel coagulant for alleviating subsequent ultrafiltration membrane fouling by algae-related pollutants. J. Hazard. Mater. 2021, 407, 124838. [Google Scholar] [CrossRef]
- Lv, L.; Zhang, X.; Qiao, J. Flocculation of low algae concentration water using polydiallyldimethylammonium chloride coupled with polysilicate aluminum ferrite. Environ. Technol. 2018, 39, 83–90. [Google Scholar] [CrossRef] [PubMed]
- Zhao, H.; Chen, H.; Yang, M.; Li, Y. Facile fabrication of Poly (diallyldimethylammonium chloride)/Ti3C2Tx/poly (vinylidene fluoride) 3D hollow fiber membrane flexible humidity sensor and its application in the monitoring of health-related physiological activity. Sens. Actuators B Chem. 2022, 374, 132773. [Google Scholar] [CrossRef]
- Saini, B.; Singh, R.R.; Nayak, D.; Mukherjee, T.K. Biocompatible pH-Responsive Luminescent Coacervate Nanodroplets from Carbon Dots and Poly(diallyldimethylammonium chloride) toward Theranostic Applications. ACS Appl. Nano Mater. 2020, 3, 5826–5837. [Google Scholar] [CrossRef]
- Chen, X.; Li, Y.; Yuan, X.; Li, N.; He, W.; Liu, J. Synergistic effect between poly(diallyldimethylammonium chloride) and reduced graphene oxide for high electrochemically active biofilm in microbial fuel cell. Electrochim. Acta 2020, 359, 136949. [Google Scholar] [CrossRef]
- Celestino, G.G.; Henriques, R.R.; Shiguihara, A.L.; Constantino, V.R.L.; de Siqueira Melo, R.; Amim Júnior, J. Adsorption of gallic acid on nanoclay modified with poly(diallyldimethylammonium chloride). Environ. Sci. Pollut. Res. 2019, 26, 28444–28454. [Google Scholar] [CrossRef]
- Du, X.; Zhang, H.; Yuan, Y.; Wang, Z. Semi-interpenetrating network anion exchange membranes based on quaternized polyvinyl alcohol/poly(diallyldimethylammonium chloride). Green Energy Environ. 2021, 6, 743–750. [Google Scholar] [CrossRef]
- Essa, H.L.; Guirguis, H.A.; El-Sayed, M.M.H.; Rifaat, D.; Abdelfattah, M.S. Ultrasonically-Extracted Marine Polysaccharides as Potential Green Antioxidant Alternatives. 1st Int. Electron. Conf. Appl. Sci. 2020, 67, 23. [Google Scholar] [CrossRef]
- Yang, K.-R.; Tsai, M.-F.; Shieh, C.-J.; Arakawa, O.; Dong, C.-D.; Huang, C.-Y.; Kuo, C.-H. Ultrasonic-Assisted Extraction and Structural Characterization of Chondroitin Sulfate Derived from Jumbo Squid Cartilage. Foods 2021, 10, 2363. [Google Scholar] [CrossRef] [PubMed]
- Hung, L.D.; Nguyen, H.T.T.; Trang, V.T.D. Kappa carrageenan from the red alga Kappaphycus striatus cultivated at Vanphong Bay, Vietnam: Physicochemical properties and structure. J. Appl. Phycol. 2021, 33, 1819–1824. [Google Scholar] [CrossRef]
- Yuan, Y.; Shen, C.; Chen, J.; Ren, X. Synthesis and characterization of cross-linked quaternized chitosan/poly(diallyldimethylammonium chloride) blend anion-exchange membranes. Ionics 2018, 24, 1173–1180. [Google Scholar] [CrossRef]
- Kwak, S.H.; Kwon, S.-R.; Baek, S.; Lim, S.-M.; Joo, Y.-C.; Chung, T.D. Densely charged polyelectrolyte-stuffed nanochannel arrays for power generation from salinity gradient. Sci. Rep. 2016, 6, 26416. [Google Scholar] [CrossRef] [PubMed]
- Wilczewski, S.; Skórczewska, K.; Tomaszewska, J.; Lewandowski, K.; Szulc, J.; Runka, T. Manufacturing homogenous PVC/graphene nanocomposites using a novel dispersion agent. Polym. Test. 2020, 91, 106868. [Google Scholar] [CrossRef]
- Holkar, A.; Toledo, J.; Srivastava, S. Structure of nanoparticle-polyelectrolyte complexes: Effects of polyelectrolyte characteristics and charge ratio. AIChE J. 2021, 67, 12. [Google Scholar] [CrossRef]
- Ziółkowska, D.; Lamkiewicz, J.; Shyichuk, A. Determination of Sodium Dodecyl Sulfate via Turbidimetric Titration with Poly(Diallyldimethylammonium Chloride). J. Surfactants Deterg. 2020, 23, 913–920. [Google Scholar] [CrossRef]
- Ziółkowska, D.; Syrotynska, I.; Shyichuk, A.; Lamkiewicz, J. Determination of SLES in Personal Care Products by Colloid Titration with Light Reflection Measurements. Molecules 2021, 26, 2716. [Google Scholar] [CrossRef]
- Di Lorenzo, F.; Steiner, K.; Churakov, S.V. The effect of pH, ionic strength and the presence of Pb(II) on the formation of calcium carbonate from homogenous alkaline solutions at room temperature. Minerals 2021, 11, 783. [Google Scholar] [CrossRef]
- Lauer, A.R.; Durán-Olivencia, M.A.; Fernandez-Martinez, A.; van Driessche, A.E.S. Multistep nucleation compatible with a single energy barrier: Catching the non-classical culprit. Faraday Discuss. 2022, 235, 95–108. [Google Scholar] [CrossRef]
- Ha, H.T.; Cuong, D.X.; Thuy, L.H.; Thuan, P.T.; Tuyen, D.T.T.; Mo, V.T.; Dong, D.H. Carrageenan of Red Algae Eucheuma gelatinae: Extraction, Antioxidant Activity, Rheology Characteristics, and Physicochemistry Characterization. Molecules 2022, 27, 1268. [Google Scholar] [CrossRef]
- Bartlová, M.; Ziółkowska, D.; Pospiech, M.; Lamkiewicz, J.; Shyichuk, A. Detection and quantification of carrageenan in jelly candies using lectin histochemistry and photometric titration. Eur. Food Res. Technol. 2022, 248, 3071–3080. [Google Scholar] [CrossRef]


Publisher’s Note: MDPI stays neutral with regard to jurisdictional claims in published maps and institutional affiliations. |
© 2022 by the authors. Licensee MDPI, Basel, Switzerland. This article is an open access article distributed under the terms and conditions of the Creative Commons Attribution (CC BY) license (https://creativecommons.org/licenses/by/4.0/).
Share and Cite
Ziółkowska, D.; Lamkiewicz, J.; Shyichuk, A. Structure and Flocculation of Ion Associates of Carrageenan and Poly(diallyldimethylammonium chloride) Depending on the Component Ratio. Molecules 2022, 27, 8075. https://doi.org/10.3390/molecules27228075
Ziółkowska D, Lamkiewicz J, Shyichuk A. Structure and Flocculation of Ion Associates of Carrageenan and Poly(diallyldimethylammonium chloride) Depending on the Component Ratio. Molecules. 2022; 27(22):8075. https://doi.org/10.3390/molecules27228075
Chicago/Turabian StyleZiółkowska, Dorota, Jan Lamkiewicz, and Alexander Shyichuk. 2022. "Structure and Flocculation of Ion Associates of Carrageenan and Poly(diallyldimethylammonium chloride) Depending on the Component Ratio" Molecules 27, no. 22: 8075. https://doi.org/10.3390/molecules27228075
APA StyleZiółkowska, D., Lamkiewicz, J., & Shyichuk, A. (2022). Structure and Flocculation of Ion Associates of Carrageenan and Poly(diallyldimethylammonium chloride) Depending on the Component Ratio. Molecules, 27(22), 8075. https://doi.org/10.3390/molecules27228075