

Tin Oxide Based Hybrid Nanostructures for Efficient Gas Sensing


Abstract

1. Introduction
2. Gas Sensing Mechanism
3. Synthesis of Tin Oxide and Its Composites
4. Hydrothermal Method
5. Polymeric Citrate Precursor Method
6. Microemulsion or Reverse Micellar Method
7. Sol–Gel Method
8. Sensing Applications of Pure and SnO2-Based Composites
9. Sensing of CO, CH4, NO, NO2, NH3, SO2 and H2S by SnO2 Nanostructures
10. Conclusions, Challenges and Future Perspectives
Author Contributions
Funding
Institutional Review Board Statement
Informed Consent Statement
Data Availability Statement
Acknowledgments
Conflicts of Interest
References
- Tomchenko, A.A.; Harmer, G.P.; Marquis, B.T.; Allen, J.W. Semiconducting Metal Oxide Sensor Array for the Selective Detection of Combustion Gases. Sens. Actuators B Chem. 2003, 93, 126–134. [Google Scholar] [CrossRef]
- Kanan, S.M.; El-Kadri, O.M.; Abu-Yousef, I.A.; Kanan, M.C. Semiconducting Metal Oxide Based Sensors for Selective Gas Pollutant Detection. Sensors 2009, 9, 8158–8196. [Google Scholar] [CrossRef]
- Phul, R.; Perwez, M.; Ahmed, J.; Sardar, M.; Alshehri, S.M.; Alhokbany, N.; Majeed Khan, M.A.; Ahmad, T. Efficient Multifunctional Catalytic and Sensing Properties of Synthesized Ruthenium Oxide Nanoparticles. Catalysts 2020, 10, 780. [Google Scholar] [CrossRef]
- D’Arienzo, M.; Armelao, L.; Cacciamani, A.; Mari, C.M.; Polizzi, S.; Ruffo, R.; Scotti, R.; Testino, A.; Wahba, L.; Morazzoni, F. One-Step Preparation of SnO2 and Pt-Doped SnO2 as Inverse Opal Thin Films for Gas Sensing. Chem. Mater. 2010, 22, 4083–4089. [Google Scholar] [CrossRef]
- Gyger, F.; Hübner, M.; Feldmann, C.; Barsan, N.; Weimar, U. Nanoscale SnO2 Hollow Spheres and their Application as a Gas-Sensing Material. Chem. Mater. 2010, 22, 4821–4827. [Google Scholar] [CrossRef]
- Pandit, N.A.; Shahazad, M.; Ahmad, T. Structural Characterization and Gas Sensing Applications of Ultrafine ZrO2 nanospheres Using Low Temperature Solution Route. Mater. Today Proc. 2021, 36, 724–729. [Google Scholar] [CrossRef]
- Mehtab, A.; Banerjee, S.; Mao, Y.; Ahmad, T. Type-II CuFe2O4/Graphitic-Carbon Nitride Heterojunctions for High Efficiency Photocatalytic and Electrocatalytic Hydrogen Generation. ACS Appl. Mater. Interfaces 2022, 14, 44317–44329. [Google Scholar] [CrossRef]
- Long, J.; Xue, W.; Xie, X.; Gu, Q.; Zhou, Y.; Chi, Y.; Chen, W.; Ding, Z.; Wang, X. Sn2+ Dopant Induced Visible-Light Activity of SnO2 Nanoparticles for H2 Production. Catal. Commun. 2011, 16, 215–219. [Google Scholar] [CrossRef]
- Jain, S.K.; Fazil, M.; Pandit, N.A.; Ali, S.A.; Naaz, F.; Khan, H.; Mehtab, A.; Ahmed, J.; Ahmad, T. Modified, Solvo thermally Derived Cr-doped SnO2 Nanostructures for Enhanced Photocatalytic and Electrochemical Water Splitting Applications. ACS Omega 2022, 7, 14138–14147. [Google Scholar] [CrossRef]
- Jain, S.K.; Pandit, N.A.; Fazil, M.; Ali, S.A.; Ahmed, J.; Alshehri, S.M.; Mao, Y.; Ahmad, T. Chemical Fabrication, Structural Characterization and Photocatalytic Water Splitting Application of Sr-Doped SnO2 Nanoparticles. Nanotechnology 2022, 33, 355706. [Google Scholar] [CrossRef]
- Mehtab, A.; Alshehri, S.M.; Ahmad, T. Photocatalytic and Photoelectrocatalytic Water Splitting by Porous g-C3N4 Nanosheets for Hydrogen Generation. ACS Appl. Nano Mater. 2022, 5, 12656–12665. [Google Scholar] [CrossRef]
- Wen, Z.; Wang, Q.; Zhang, Q.; Li, J. In Situ Growth of Mesoporous SnO2 on Multiwalled Carbon Nanotubes: A Novel Composite with Porous-Tube Structure as Anode for Lithium Batteries. Adv. Funct. Mater. 2007, 17, 2772–2778. [Google Scholar] [CrossRef]
- Zhang, H.X.; Feng, C.; Zhai, Y.C.; Jiang, K.L.; Li, Q.Q.; Fan, S.S. Cross-Stacked Carbon Nanotube Sheets Uniformly Loaded with SnO2 Nanoparticles: A Novel Binder-Free and High-Capacity Anode Material for Lithium-Ion Batteries. Adv. Mater. 2009, 21, 2299–2304. [Google Scholar] [CrossRef]
- Ding, S.; Luan, D.; Boey, F.Y.C.; Chen, J.S.; Lou, X.W. SnO2 Nanosheets Grown on Graphene Sheets with Enhanced Lithium Storage Properties. Chem. Commun. 2011, 47, 7155–7157. [Google Scholar] [CrossRef]
- Qian, J.; Liu, P.; Xiao, Y.; Jiang, Y.; Cao, Y.; Ai, X.; Yang, H. TiO2-Coated Multilayered SnO2 Hollow Microspheres for Dye-Sensitized Solar Cells. Adv. Mater. 2009, 21, 3663–3667. [Google Scholar] [CrossRef]
- Prasittichai, C.; Hupp, J.T. Surface Modification of SnO2Photoelectrodes in Dye-Sensitized Solar Cells: Significant Improvements in Photovoltage via Al2O3 Atomic Layer Deposition. J. Phys. Chem. Lett. 2010, 1, 1611–1615. [Google Scholar] [CrossRef]
- Snaith, H.J.; Stavrinadis, A.; Docampo, P.; Watt, A.A.R. Lead-Sulphide Quantum-Dot Sensitization of Tin Oxide Based Hybrid Solar Cells. Sol. Energy 2011, 85, 1283–1290. [Google Scholar] [CrossRef]
- Kay, A.; Grätzel, M. Dye-Sensitized Core-Shell Nanocrystals: Improved Efficiency of Mesoporous Tin Oxide Electrodes Coated with a Thin Layer of an Insulating Oxide. Chem. Mater. 2002, 14, 2930–2935. [Google Scholar] [CrossRef]
- Kincaid, R.; Johnson, K.; Mount, G.H.; Yonge, D.; Havig, J.; Westberg, H.; Lamb, B.; Rumburg, B. Measurement of Atmospheric Ammonia at a Dairy Using Differential Optical Absorption Spectroscopy in the Mid-Ultraviolet. Atmos. Environ. 2002, 36, 1799–1810. [Google Scholar]
- Sauvan, M.; Tournier, G.; Lalauze, R.; Pupier, C.; Pijolat, C. Gas Detection for Automotive Pollution Control. Sens. Actuators B Chem. 2002, 59, 195–202. [Google Scholar]
- Kohl, D. Function and Applications of Gas Sensors. J. Phys. D Appl. Phys. 2001, 34, R125–R149. [Google Scholar] [CrossRef]
- Ampuero, S.; Bosset, J.O. The Electronic Nose Applied to Dairy Products: A Review. Sens. Actuators B Chem. 2003, 94, 1–12. [Google Scholar] [CrossRef]
- Ahmed, J.; Ahamad, T.; Alhokbany, N.; Ahmad, T.; Hussain, A.; Salman, E.; Al-Farraj, S.; Alshehri, S.M. Molten Salts Derived Copper Tungstate Nanoparticles as Bifunctional Electro-catalysts for Electrolysis of Water and Supercapacitors. ChemElectroChem 2018, 5, 3938–3945. [Google Scholar] [CrossRef]
- Farooq, U.; Phul, R.; Alshehri, S.M.; Ahmed, J.; Ahmad, T. Electrocatalytic and Enhanced Photocatalytic Applications of Sodium Niobate Nanoparticles Developed by Citrate Precursor Route. Sci. Rep. 2019, 9, 4488. [Google Scholar] [CrossRef] [PubMed]
- Jain, S.K.; Fazil, M.; Naaz, F.; Pandit, N.A.; Ahmed, J.; Alshehri, S.M.; Mao, Y.; Ahmad, T. Silver-Doped SnO2 Nanostructures for Photocatalytic Water Splitting and Catalytic Nitrophenol Reduction. New J. Chem. 2022, 46, 2846–2857. [Google Scholar] [CrossRef]
- Periyasamy, M.; Kar, A. Modulating the Properties of SnO2 Nanocrystals: Morphological Effects on Structural, Photoluminescence, Photocatalytic, Electrochemical and Gas Sensing Properties. J. Mater. Chem. C 2020, 8, 4604–4635. [Google Scholar] [CrossRef]
- Mehtab, A.; Ahmed, J.; Alshehri, S.M.; Mao, Y.; Ahmad, T. Rare Earth Doped Metal Oxide Nanoparticles for Photocatalysis: A Perspective. Nanotechnology 2022, 33, 142001. [Google Scholar] [CrossRef]
- Ahmad, T.; Ganguli, A.K. Reverse micellar route to nanocrystalline titanates (SrTiO3, Sr2TiO4 and PbTiO3): Structural aspects and dielectric properties. J. Am. Ceram. Soc. 2006, 89, 1326–1332. [Google Scholar] [CrossRef]
- Ali, S.A.; Ahmad, T. Chemical Strategies in Molybdenum based Chalcogenides Nanostructures for Photocatalysis. Int. J. Hydrogen Energy 2022, 47, 29255–29283. [Google Scholar] [CrossRef]
- Lu, S.; Zhang, Y.; Liu, J.; Li, H.Y.; Hu, Z.; Luo, X.; Gao, N.; Zhang, B.; Jiang, J.; Zhong, A.; et al. Sensitive H2 Gas Sensors Based on SnO2 Nanowires. Sens. Actuators B Chem. 2021, 345, 130334. [Google Scholar] [CrossRef]
- He, T.; Liu, W.; Lv, T.; Ma, M.; Liu, Z.; Vasiliev, A.; Li, X. MXene/SnO2 Heterojunction Based Chemical Gas Sensors. Sens. Actuators B Chem. 2021, 329, 129275. [Google Scholar] [CrossRef]
- Choi, M.S.; Mirzaei, A.; Na, H.G.; Kim, S.; Kim, D.E.; Lee, K.H.; Jin, C.; Choi, S.W. Facile and Fast Decoration of SnO2 Nanowires with Pd Embedded SnO2-x Nanoparticles for Selective NO2 Gas Sensing. Sens. Actuators B Chem. 2021, 340, 129984. [Google Scholar] [CrossRef]
- Kim, J.H.; Kim, J.Y.; Mirzaei, A.; Kim, H.W.; Kim, S.S. Synergistic Effects of SnO2 and Au Nanoparticles Decorated on WS2 Nanosheets for Flexible, Room-Temperature CO Gas Sensing. Sens. Actuators B Chem. 2021, 332, 129493. [Google Scholar] [CrossRef]
- Sharma, B.; Sharma, A.; Myung, J.H. Selective Ppb-Level NO2 Gas Sensor Based on SnO2-Boron Nitride Nanotubes. Sens. Actuators B Chem. 2021, 331, 129464. [Google Scholar] [CrossRef]
- Bai, J.; Wang, C.C.; Liu, K.; Wang, H.; Liu, Y.; Liu, F.; Suo, H.; Liang, X.; Zhang, C.; Liu, F.; et al. Enhanced Gas Sensing Performance Based on the PtCu Octahedral Alloy Nanocrystals Decorated SnO2 Nanoclusters. Sens. Actuators B Chem. 2021, 330, 129375. [Google Scholar] [CrossRef]
- Nejati-Moghadam, L.; Esmaeili Bafghi-Karimabad, A.; Salavati-Niasari, M.; Safardoust, H. Synthesis and Characterization of SnO2 Nanostructures Prepared by a Facile Precipitation Method. J. Nanostr. 2015, 5, 47–53. [Google Scholar]
- Liu, H.; Gong, S.; Hu, Y.; Zhao, J.; Liu, J.; Zheng, Z.; Zhou, D. Tin Oxide Nanoparticles Synthesized by Gel Combustion and Their Potential for Gas Detection. Ceram. Int. 2009, 35, 961–966. [Google Scholar] [CrossRef]
- Tan, Y.; Li, C.; Wang, Y.; Tang, J.; Ouyang, X. Fast-Response and High Sensitivity Gas Sensors Based on SnO2 hollow Spheres. Thin Solid Film. 2008, 516, 7840–7843. [Google Scholar] [CrossRef]
- Wang, Y.-D.; Ma, C.L.; Sun, X.D.; Li, H.D. Preparation of Nanocrystalline Metal Oxide Powders with the Surfactant-Mediated Method. Inorg. Chem. Commun. 2002, 5, 751–755. [Google Scholar] [CrossRef]
- Lou, C.; Yang, C.; Zheng, W.; Liu, X.; Zhang, J. Atomic Layer Deposition of ZnO on SnO2 Nanospheres for Enhanced Formaldehyde Detection. Sens. Actuators B Chem. 2021, 329, 129218. [Google Scholar] [CrossRef]
- Zhang, Y.; Wang, C.; Zhao, L.; Liu, F.; Sun, X.; Hu, X.; Lu, G. Preparation of Ce-Doped SnO2 Cuboids with Enhanced 2-Butanone Sensing Performance. Sens. Actuators B Chem. 2021, 341, 130039. [Google Scholar] [CrossRef]
- Singh, S.; Sattigeri, R.M.; Kumar, S.; Jha, P.K.; Sharma, S. Superior Room-Temperature Ammonia Sensing Using a Hydrothermally Synthesized MoS2/SnO2 Composite. ACS Omega 2021, 6, 11602–11613. [Google Scholar] [CrossRef]
- Guo, C.; Cao, M.; Hu, C. A Novel and Low-Temperature Hydrothermal Synthesis of SnO2 nanorods. Inorg. Chem. Commun. 2004, 7, 929–931. [Google Scholar] [CrossRef]
- Hieda, K.; Hyodo, T.; Shimizu, Y.; Egashira, M. Preparation of Porous Tin Dioxide Powder by Ultrasonic Spray Pyrolysis and Their Application to Sensor Materials. Sens. Actuators B Chem. 2008, 133, 144–150. [Google Scholar] [CrossRef]
- Wang, Y.; Wu, X.; Li, Y.; Zhou, Z. Mesostructured SnO2 as Sensing Material for Gas Sensors. Solid State Electron. 2004, 48, 627–632. [Google Scholar] [CrossRef]
- Im, J.H.; Lee, J.H.; Park, D.W. Synthesis of Nano-Sized Tin Oxide Powder by Argon Plasma Jet at Atmospheric Pressure. Surf. Coatings Technol. 2008, 202, 5471–5475. [Google Scholar] [CrossRef]
- Wang, L.; Ma, S.; Xu, X.; Li, J.; Yang, T.; Cao, P.; Yun, P.; Wang, S.; Han, T. Oxygen Vacancy-Based Tb-Doped SnO2 Nanotubes as an Ultra-Sensitive Sensor for Ethanol Detection. Sens. Actuators B Chem. 2021, 344, 130111. [Google Scholar] [CrossRef]
- Zhu, X.; Zhang, X.; Chang, X.; Li, J.; Pan, L.; Jiang, Y.; Gao, W.; Gao, C.; Sun, S. Metal-Organic Framework-Derived Porous SnO2 Nanosheets with Grain Sizes Comparable to Debye Length for Formaldehyde Detection with High Response and Low Detection Limit. Sens. Actuators B Chem. 2021, 347, 130599. [Google Scholar] [CrossRef]
- Vuong, D.D.; Hien, V.X.; Trung, K.Q.; Chien, N.D. Synthesis of SnO2 Micro-Spheres, Nano-Rods and Nano-Flowers via Simple Hydrothermal Route. Phys. E Low-Dimens. Syst. Nanostructures 2011, 44, 345–349. [Google Scholar] [CrossRef]
- Guo, Y.Q.; Tan, R.Q.; Li, Y.; Song, W.J. Solution Route to SnO2 Crystals with Controllable Morphology. Appl. Surf. Sci. 2012, 258, 1958–1963. [Google Scholar] [CrossRef]
- Sahay, P.P.; Mishra, R.K.; Pandey, S.N.; Jha, S.; Shamsuddin, M. AC Transport Properties of Nanocrystalline SnO2 semiconductor. Ceram. Int. 2012, 38, 1281–1286. [Google Scholar] [CrossRef]
- Zampolli, S.; Elmi, I.; Ahmed, F.; Passini, M.; Cardinali, G.C.; Nicoletti, S.; Dori, L. An Electronic Nose Based on Solid State Sensor Arrays for Low-Cost Indoor Air Quality Monitoring Applications. Sens. Actuators B Chem. 2004, 101, 39–46. [Google Scholar] [CrossRef]
- Bon, D.M.; Ulbrich, I.M.; De Gouw, J.A.; Warneke, C.; Kuster, W.C.; Alexander, M.L.; Baker, A.; Beyersdorf, A.J.; Blake, D.; Fall, R.; et al. Measurements of Volatile Organic Compounds at a Suburban Ground Site (T1) in Mexico City during the MILAGRO 2006 Campaign: Measurement Comparison, Emission Ratios, and Source Attribution. Atmos. Chem. Phys. 2011, 11, 2399–2421. [Google Scholar] [CrossRef]
- Dong, Y.; Gao, W.; Zhou, Q.; Zheng, Y.; You, Z. Characterization of the Gas Sensors Based on Polymer-Coated Resonant Microcantilevers for the Detection of Volatile Organic Compounds. Anal. Chim. Acta 2010, 671, 85–91. [Google Scholar] [CrossRef] [PubMed]
- Yamazoe, N.; Sakai, G.; Shimanoe, K. Oxide Semiconductor Gas Sensors. Catal. Surv. Asia 2003, 7, 63–75. [Google Scholar] [CrossRef]
- Wang, C.; Yin, L.; Zhang, L.; Xiang, D.; Gao, R. Metal Oxide Gas Sensors: Sensitivity and Influencing Factors. Sensors 2010, 10, 2088–2106. [Google Scholar] [CrossRef]
- Tricoli, A.; Righettoni, M.; Teleki, A. Semiconductor Gas Sensors: Dry Synthesis and application. Angew. Chemie-Int. Ed. 2010, 49, 7632–7659. [Google Scholar] [CrossRef]
- Nascimento, E.P.; Firmino, H.C.T.; Santos, A.M.C.; Sales, H.B.; Silva, V.D.; Macedo, D.A.; Neves, G.A.; Medeiros, E.S.; Menezes, R.R. Facile Synthesis of Hollow F-Doped SnO2 Nanofibers and Their Efficiency in Ethanol Sensing. J. Am. Ceram. Soc. 2021, 104, 1297–1308. [Google Scholar] [CrossRef]
- Yan, W.; Liu, Y.; Shao, G.; Zhu, K.; Cui, S.; Wang, W.; Shen, X. Chemical Surface Adsorption and Trace Detection of Alcohol Gas in Graphene Oxide-Based Acid-Etched SnO2 Aerogels. ACS Appl. Mater. Interfaces 2021, 13, 20467–20478. [Google Scholar] [CrossRef]
- Cai, Z.; Goo, E.; Park, S. Hydrogen sensing performance and its enhanced sensing mechanisms of hollow structured SnO2 nanospheres activated by noble metal nanoparticles. J. Mater. Res. Technol. 2021, 15, 1716–1731. [Google Scholar] [CrossRef]
- Cai, Z.; Goo, E.; Park, S. Synthesis of Tin Dioxide (SnO2) Hollow Nanospheres and Its Ethanol-Sensing Performance Augmented by Gold Nanoparticle Decoration. J. Alloys Compd. 2021, 883, 160868. [Google Scholar] [CrossRef]
- Sohal, M.K.; Mahajan, A.; Gasso, S.; Nahirniak, S.V.; Dontsova, T.A.; Singh, R.C. Modification of SnO2 Surface Oxygen Vacancies through Er Doping for Ultralow NO2 Detection. Mater. Res. Bull. 2021, 133, 111051. [Google Scholar] [CrossRef]
- Barsan, N.; Schweizer-Berberich, M.; Göpel, W. Fundamental and Practical Aspects in the Design of Nanoscaled SnO2 Gas Sensors: A Status Report. Fresenius J. Anal. Chem. 1999, 365, 287–304. [Google Scholar] [CrossRef]
- Franke, M.E.; Koplin, T.J.; Simon, U. Metal and Metal Oxide Nanoparticles in Chemiresistors: Does the Nanoscale Matter? Small 2006, 2, 36–50. [Google Scholar] [CrossRef] [PubMed]
- Ahmad, T.; Ganguli, A.K. Structural and Dielectric Characterization of Nanocrystalline (Ba,Pb) ZrO3 Developed by Reverse Micellar Synthesis. J. Am. Ceram. Soc. 2006, 89, 3140–3146. [Google Scholar] [CrossRef]
- Alshehri, S.M.; Ahmed, J.; Ahamad, T.; Alhokbany, N.; Arunachalam, P.; Al-Mayouf, A.M.; Ahmad, T. Synthesis, Characterization, Multifunctional Electrochemical (OGR/ORR/SCs) and Photodegradable Activities of ZnWO4 Nanobricks. J. Solgel Sci. Technol. 2018, 87, 137–146. [Google Scholar] [CrossRef]
- Ahmad, T.; Ganguli, A.K. Synthesis of nanometer-sized particles of bariumorthotitanate prepared through a modified reverse micellar route: Structural characterization, phase stability and dielectric properties. J. Mater. Res. 2004, 19, 2905–2912. [Google Scholar] [CrossRef]
- Ahmad, T.; Ganguly, A.; Ahmed, J.; Ganguli, A.K.; Alhartomy, O.A.A. Nanorods of Transition Metal Oxalates: A Versatile Route to the Oxide Nanoparticles. Arab. J. Chem. 2011, 4, 125–134. [Google Scholar] [CrossRef]
- Sun, P.; Zhao, W.; Cao, Y.; Guan, Y.; Sun, Y.; Lu, G. Porous SnO2 Hierarchical Nanosheets: Hydrothermal Preparation, Growth Mechanism, and Gas Sensing Properties. Cryst. Eng. Comm. 2011, 13, 3718–3724. [Google Scholar] [CrossRef]
- Chiu, H.C.; Yeh, C.S. Hydrothermal Synthesis of SnO2 Nanoparticles and their Gas-Sensing of Alcohol. J. Phys. Chem. C 2007, 111, 7256–7259. [Google Scholar] [CrossRef]
- Suematsu, K.; Shin, Y.; Hua, Z.; Yoshida, K.; Yuasa, M.; Kida, T.; Shimanoe, K. Nanoparticle Cluster Gas Sensor: Controlled Clustering of SnO2 Nanoparticles for Highly Sensitive Toluene Detection. ACS Appl. Mater. Interfaces 2014, 6, 5319–5326. [Google Scholar] [CrossRef] [PubMed]
- Shi, L.; Lin, H. Preparation of Band Gap Tunable SnO2 Nanotubes and their Ethanol Sensing Properties. Langmuir 2011, 27, 3977–3981. [Google Scholar] [CrossRef] [PubMed]
- Xue, X.; Chen, Z.; Ma, C.; Xing, L.; Chen, Y.; Wang, Y.; Wang, T. One-Step Synthesis and Gas-Sensing Characteristics of Uniformly Loaded Pt@SnO2 Nanorods. J. Phys. Chem. C 2010, 114, 3968–3972. [Google Scholar] [CrossRef]
- Xu, G.; Zhang, Y.W.; Sun, X.; Xu, C.L.; Yan, C.H. Synthesis, Structure, Texture, and CO Sensing Behavior of Nanocrystalline Tin Oxide Doped with Scandia. J. Phys. Chem. B 2005, 109, 3269–3278. [Google Scholar] [CrossRef]
- Li, H.; Xie, W.; Ye, T.; Liu, B.; Xiao, S.; Wang, C.; Wang, Y.; Li, Q.; Wang, T. Temperature-Dependent Abnormal and Tunable p-n Response of Tungsten Oxide-Tin Oxide Based Gas Sensors. ACS Appl. Mater. Interfaces 2015, 7, 24887–24894. [Google Scholar] [CrossRef]
- Jiang, L.Y.; Wu, X.L.; Guo, Y.G.; Wan, L.J. SnO2-Based Hierarchical Nanomicrostructures: Facile Synthesis and Their Applications in Gas Sensors and Lithium-Ion Batteries. J. Phys. Chem. C 2009, 113, 14213–14219. [Google Scholar] [CrossRef]
- Hidalgo, P.; Castro, R.H.R.; Coelho, A.C.V.; Gouvêa, D. Surface Segregation and Consequent SO2 Sensor Response in SnO2-NiO. Chem. Mater. 2005, 17, 4149–4153. [Google Scholar] [CrossRef]
- Leite, E.R.; Weber, I.T.; Longo, E.; Varela, J.A. A New Method to Control Particle Size and Particle Size Distribution of SnO2 Nanoparticles for Gas Sensor Applications. Adv. Mater. 2000, 12, 965–968. [Google Scholar] [CrossRef]
- Ganguli, A.K.; Ahmad, T.; Vaidya, S.; Ahmed, J. Microemulsion Route to the Synthesis of Nanoparticles. Pure Appl. Chem. 2008, 80, 2451–2477. [Google Scholar] [CrossRef]
- Ahmad, T.; Ubaidullah, M.; Shahazad, M.; Kumar, D.; Al-Hartomy, O.A. Reverse Micellar Synthesis, Structural Characterization and Dielectric Properties of Sr-doped BaZrO3Nanoparticles. Mater. Chem. Phys. 2017, 185, 31–38. [Google Scholar] [CrossRef]
- Ahmed, J.; Vaidya, S.; Ahmad, T.; Sujatha Devi, P.; Das, D.; Ganguli, A.K. Tin Dioxide Nanoparticles: Reverse Micellar Synthesis and Gas Sensing Properties. Mater. Res. Bull. 2008, 43, 264–271. [Google Scholar] [CrossRef]
- Zhang, D.F.; Sun, L.D.; Xu, G.; Yan, C.H. Size-Controllable One-Dimensional SnO2 Nanocrystals: Synthesis, Growth Mechanism, and Gas Sensing Property. Phys. Chem. Chem. Phys. 2006, 8, 4874–4880. [Google Scholar] [CrossRef] [PubMed]
- Liangyuan, C.; Shouli, B.; Guojun, Z.; Dianqing, L.; Aifan, C.; Liu, C.C. Synthesis of ZnO-SnO2 Nanocomposites by Microemulsion and Sensing Properties for NO2. Sens. Actuators B Chem. 2008, 134, 360–366. [Google Scholar] [CrossRef]
- Huang, J.; Matsunaga, N.; Shimanoe, K.; Yamazoe, N.; Kunitake, T. Nanotubular SnO2 Templated by Cellulose Fibers: Synthesis and Gas Sensing. Chem. Mater. 2005, 17, 3513–3518. [Google Scholar] [CrossRef]
- Zhang, J.; Gao, L. Synthesis and Characterization of Nanocrystalline Tin Oxide by Sol-Gel Method. J. Solid State Chem. 2004, 177, 1425–1430. [Google Scholar] [CrossRef]
- Rella, R.; Serra, A.; Siciliano, P.; Vasanelli, L.; De, G.; Licciulli, A. CO Sensing Properties of SnO2 Thin Films Prepared by the Sol-Gel Process. Thin Solid Films 1997, 304, 339–343. [Google Scholar] [CrossRef]
- Han, X.; Jin, M.; Xie, S.; Kuang, Q.; Jiang, Z.; Jiang, Y.; Xie, Z.; Zheng, L. Synthesis of Tin Dioxide Octahedral Nanoparticles with Exposed High-Energy {221} Facets and Enhanced Gas-Sensing Properties. Angew. Chemie-Int. Ed. 2009, 48, 9180–9183. [Google Scholar] [CrossRef]
- Park, J.S.; Jeong, J.K.; Chung, H.J.; Mo, Y.G.; Kim, H.D. Electronic Transport Properties of Amorphous Indium-Gallium-Zinc Oxide Semiconductor upon Exposure to Water. Appl. Phys. Lett. 2008, 92, 95–98. [Google Scholar] [CrossRef]
- Yang, H.X.; Qian, J.F.; Chen, Z.X.; Ai, X.P.; Cao, Y.L. Multilayered Nanocrystalline SnO2 Hollow Microspheres Synthesized by Chemically Induced Self-Assembly in the Hydrothermal Environment. J. Phys. Chem. C 2007, 111, 14067–14071. [Google Scholar] [CrossRef]
- Manno, D.; Micocci, G.; Rella, R.; Serra, A.; Taurino, A.; Tepore, A. Titanium Oxide Thin Films for NH3 monitoring: Structural and Physical Characterizations. J. Appl. Phys. 1997, 82, 54–59. [Google Scholar] [CrossRef]
- Li, G.J.; Kawi, S. Synthesis, Characterization and Sensing Application of Novel Semiconductor Oxides. Talanta 1998, 45, 759–766. [Google Scholar] [CrossRef]
- Yamazoe, N.; Fuchigami, J.; Kishikawa, M.; Seiyama, T. Interactions of Tin Oxide Surface with O2, H2O and H2. Surf. Sci. 1979, 86, 335–344. [Google Scholar] [CrossRef]
- Dolbec, R.; El Khakani, M.A. Sub-Ppm Sensitivity towards Carbon Monoxide by Means of Pulsed Laser Deposited SnO2: Pt Based Sensors. Appl. Phys. Lett. 2007, 90, 173114. [Google Scholar] [CrossRef]
- Esfandyarpour, B.; Mohajerzadeh, S.; Famini, S.; Khodadadi, A.; AslSoleimani, E. High Sensitivity Pt-doped SnO2 Gas Sensors Fabricated Using Sol-Gel Solution on Micromachined (1 0 0) Si Substrates. Sens. Actuators B Chem. 2004, 100, 190–194. [Google Scholar] [CrossRef]
- Ménini, P.; Parret, F.; Guerrero, M.; Soulantica, K.; Erades, L.; Maisonnat, A.; Chaudret, B. CO Response of a Nanostructured SnO2 Gas Sensor Doped with Palladium and Platinum. Sens. Actuators B Chem. 2004, 103, 111–114. [Google Scholar] [CrossRef]
- Zhang, S.; Zhang, P.; Wang, Y.; Ma, Y.; Zhong, J.; Sun, X. Facile Fabrication of a Well-Ordered Porous Cu-Doped SnO2 thin Film for H2S Sensing. ACS Appl. Mater. Interfaces 2014, 6, 14975–14980. [Google Scholar] [CrossRef]
- Zhang, W.H.; Zhang, W.D. De Fabrication of SnO2-ZnO Nanocomposite Sensor for Selective Sensing of Trimethylamine and the Freshness of Fishes. Sens. Actuators B Chem. 2008, 134, 403–408. [Google Scholar] [CrossRef]
- Chen, A.; Huang, X.; Tong, Z.; Bai, S.; Luo, R.; Liu, C.C. Preparation, Characterization and Gas-Sensing Properties of SnO2-In2O3 Nanocomposite Oxides. Sens. Actuators B Chem. 2006, 115, 316–321. [Google Scholar] [CrossRef]
- Wang, C.; Ge, M.; Xu, X.; Zhou, Y.; Zhang, Z. Large-Scale Synthesis of SnO2 Nanosheets with High Lithium Storage Capacity. J. Am. Chem. Soc. 2010, 132, 46–47. [Google Scholar] [CrossRef]
- Lou, X.W.; Yuan, C.; Archer, L.A. Shell-by-Shell Synthesis of Tin Oxide Hollow Colloids with Nanoarchitectured Walls: Cavity Size Tuning and Functionalization. Small 2007, 3, 261–265. [Google Scholar] [CrossRef]
- Mehrabi Matin, B.; Mortazavi, Y.; Khodadadi, A.A.; Abbasi, A.; Anaraki Firooz, A. Alkaline- and Template-Free Hydrothermal Synthesis of Stable SnO2 Nanoparticles and Nanorods for CO and Ethanol Gas Sensing. Sens. Actuators B Chem. 2010, 151, 140–145. [Google Scholar] [CrossRef]
- Niu, M.; Huang, F.; Cui, L.; Huang, P.; Yu, Y.; Wang, Y.N. Hydrothermal Synthesis, Structural Characteristics, and Enhanced Photocatalysis of SnO2/α-Fe2O3 Semiconductor Nano heterostructures. ACS Nano 2010, 4, 681–688. [Google Scholar] [CrossRef] [PubMed]
- Li, Y.; Guo, Y.; Tan, R.; Cui, P.; Li, Y.; Song, W. Synthesis of SnO2 Nano-Sheets by a Template-Free Hydrothermal Method. Mater. Lett. 2009, 63, 2085–2088. [Google Scholar] [CrossRef]
- Talebian, N.; Jafarinezhad, F. Morphology-Controlled Synthesis of SnO2 Nanostructures Using Hydrothermal Method and Their Photocatalytic Applications. Ceram. Int. 2013, 39, 8311–8317. [Google Scholar] [CrossRef]
- Firooz, A.A.; Mahjoub, A.R.; Khodadadi, A.A. Preparation of SnO2 Nanoparticles and Nanorods by Using a Hydrothermal Method at Low Temperature. Mater. Lett. 2008, 62, 1789–1792. [Google Scholar] [CrossRef]
- Lupan, O.; Chow, L.; Chai, G.; Schulte, A.; Park, S.; Heinrich, H. A Rapid Hydrothermal Synthesis of Rutile SnO2 Nanowires. Mater. Sci. Eng. B Solid-State Mater. Adv. Technol. 2009, 157, 101–104. [Google Scholar] [CrossRef]
- Du, F.; Guo, Z.; Li, G. Hydrothermal Synthesis of SnO2 Hollow Microspheres. Mater. Lett. 2005, 59, 2563–2565. [Google Scholar] [CrossRef]
- Lupan, O.; Chow, L.; Chai, G.; Heinrich, H.; Park, S.; Schulte, A. Synthesis of One-Dimensional SnO2 Nanorods via a Hydrothermal Technique. Phys. E Low-Dimens. Syst. Nanostructures 2009, 41, 533–536. [Google Scholar] [CrossRef]
- Lou, X.W.; Chen, J.S.; Chen, P.; Archer, L.A. One-Pot Synthesis of Carbon-Coated SnO2 Nanocolloids with Improved Reversible Lithium Storage Properties. Chem. Mater. 2009, 21, 2868–2874. [Google Scholar] [CrossRef]
- Zhu, H.; Yang, D.; Yu, G.; Zhang, H.; Yao, K. A Simple Hydrothermal Route for Synthesizing SnO2 Quantum Dots. Nanotechnology 2006, 17, 2386–2389. [Google Scholar] [CrossRef]
- Zhang, D.F.; Sun, L.D.; Yin, J.L.; Yan, C.H. Low-Temperature Fabrication of Highly Crystalline SnO2 Nanorods. Adv. Mater. 2003, 15, 1022–1025. [Google Scholar] [CrossRef]
- Jayalakshmi, M.; Rao, M.M.; Venugopal, N.; Kim, K.B. Hydrothermal Synthesis of SnO2-V2O5 Mixed Oxide and Electrochemical Screening of Carbon Nano-Tubes (CNT), V2O5, V2O5-CNT, and SnO2-V2O5-CNT Electrodes for Supercapacitor Applications. J. Power Sources 2007, 166, 578–583. [Google Scholar] [CrossRef]
- Dou, X.; Sabba, D.; Mathews, N.; Wong, L.H.; Lam, Y.M.; Mhaisalkar, S. Hydrothermal Synthesis of High Electron Mobility Zn-Doped SnO2Nanoflowers as Photoanode Material for Efficient Dye-Sensitized Solar Cells. Chem. Mater. 2011, 23, 3938–3945. [Google Scholar] [CrossRef]
- Zhang, Y.C.; Yao, L.; Zhang, G.; Dionysiou, D.D.; Li, J.; Du, X. One-Step Hydrothermal Synthesis of High-Performance Visible-Light-Driven SnS2/SnO2NanoheterojunctionPhotocatalyst for the Reduction of Aqueous Cr(VI). Appl. Catal. B Environ. 2014, 144, 730–738. [Google Scholar] [CrossRef]
- Zhao, B.; Shao, G.; Fan, B.; Li, W.; Pian, X.; Zhang, R. Enhanced Electromagnetic Wave Absorption Properties of Ni-SnO2 Core-Shell Composites Synthesized by a Simple Hydrothermal Method. Mater. Lett. 2014, 121, 118–121. [Google Scholar] [CrossRef]
- Xue, X.; Xing, L.; Chen, Y.; Shi, S.; Wang, Y.; Wang, T. Synthesis and H2S Sensing Properties of CuO-SnO2 Core/Shell PN-Junction Nanorods. J. Phys. Chem. C 2008, 4, 12157–12160. [Google Scholar] [CrossRef]
- Qin, L.; Xu, J.; Dong, X.; Pan, Q.; Cheng, Z.; Xiang, Q.; Li, F. The Template-Free Synthesis of Square-Shaped SnO2 Nanowires: The Temperature Effect and Acetone Gas Sensors. Nanotechnology 2008, 19, 185705. [Google Scholar] [CrossRef]
- Wang, J.; Du, N.; Zhang, H.; Yu, J.; Yang, D. Large-Scale Synthesis of SnO2 Nanotube Arrays as High-Performance Anode Materials of Li-Ion Batteries. J. Phys. Chem. C 2011, 115, 11302–11305. [Google Scholar] [CrossRef]
- He, Y.; Li, Y.; Yu, J.; Qian, Y. Chemical Control Synthesis of Nanocrystalline SnO2 by Hydrothermal Reaction. Mater. Lett. 1999, 40, 23–26. [Google Scholar] [CrossRef]
- Wang, M.; Gao, Y.; Dai, L.; Cao, C.; Guo, X. Influence of Surfactants on the Morphology of SnO2 Nanocrystals Prepared via a Hydrothermal Method. J. Solid State Chem. 2012, 189, 49–56. [Google Scholar] [CrossRef]
- Kim, C.; Noh, M.; Choi, M.; Cho, J.; Park, B. Critical Size of a Nano SnO2 Electrode for Li-Secondary Battery. Chem. Mater. 2005, 17, 3297–3301. [Google Scholar] [CrossRef]
- Lin, Y.S.; Duh, J.G.; Hung, M.H. Shell-by-Shell Synthesis and Applications of Carbon-Coated SnO2 Hollow Nanospheres in Lithium-Ion Battery. J. Phys. Chem. C 2010, 114, 13136–13141. [Google Scholar] [CrossRef]
- Ahmad, T.; Khatoon, S.; Coolahan, K. Optical and Magnetic Properties of Sn1-xMnxO2 Dilute Magnetic Semiconductor Nanoparticles. J. Alloys Compd. 2014, 615, 263–269. [Google Scholar] [CrossRef]
- Ahmad, T.; Khatoon, S. Structural Characterization and Properties of Nanocrystalline Sn1-xCoxO2 Based Dilute Magnetic Semiconductors. J. Mater. Res. 2015, 30, 1611–1618. [Google Scholar] [CrossRef]
- Ahmad, T.; Khatoon, S.; Coolahan, K. Structural, Optical, and Magnetic Properties of Nickel-Doped Tin Dioxide Nanoparticles Synthesized by Solvothermal Method. J. Am. Ceram. Soc. 2016, 99, 1207–1211. [Google Scholar] [CrossRef]
- Murase, K.; Morrison, K.L.; Tam, P.Y.; Stafford, R.L.; Jurnak, F.; Weiss, G.A. EF-Tu Binding Peptides Identified, Dissected, and Affinity Optimized by Phage Display GDP Conformation of EF-Tu. Because EF-Tu Is Abundant in the Cell, Other Functions Have Been Suggested, Particularly during Periods of Cellular Stress When Protein Syn-G. Chem. Biol. 2003, 10, 161–168. [Google Scholar] [CrossRef]
- Cassia-Santos, M.R.; Souza, A.G.; Soledade, L.E.B.; Varela, J.A.; Longo, E. Thermal and Structural Investigation of (Sn1-xTix)O2 Obtained by the Polymeric Precursor Method. J. Therm. Anal. Calorim. 2005, 79, 415–420. [Google Scholar] [CrossRef]
- López Morales, F.; Zayas, T.; Contreras, O.E.; Salgado, L. Effect of Sn Precursor on the Synthesis of SnO2 and Sb-Doped SnO2 Particles via Polymeric Precursor Method. Front. Mater. Sci. 2013, 7, 387–395. [Google Scholar] [CrossRef]
- Rodrigues, E.C.P.E.; Olivi, P. Preparation and Characterization of Sb-Doped SnO2 Films with Controlled Stoichiometry from Polymeric Precursors. J. Phys. Chem. Solids 2003, 64, 1105–1112. [Google Scholar] [CrossRef]
- Carreo, N.L.V.; Maciel, A.P.; Leite, E.R.; Lisboa-Filho, P.N.; Longo, E.; Valentini, A.; Probst, L.F.D.; Paiva-Santos, C.O.; Schreiner, W.H. The Influence of Cation Segregation on the Methanol Decomposition on Nanostructured SnO2. Sens. Actuators B Chem. 2002, 86, 185–192. [Google Scholar] [CrossRef]
- Leite, E.R.; Cerri, J.A.; Longo, E.; Varela, J.A.; Paskocima, C.A. Sintering of Ultrafine Undoped SnO2 Powder. J. Eur. Ceram. Soc. 2001, 21, 669–675. [Google Scholar] [CrossRef]
- Castro, R.H.R.; Hidalgo, P.; Muccillo, R.; Gouvêa, D. Microstructure and Structure of NiO–SnO2 and Fe2O3–SnO2 Systems. Appl. Surf. Sci. 2003, 214, 172–177. [Google Scholar] [CrossRef]
- Maciel, A.P.; Lisboa-Filho, P.N.; Leite, E.R.; Paiva-Santos, C.O.; Schreiner, W.H.; Maniette, Y.; Longo, E. Microstructural and Morphological Analysis of Pure and Ce-Doped Tin Dioxide Nanoparticles. J. Eur. Ceram. Soc. 2003, 23, 707–713. [Google Scholar] [CrossRef]
- Aragón, F.H.; Coaquira, J.A.H.; Hidalgo, P.; Brito, S.L.M.; Gouvêa, D.; Castro, R.H.R. Structural and Magnetic Properties of Pure and Nickel Doped SnO2 Nanoparticles. J. Phys. Condens. Mater. 2010, 22, 496003. [Google Scholar] [CrossRef] [PubMed]
- Castro, R.H.R.; Pereira, G.J.; Gouvêa, D. Surface Modification of SnO2 Nanoparticles Containing Mg or Fe: Effects on Sintering. Appl. Surf. Sci. 2007, 253, 4581–4585. [Google Scholar] [CrossRef]
- Yuasa, M.; Masaki, T.; Kida, T.; Shimanoe, K.; Yamazoe, N. Nano-Sized PdO Loaded SnO2 Nanoparticles by Reverse Micelle Method for Highly Sensitive CO Gas Sensor. Sens. Actuators B Chem. 2009, 136, 99–104. [Google Scholar] [CrossRef]
- Wang, J.; Wu, W.; Wang, W.H.; Bao, M. Expeditious synthesis of SnO2 nanoparticles through controlled hydrolysis and condensation of Tin alkoxide in reverse microemulsion. Ceram. Int. 2017, 43, 4702–4705. [Google Scholar] [CrossRef]
- Zamand, N.; Nakhaei Pour, A.; Housaindokht, M.R.; Izadyar, M. Size-Controlled Synthesis of SnO2 Nanoparticles Using Reverse Microemulsion Method. Solid State Sci. 2014, 33, 6–11. [Google Scholar] [CrossRef]
- Chen, Y.; Cao, Y. Ultrasensitive and Low Detection Limit of Acetone Gas Sensor Based on ZnO/SnO2 thick Films. RSC Adv. 2020, 10, 35958–35965. [Google Scholar] [CrossRef]
- Salimian Rizi, V.; Sharifianjazi, F.; Jafarikhorami, H.; Parvin, N.; Saei Fard, L.; Irani, M.; Esmaeilkhanian, A. Sol-Gel Derived SnO2/Ag2O Ceramic Nanocomposite for H2 Gas Sensing Applications. Mater. Res. Express 2019, 6, 1150g2. [Google Scholar] [CrossRef]
- Marzec, A.; Radecka, M.; Maziarz, W.; Kusior, A.; Pedzich, Z. Structural, Optical and Electrical Properties of Nanocrystalline TiO2, SnO2 and Their Composites Obtained by the Sol-Gel Method. J. Eur. Ceram. Soc. 2016, 36, 2981–2989. [Google Scholar] [CrossRef]
- Yin, X.T.; Tao, L. Fabrication and Gas Sensing Properties of Au-Loaded SnO2 Composite Nanoparticles for Low Concentration Hydrogen. J. Alloys Compd. 2017, 727, 254–259. [Google Scholar] [CrossRef]
- Yin, X.T.; Wu, S.S.; Dastan, D.; Nie, S.; Liu, Y.; Li, Z.G.; Zhou, Y.W.; Li, J.; Faik, A.; Shan, K.; et al. Sensing Selectivity of SnO2-Mn3O4 Nanocomposite Sensors for the Detection of H2 and CO Gases. Surf. Interfaces 2021, 25, 101190. [Google Scholar] [CrossRef]
- Joshi, G.; Rajput, J.K.; Purohit, L.P. SnO2–Co3O4 Pores Composites for CO2 Gas Sensing at Low Operating Temperature. Microporous Mesoporous Mater. 2021, 326, 2–9. [Google Scholar] [CrossRef]
- Zeng, W.; Liu, T.; Wang, Z.; Tsukimoto, S.; Saito, M.; Ikuhara, Y. Selective Detection of Formaldehyde Gas Using a Cd-Doped TiO2-SnO2 Sensor. Sensors 2009, 9, 9029–9038. [Google Scholar] [CrossRef]
- Chesler, P.; Hornoiu, C.; Mihaiu, S.; Vladut, C.; Moreno, J.M.C.; Anastasescu, M.; Moldovan, C.; Brasoveanu, C.; Firtat, B.; Muscalu, G.; et al. Nanostructured SnO2-ZnO Composite Gas Sensors for Selective Detection of Carbon Monoxide. Beilstein J. Nanotechnol. 2016, 7, 2045–2056. [Google Scholar] [CrossRef]
- Wen, Z.; Tian-mo, L. Gas-Sensing Properties of SnO2-TiO2-Based Sensor for Volatile Organic Compound Gas and Its Sensing Mechanism. Phys. B Condens. Mater. 2010, 405, 1345–1348. [Google Scholar] [CrossRef]
- Jian, K.S.; Chang, C.J.; Wu, J.J.; Chang, Y.C.; Tsay, C.Y.; Chen, J.H.; Horng, T.L.; Lee, G.J.; Karuppasamy, L.; Anandan, S.; et al. High Response CO Sensor Based on a Polyaniline/SnO2 Nanocomposite. Polymers 2019, 11, 184. [Google Scholar] [CrossRef]
- Liu, J.; Dai, M.; Wang, T.; Sun, P.; Liang, X.; Lu, G.; Shimanoe, K.; Yamazoe, N. Enhanced Gas Sensing Properties of SnO2 Hollow Spheres Decorated with CeO2 Nanoparticles Heterostructure Composite Materials. ACS Appl. Mater. Interfaces 2016, 8, 6669–6677. [Google Scholar] [CrossRef]
- Maiti, A.; Rodriguez, J.A.; Law, M.; Kung, P.; McKinney, J.R.; Yang, P. SnO2 Nanoribbons as NO2 Sensors: Insights from First Principles Calculations. Nano Lett. 2003, 3, 1025–1028. [Google Scholar] [CrossRef]
- Hwang, I.S.; Choi, J.K.; Kim, S.J.; Dong, K.Y.; Kwon, J.H.; Ju, B.K.; Lee, J.H. Enhanced H2S Sensing Characteristics of SnO2 Nanowires Functionalized with CuO. Sens. Actuators B Chem. 2009, 142, 105–110. [Google Scholar] [CrossRef]
- Yuan, K.P.; Zhu, L.Y.; Yang, J.H.; Hang, C.Z.; Tao, J.J.; Ma, H.P.; Jiang, A.Q.; Zhang, D.W.; Lu, H.L. Precise Preparation of WO3@SnO2 Core Shell Nanosheets for Efficient NH3 Gas Sensing. J. Colloid Interface Sci. 2020, 568, 81–88. [Google Scholar] [CrossRef] [PubMed]
- Barsan, N.; Koziej, D.; Weimar, U. Metal Oxide-Based Gas Sensor Research: How To? Sens. Actuators B Chem. 2007, 121, 18–35. [Google Scholar] [CrossRef]
- Yamazoe, N. New Approaches for Improving Semiconductor Gas Sensors. Sens. Actuators B. Chem. 1991, 5, 7–19. [Google Scholar] [CrossRef]
- Comini, E. Metal Oxide Nano-Crystals for Gas Sensing. Anal. Chim. Acta 2006, 568, 28–40. [Google Scholar] [CrossRef]
- Murata, N.; Suzuki, T.; Lin, Y.; Nitani, H.; Niwa, Y.; Wada, T.; Uo, M.; Asakura, K. Structure of Atomically Dispersed Pt in a SnO2 Thin Film under Reaction Conditions: Origin of Its High Performance in Micro Electromechanical System Gas Sensor Catalysis. ACS Appl. Mater. Interfaces 2022, 14, 39507–39514. [Google Scholar] [CrossRef]
- Sharma, A.; Tomar, M.; Gupta, V. A Low Temperature Operated NO2 Gas Sensor Based on TeO2/SnO2 p-n Heterointerface. Sens. Actuators B Chem. 2013, 176, 875–883. [Google Scholar] [CrossRef]
- Haridas, D.; Sreenivas, K.; Gupta, V. Improved Response Characteristics of SnO2 Thin Film Loaded with Nanoscale Catalysts for LPG Detection. Sens. Actuators B Chem. 2008, 133, 270–275. [Google Scholar] [CrossRef]
- Gurlo, A. Interplay between O2 and SnO2: Oxygen Ionosorption and Spectroscopic Evidence for Adsorbed Oxygen. ChemPhysChem 2006, 7, 2041–2052. [Google Scholar] [CrossRef]
- Bonu, V.; Das, A.; Prasad, A.K.; Krishna, N.G.; Dhara, S.; Tyagi, A.K. Influence of in-plane and bridging oxygen vacancies of SnO2 nanostructures on CH4 sensing at low operating temperatures. Appl. Phys. Lett. 2014, 105, 243102. [Google Scholar] [CrossRef]


| Sensor | Temperature (°C) | Sensitivity (S) | ||||||
|---|---|---|---|---|---|---|---|---|
| CH4 | CO | NO | NO2 | NH3 | SO2 | H2S | ||
| SnO2 | 200 | −1.18 * | 1.40 | 9.39 | 4.59 | −1.72 | 1.23 | −38.85 |
| 300 | −1.30 | 1.08 | 2.48 | 6.13 | −1.33 | 1.13 | −14.73 | |
| 400 | −1.27 | −1.09 | 1.09 | 1.95 | −1.20 | −1.03 | −6.69 | |
| ZnO | 200 | 1.04 | 3.00 | 3.53 | 1.11 | −1.10 | 1.08 | −16.90 |
| 300 | −1.25 | 1.56 | 9.40 | 11.00 | 1.20 | 1.50 | −21.67 | |
| 400 | −1.24 | 1.01 | 1.59 | 5.12 | 1.08 | 1.04 | −13.16 | |
| WO3 | 200 | −1.10 | 1.20 | 8.92 | 3.73 | −1.42 | 1.3 | −34.11 |
| 300 | −1.16 | 1.03 | 2.56 | 4.53 | −1.04 | 1.07 | −28.18 | |
| 400 | −1.14 | 1.01 | 1.18 | 3.11 | 1.11 | 1.02 | −14.02 | |
| In2O3 | 200 | −1.04 | 1.56 | 17.00 | 6.66 | −1.99 | 1.53 | −43.08 |
| 300 | −1.04 | 1.06 | 1.85 | 3.42 | 1.22 | 1.03 | −6.98 | |
| 400 | −1.02 | 1.02 | 1.09 | 1.40 | 1.08 | −1.01 | −2.60 | |
| CuO | 200 | 1.01 | 1.01 | −1.03 | −1.03 | 1.02 | −1.01 | 1.16 |
| 300 | 1.03 | 1.01 | −1.03 | −1.09 | 1.04 | 1.01 | 1.18 | |
| 400 | 1.02 | 1.01 | −1.01 | −1.04 | 1.07 | 1.01 | 1.24 | |
| Material | Solvent | Precursor | Conditions | Description | Ref. |
|---|---|---|---|---|---|
| Hydrothermal Method | |||||
| SnO2nanosheets | Ethanol and water | SnCl2.2H2O | 120 °C for 6 h | Rutile structure with size <100 nm | [99] |
| SnO2@ carbon hollow nanospheres | Ethanol and water | Urea, silica nanospheres and K2SnO3.3H2O | 150–190 °C for 36 h | Tetragonal rutile SnO2 with 30 nm thickness | [100] |
| SnO2 nanoparticles and nanorods | Water | SnCl2.2H2O | 130–160 °C, calcination at 350 °C | Rutile structure with 4–6 nm size | [101] |
| SnO2/α-Fe2O3 semiconductor nanoheterostructures | Water | Fe2O3, SnCl4.5H2O, NaOH | Heated at 220 °C and drying at 50 °C for 4 h | Tetragonal SnO2 phase with 5 nm size | [102] |
| SnO2 nanosheets | Ethanol and water | SnCl2.2H2O and NaOH | 180 °C/12 h, vacuum dried at 80 °C/1 h | Rutile SnO2 NPs with 5 nm diameter | [103] |
| SnO2 | Water | SnCl4.5H2O and sucrose | 600 °C for 3 h | Rutile structure with 10 nm size | [89] |
| SnO2 | Ethanol and water | SnCl4.5H2O and NaOH | 170–190 °C | Rutile structure (size 70–105 nm) | [104] |
| SnO2 | Water | CTAB, NaOH and SnCl4.2H2O | 400 °C for 2 h | Rutile SnO2 with 42 nm size | [105] |
| SnO2 nanowires | Water | SnCl4.5H2O and NH4(OH) | 370 °C for 5 min | Rutile, diameter 70–150 nm, length 20–100 µm | [106] |
| SnO2 nanorods | Water | SnCl4, NaOH and CTAB | Heated at 160 °C for 12 h | Rutile, diameter 40–100 nm, and 2–3 µm in length | [43] |
| SnO2 microspheres | Water | SnO2 methenamine, carbamide and sodium hydrate | Heated at 160 °C for 16 h | Tetragonal structure, 0.5–1 µm diameter | [107] |
| SnO2 nanorods | Water | SnCl4, HCl and NH4(OH) | Heated at 95 °C for 15 min | Tetragonal with diameter of 100–150 nm and length of 1–2 µm | [108] |
| SnO2 nanocolloids | Glucose | K2SnO3.3H2O, glucose | 350–500 °C for 1 h | Tetragonal, mean size 9 nm | [109] |
| SnO2 quantum dots | Water | SnCl4.5H2O and hydrazine hydrate | Heated at 150 °C for 24 h | Tetragonal, 3 nm particle size | [110] |
| SnO2 nanorods | Mixture of heptane and hexanol | Sodium dodecyl sulfate, SnCl4 and NaOH | Heated at 200 °C for 18 h | Rutile, diameter 8–15 nm, length 150–200 nm | [111] |
| SnO2–V2O5 CNT | Water | NH4VO3, SnCl2.2H2O and urea | Heated at 500 °C for 3 h | Crystalline structure with 10 nm particle size | [112] |
| Zn-doped SnO2 nanoflowers | Ethanol and water | Zn (CH3COO)2. 2H2O, SnCl4 and NaOH | Heated at 180 °C for 24 h | Tetragonal SnO2 with uniform size of 1 µm | [113] |
| SnS2/SnO2 non-heterojunction | Water | SnCl2.5H2O, CH3CSNH2 | 190 °C for 6 h | Tetragonal SnO2 NPs with sizes 3–6 nm and hexagonal SnS2 nanoflakes with sizes 22–55 nm | [114] |
| Ni/SnO2 core-shell | Water and ammonia | 1,2-Propanediol, SnCl2.2H2O, H2O2 | Heated at 120 °C for 15 h | Rutile structure with 0.7–0.95 µm diameter | [115] |
| CuO/SnO2 core-shell | Ethanol and water | SnCl4, NaOH, Cu (NO3)2.2H2O | Heated at 190 °C for 24 h and then heated at 800 °C for 2 h | Tenorite SnO2 nanorods of diameter 10 nm and length 100 nm and size of CuO NPs as 4 nm | [116] |
| SnO2 nanowires | Ethanol | SnCl4.5H2O, NaOH | Heated at 285 °C for 24 h | Rutile, diameter 80 ± 5 nm and length of ~2.5 ± 0.1 µm | [117] |
| SnO2 nanotubes | Ethanol and water | Na2SnO3.5H2O, urea | 600 °C under Ar for 1 h | Nanotubes (100–300 nm) | [118] |
| SnO2 | Water | H2SO4, H2O2 and tin powder | Heated at 150 °C for 6 h | Tetragonal SnO2 with size 2.9 nm | [119] |
| SnO2 nanocrystals | Water and ethanol | SnCl2.2H2O, SDS, PVP, NaOH, TPAB, CTAB | Heated at 180 °C for 12 h | Tetragonal rutile SnO2 with 10–20 nm grain size | [120] |
| SnO2 nanostructures | Water | SnCl4, triethylenediamine | Heated at 200 °C for 40 h | Tetragonal with size distributions 3–8 nm | [121] |
| SnO2 hollow nanospheres | Water | D-Glucose monohydrate, SnCl2, glucose | Heated at 500 °C for 5 h | Tetragonal, sizes of 15 and 60 nm at different concentrations | [122] |
| Mn-doped SnO2 DMS nanoparticles | Water | SnCl2. 2H2O, (CH3COO)2Mn.4H2O, (NH4)2C2O4.H2O | Refluxed at 70 °C for 12 h and vacuum dried at 55 °C for 1 h | Tetragonal SnO2 with particle size distribution in the range of 5–11 nm. | [123] |
| Co-doped SnO2 DMS nanoparticles | Water and ethanol | SnCl2.2H2O, cobalt acetate tetrahydrate, diammonium, oxalate | Refluxed for 12 h at 70 °C and vacuum dried at 60 °C | Tetragonal SnO2 with average size of 8–13 nm. | [124] |
| Ni-doped SnO2 DMS nanoparticles | Water and ethanol | SnCl2.2H2O, nickel chloride hexahydrate, (NH4)2C2O4 | Refluxed at 70 °C for 12 h and dried at 60 °C | Tetragonal with particle size in the range of 8–12 nm | [125] |
| Polymeric Method | |||||
| SnO2 | Water | SnCl2.2H2O, citric acid | Heated at 300 °C for 6 h | Tetragonal with size of 113.8 nm | [126] |
| SnO2/Sb2O3 | Water | SnCl2, citric acid, ethylene glycol, HNO3, Sb2O3 | Heated at 300 °C for 2 h | Cassiterite structure with different crystalline size | [127] |
| SnO2 and Sb-doped SnO2 | Ethylene glycol | SnCl2.2H2O, SnCl4.5H2O, Sb2O3, HNO3, citric acid | Heated at 90 °C for 4 h | Cassiterite type tetragonal structure 20 nm in size | [128] |
| Sb-doped SnO2 thin films | Ethylene glycol | Citric acid, tin and antimony tartarate | Heated at 550 °C for 1 h | Cassiterite structure with varying sizes from 3.5 to 9 nm | [129] |
| SnO2 | Water and ethylene glycol | SnCl2.2H2O, citric acid | Temperatures from 500 to 900 °C for 2 h | Tetragonal with particle size of ~20 nm | [130] |
| SnO2 | Ethylene glycol | SnCl2.2H2O, citric acid | Heated at 400 °C/12 h | Tetragonal, size range 24–86 nm | [131] |
| NiO/SnO2 and Fe2O3/SnO2 | Ethylene glycol | SnCl2.2H2O, citric acid, Fe(NO3)3.9H2O, Ni(NO3)2.6H2O | Heated at 500 °C for 15 h | Tetragonal phase | [132] |
| Pure and Ce-doped SnO2 | Ethylene glycol | SnCl2.2H2O, citric acid, HNO3, Ce(NO3).6H2O | Heated at 400 °C for 4 h | Tetragonal rutile structure with particle size of 20 nm | [133] |
| Pure and Ni-doped SnO2 | Ethylene glycol | SnCl2.2H2O, Ni(NO3)2, HNO3, citric acid | Heated at 500 °C for 15 h | Rutile type phase of SnO2 with 13 nm particle size | [134] |
| SnO2 | Ethylene glycol | SnCl2.2H2O, HNO3, MgO Fe(NO3)3.9H2O | Heated at 900 °C for 15 h | Tetragonal nanostructures with smaller particle size | [135] |
| Reverse Micellar Method | |||||
| ZnO-SnO2 nanospheres | CTAB, n-pentanol, n-octane | Zn2+ and Sn4+salts as precursors | Calcined at 400–1000 °C for 6 h | Tetragonal with size ranging from 5 to 15 nm | [83] |
| PdO-SnO2 nanoparticles | Cyclo hexane, | Sn(CH3COO)4, Pd (NO3)2 | Calcined at 600 °C for 3 h | Tetragonal structure with particle size of 10 nm | [136] |
| SnO2 nanoparticles | Cyclo hexane, n-butanol, isopropanol | Tin isopropoxide | Calcined at 500 °C for 2 h | Tetragonal structure with particle size 2–10 m | [137] |
| SnO2 nanoparticles | 1-Butanol, iso-octane | SnCl4.5H2O | Calcined at 500 °C for 5 h | Crystalline structure with particle sizes of 70 and 150 nm | [81] |
| SnO2 nanoparticles | Hexane | SnCl4.5H2O | Calcined at 650 °C for 5 h | Tetragonal structure with average particle size of 10–16 nm | [138] |
| SnO2 nanoparticles | Hexanol, heptane | Sn(OH)6 2− | Heated at 60–70 °C for 5 h | Tetragonal rutile structure with particle size of 5–10 nm | [82] |
| SnO2 nanoparticles | Ethanol | SnCl2, KClO3 | Heated at room temperature overnight | Tetragonal structure with particle size 80–120 nm | [6] |
| SnO2 nanocrystals | Heptane, hexanol | Sn(OH)6 2− | Heated at 60–70 °C for 5 h | Tetragonal with rutile structure with particle size in the range of 6–22 nm | [82] |
| Sol–Gel Method | |||||
| SnO2 nanostructures | Citric acid and polyethylene glycol | Zn(NO3)2.6H2O | 600 °C for 4 h | Hexagonal wurtzite with mean sizes of 35 nm | [139] |
| SnO2/AgO2 nanoparticles | Ammonia solution and water | SnCl2.5H2O and AgNO3 | Annealed at 100, 300 and 500 °C | Crystalline with mean particle size of 23, 48 and 78 nm | [140] |
| SnO2/TiO2 nanoparticles | Water and isopropyl alcohol | Sncl.5H2O titanium isopropoxide | Calcined at 540 °C for 2 h | Tetragonal structure with particle size of ∼8 nm | [141] |
| Au SnO2 nanoparticles | Citric acid and water | SnCl4.5H2O, HAuCl4.4H2O | Heated at 500 °C for 2 h | Crystalline structure with particle sizes of 50 and 30 nm | [142] |
| MWCNT/SnO2 nanoparticles | Water | SnCl4.5H2O, MnCl4.4H2O, H2C2O4, MnCl4.5H2O, NH3.H2O, citric acid | Calcined at 550 °C for 3 h | Crystalline structure with particle size ranging from 10 to 20 nm | [143] |
| SnO2 /Co3O4 nanospheres | Methanol | SnCl2.2H2O, C2H7NO, C4H6CoO4⋅4H2O | Room temperature for 24 h | Tetragonal rutile structure | [144] |
| Cd doped TiO2/SnO2 nanoparticles | Ammonium hydroxide, water | SnCl4.5H2O, tetra butyl Ti, CdNO2 | Sintered at 773 K for 3 h | Crystalline with sizes in the range of 30–32 nm. | [145] |
| ZnO/SnO2 nanostructures | Ethanol | Zinc acetate dehydrate, tin (II) 2-ethyl hexanoate, triethanolamine | Heated at 350 °C for 1 h | Amorphous structure with 31 nm grain size | [146] |
| SnO2/TiO2 microstructures | Isopropyl alcohol, tetra methyl ammonium hydroxide, ethanol | Tetra-methyl ammonium hydroxide, SnCl4.5H2O, NH3 solution, AgNO3 | Calcined at 450 °C for 2 h | Anatase phase with particle size of 30 nm | [147] |
| Polyaniline/SnO2 nanoparticles | Ethanol, water | SnCl2.2H2O, ammonium peroxydisulfate, aniline | Calcined at 400 °C for 2 h | Tetragonal with particle size in the range of 5–9 nm | [148] |
| Composition | Material Morphology | Operating Temperature | Target Gas/Concentration (ppm) | Response | Ref |
|---|---|---|---|---|---|
| SnO2 | Nanoparticles | 200 °C 300 °C | CO/25 ppm NO2/25 ppm | 1.40 6.13 | [1] |
| SnO2 | Spherical NPs | 150 °C | H2S/30 ppm | 28.8 | [10] |
| SnO2 | Hollow spheres | 350–300 °C | CO/20–290 ppm | Good response | [5] |
| SnO2 | Hollow spheres | Room temperature | Ethanol | 6.8 | [6] |
| SnO2 | Nanosheets | 150 °C | H2S/30 ppm | 28.8 | [37] |
| SnO2 | Hollow spheres | 300 °C | Ethanol/1000 ppm | 75 | [38] |
| SnO2 | Nanosheets | 275 °C | Ethanol/100 ppm | 56.2 | [39] |
| Pd/SnO2 | Clustered nanoparticles | 300 °C | CO/200 ppm H2/200 ppm Toluene/50 ppm | 1350 2020 1720 | [71] |
| Pt/SnO2 | Nanorods | 300 °C | Ethanol/200 ppm | 39.5 | [73] |
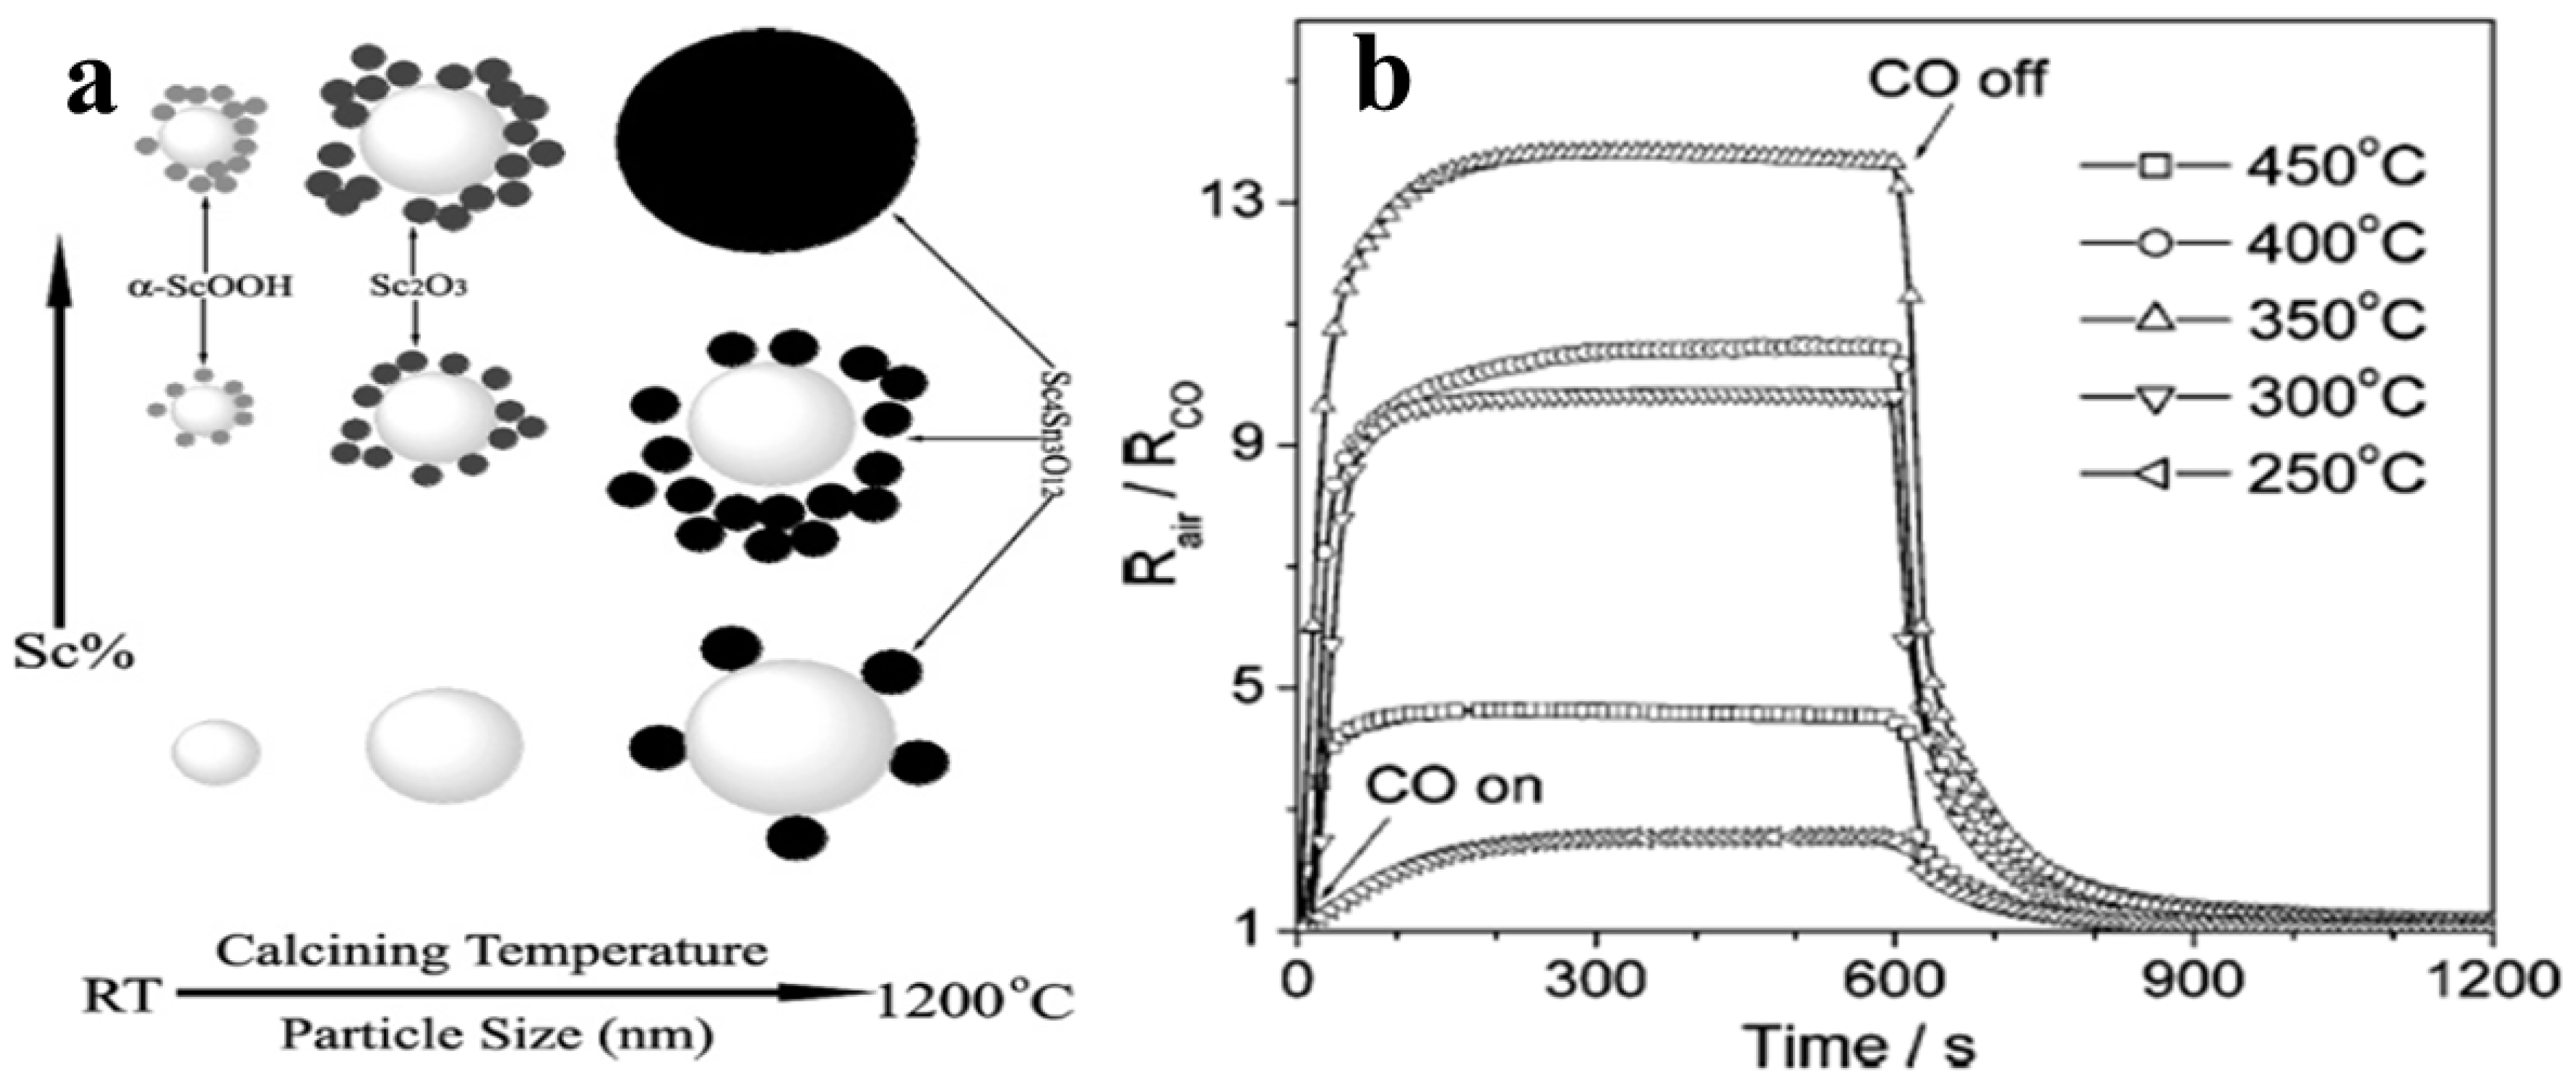
| Sc/SnO2 | Nanoparticles | 300–400 °C | CO/1000 ppm | 16 | [74] |
| WO3/SnO2 | Hollow nanospheres | P-type; room temperature to 95 °C N-type; above 185 °C | Ethanol/5000 ppm Ammonia/500 ppm CO, H2 and NO showed no response | Normal response | [75] |
| CuO/SnO2 | Nanorods | 60 °C | H2S/10 ppm | 9.4 × 10⁶ | [116] |
| Pt@SnO2 | Nanoparticles | 160 °C | CO/400 ppm | 450 | [94] |
| SnO2 doped with Pt and Pd | Nanoparticles | 450 °C | CO/500 ppm | 8.5 | [95] |
Publisher’s Note: MDPI stays neutral with regard to jurisdictional claims in published maps and institutional affiliations. |
© 2022 by the authors. Licensee MDPI, Basel, Switzerland. This article is an open access article distributed under the terms and conditions of the Creative Commons Attribution (CC BY) license (https://creativecommons.org/licenses/by/4.0/).
Share and Cite
Pandit, N.A.; Ahmad, T. Tin Oxide Based Hybrid Nanostructures for Efficient Gas Sensing. Molecules 2022, 27, 7038. https://doi.org/10.3390/molecules27207038
Pandit NA, Ahmad T. Tin Oxide Based Hybrid Nanostructures for Efficient Gas Sensing. Molecules. 2022; 27(20):7038. https://doi.org/10.3390/molecules27207038
Chicago/Turabian StylePandit, Nayeem Ahmad, and Tokeer Ahmad. 2022. "Tin Oxide Based Hybrid Nanostructures for Efficient Gas Sensing" Molecules 27, no. 20: 7038. https://doi.org/10.3390/molecules27207038
APA StylePandit, N. A., & Ahmad, T. (2022). Tin Oxide Based Hybrid Nanostructures for Efficient Gas Sensing. Molecules, 27(20), 7038. https://doi.org/10.3390/molecules27207038