
Delta-8 Tetrahydrocannabinol Product Impurities

 ,
, 
Abstract
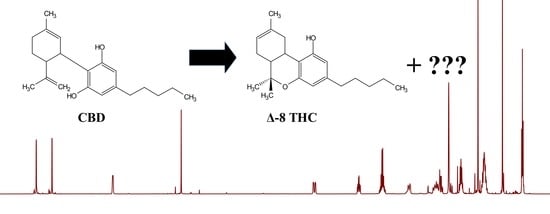
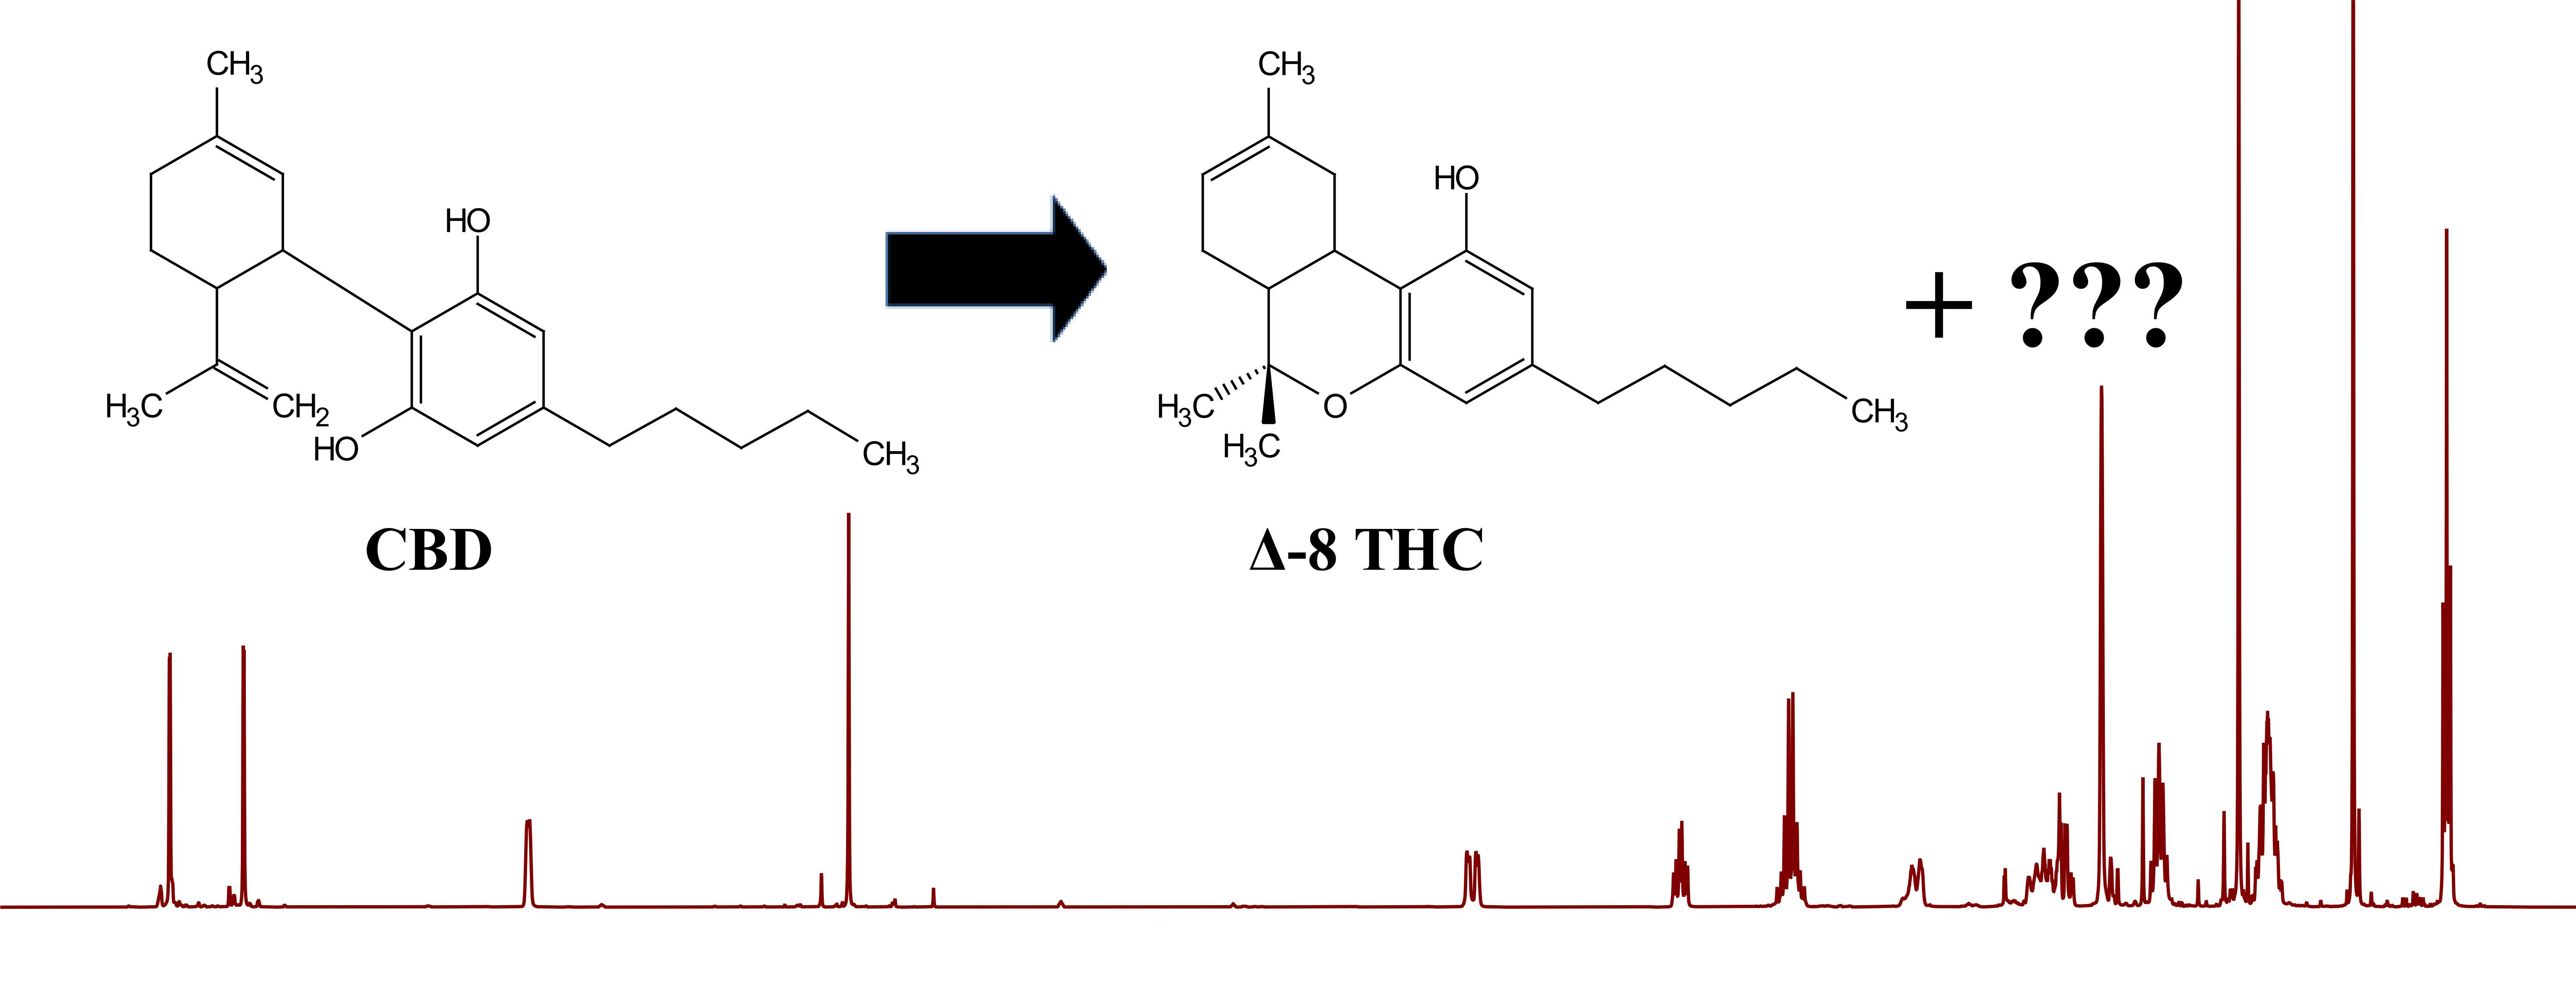
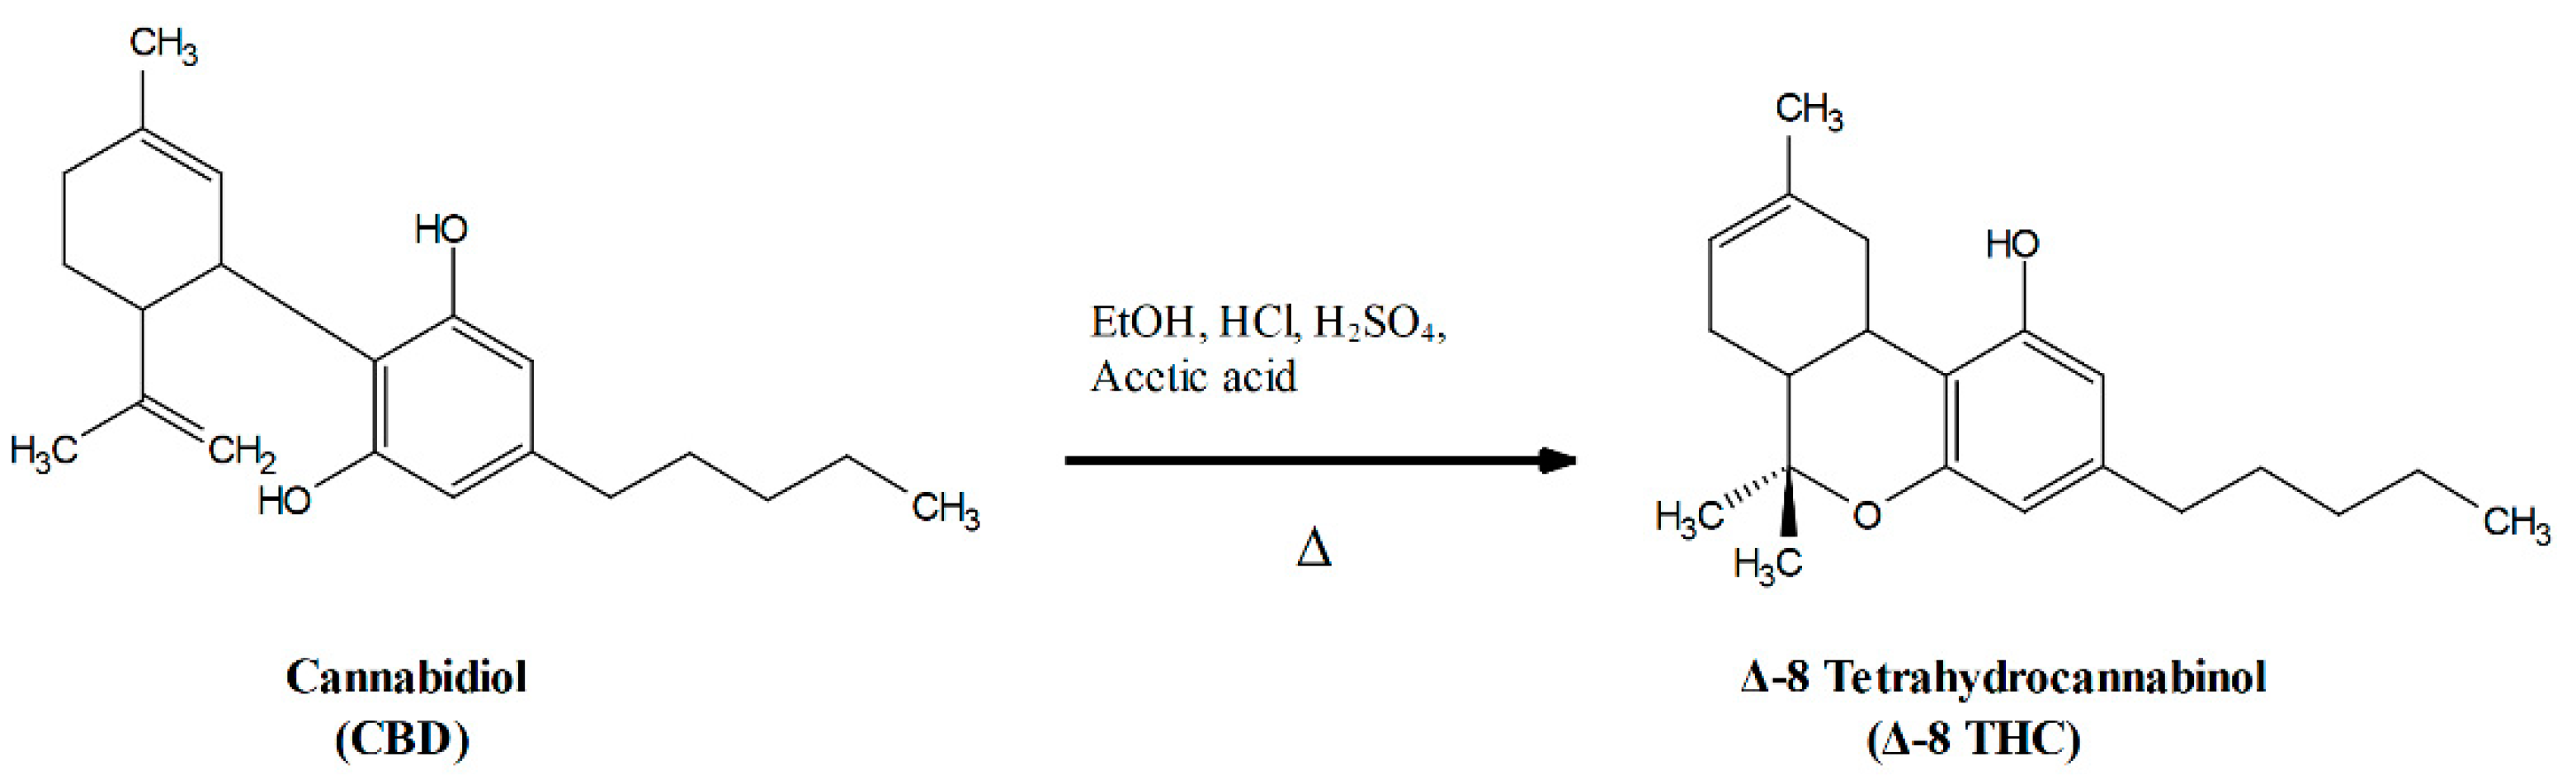
1. Introduction
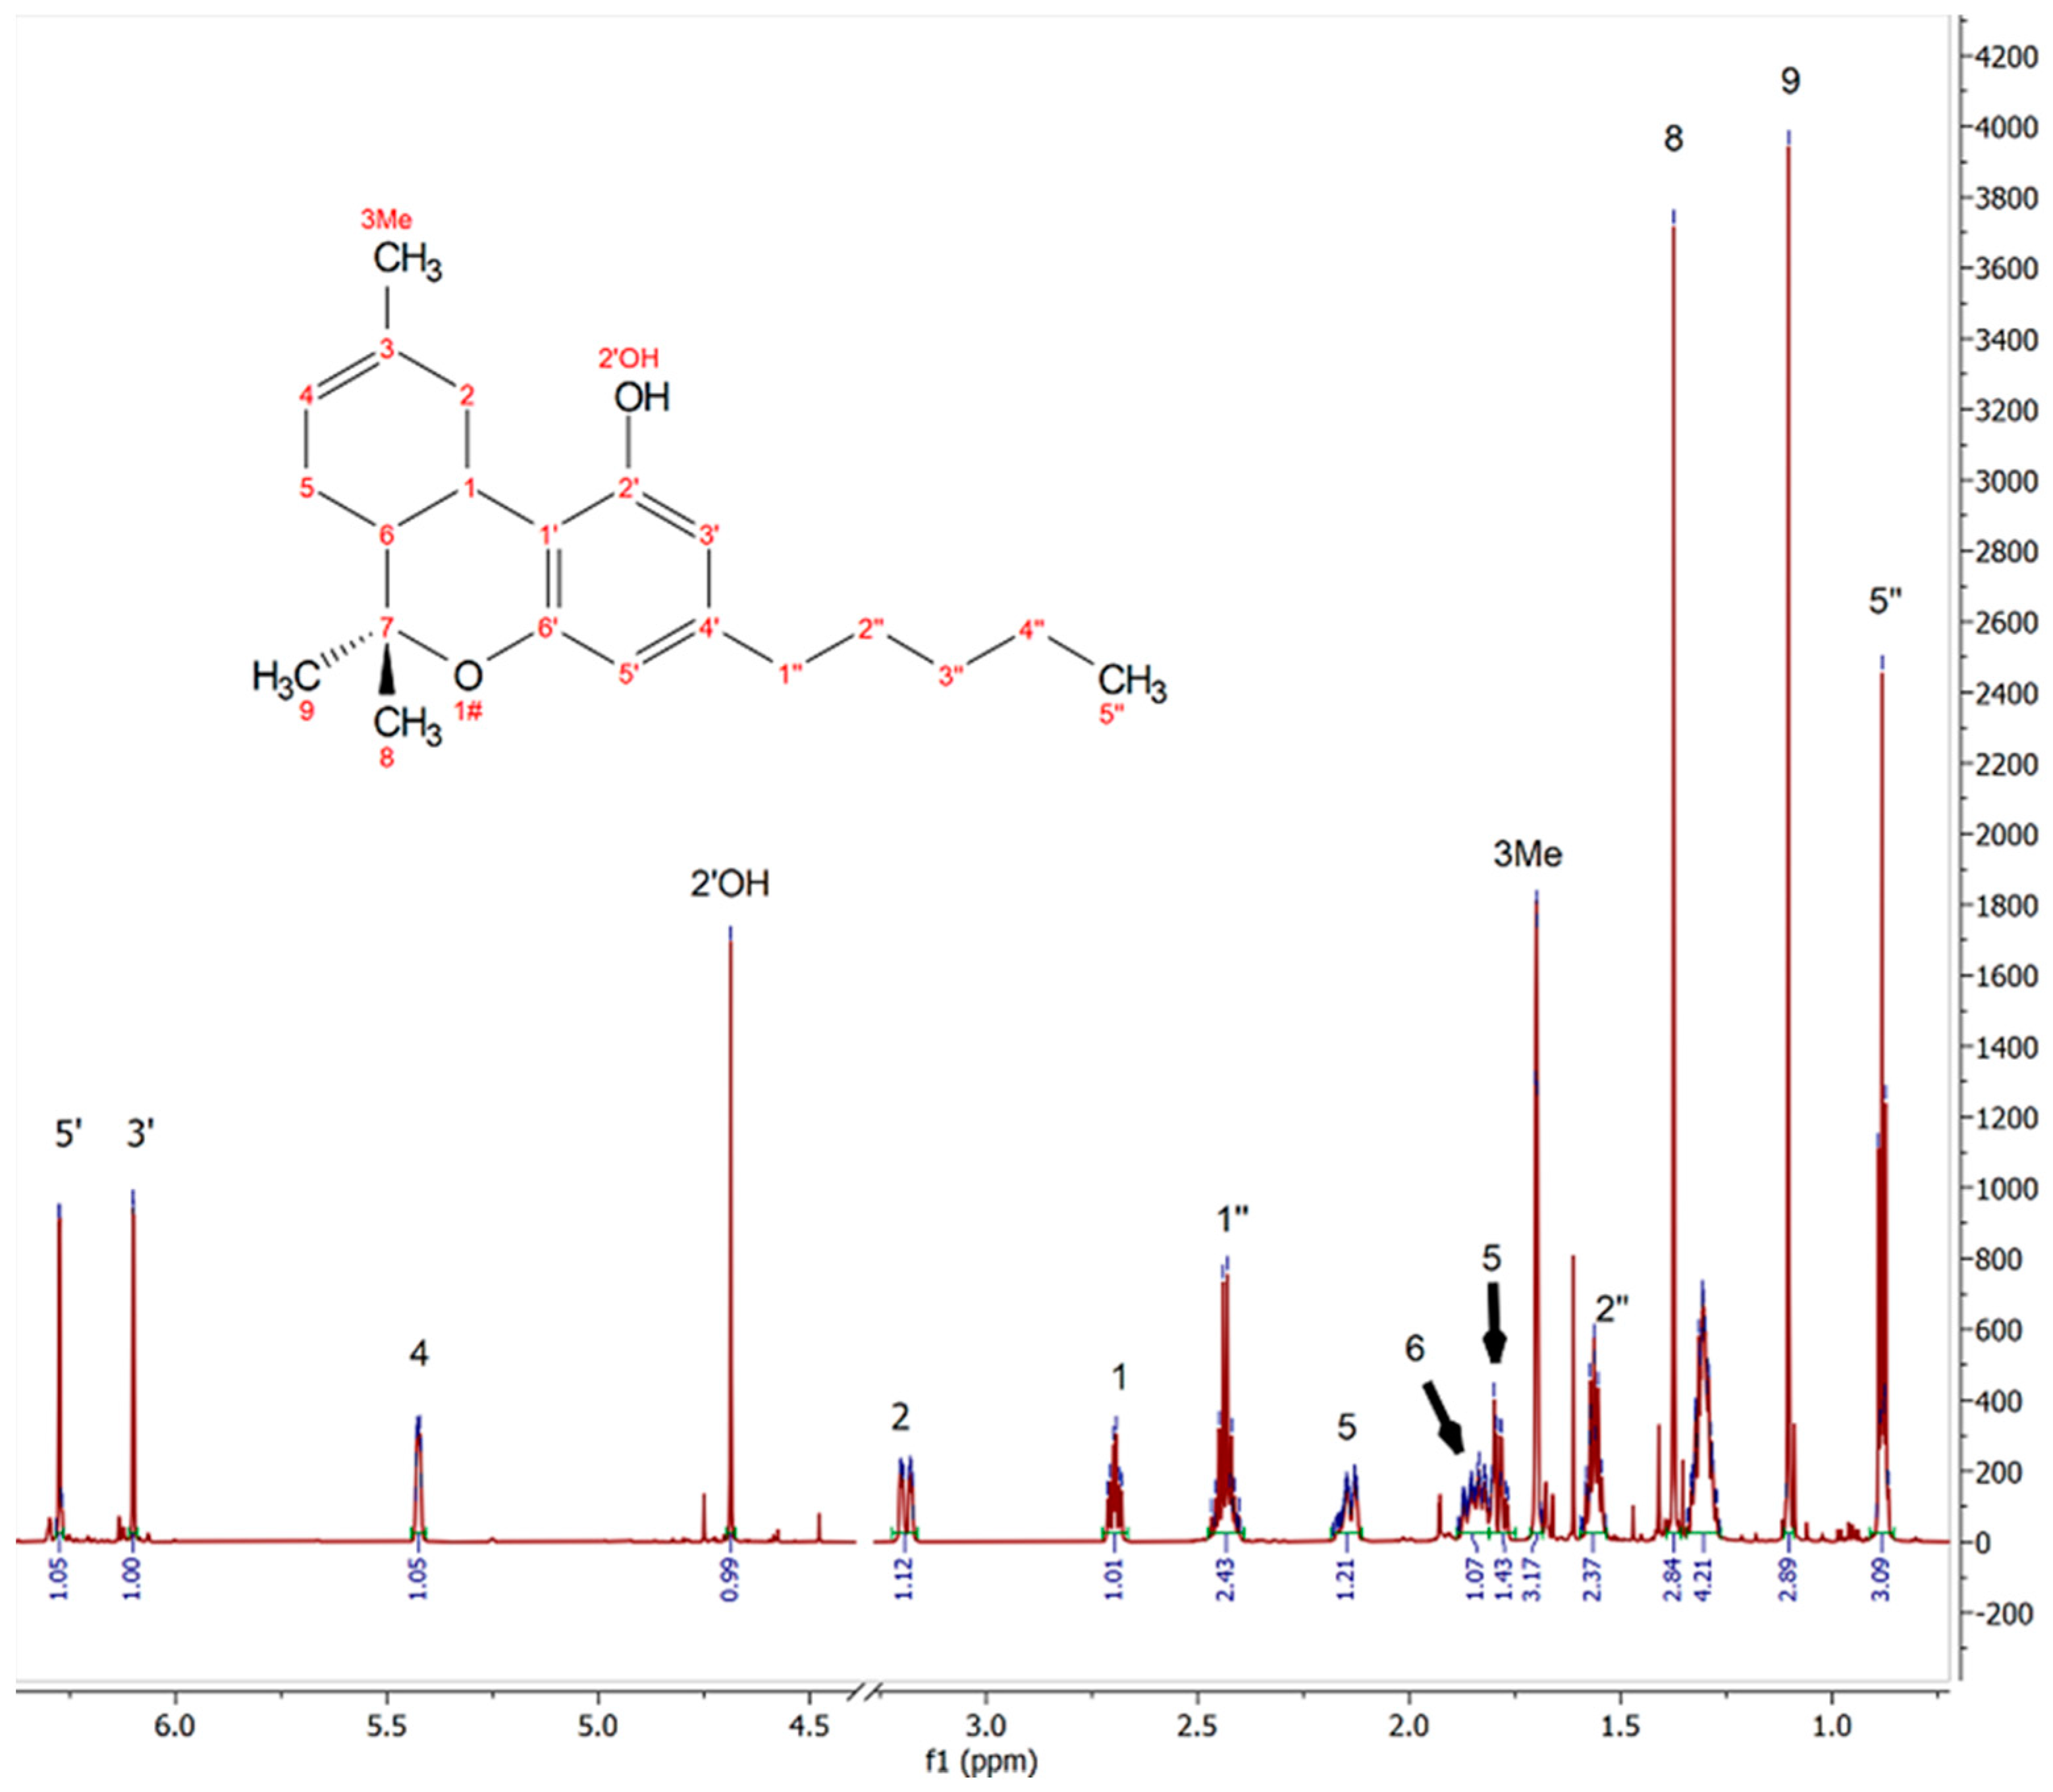
2. Results and Discussion
3. Materials and Methods
3.1. Samples
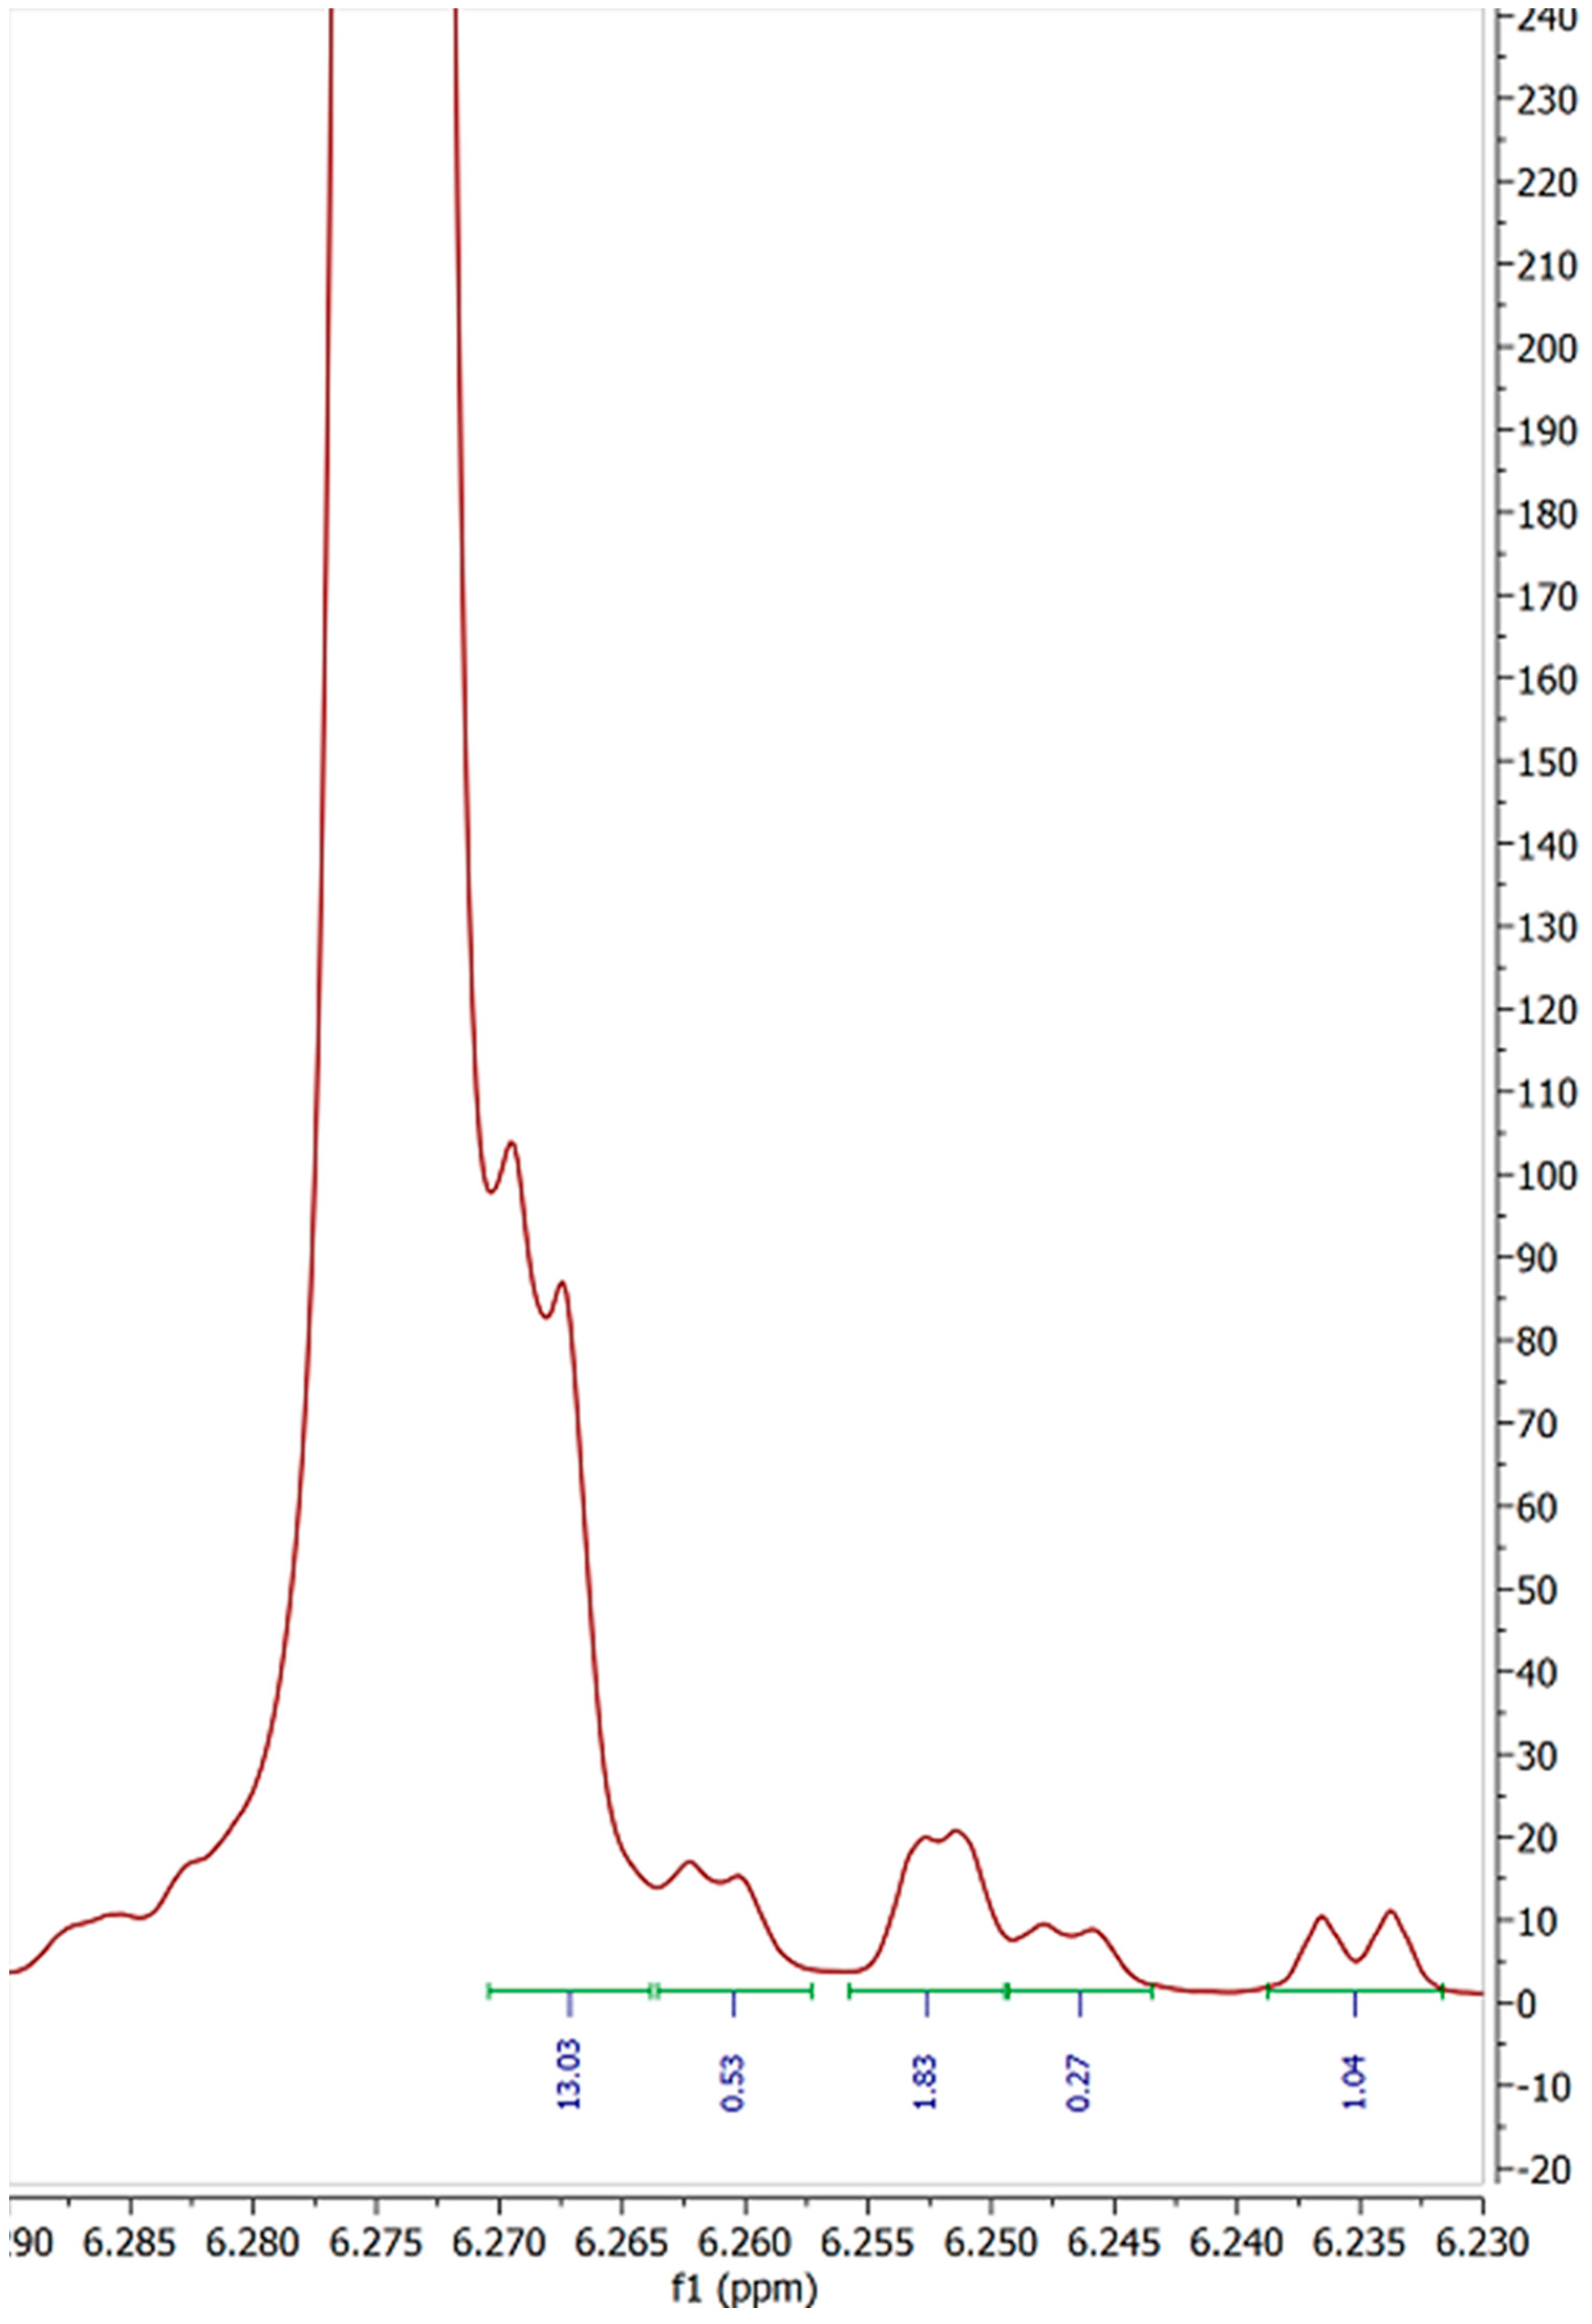
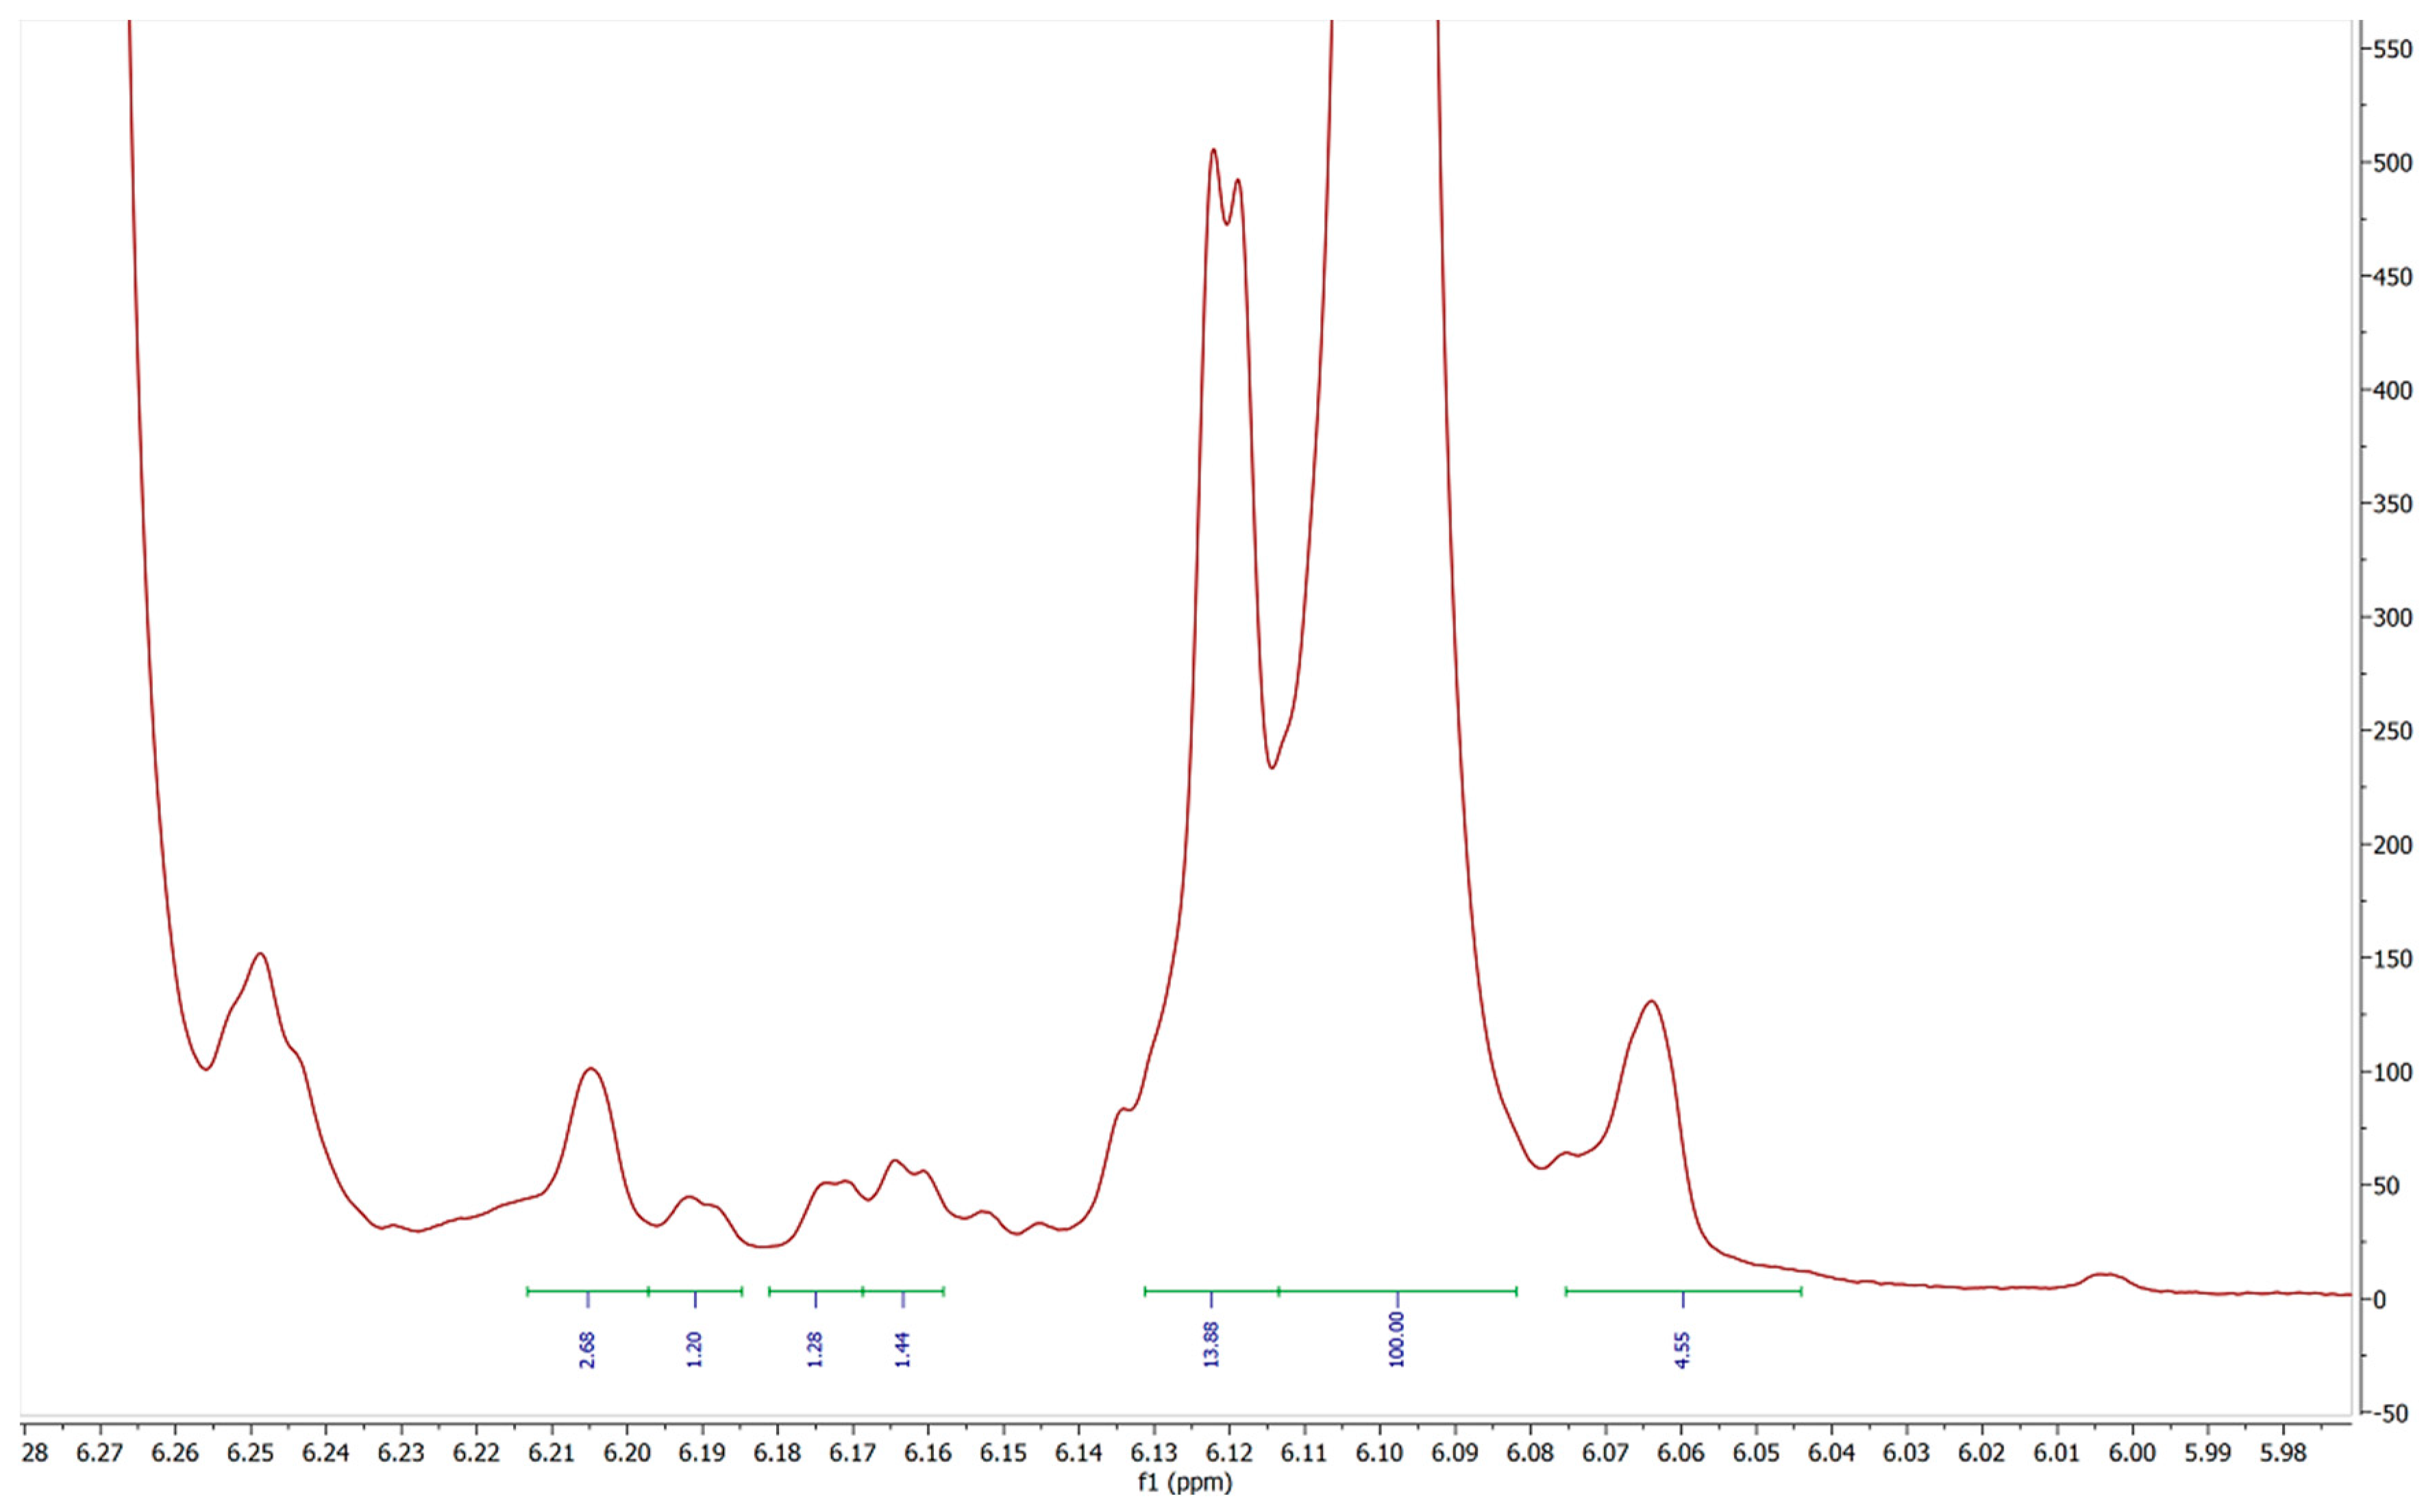
3.2. H NMR
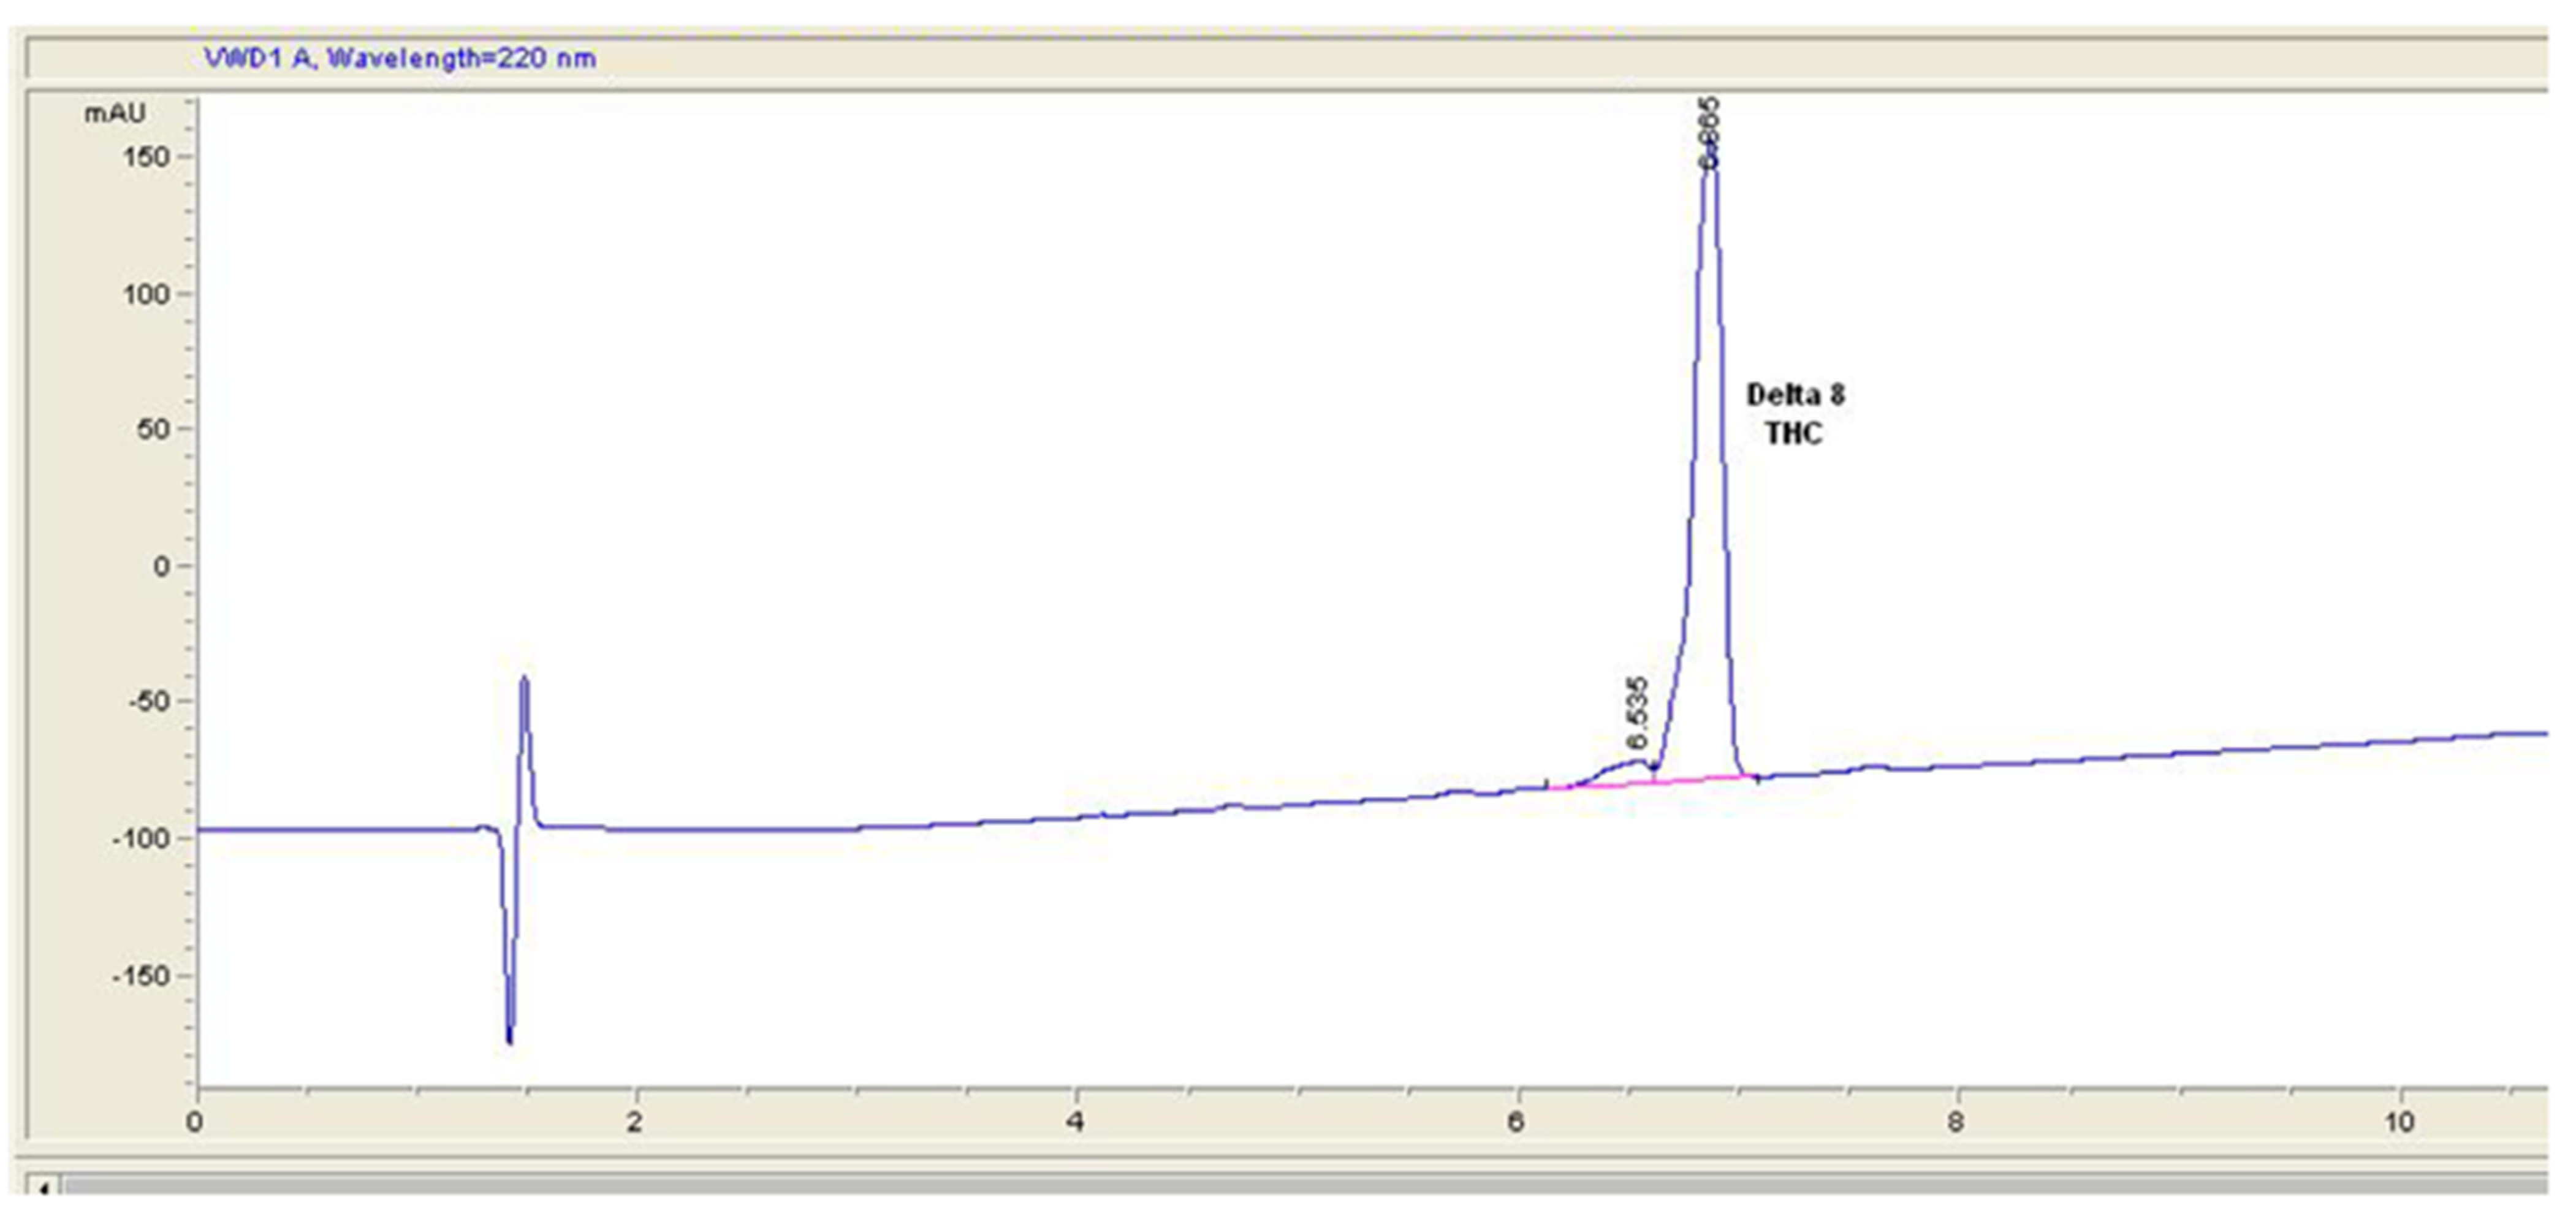
3.3. HPLC Analysis
3.4. HPLC-Mass Spectrometry
Supplementary Materials
Author Contributions
Funding
Data Availability Statement
Acknowledgments
Conflicts of Interest
Sample Availability
References
- H.R.2-Agriculture Improvement Act of 2018. Available online: https://www.congress.gov/bill/115th-congress/house-bill/2/text (accessed on 14 September 2021).
- Golombek, P.; Müller, M.; Barthlott, I.; Sproll, C.; Lachenmeier, D. Conversion of Cannabidiol (CBD) into Psychotropic Cannabinoids Including Tetrahydrocannabinol (THC): A Controversy in the Scientific Literature. Toxics 2020, 8, 41. [Google Scholar] [CrossRef] [PubMed]
- Erikson, B. Delta-8-THC craze concerns chemists. Chem. Eng. News 2021, 99, 25–28. Available online: https://cendigitalmagazine.acs.org/2021/08/30/delta-8-thc-craze-concerns-chemists-3/content.html (accessed on 31 August 2021).
- Choi, Y.; Hazekamp, A.; Peltenburg-Looman, A.; Frédérich, M.; Erkelens, C.; Lefeber, A.; Verpoorte, R. NMR assignments of the major cannabinoids and cannabiflavonoids isolated from flowers of Cannabis sativa. Phytochem. Anal. 2004, 15, 345–354. [Google Scholar] [CrossRef] [PubMed]
- Radwan, M.; ElSohly, M.; El-Alfy, A.; Ahmed, S.; Slade, D.; Husni, A.; Manly, S.; Wilson, L.; Seale, S.; Cutler, S.; et al. Isolation and Pharmacological Evaluation of Minor Cannabinoids from High-Potency Cannabis sativa. J. Nat. Prod. 2015, 78, 1271–1276. [Google Scholar] [CrossRef] [PubMed]
- Kiselak, T.; Koerber, R.; Verbeck, G. Synthetic route sourcing of illicit at home cannabidiol (CBD) isomerization to psychoactive cannabinoids using ion mobility-coupled-LC–MS/MS. Forensic Sci. Int. 2020, 308, 110173. [Google Scholar] [CrossRef] [PubMed]
- Linciano, P.; Citti, C.; Russo, F.; Tolomeo, F.; Laganà, A.; Capriotti, A.; Luongo, L.; Iannotta, M.; Belardo, C.; Maione, S.; et al. Identification of a new cannabidiol n-hexyl homolog in a medicinal cannabis variety with an antinociceptive activity in mice: Cannabidihexol. Sci. Rep. 2020, 10, 22019. [Google Scholar] [CrossRef] [PubMed]


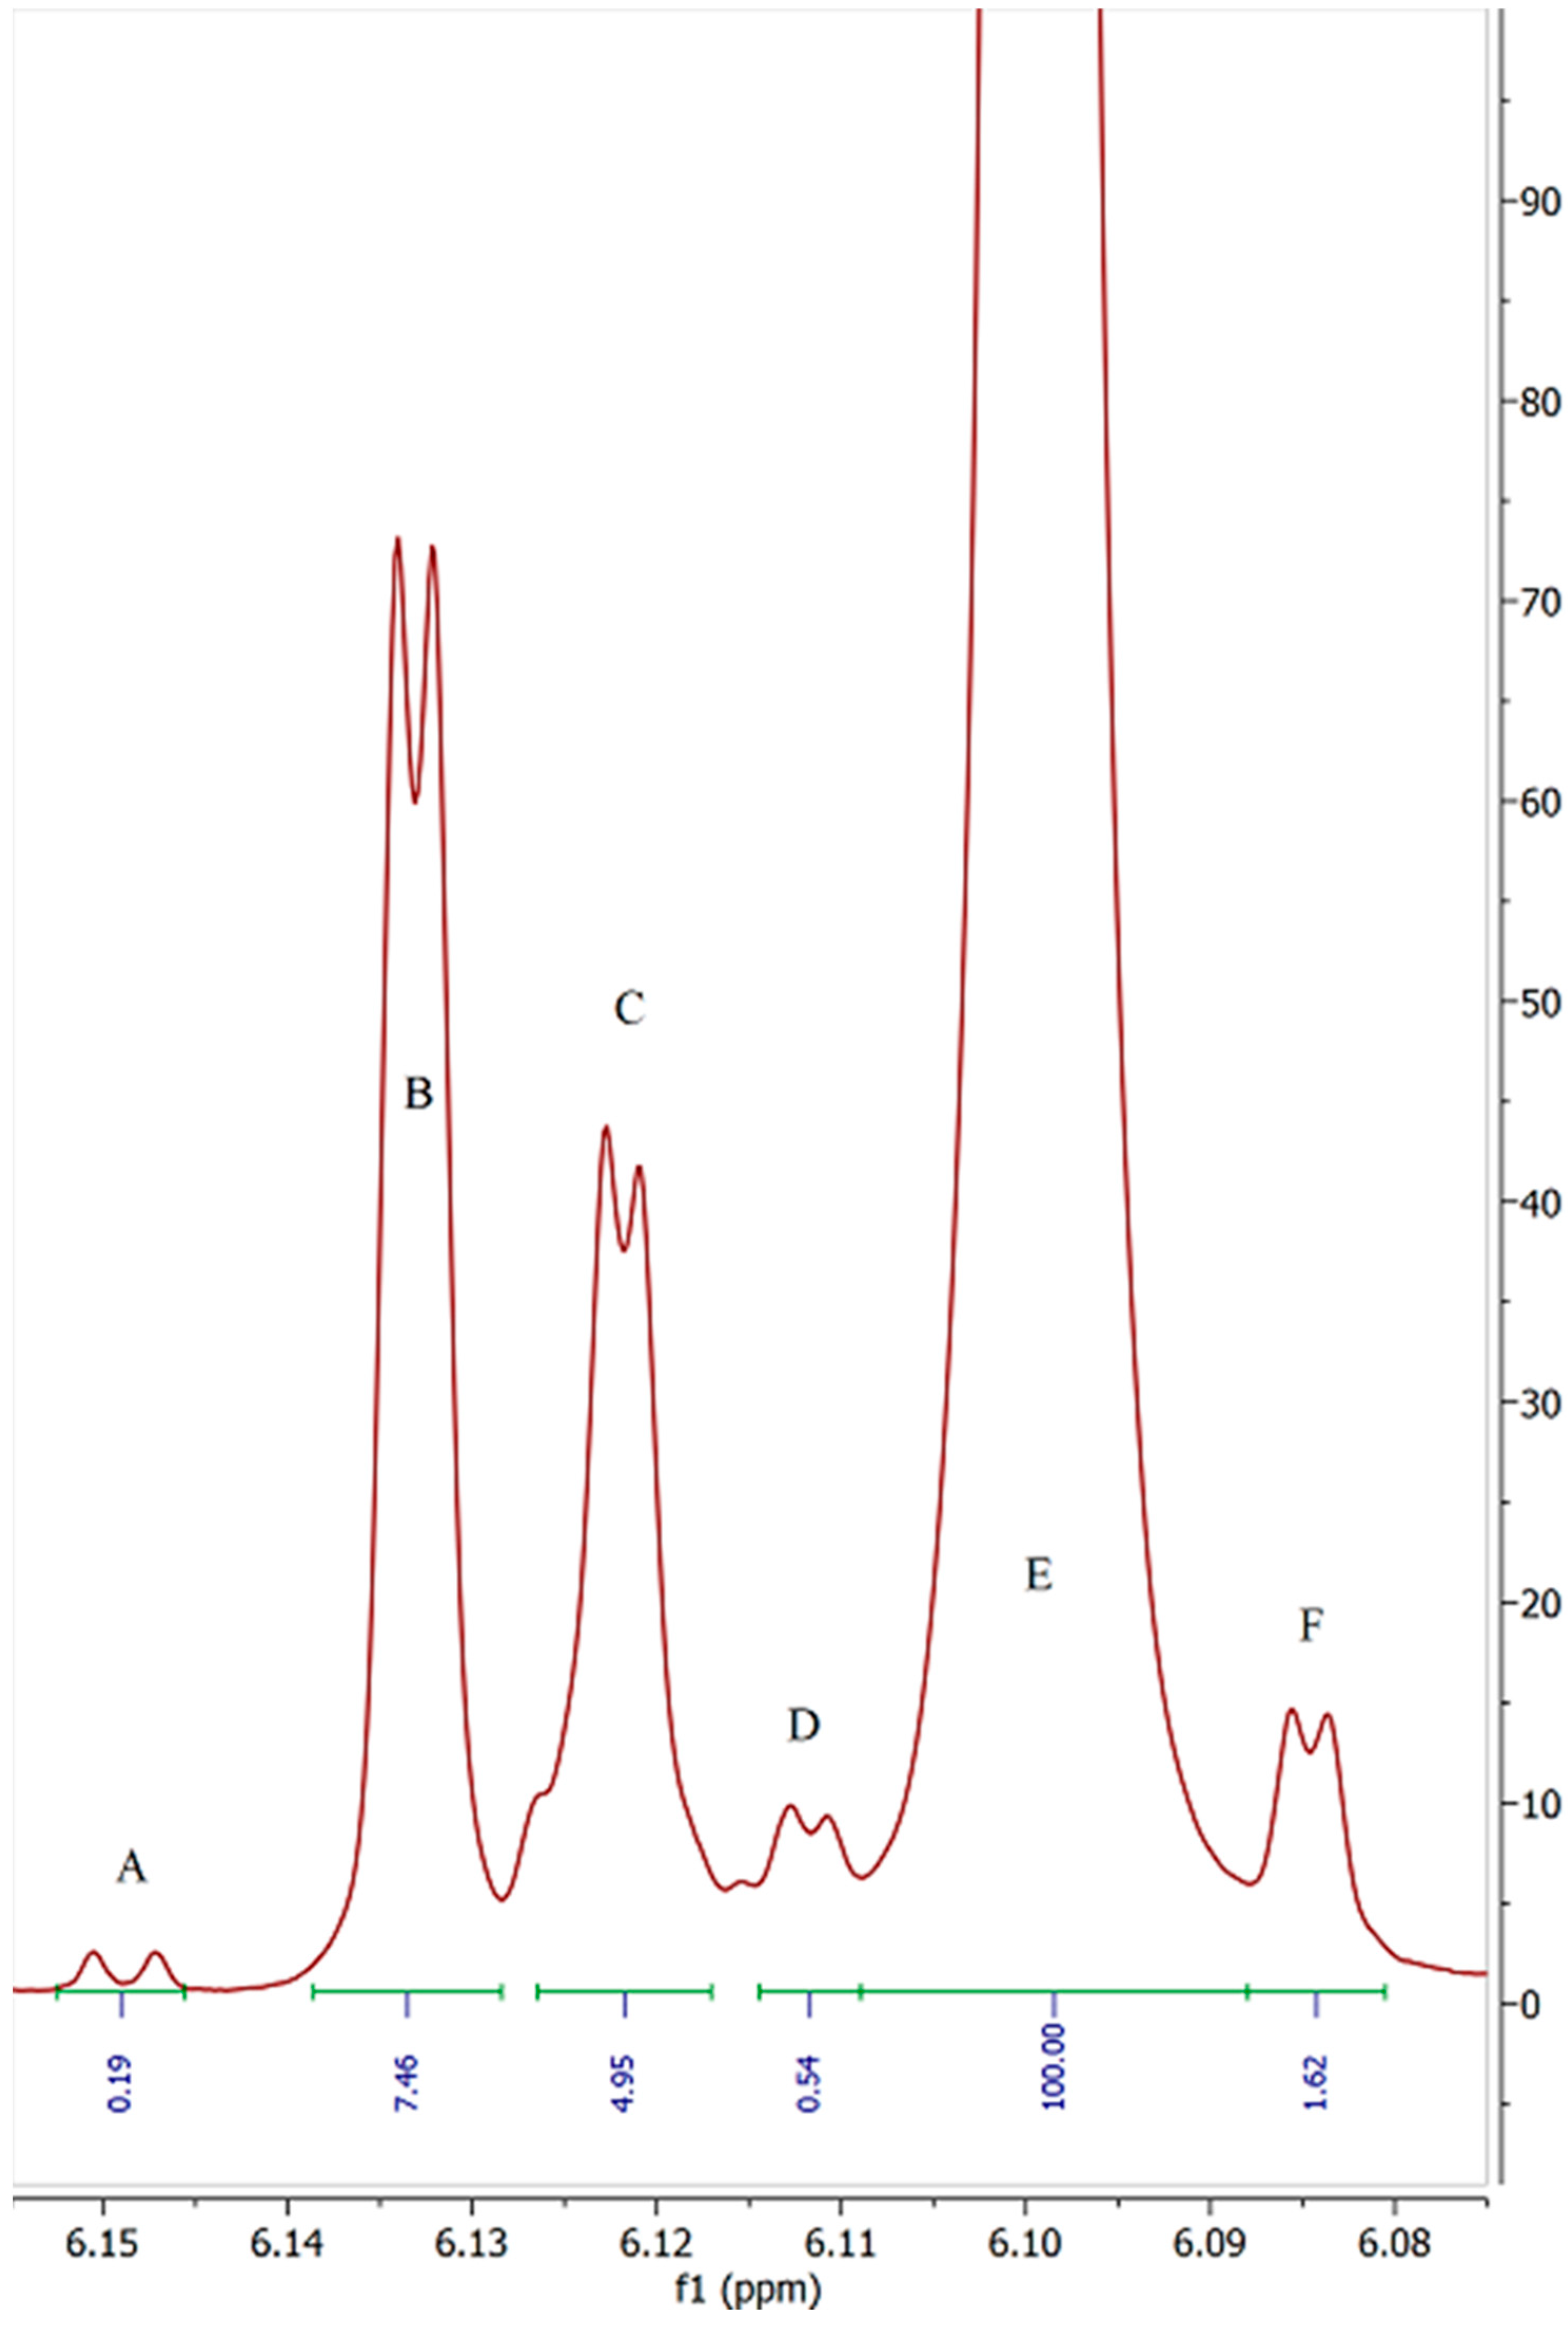
| Sample | Peak A | Peak B | Peak C | Peak D | Peak E (5′) | Peak F | Total Impurities (% of 5′ peak) | COA Purity Value |
|---|---|---|---|---|---|---|---|---|
| 1 | 0.05 | 4.33 | 4.86 | 0.56 | 100 | 1.31 | 11.72 | ≥99% Δ-8 THC |
| 2 | 0.16 | 7.52 | 6.63 | 0.24 | 100 | 1.47 | 16.30 | 94.7% Δ-8 THC |
| 3 | 0.27 | 7.5 | 5.71 | 0.12 | 100 | 1.76 | 14.76 | 93.43% Δ-8 THC |
| 4 | 0.31 | 2.9 | 12.74 | 0.47 | 100 | 0.4 | 17.29 | 87.1% Δ-8 THC |
| 5 | 0 | 2.92 | 12.87 | 0.31 | 100 | 0.48 | 14.50 | 93.4% Δ-8 THC |
| 6 | 0.09 | 4.44 | 6.05 | 4.49 | 100 | 0.83 | 14.54 | 92.96% Δ-8 THC |
| 7 | 0.44 | 3.29 | 5.1 | 0 | 100 | 0.22 | 8.28 | No COA supplied |
| 8 | 0.26 | 2.64 | 5.35 | 0.12 | 100 | 2.48 | 10.04 | 93.44% Δ-8 THC |
| 9 | 0.08 | 3.63 | 6.28 | 0.05 | 100 | 2.11 | 11.30 | 93.44% Δ-8 THC |
| 10 | 0.09 | 4.33 | 6.65 | 0 | 100 | 0.47 | 11.11 | 93.44% Δ-8 THC |
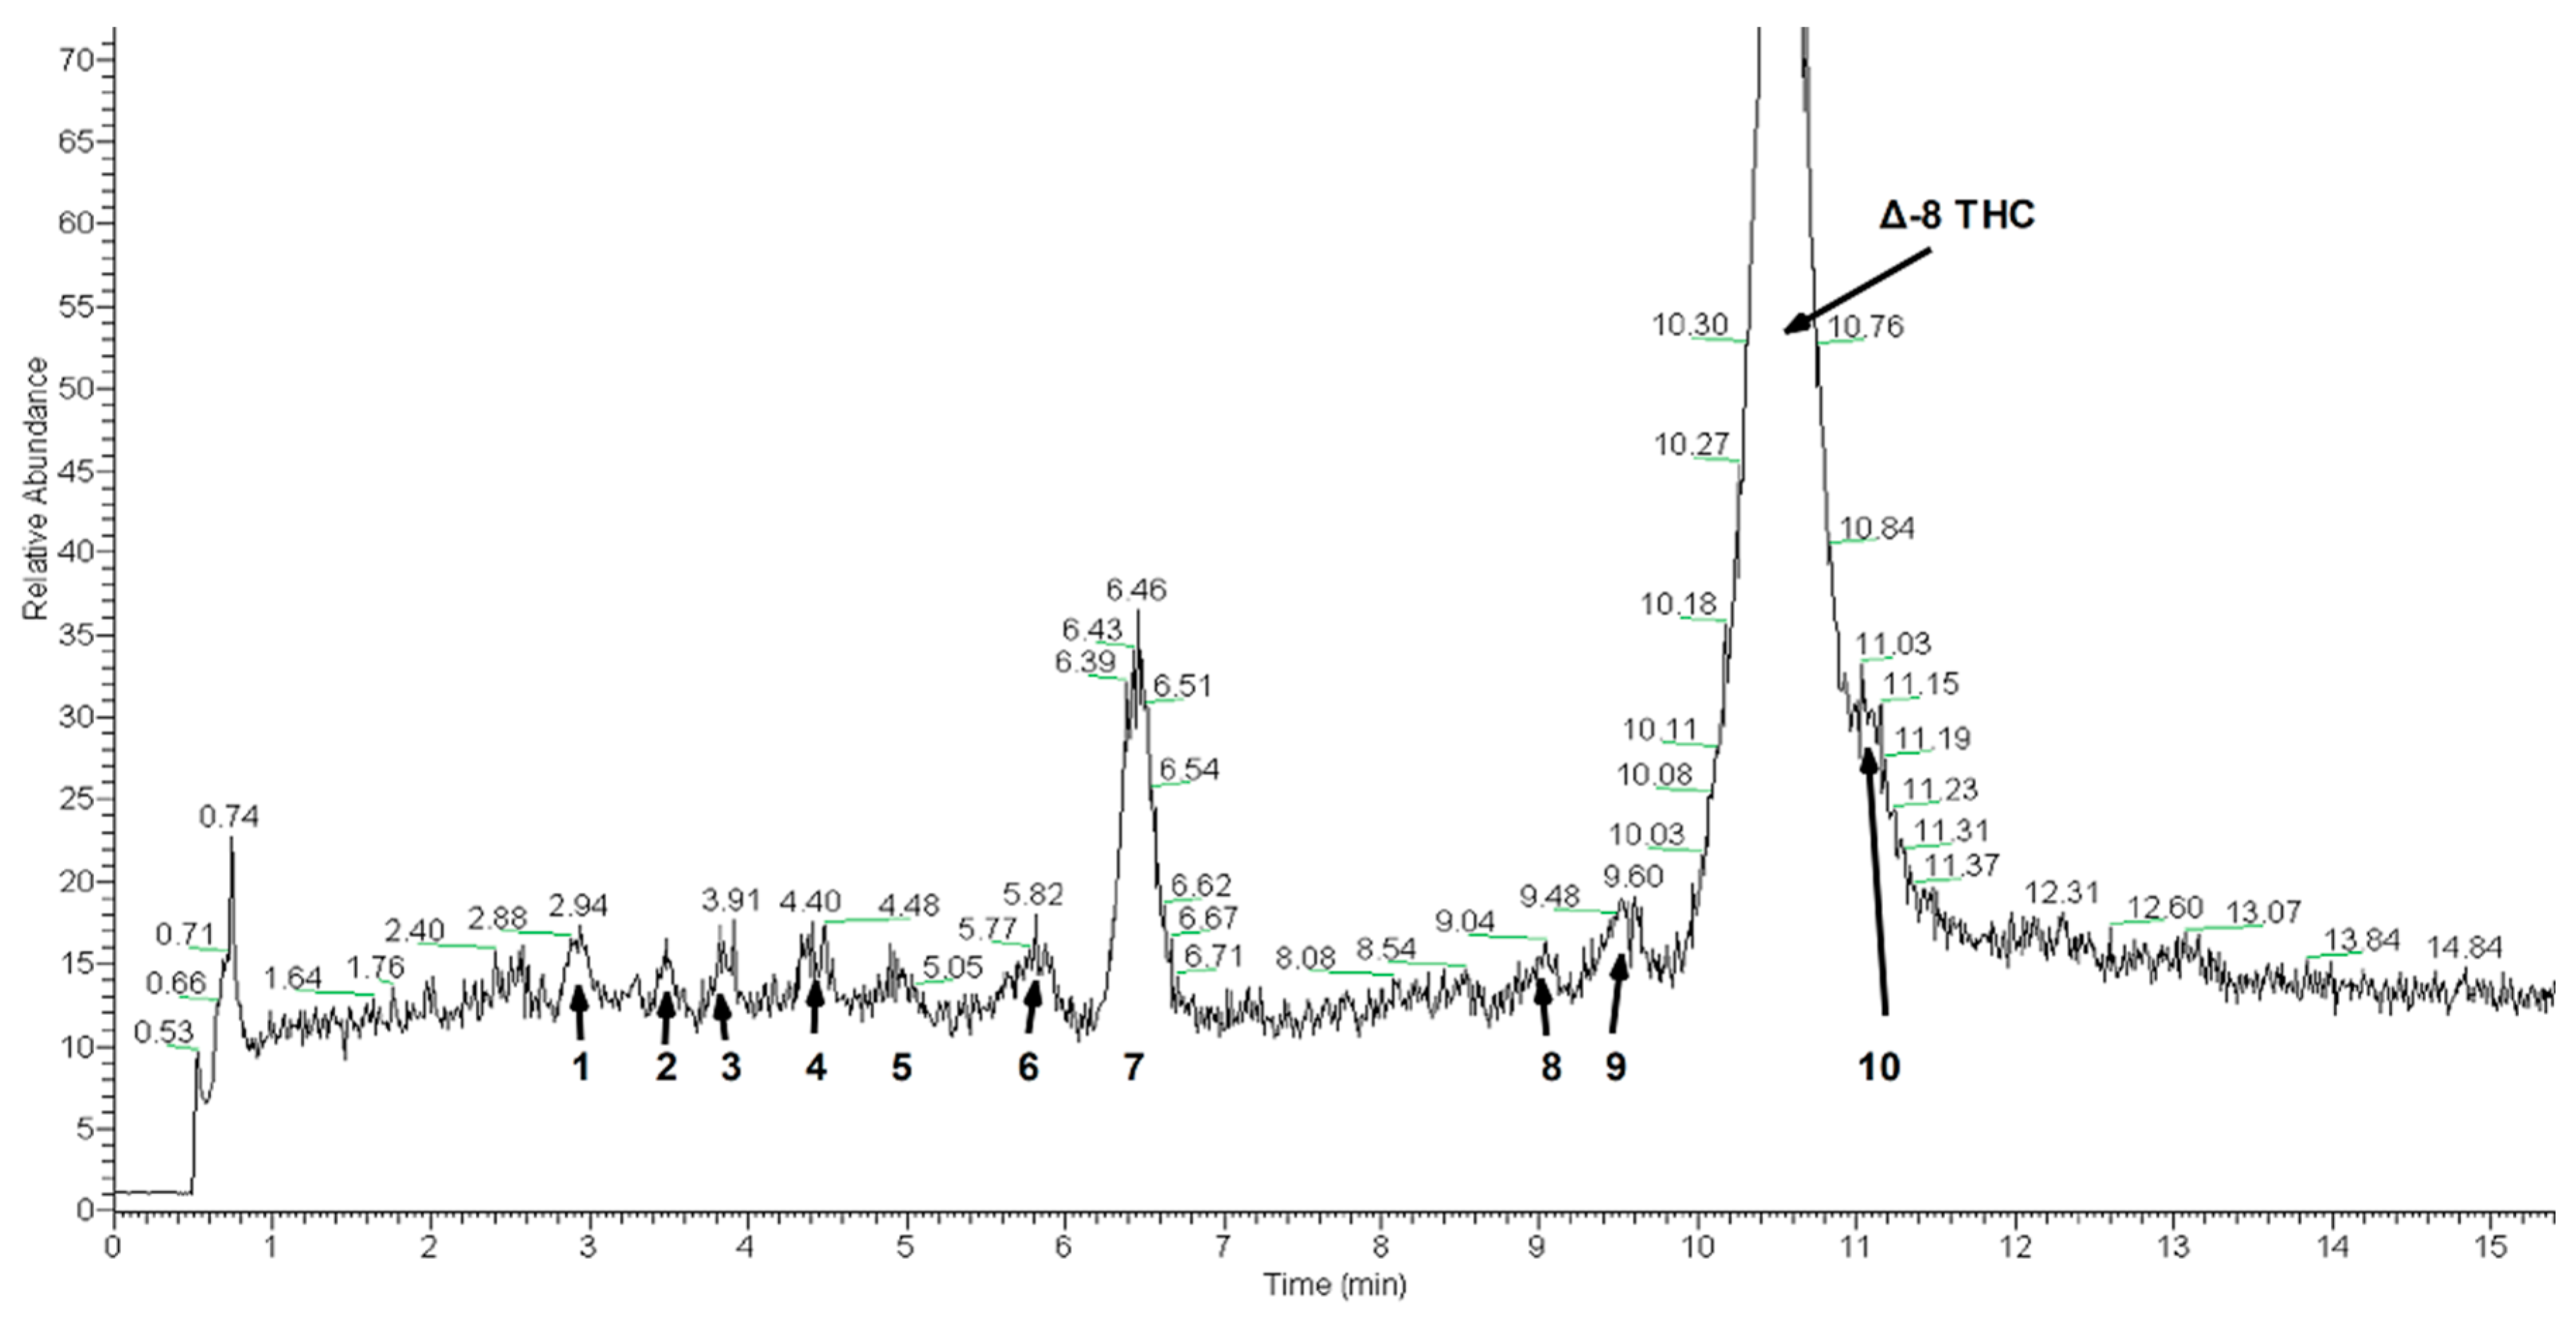
| Peak | Retention Time, Min | Major Peak [M + H], Da | Minor Peaks (>60% Intensity Relative to Base Peak), Da |
|---|---|---|---|
| 1 | 2.94 | 329.22 | 270.44, 254.42, 212.84, 166.84 |
| 2 | 3.65 | 329.13 | 315.20, 262.60, 212.79, 207.74, 166.86 |
| 3 | 3.91 | 254.04 | 330.23, 329.11, 254.60, 212.79, 207.67, 166.86 |
| 4 | 4.40 | 345.11 | 311.18, 246.48, 166.86 |
| 5 | 5.05 | 331.28 | 166.87 |
| 6 | 5.82 | 287.29 | None |
| 7 | 6.46 | 331.13 | None |
| 8 | 9.04 | 315.12 | None |
| 9 | 9.60 | 315.24 | None |
| 10 | 11.03 | 329.19 | 315.20 |
| Peak | TR (min) | Parent Ion [M + H], Da | Base Peak, Da | Fragment Ions, Da |
|---|---|---|---|---|
| 1 | 2.94 | 329.22 | 287.15 | 311.10, 301.30, 287.15, 272.97, 271.07, 245.17 |
| 2 | 3.65 | 329.13 | 287.07 | 311.08, 301.04, 287.07, 273.01, 271.14, 269.11, 259.10, 245.14, 231.09, 217.11 |
| 3 | 3.91 | 254.04 | 196.95 | 238.89, 235.81, 218.19, 217.15, 208.88, 196.95, 196.14, 194.80, 168.53, 160.90 |
| 4 | 4.40 | 345.11 | 327.02 | 327.02, 317.09, 303.02, 298.99, 289.87 |
| 5 | 5.05 | 331.28 | 313.12 | 313.12, 289.00, 273.11, 271.04, 259.01, 193.12, 106.92 |
| 6 | 5.82 | 287.29 | 231.07 | 269.09, 245.07, 231.07, 207.07, 205.06, 193.01, 165.07, 135.03 |
| 7 | 6.46 | 331.13 | 150.87 | 313.04, 289.09, 243.13, 233.05, 150.87, 107.04 |
| 8 | 9.04 | 315.12 | 259.07 | 297.16, 273.05, 259.07, 245.11, 233.06, 221.01, 207.05, 193.08, 181.04, 134.97 |
| 9 | 9.60 | 315.24 | 259.08 | 297.12, 273.06, 259.08, 235.08, 233.09, 231.15, 193.10, 181.04, 135.01 |
| 10 | 11.03 | 329.19 | 287.07 | 311.12, 287.07, 286.10, 273.04 |
| Δ-8 THC | 10.50 | 315 | 259 | 297, 235, 233, 193, 135 |
| CBD | 5.13 | 315 | 259 | 297, 235, 233, 193, 135 |
| Sample | Type of Sample | Color of Sample | Terpenes Added? | Certificate of Analysis (COA) |
|---|---|---|---|---|
| 1 | Distillate | Clear | N/A | ≥99% Δ-8 THC |
| 2 | Distillate | Clear | N/A | 94.7% Δ-8 THC |
| 3 | Distillate | Pink-Brown | N/A | 93.43% Δ-8 THC |
| 4 | Distillate | Brown | N/A | 87.1% Δ-8 THC |
| 5 | Distillate | Light Yellow | N/A | 93.4% Δ-8 THC |
| 6 | Vaporizer Cartridge | Yellow-Brown | Yes | 92.96% Δ-8 THC |
| 7 | Vaporizer Cartridge | Yellow-Brown | Yes | No COA Supplied |
| 8 | Vaporizer Cartridge | Yellow | Yes | 93.44% Δ-8 THC |
| 9 | Vaporizer Cartridge | Yellow | Yes | 93.44% Δ-8 THC |
| 10 | Vaporizer Cartridge | Yellow | Yes | 93.44% Δ-8 THC |
Publisher’s Note: MDPI stays neutral with regard to jurisdictional claims in published maps and institutional affiliations. |
© 2022 by the authors. Licensee MDPI, Basel, Switzerland. This article is an open access article distributed under the terms and conditions of the Creative Commons Attribution (CC BY) license (https://creativecommons.org/licenses/by/4.0/).
Share and Cite
Ray, C.L.; Bylo, M.P.; Pescaglia, J.; Gawenis, J.A.; Greenlief, C.M. Delta-8 Tetrahydrocannabinol Product Impurities. Molecules 2022, 27, 6924. https://doi.org/10.3390/molecules27206924
Ray CL, Bylo MP, Pescaglia J, Gawenis JA, Greenlief CM. Delta-8 Tetrahydrocannabinol Product Impurities. Molecules. 2022; 27(20):6924. https://doi.org/10.3390/molecules27206924
Chicago/Turabian StyleRay, Colleen L., Madison P. Bylo, Jonny Pescaglia, James A. Gawenis, and C. Michael Greenlief. 2022. "Delta-8 Tetrahydrocannabinol Product Impurities" Molecules 27, no. 20: 6924. https://doi.org/10.3390/molecules27206924
APA StyleRay, C. L., Bylo, M. P., Pescaglia, J., Gawenis, J. A., & Greenlief, C. M. (2022). Delta-8 Tetrahydrocannabinol Product Impurities. Molecules, 27(20), 6924. https://doi.org/10.3390/molecules27206924