

CO2 Sorbents Based on Spherical Carbon and Photoactive Metal Oxides: Insight into Adsorption Capacity, Selectivity and Regenerability

 ,
,  , , ,
, , ,  and
and 
Abstract
1. Introduction
2. Results and Discussion
3. Materials and Methods
3.1. Materials
3.2. Characterization Methods
4. Conclusions
Author Contributions
Funding
Institutional Review Board Statement
Informed Consent Statement
Data Availability Statement
Conflicts of Interest
Sample Availability
References
- Intergovernmental Panel on Climate Change. Special Report on Global Warming of 1.5 °C. Available online: https://www.ipcc.ch/site/assets/uploads/sites/2/2019/06/SR15_Full_Report_High_Res.pdf (accessed on 26 June 2022).
- Our World in Data. Available online: https://ourworldindata.org/emissions-by-sector (accessed on 26 June 2022).
- Sovacool, B. Valuing the greenhouse gas emissions from nuclear power: A critical survey. Energy Policy 2008, 36, 2950–2963. [Google Scholar] [CrossRef]
- Boot-Handford, M.E.; Abanades, J.C.; Anthony, E.J.; Blunt, M.J.; Brandani, S.; Mac Dowell, N.; Fernández, J.R.; Ferrari, M.-C.; Gross, R.; Hallett, J.P.; et al. Carbon capture and storage update. Energy Environ. Sci. 2014, 7, 130–189. [Google Scholar] [CrossRef]
- Al-Mamoori, A.; Krishnamurthy, A.; Rownaghi, A.; Rezaei, F. Carbon capture and utilization update. Energy Technol. 2017, 5, 834–849. [Google Scholar] [CrossRef]
- Kelemen, P.; Benson, S.; Pilorgé, H.; Psarras, P.; Wilcox, J. An overview of the status and challenges of CO2 storage in minerals and geological formations. Front. Clim. 2019, 1, 9. [Google Scholar] [CrossRef]
- Zahid, U.; Lim, Y.; Jung, J.; Han, C. CO2 geological storage: A review on present and future prospects. Korean J. Chem. Eng. 2011, 28, 674–685. [Google Scholar] [CrossRef]
- Li, L.; Zhao, N.; Wei, W.; Sun, Y. A review of research progress on CO2 capture, storage, and utilization in Chinese Academy of Sciences. Fuel 2013, 108, 112–130. [Google Scholar] [CrossRef]
- Osman, A.; Hefny, M.; Abdel Maksoud, M.; Elgarahy, A.; Rooney, D. Recent advances in carbon capture storage and utilisation technologies: A review. Environ. Chem. Lett. 2020, 19, 797–849. [Google Scholar] [CrossRef]
- Song, C.; Liu, Q.; Deng, S.; Li, H.; Kitamura, Y. Cryogenic-based CO2 capture technologies: State-of-the-art developments and current challenges. Renew. Sustain. Energy Rev. 2019, 101, 265–278. [Google Scholar] [CrossRef]
- Dideikin, A.; Vul, A. Graphene oxide and derivatives: The place in graphene family. Fron. Phys. 2019, 6, 149. [Google Scholar] [CrossRef]
- Sharma, A.; Jindal, J.; Mittal, A.; Kumari, K.; Maken, S.; Kumar, N. Carbon materials as CO2 adsorbents: A review. Environ. Chem. Lett. 2021, 19, 875–910. [Google Scholar] [CrossRef]
- Qiao, W.M.; Song, Y.; Lim, S.Y.; Hong, S.H.; Yoon, S.H.; Mochida, I.; Imaoka, T. Carbon nanospheres produced in an arc-discharge process. Carbon 2006, 44, 187–190. [Google Scholar] [CrossRef]
- Li, M.; Li, W.; Liu, S. Hydrothermal synthesis, characterization, and KOH activation of carbon spheres from glucose. Carbohydr. Res. 2011, 346, 999–1004. [Google Scholar] [CrossRef]
- Panickar, R.; Sobhan, C.; Chakravorti, S. Chemical vapor deposition synthesis of carbon spheres: Effects of temperature and hydrogen. Vacuum 2020, 172, 109108. [Google Scholar] [CrossRef]
- Pol, V.G.; Shrestha, L.K.; Ariga, K. Tunable, functional carbon spheres derived from rapid synthesis of resorcinol-formaldehyde resins. ACS Appl. Mater. Interfaces 2014, 6, 10649–10655. [Google Scholar] [CrossRef]
- Liu, J.; Qiao, S.Z.; Liu, H.; Chen, J.; Orpe, A.; Zhao, D.; Lu, G.X. Extension of the Stöber method to the preparation of monodisperse resorcinol-formaldehyde resin polymer and carbon spheres. Angew. Chem. Int. Ed. 2011, 50, 5947–5951. [Google Scholar] [CrossRef] [PubMed]
- Wickramaratne, N.; Jaroniec, M. Activated carbon spheres for CO2 adsorption. ACS Appl. Mater. Interfaces 2013, 5, 1849–1855. [Google Scholar] [CrossRef]
- Choma, J.; Kloske, M.; Dziura, A.; Stachurska, K.; Jaroniec, M. Preparation and studies of adsorption properties of microporous carbon spheres. Environ. Prot. Eng. 2016, 19, 169–182. [Google Scholar] [CrossRef]
- Yue, L.; Xia, Q.; Wang, L.; Wang, L.; DaCosta, H.; Yang, J.; Hu, X. CO2 adsorption at nitrogen-doped carbons prepared by K2CO3 activation of urea-modified coconut shell. J. Colloid Interface Sci. 2018, 511, 259–267. [Google Scholar] [CrossRef]
- Meng, L.; Park, S. Effect of ZnCl2 activation on CO2 adsorption of N-doped nanoporous carbons from polypyrrole. J. Solid State Chem. 2014, 218, 90–94. [Google Scholar] [CrossRef]
- Wang, Y.; Chang, B.; Guan, D.; Dong, X. Mesoporous activated carbon spheres derived from resorcinol-formaldehyde resin with high performance for supercapacitors. J. Solid State Electrochem. 2015, 19, 1783–1791. [Google Scholar] [CrossRef]
- Choma, J.; Osuchowski, L.; Marszewski, M.; Dziura, A.; Jaroniec, M. Developing microporosity in Kevlar®-derived carbon fibers by CO2 activation for CO2 adsorption. J. CO2 Util. 2016, 16, 17–22. [Google Scholar] [CrossRef]
- Zhou, J.; Luo, A.; Zhao, Y. Preparation and characterisation of activated carbon from waste tea by physical activation using steam. J. Air Waste Manag. Assoc. 2018, 68, 1269–1277. [Google Scholar] [CrossRef] [PubMed]
- Ludwinowicz, J.; Jaroniec, M. Potassium salt-assisted synthesis of highly microporous carbon spheres for CO2 adsorption. Carbon 2015, 82, 297–303. [Google Scholar] [CrossRef]
- Sibera, D.; Narkiewicz, U.; Kapica, J.; Serafin, J.; Michalkiewicz, B.; Wróbel, R.; Morawski, A.W. Preparation and characterisation of carbon spheres for carbon dioxide capture. J. Porous Mater. 2018, 26, 19–27. [Google Scholar] [CrossRef]
- Kandy, M. Carbon-based photocatalysts for enhanced photocatalytic reduction of CO2 to solar fuels. Sustain. Energy Fuels 2020, 4, 469–484. [Google Scholar] [CrossRef]
- Yamamoto, O.; Sawai, J.; Sasamoto, T. Activated carbon sphere with antibacterial characteristics. Mater. Trans. 2002, 43, 1069–1073. [Google Scholar] [CrossRef][Green Version]
- Wang, X.; Hu, P.; Fangli, Y.; Yu, L. Preparation and characterization of ZnO hollow spheres and ZnO-carbon composite materials using colloidal carbon spheres as templates. J. Phys. Chem. C 2007, 111, 6706–6712. [Google Scholar] [CrossRef]
- Pełech, I.; Sibera, D.; Staciwa, P.; Kusiak-Nejman, E.; Kapica-Kozar, J.; Wanag, A.; Narkiewicz, U. ZnO/carbon spheres with excellent regenerability for post-combustion CO2 capture. Materials 2021, 14, 6478. [Google Scholar] [CrossRef]
- Pełech, I.; Staciwa, P.; Sibera, D.; Kusiak-Nejman, E.; Morawski, A.W.; Kapica-Kozar, J.; Narkiewicz, U. The effect of the modification of carbon spheres with ZnCl2 on the adsorption properties towards CO2. Molecules 2022, 27, 1387. [Google Scholar] [CrossRef]
- Wang, H.; Wu, Z.; Liu, Y. A simple two-step template approach for preparing carbon-doped mesoporous TiO2 hollow microspheres. J. Phys. Chem. C 2009, 113, 13317–13324. [Google Scholar] [CrossRef]
- Bi, T.; Wan, J.; Yang, S.; Yu, X.; Ma, F. Photocatalytic activity of nitrogen-doped mesoporous carbon spheres supporting anatase TiO2 prepared by a simple two-step solvothermal approach. Nano 2015, 10, 1550076. [Google Scholar] [CrossRef]
- Morawski, A.; Staciwa, P.; Sibera, D.; Moszyński, D.; Zgrzebnicki, M.; Narkiewicz, U. Nanocomposite titania-carbon spheres as CO2 and CH4 sorbents. ACS Omega 2020, 5, 1966–1973. [Google Scholar] [CrossRef]
- Justh, N.; Bakos, L.P.; Hernádi, K.; Kiss, G.; Réti, B.; Erdélyi, Z.; Parditka, B.; Szilágyi, I.M. Photocatalytic hollow TiO2 and ZnO nanospheres prepared by atomic layer deposition. Sci. Rep. 2017, 7, 4337. [Google Scholar] [CrossRef]
- Jayarambabu, N. Germination and growth characteristics of mungbean seeds (Vigna radiata L.) affected by synthesized zinc oxide nanoparticles. Int. J. Curr. Eng. Technol. 2014, 4, 3411–3416. [Google Scholar]
- Gordon, S.H.; Mohamed, A.; Harry-O’kuru, R.E.; Imam, S.H. A chemometric method for correcting Fourier transform infrared spectra of biomaterials for interference from water in KBr discs. Appl. Spectrosc. 2010, 64, 448–457. [Google Scholar] [CrossRef] [PubMed]
- Deshmukh, A.A.; Mhlanga, S.D.; Coville, N.J. Carbon spheres. Mater. Sci. Eng. R Rep. 2010, 70, 1–28. [Google Scholar] [CrossRef]
- Farrokhi-Rad, M. Effect of Tris and acetic acid on the stability of titania nanoparticles in different alcohols and their electrophoretic deposition process. Process. Appl. Ceram. 2018, 12, 56–65. [Google Scholar] [CrossRef]
- Zhang, Q.; Li, J.; Lin, Q.; Fang, C. A stiff ZnO/carbon foam composite with second-level macroporous structure filled ZnO particles for heavy metal ions removal. Environ. Res. 2020, 188, 109698. [Google Scholar] [CrossRef] [PubMed]
- Jiang, X.; Yu, L.; Yao, C.; Zhang, F.; Zhang, J.; Li, C. Synthesis and characterization of Gd2O3 hollow microspheres using a template-directed method. Materials 2016, 9, 323. [Google Scholar] [CrossRef]
- Chang, B.; Guan, D.; Tian, Y.; Yang, Z.; Dong, X. Convenient synthesis of porous carbon nanospheres with tunable pore structure and excellent adsorption capacity. J. Hazard. Mater. 2013, 262, 256–264. [Google Scholar] [CrossRef]
- Demir-Cakan, R.; Baccile, N.; Antonietti, M.; Titirici, M.M. Carboxylate-rich carbonaceous materials via one-step hydrothermal carbonization of glucose in the presence of acrylic acid. Chem. Mater. 2009, 21, 484–490. [Google Scholar] [CrossRef]
- Wang, G.; Xu, L.; Zhang, J.; Yin, T.; Han, D. Enhanced photocatalytic activity of TiO2 powders (P25) via calcination treatment. Int. J. Photoenergy 2012, 2012, 265760. [Google Scholar] [CrossRef]
- Nagaraju, G.; Udayabhanu; Shivaraja; Prashanth, S.A.; Shastri, M.; Yathish, K.V.; Anupama, C.; Rangappa, D. Electrochemical heavy metal detection, photocatalytic, photoluminescence, biodiesel production and antibacterial activities of Ag–ZnO nanomaterial. Mater. Res. Bull. 2017, 94, 54–63. [Google Scholar] [CrossRef]
- Hongbin, L.; Youzhen, Z.; Sascha, V.; Shaochun, T.; Xiangkang, M. Effects of hydrothermal temperature on formation and decoloration characteristics of anatase TiO2 nanoparticles. Sci. China Technol. Sci. 2012, 55, 894–902. [Google Scholar]
- Galaburda, M.V.; Bogatyrov, V.M.; Skubiszewska-Zięba, J.; Oranska, O.I.; Sternik, D.; Gun’ko, V.M. Synthesis and structural features of resorcinol-formaldehyde resin chars containing nickel nanoparticles. Appl. Surf. Sci. 2016, 360, 722–730. [Google Scholar] [CrossRef]
- Lin, C.; Ritter, J.A. Effect of synthesis pH on the structure of carbon xerogels. Carbon 1997, 35, 1271–1278. [Google Scholar] [CrossRef]
- Sedghi, R.; Asadi, S.; Heidari, B.; Heravi, M.M. TiO2/polymeric supported silver nanoparticles applied as superior nanocatalyst in reduction reactions. Mater. Res. Bull. 2017, 92, 65–73. [Google Scholar] [CrossRef]
- Robertson, C.; Mokaya, R. Microporous activated carbon aerogels via a simple subcritical drying route for CO2 capture and hydrogen storage. Micropor. Mesopor. Mater. 2013, 179, 151–156. [Google Scholar] [CrossRef]
- Jin, Z.; Gao, C.; Hsu, W.K.; Zhu, Y.; Huczko, A.; Bystrzejewski, M.; Roe, M.; Lee, C.Y.; Acquah, S.; Kroto, H.; et al. Large-scale synthesis and characterization of carbon spheres prepared by direct pyrolysis of hydrocarbons. Carbon 2005, 43, 1944–1953. [Google Scholar] [CrossRef]
- Thommes, M.; Kaneko, K.; Neimark, A.V.; Olivier, J.P.; Rodríguez-Reinoso, F.; Rouquerol, J.; Sing, K.S. Physisorption of gases, with special reference to the evaluation of surface area and pore size distribution (IUPAC Technical Report). Pure Appl. Chem. 2015, 87, 1051–1069. [Google Scholar] [CrossRef]
- Guang, Y. Facile one-step synthetic route to mesoporous N-doped attapulgite (ATP)@carbon composite through hydrothermal carbonization and the application to adsorbing toxic metal ions. Chem. Lett. 2015, 44, 369–371. [Google Scholar]
- Ribeiro, E.; Plantard, G.; Teyssandier, F.; Maury, F.; Sadiki, N.; Chaumont, D.; Goetz, V. Activated-carbon/TiO2 composites preparation: An original grafting by milling approach for solar water treatment applications. J. Environ. Chem. Eng. 2020, 8, 104115. [Google Scholar] [CrossRef]
- Marsh, H.; Rodríguez Reinoso, F. Activated Carbon, 1st ed.; Elsevier Ltd.: Oxford, MS, USA, 2006; pp. 157–164. [Google Scholar]
- Myers, A.; Prausnitz, J.M. Thermodynamics of mixed-gas adsorption. AIChE J. 1965, 11, 121–127. [Google Scholar] [CrossRef]


| StructuralProperties → | SBET | TPV | Vs (<1 nm) | Vm (<2 nm) | Vmeso | CO2 0 °C | CO2 25 °C | |
|---|---|---|---|---|---|---|---|---|
| Sample Code ↓ | (m2/g) | (cm3/g) | (cm3/g) | (cm3/g) | (cm3/g) | (mmol/g) | (mmol/g) | |
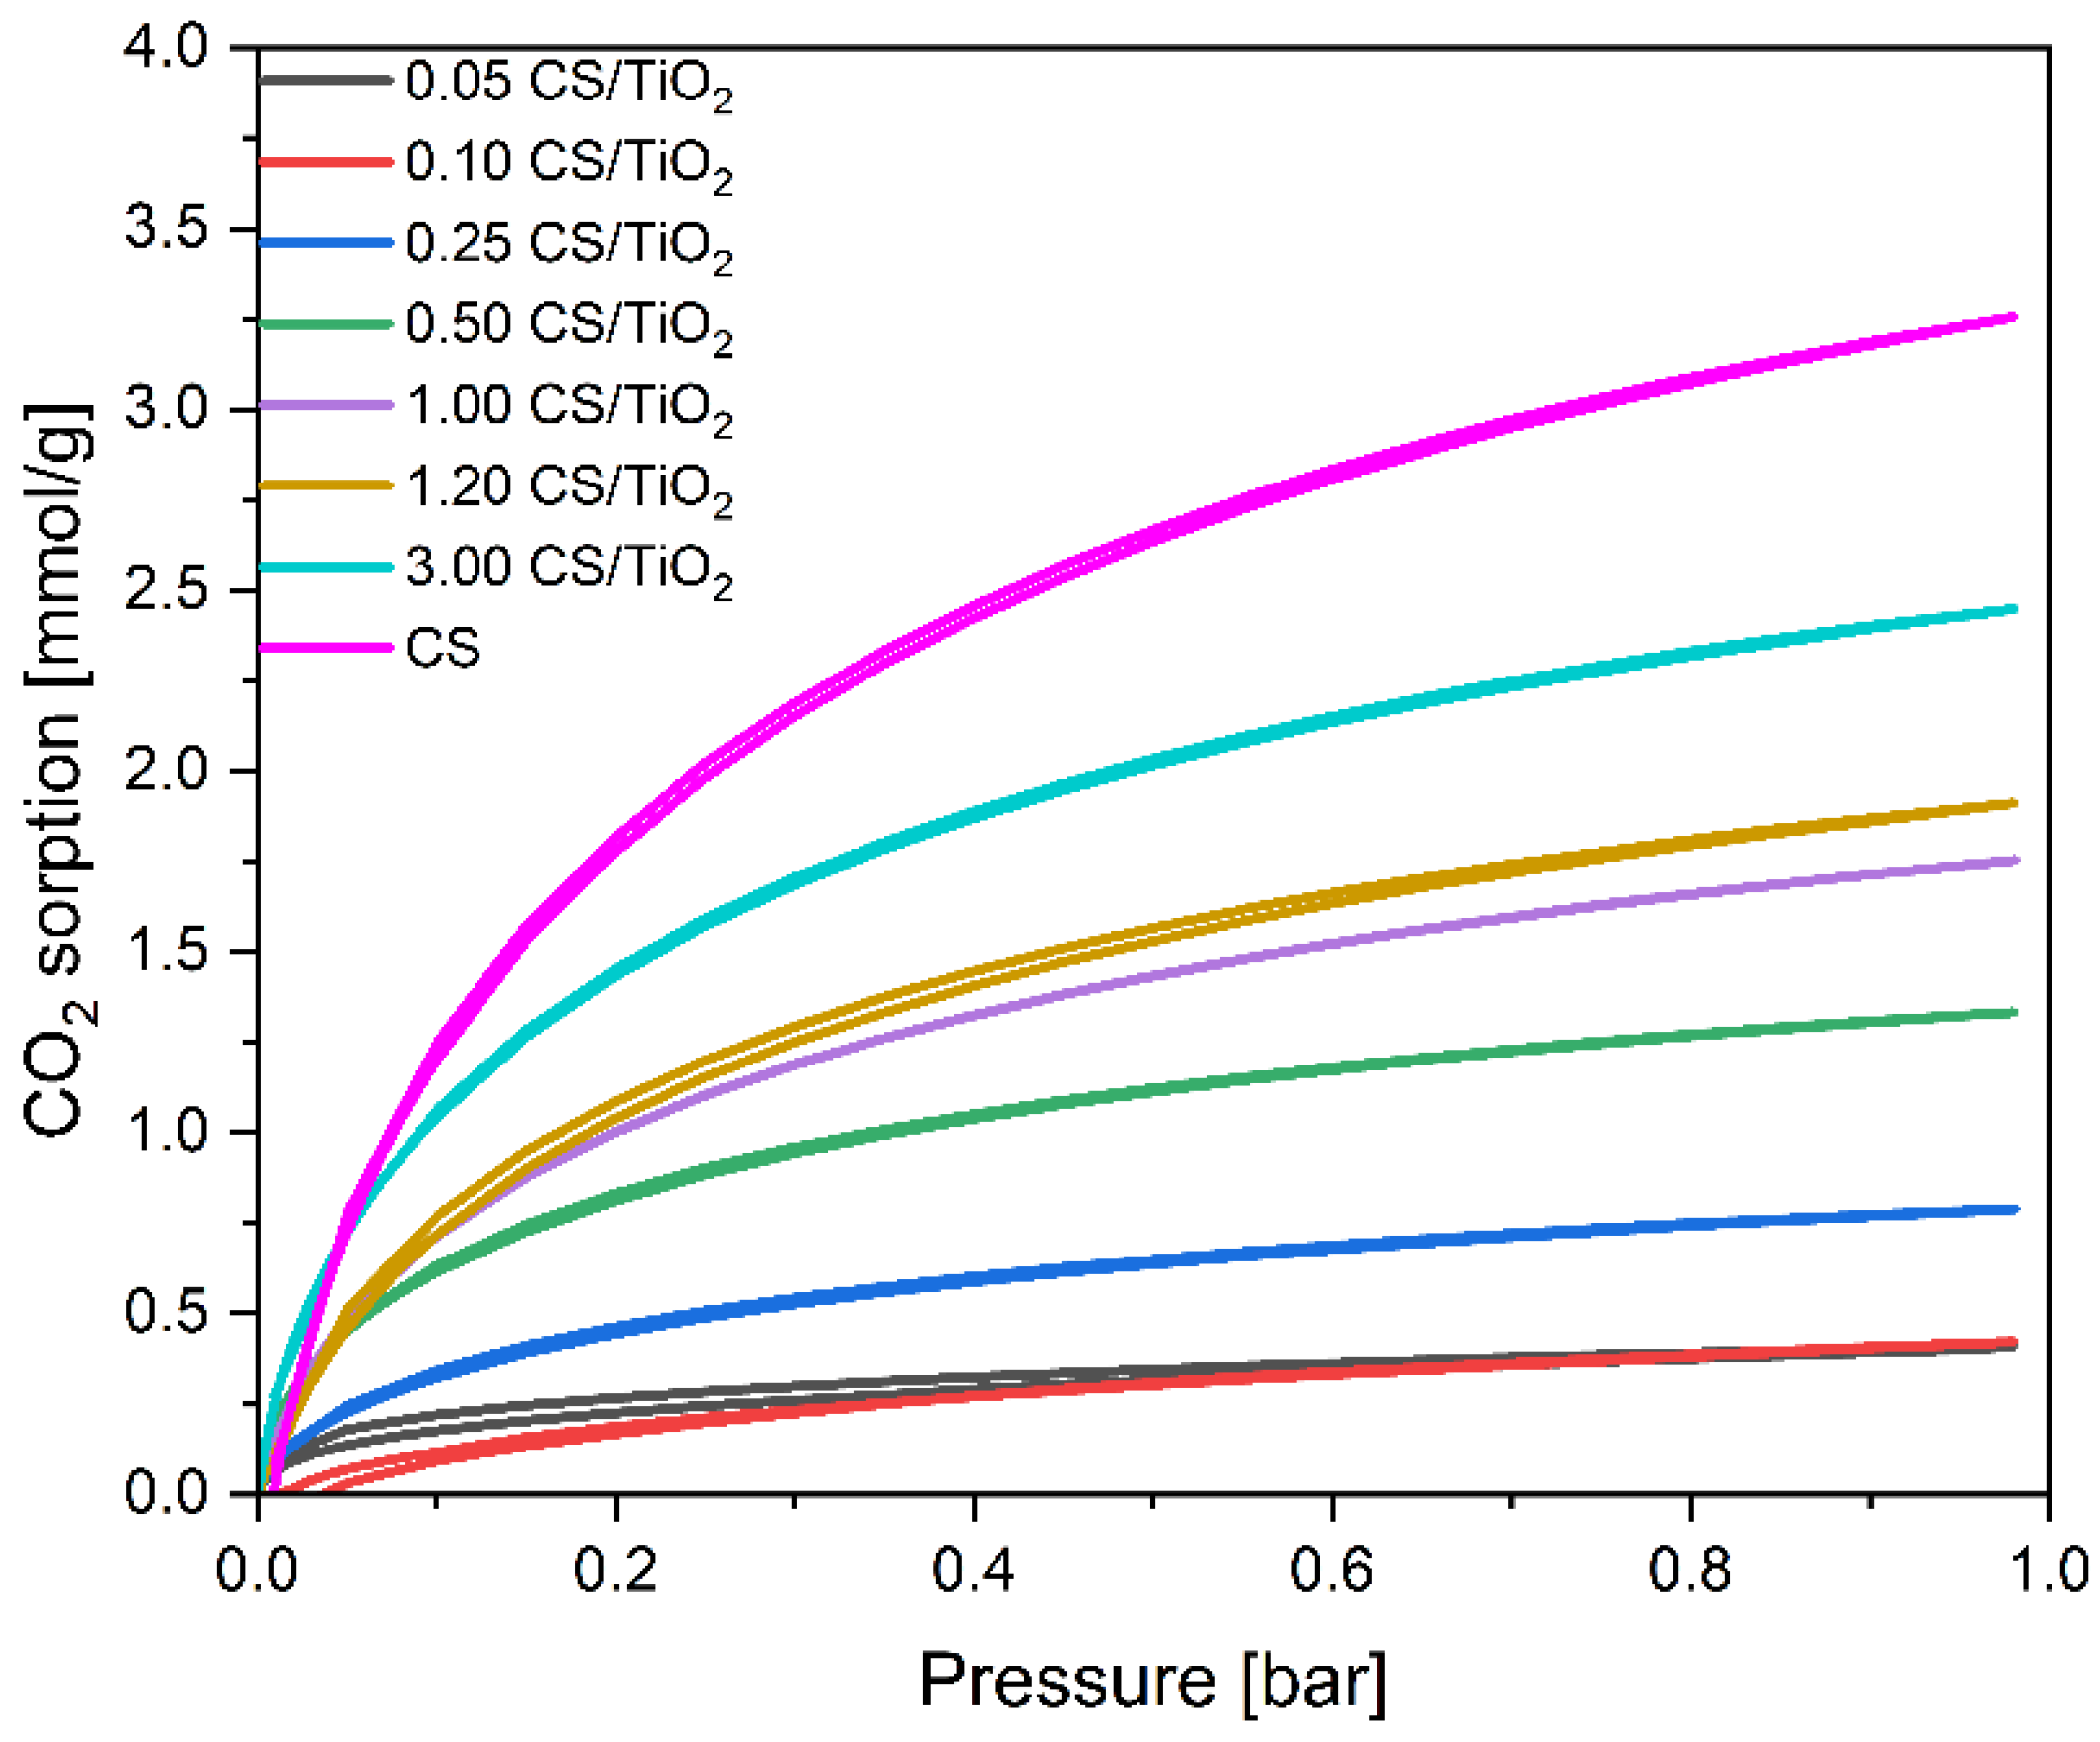
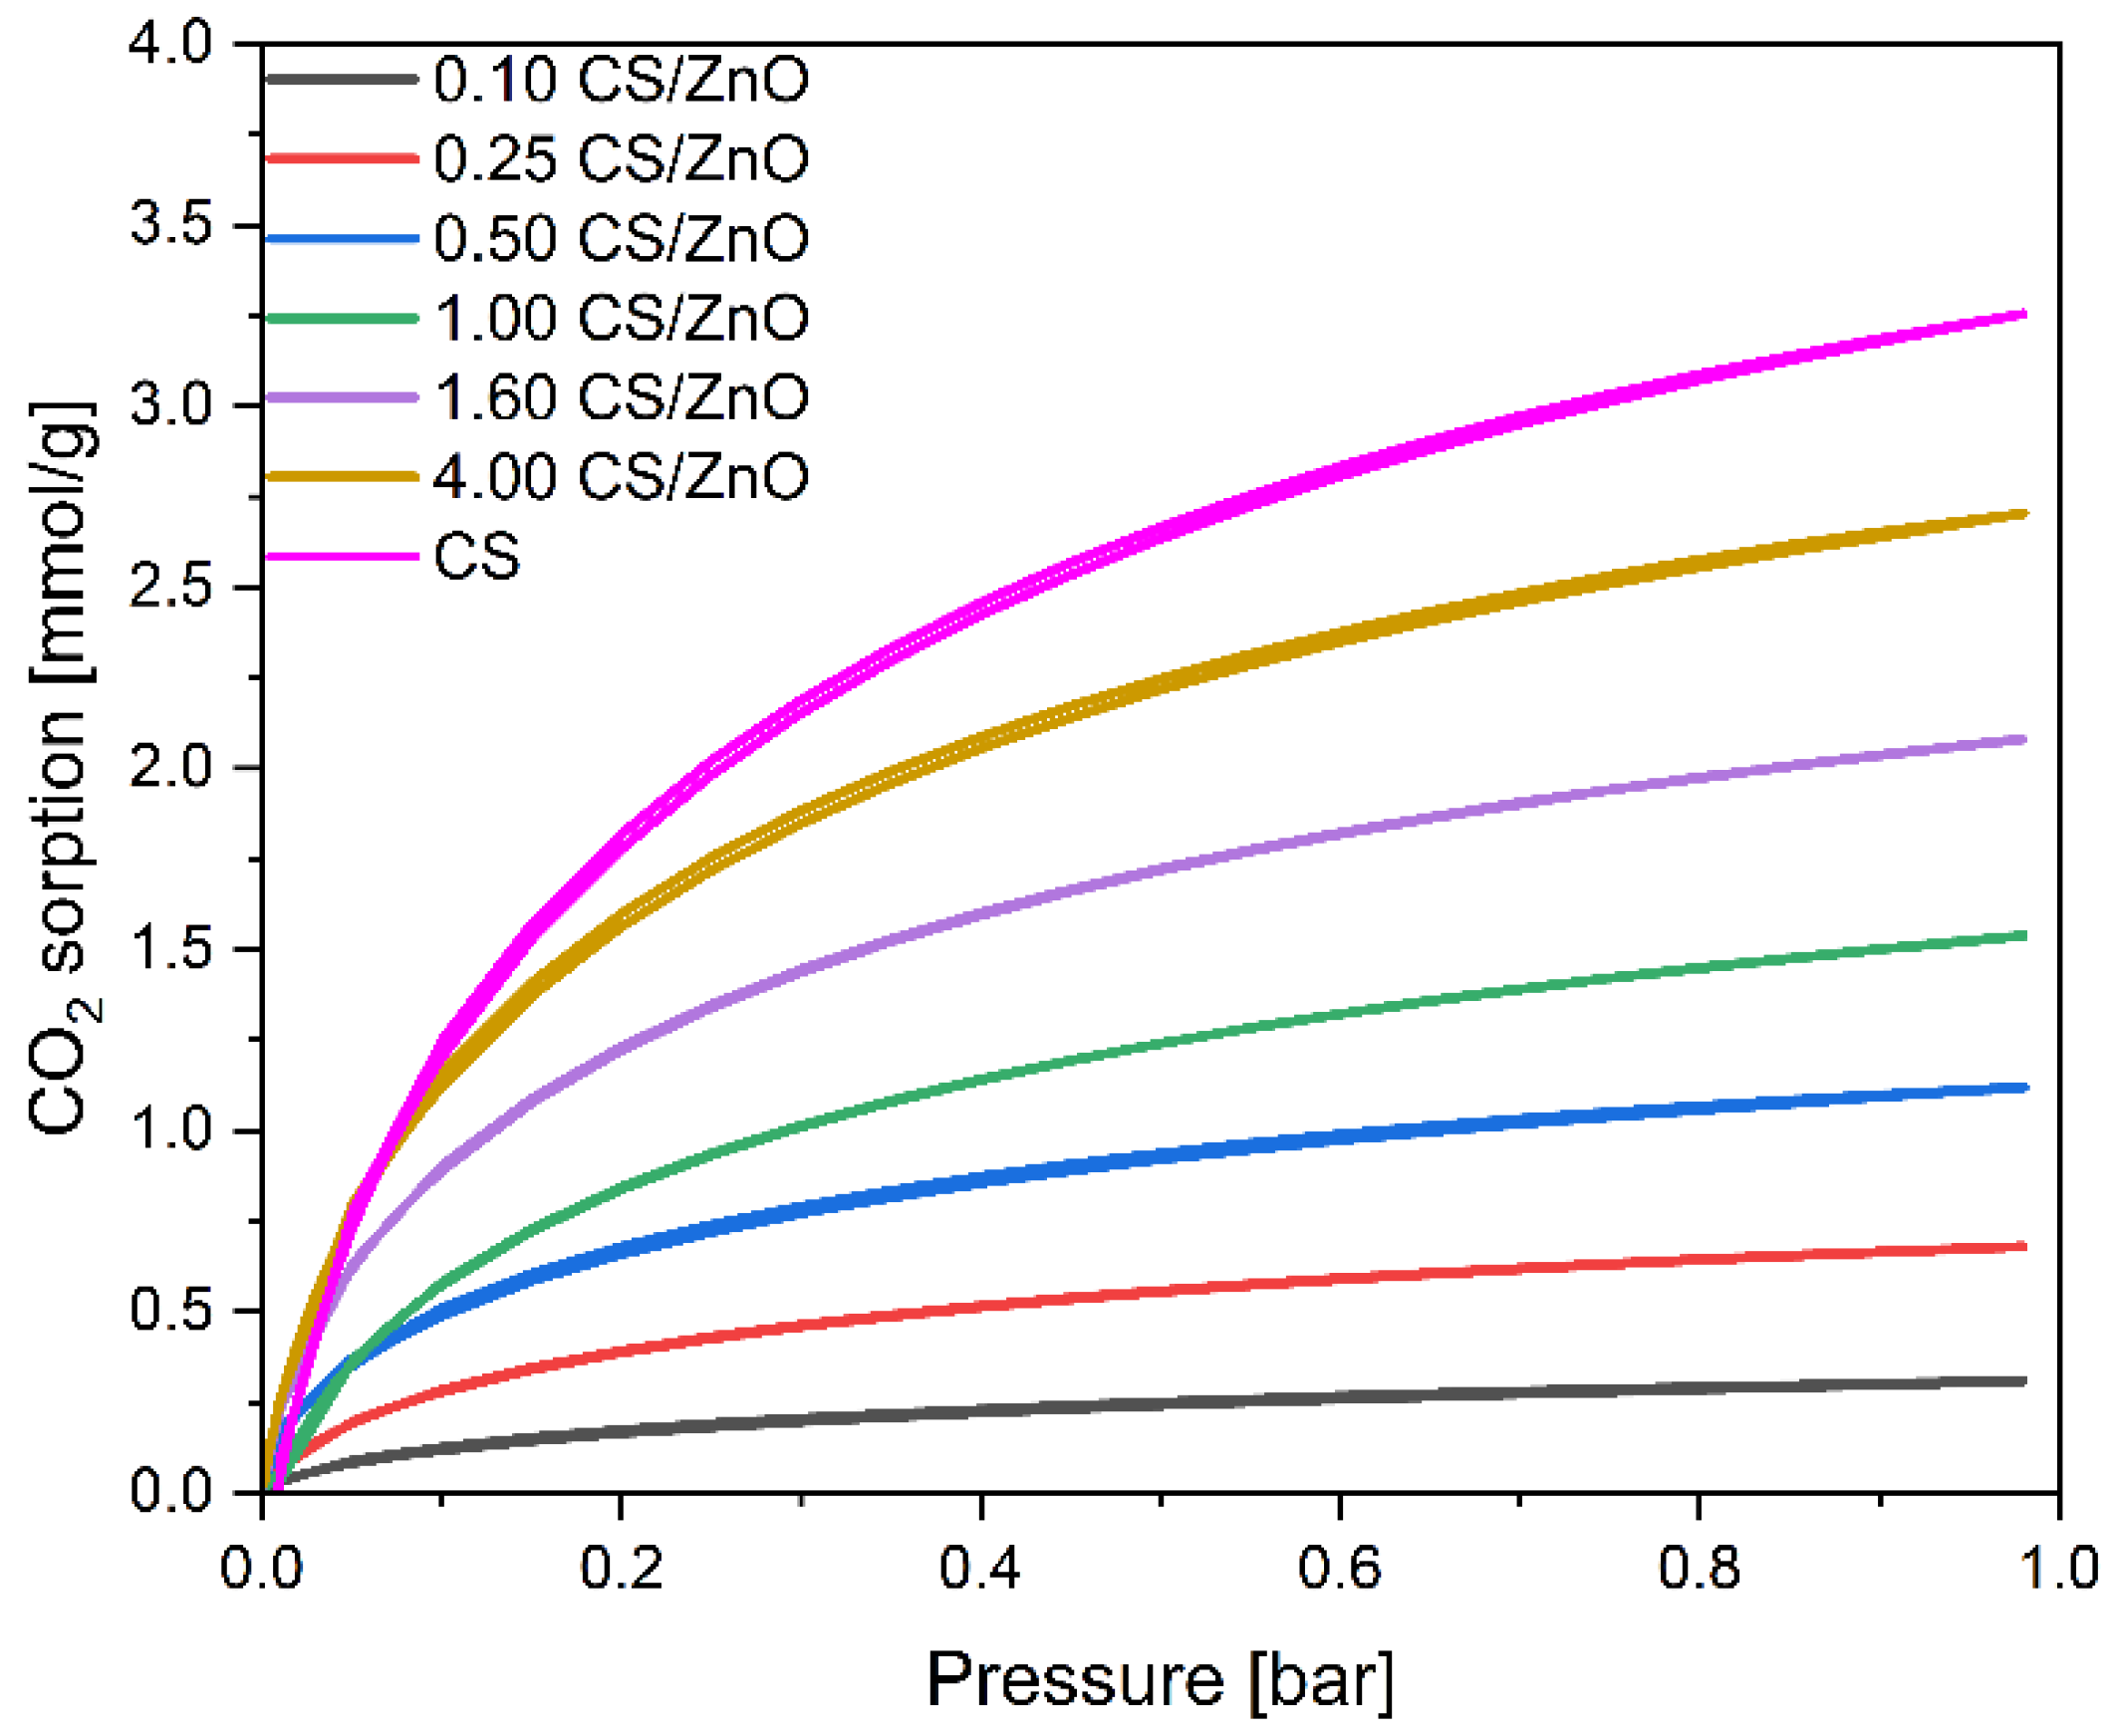
| CS | 455 | 0.26 | 0.19 | 0.22 | 0.04 | 3.25 | 2.43 | |
| TiO2 | 54 | 0.40 | - | 0.02 | 0.38 | - | - | |
| ZnO | 11 | 0.03 | - | 0.00 | 0.03 | - | - | |
| 0.05 CS/TiO2 | 77 | 0.33 | 0.02 | 0.02 | 0.31 | 0.41 | 0.29 | |
| 0.10 CS/TiO2 | 89 | 0.34 | 0.03 | 0.03 | 0.31 | 0.42 | 0.33 | |
| 0.25 CS/TiO2 | 132 | 0.43 | 0.04 | 0.04 | 0.39 | 0.79 | 0.54 | |
| 0.50 CS/TiO2 | 181 | 0.37 | 0.07 | 0.07 | 0.30 | 1.33 | 0.90 | |
| 1.00 CS/TiO2 | 247 | 0.33 | 0.10 | 0.11 | 0.22 | 1.75 | 1.22 | |
| 1.20 CS/TiO2 | 248 | 0.36 | 0.11 | 0.11 | 0.25 | 1.91 | 1.36 | |
| 3.00 CS/TiO2 | 353 | 0.24 | 0.13 | 0.16 | 0.08 | 2.45 | 1.66 | |
| 0.10 CS/ZnO | 44 | 0.13 | 0.02 | 0.02 | 0.11 | 0.31 | 0.21 | |
| 0.25 CS/ZnO | 92 | 0.13 | 0.04 | 0.04 | 0.09 | 0.68 | 0.46 | |
| 0.50 CS/ZnO | 145 | 0.13 | 0.06 | 0.06 | 0.07 | 1.12 | 0.74 | |
| 1.00 CS/ZnO | 209 | 0.13 | 0.09 | 0.10 | 0.03 | 1.54 | 1.11 | |
| 1.60 CS/ZnO | 275 | 0.18 | 0.11 | 0.12 | 0.06 | 2.08 | 1.41 | |
| 4.00 CS/ZnO | 366 | 0.21 | 0.15 | 0.17 | 0.04 | 2.70 | 1.88 | |
Publisher’s Note: MDPI stays neutral with regard to jurisdictional claims in published maps and institutional affiliations. |
© 2022 by the authors. Licensee MDPI, Basel, Switzerland. This article is an open access article distributed under the terms and conditions of the Creative Commons Attribution (CC BY) license (https://creativecommons.org/licenses/by/4.0/).
Share and Cite
Pełech, I.; Kusiak-Nejman, E.; Staciwa, P.; Sibera, D.; Kapica-Kozar, J.; Wanag, A.; Latzke, F.; Pawłowska, K.; Michalska, A.; Narkiewicz, U.; et al. CO2 Sorbents Based on Spherical Carbon and Photoactive Metal Oxides: Insight into Adsorption Capacity, Selectivity and Regenerability. Molecules 2022, 27, 6802. https://doi.org/10.3390/molecules27206802
Pełech I, Kusiak-Nejman E, Staciwa P, Sibera D, Kapica-Kozar J, Wanag A, Latzke F, Pawłowska K, Michalska A, Narkiewicz U, et al. CO2 Sorbents Based on Spherical Carbon and Photoactive Metal Oxides: Insight into Adsorption Capacity, Selectivity and Regenerability. Molecules. 2022; 27(20):6802. https://doi.org/10.3390/molecules27206802
Chicago/Turabian StylePełech, Iwona, Ewelina Kusiak-Nejman, Piotr Staciwa, Daniel Sibera, Joanna Kapica-Kozar, Agnieszka Wanag, Filip Latzke, Karolina Pawłowska, Adrianna Michalska, Urszula Narkiewicz, and et al. 2022. "CO2 Sorbents Based on Spherical Carbon and Photoactive Metal Oxides: Insight into Adsorption Capacity, Selectivity and Regenerability" Molecules 27, no. 20: 6802. https://doi.org/10.3390/molecules27206802
APA StylePełech, I., Kusiak-Nejman, E., Staciwa, P., Sibera, D., Kapica-Kozar, J., Wanag, A., Latzke, F., Pawłowska, K., Michalska, A., Narkiewicz, U., & Morawski, A. W. (2022). CO2 Sorbents Based on Spherical Carbon and Photoactive Metal Oxides: Insight into Adsorption Capacity, Selectivity and Regenerability. Molecules, 27(20), 6802. https://doi.org/10.3390/molecules27206802