Review

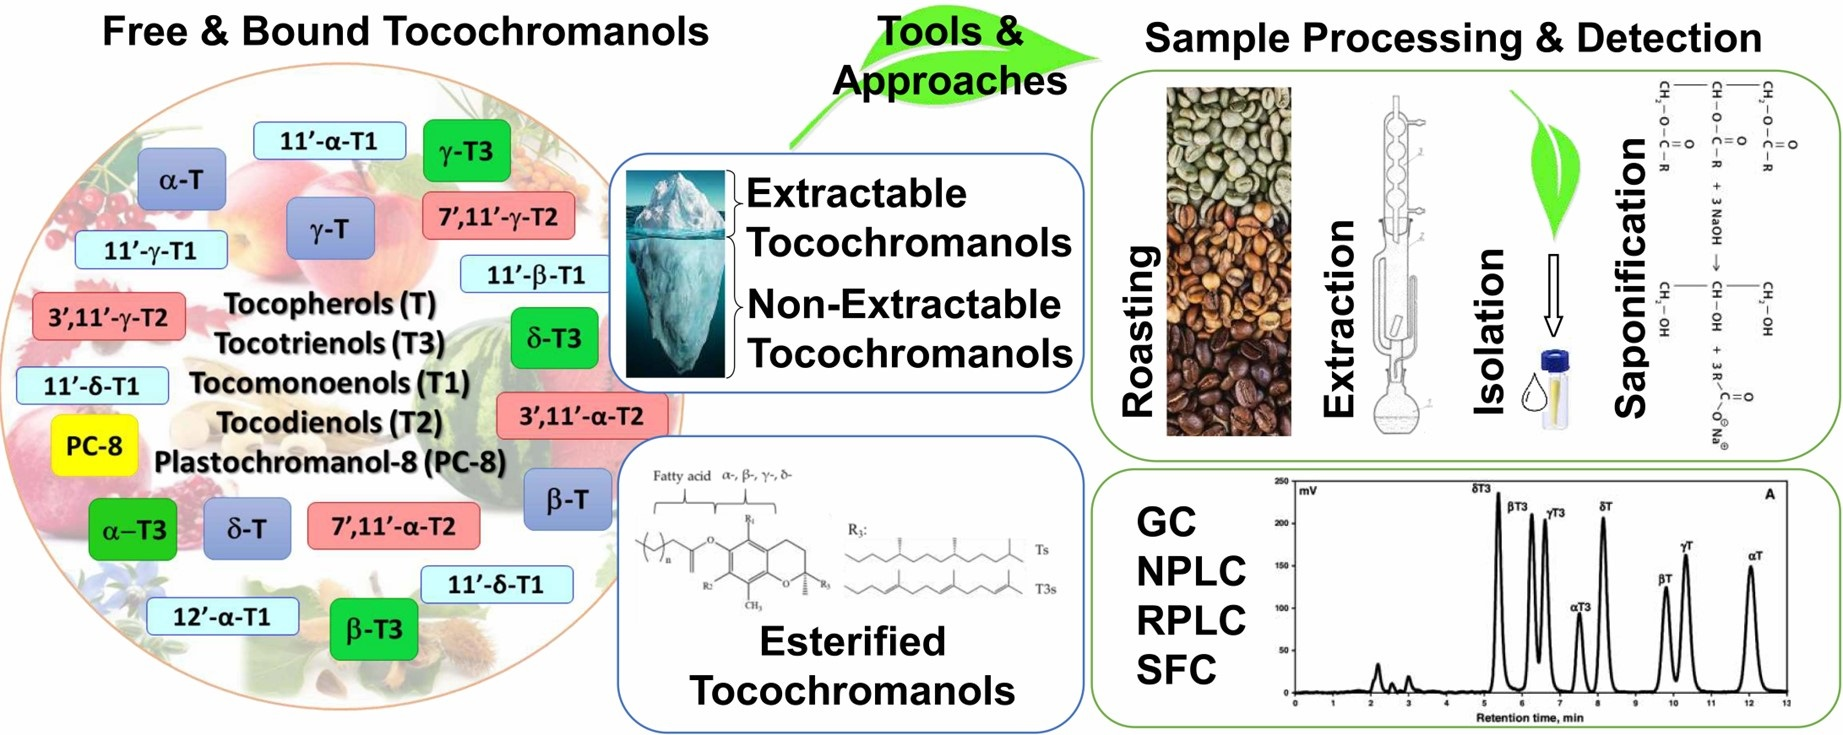
Free and Esterified Tocopherols, Tocotrienols and Other Extractable and Non-Extractable Tocochromanol-Related Molecules: Compendium of Knowledge, Future Perspectives and Recommendations for Chromatographic Techniques, Tools, and Approaches Used for Tocochromanol Determination

by
Paweł Górnaś
1,*,
Georgijs Baškirovs
1 and
Aleksander Siger
2
1
Institute of Horticulture, Graudu 1, LV-3701 Dobele, Latvia
2
Department of Food Biochemistry and Analysis, Poznan University of Life Sciences, Wojska Polskiego 48, 60-637 Poznan, Poland
*
Author to whom correspondence should be addressed.
Molecules 2022, 27(19), 6560; https://doi.org/10.3390/molecules27196560
Submission received: 1 August 2022 / Revised: 22 September 2022 / Accepted: 23 September 2022 / Published: 4 October 2022
(This article belongs to the Special Issue Antioxidants from Natural Sources: Separation and Characterization)

Abstract

:
Free and esterified (bound) tocopherols, tocotrienols and other tocochromanol-related compounds, often referred to “tocols”, are lipophilic antioxidants of great importance for health. For instance, α-tocopherol is the only tocochromanol with vitamin E activity, while tocotrienols have a positive impact on health and are proposed in the prevention and therapy of so-called modern diseases. Tocopherols, tocotrienols and plastochromanol-8 are the most well-known tocochromanols; in turn, knowledge about tocodienols, tocomonoenols, and other rare tocochromanol-related compounds is limited due to several challenges in analytical chemistry and/or low concentration in plant material. The presence of free, esterified, and non-extractable tocochromanols in plant material as well as their biological function, which may be of great scientific, agricultural and medicinal importance, is also poorly studied. Due to the lack of modern protocols as well as equipment and tools, for instance, techniques suitable for the efficient and simultaneous chromatographical separation of major and minor tocochromanols, the topic requires attention and new solutions, and/or standardization, and proper terminology. This review discusses the advantages and disadvantages of different chromatographic techniques, tools and approaches used for the separation and detection of different tocochromanols in plant material and foodstuffs. Sources of tocochromanols and procedures for obtaining different tocochromanol analytical standards are also described. Finally, future challenges are discussed and perspective green techniques for tocochromanol determination are proposed along with best practice recommendations. The present manuscript aims to present key aspects and protocols related to tocochromanol determination, correct identification, and the interpretation of obtained results.

Graphical Abstract

1. Introduction

Tocochromanol history starts in 1922 when Bishop and Evans recognized α-tocopherol (α-T) as a pregnancy-supporting molecule in rats [1]. In 1937 α-, β-, and γ-T were isolated from different plant sources and had different efficacy in preventing vitamin E avitaminosis in rats [2]. Since then, 100 years have passed, but it remains unclear whether any other tocochromanol molecule can prevent vitamin E avitaminosis in humans the way α-T does. According to Azzi [3], the term should not be used interchangeably for different tocochromanols/tocols, since only α-T meets the criteria of preventing vitamin E ataxia, which is the disease caused by a vitamin E deficiency in humans. Tocopherols (Ts), especially α and γ homologues, are common in nature [4]. Tocotrienols (T3s) and other tocochromanol-related compounds are less known and often are not investigated. Hence, fewer reports can be found on their identification, detection, taxonomic distribution, biosynthesis, metabolism and biological function, while those molecules can have significant health beneficial properties [5]. It is estimated that only about 3% of research and clinical trials on the impact of tocochromanol supplementation on health concerns T3s, while 97% is dedicated to Ts [6], although several reports indicate superior biological properties of T3s to Ts, such as antioxidant and anti-inflammatory activities as well as their preventive effect against cancer, diabetes, cardiovascular and neurodegenerative diseases [6,7,8]. In the case of α-T, there is a clear lack of cancer-preventive activity. As for δ-, γ-T, and T3s, the effect on cancer risk is at least unclear and requires more studies [9]. Another topic worth highlighting is ester-bound tocochromanols, which are non-fissile in the human gastrointestinal tract, and their potential biological activity is unknown [10]. Esterified tocochromanols have been found, e.g., in walnuts, cucumber, chili, and bell pepper [10]. Since the majority of tocochromanol content determination methods in plant material use a standard protocol of saponification, during which bound tocochromanols are liberated (converted to free) from bound forms, knowledge about bound tocochromanols and relations/ratio between free and bound forms in nature is limited. Saponification is the most used protocol for tocochromanol determination due to higher tocol recovery compared to other methods. Other extraction techniques are less efficient, which is possibly due to the presence of some tocochromanols in ester forms or as compounds bound to the matrix, which are difficult to extract by tested solvents and techniques [11]. The topic of extractable and non-extractable tocochromanols has not been investigated. The challenge with the determination of esterified tocochromanols is not only associated with the procedure of tocol determination but also with lack of standards. Similarly, commercial standards for some other tocochromanols are not available, e.g., the well-known plastochromanol-8 (PC-8) [12,13], tocodienols (T2s) and tocomonoenols (T1s) [14,15,16,17]. Research on the latter two has been gaining momentum in the past decade, and new commercial standards of tocochromanols or their metabolites are released to the market every year. An additional challenge is faulty choice of analytical tools and/or chromatographic conditions, which may ultimately lead to the misidentification of tocochromanols in a difficult matrix, for instance, in roasted samples [18]. The possibility of tocochromanols overlapping with the new compounds formed during roasting should be excluded and verified by using mass spectrometry in order to correctly interpret the results [19]. The determination of some tocochromanols is challenging due to their relatively low concentration in plant, food, and biological matrices, especially T1s and T2s; therefore, the choice of an appropriate analytical tool is crucial. At present time, ‘green’ technologies and economic issues are becoming more important in each aspect of our lives, including analytical chemistry. Hexane, a harmful solvent, is still one of the most often used for tocochromanol determination, starting from extraction and ending with determination [20,21]. Therefore, to avoid hexane, heptane has been proposed as a less toxic option [22], which is a solution that is still not satisfactory enough from a health and environmental point of view. In the present review, we set ourselves the goal of compiling a compendium of knowledge on the presence of various tocochromanols in plants and their detection by the application of optimal tools, focusing on important issues for the correct identification and interpretation of the obtained results and appropriately used terminology. This paper discusses the different tools, methods, and techniques for the determination of major (Ts, T3s, and PC-8), minor (T2s and T1s), and less described esterified tocochromanols. The issue of extractable and non-extractable tocochromanols, methods for obtaining analytical standards of tocochromanols, and environmentally friendlier approaches were also discussed. Less common tocochromanol-related compounds not described in the present study, such as plastoquinones, ubiquinones, tocochromanol acids, and other related compounds, have already been reported in detail in previous papers [5,23].

2. Tocochomanols—History, Terminology, Structure, and the Main Known Sources

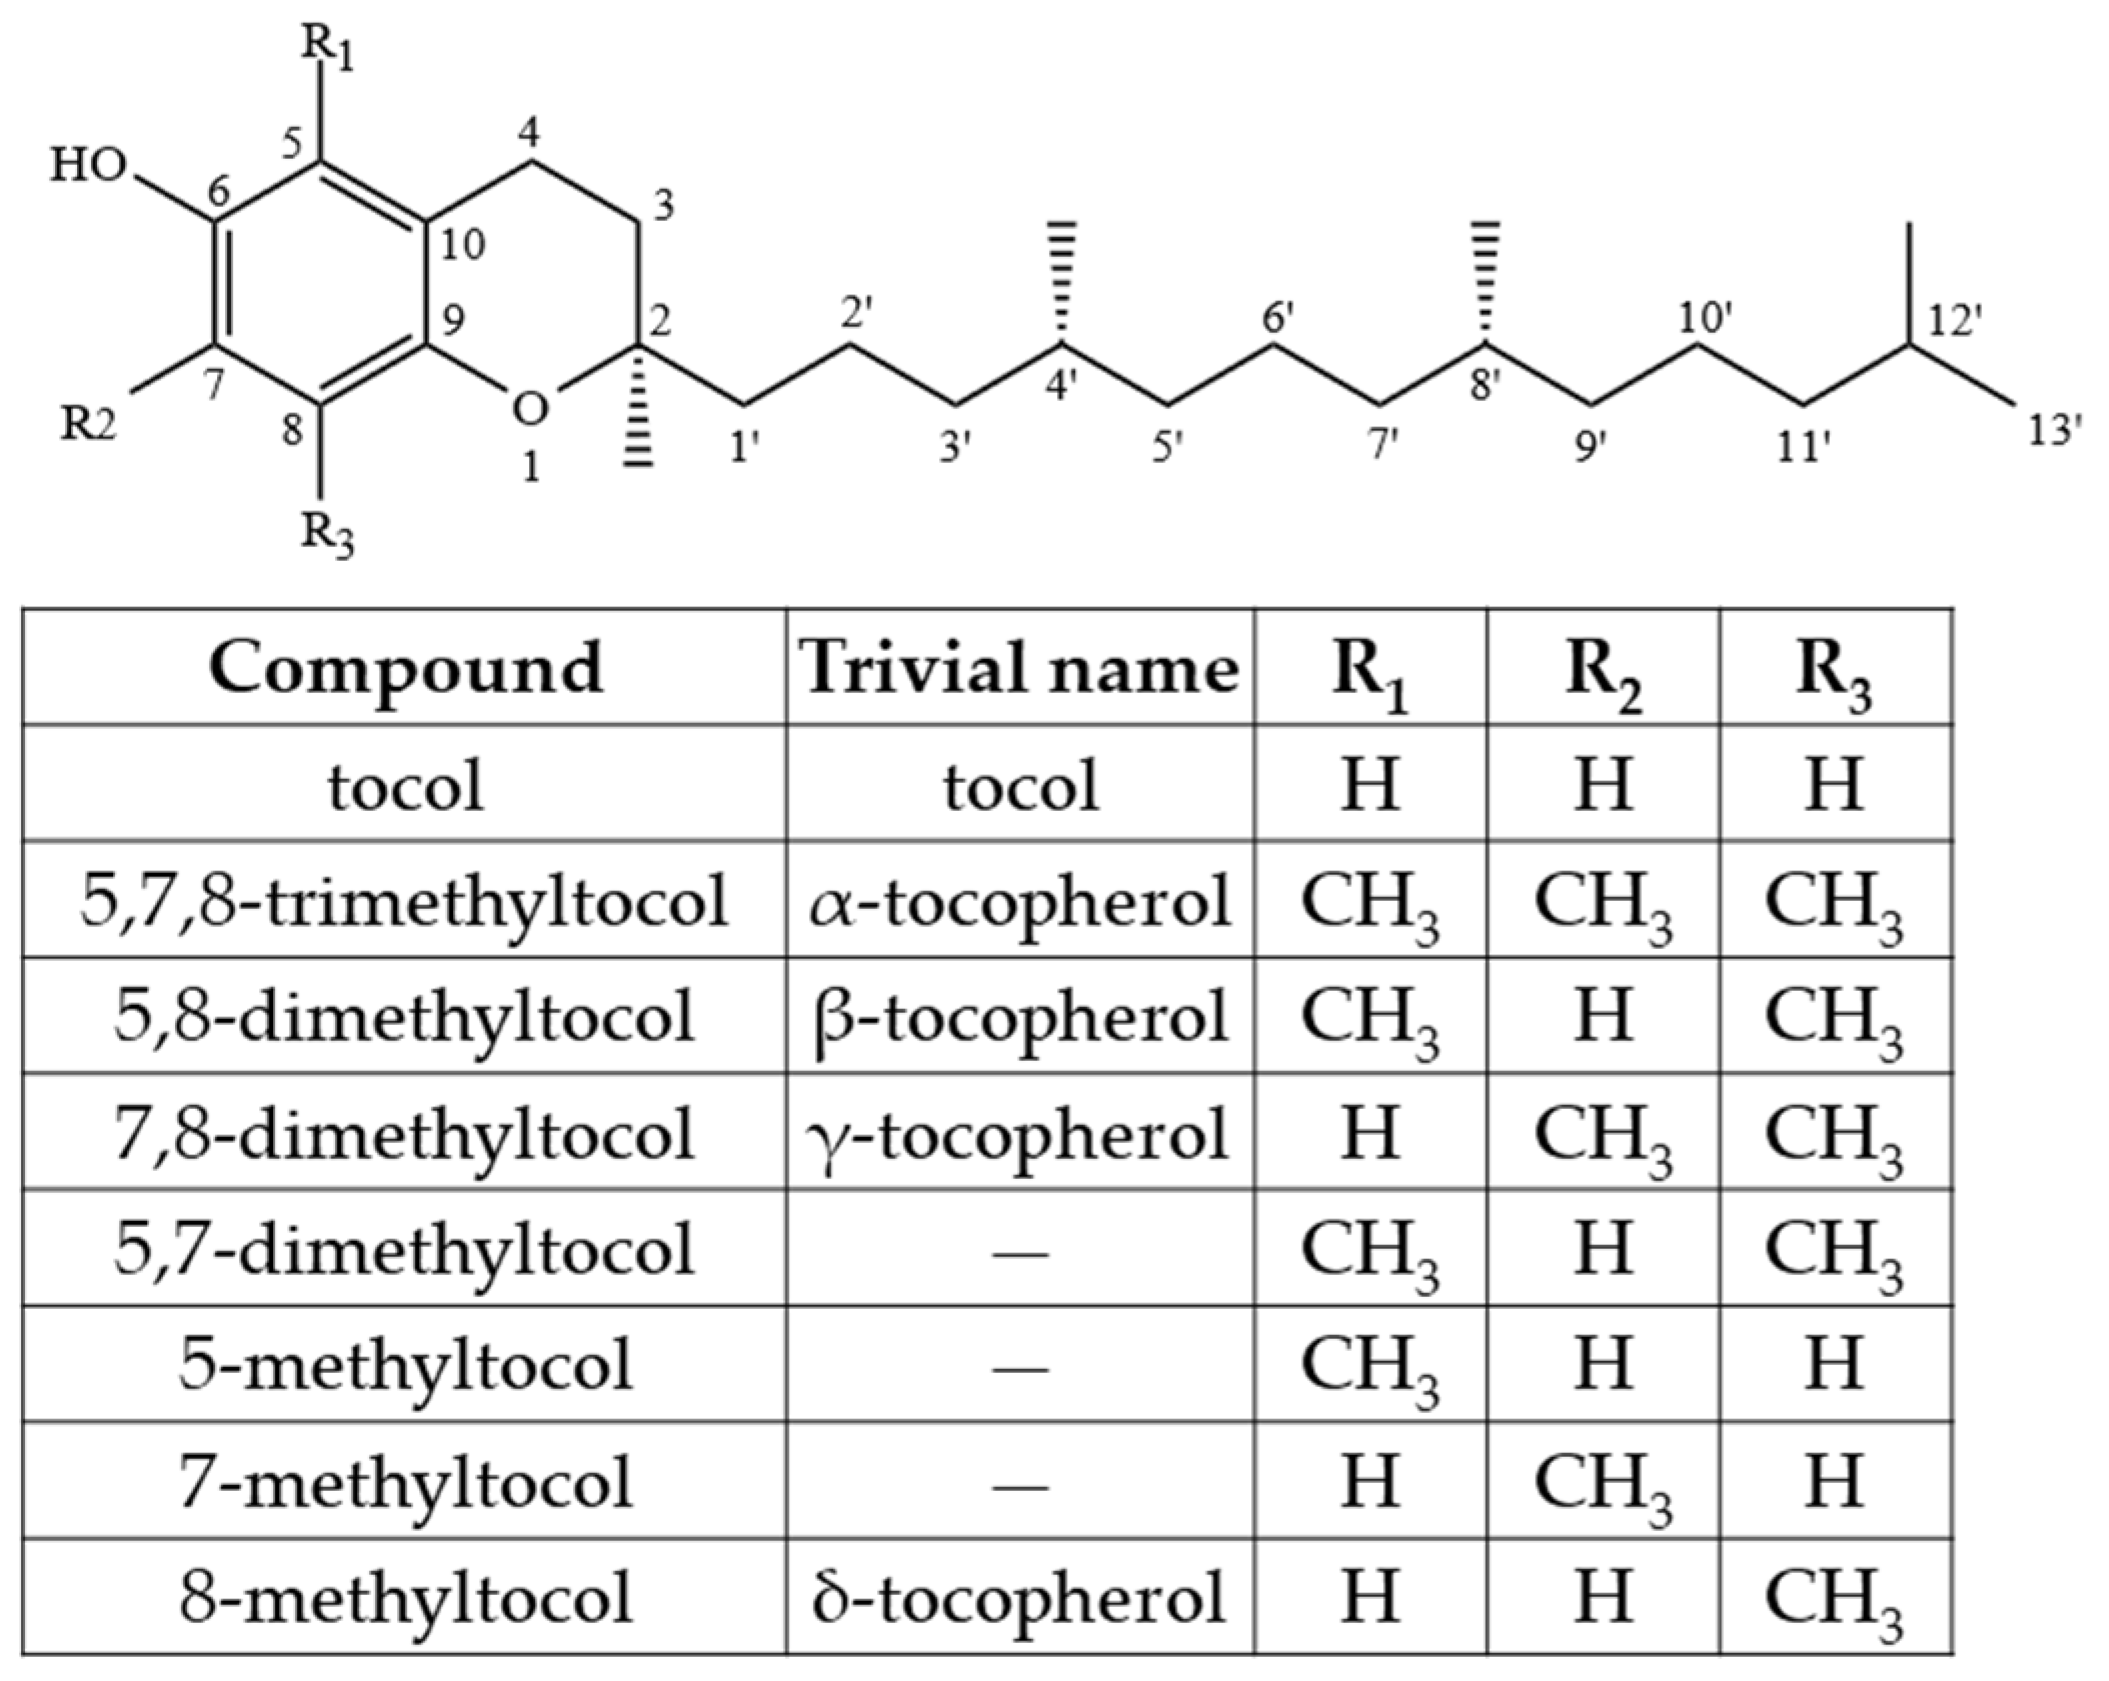
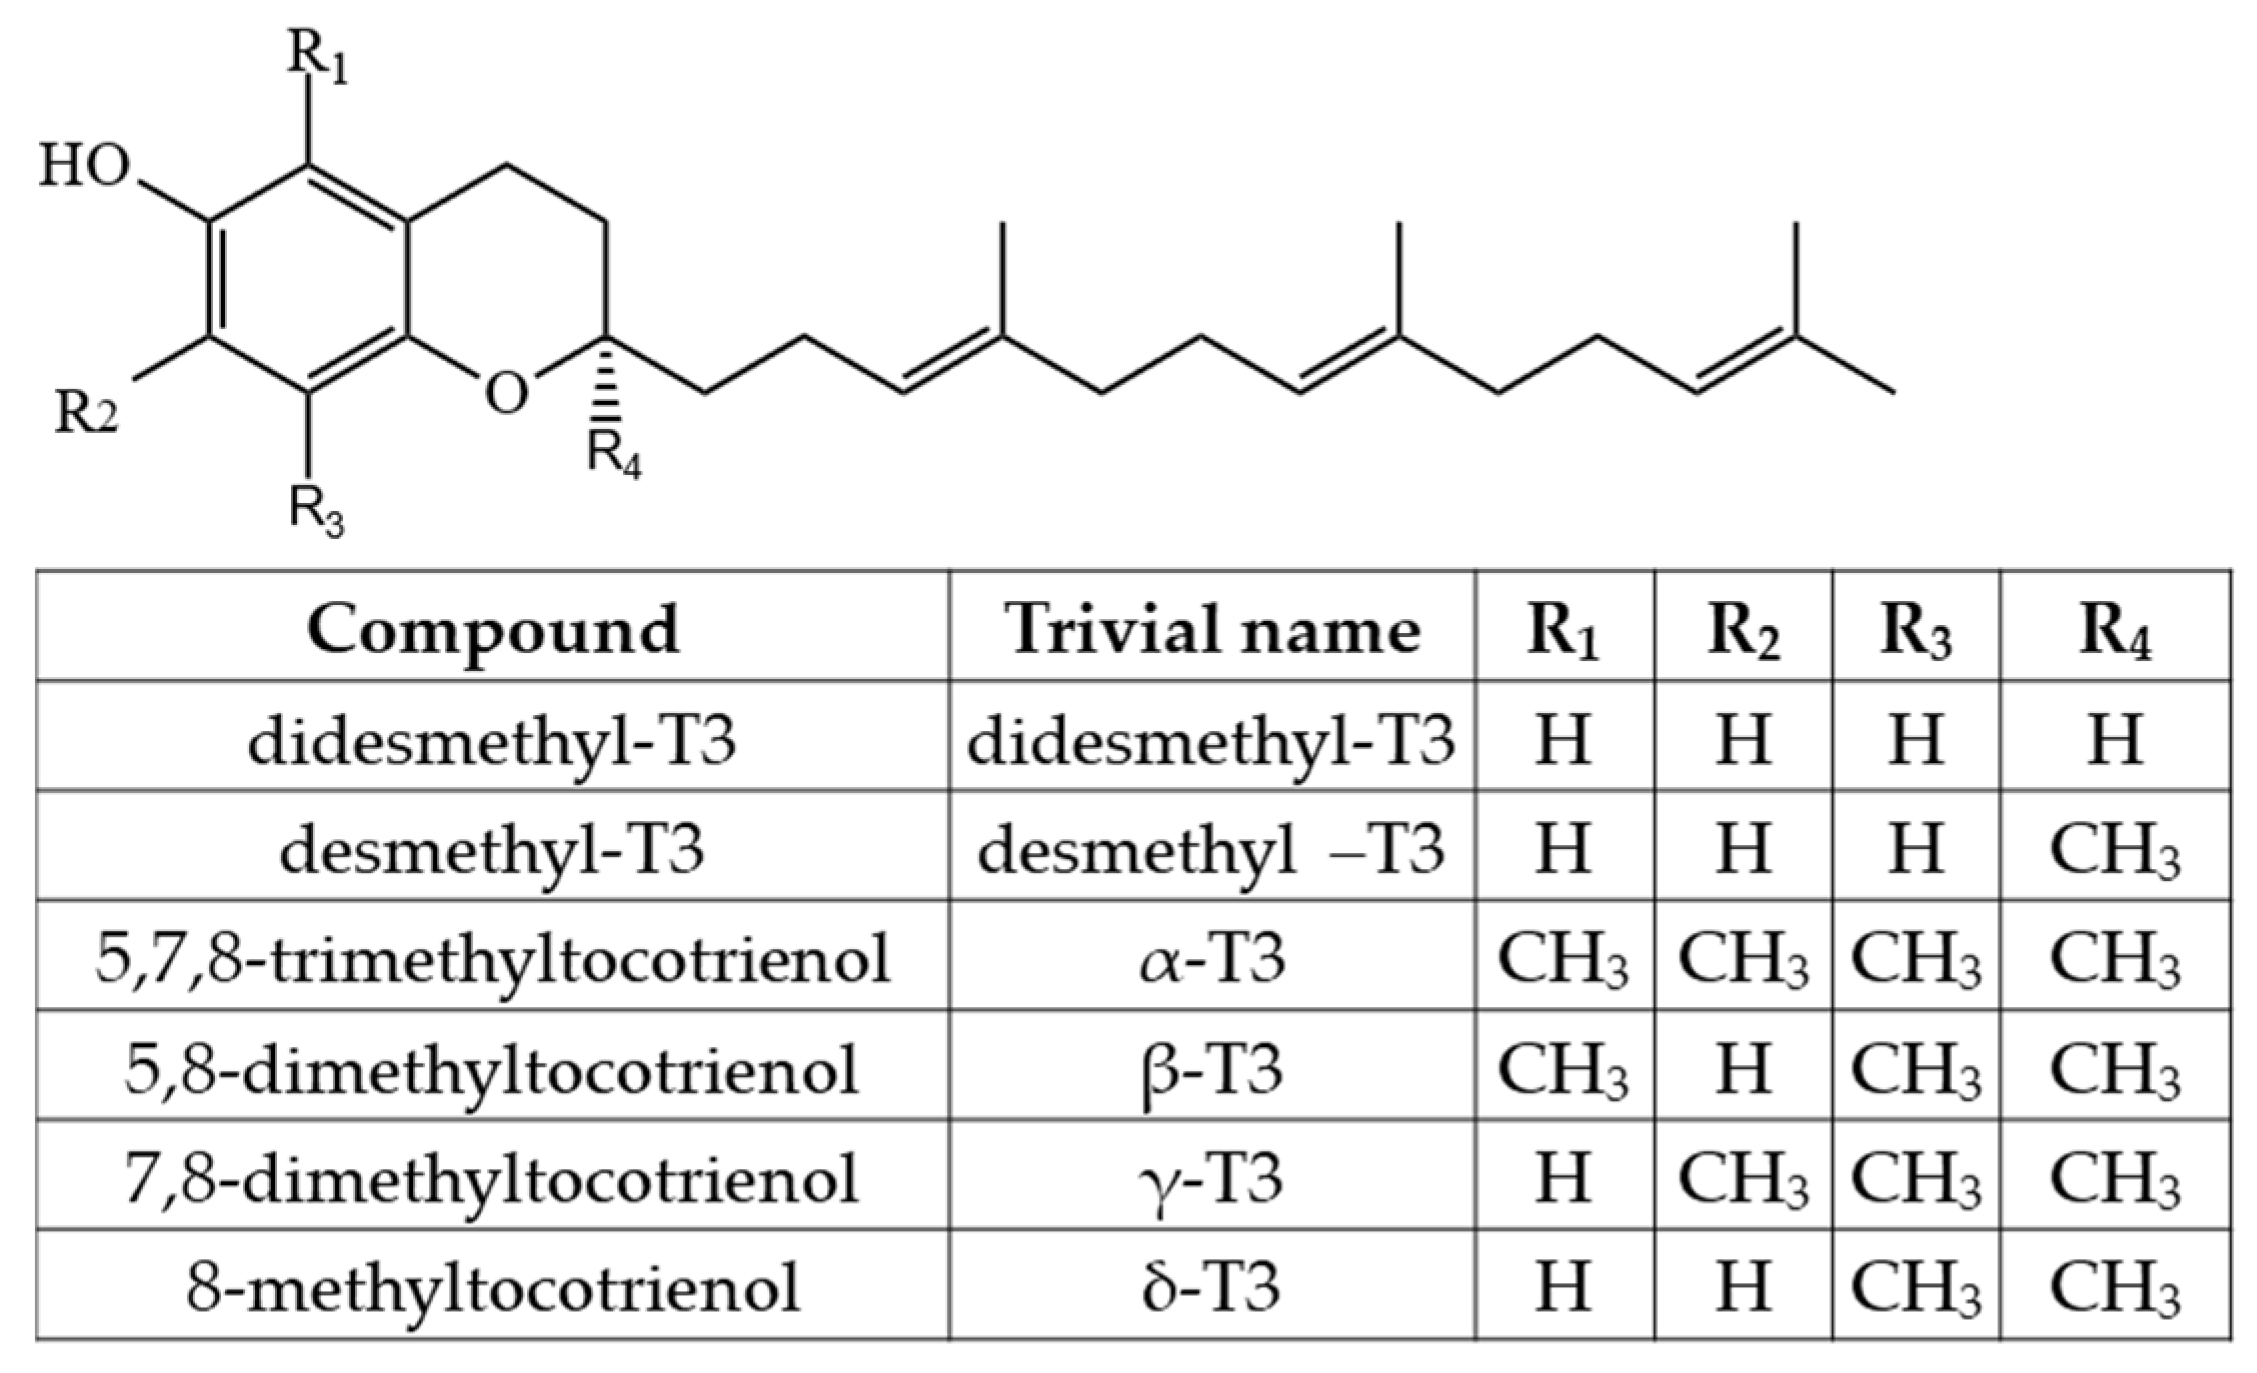
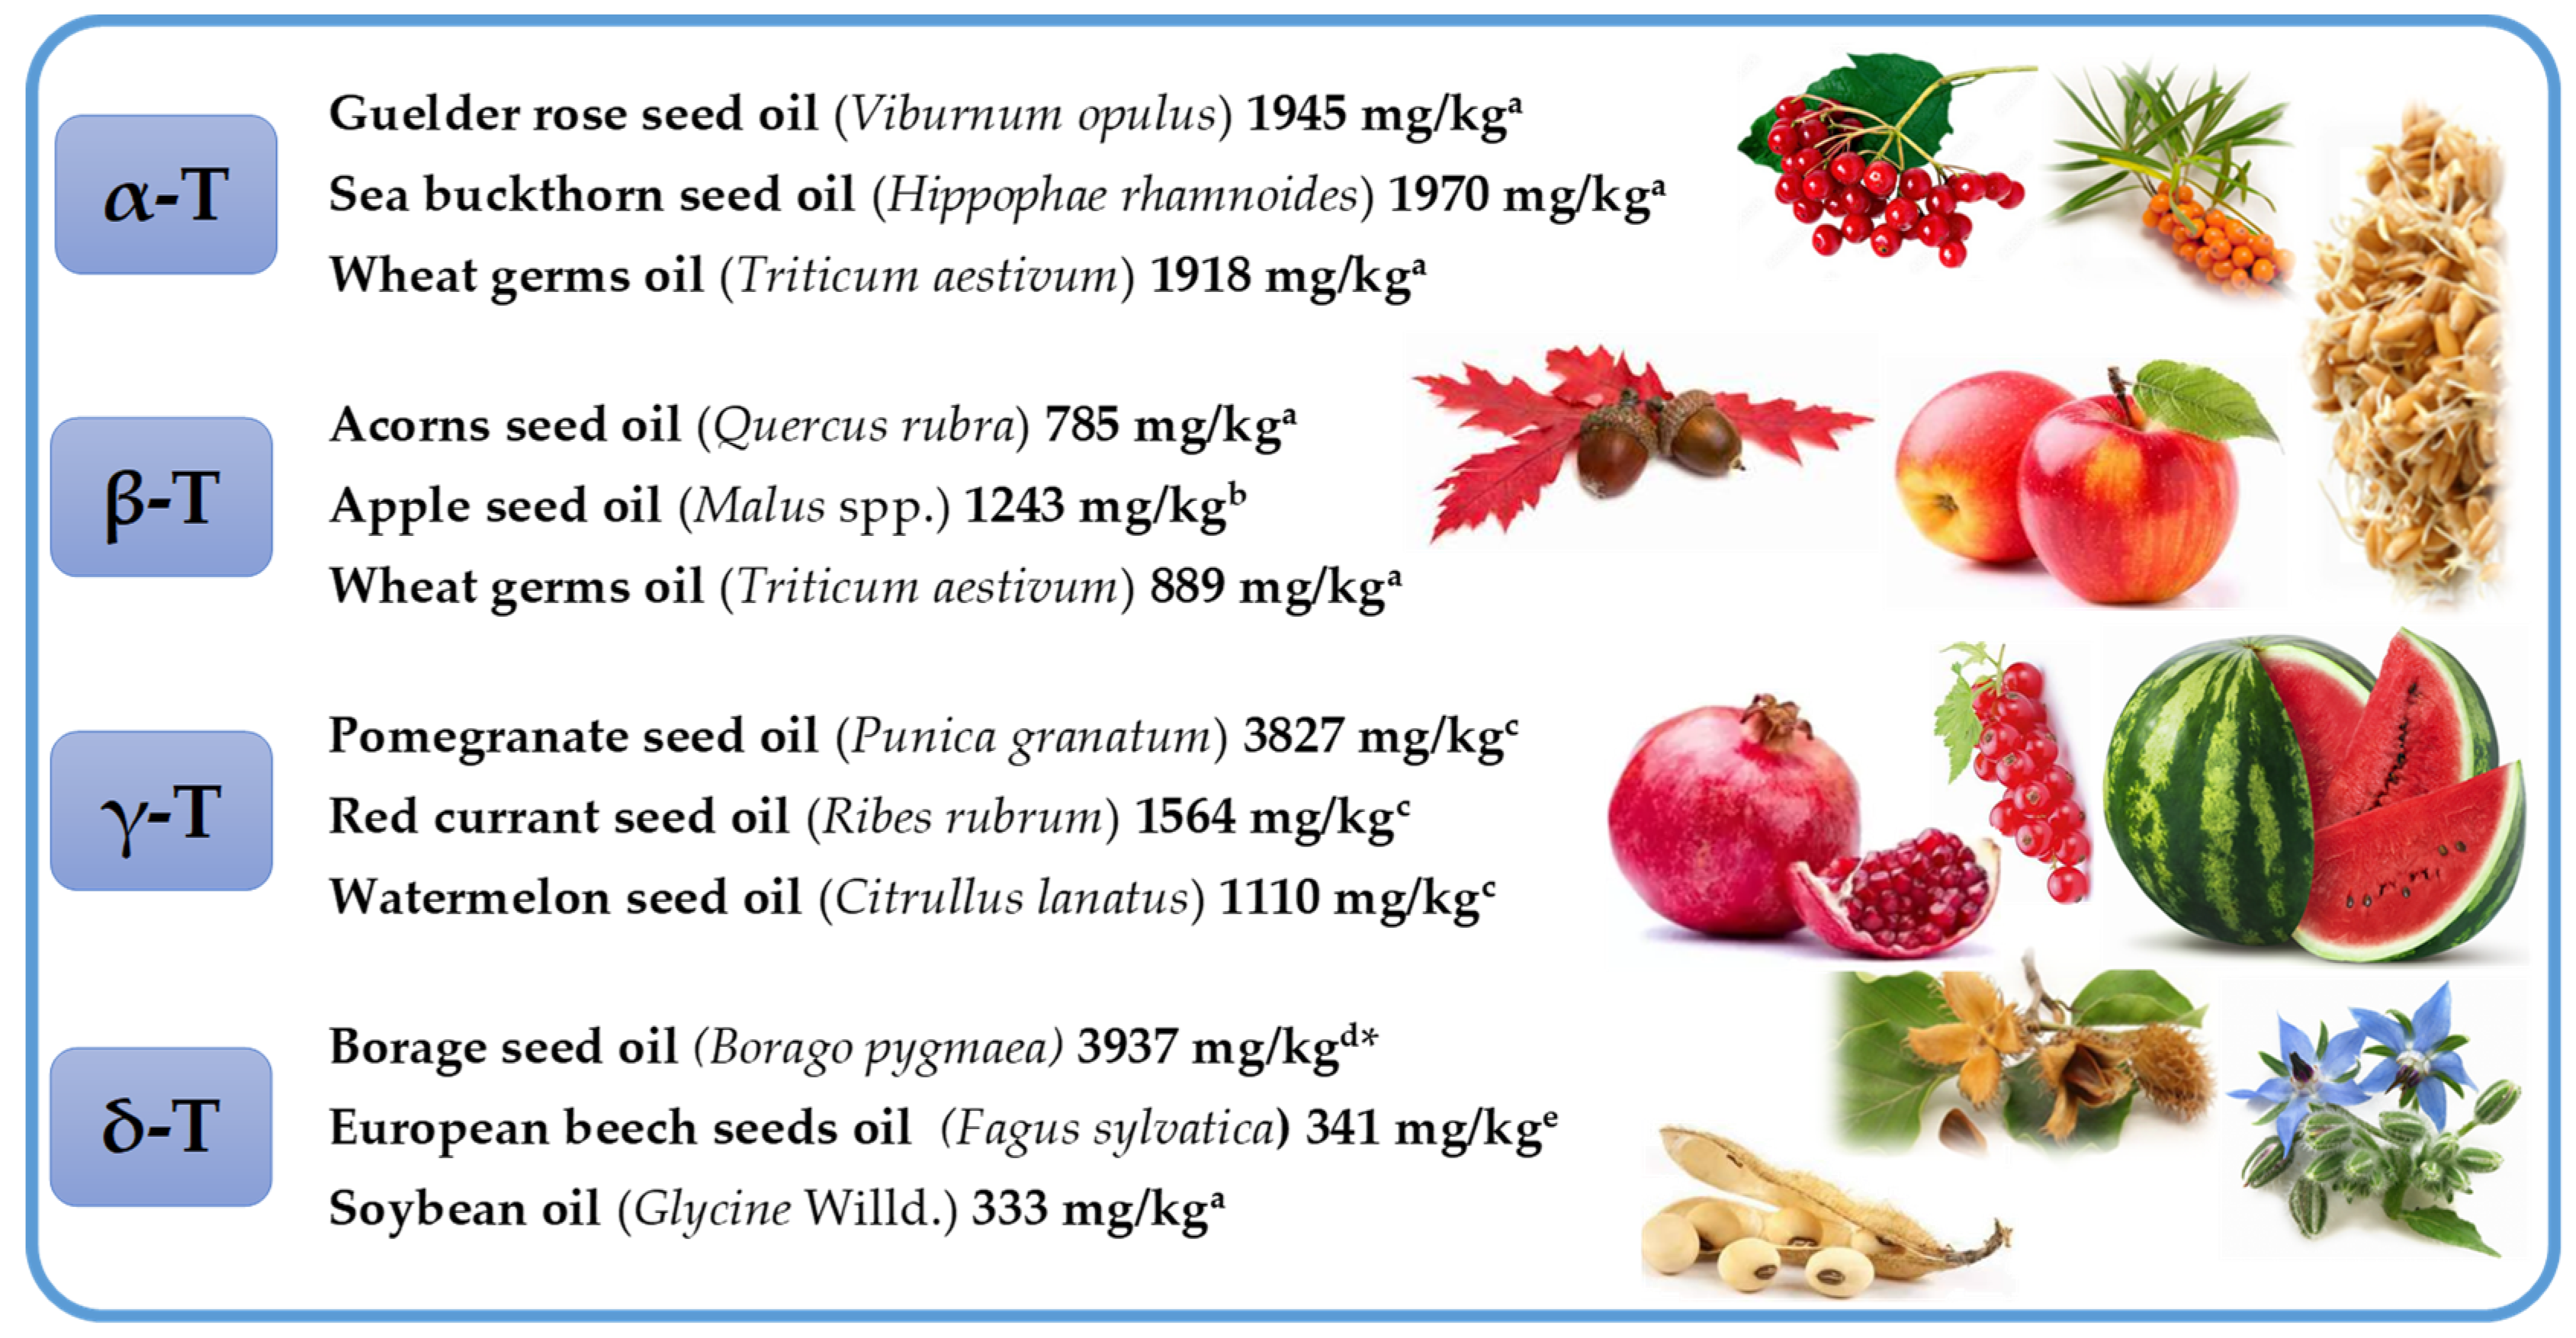
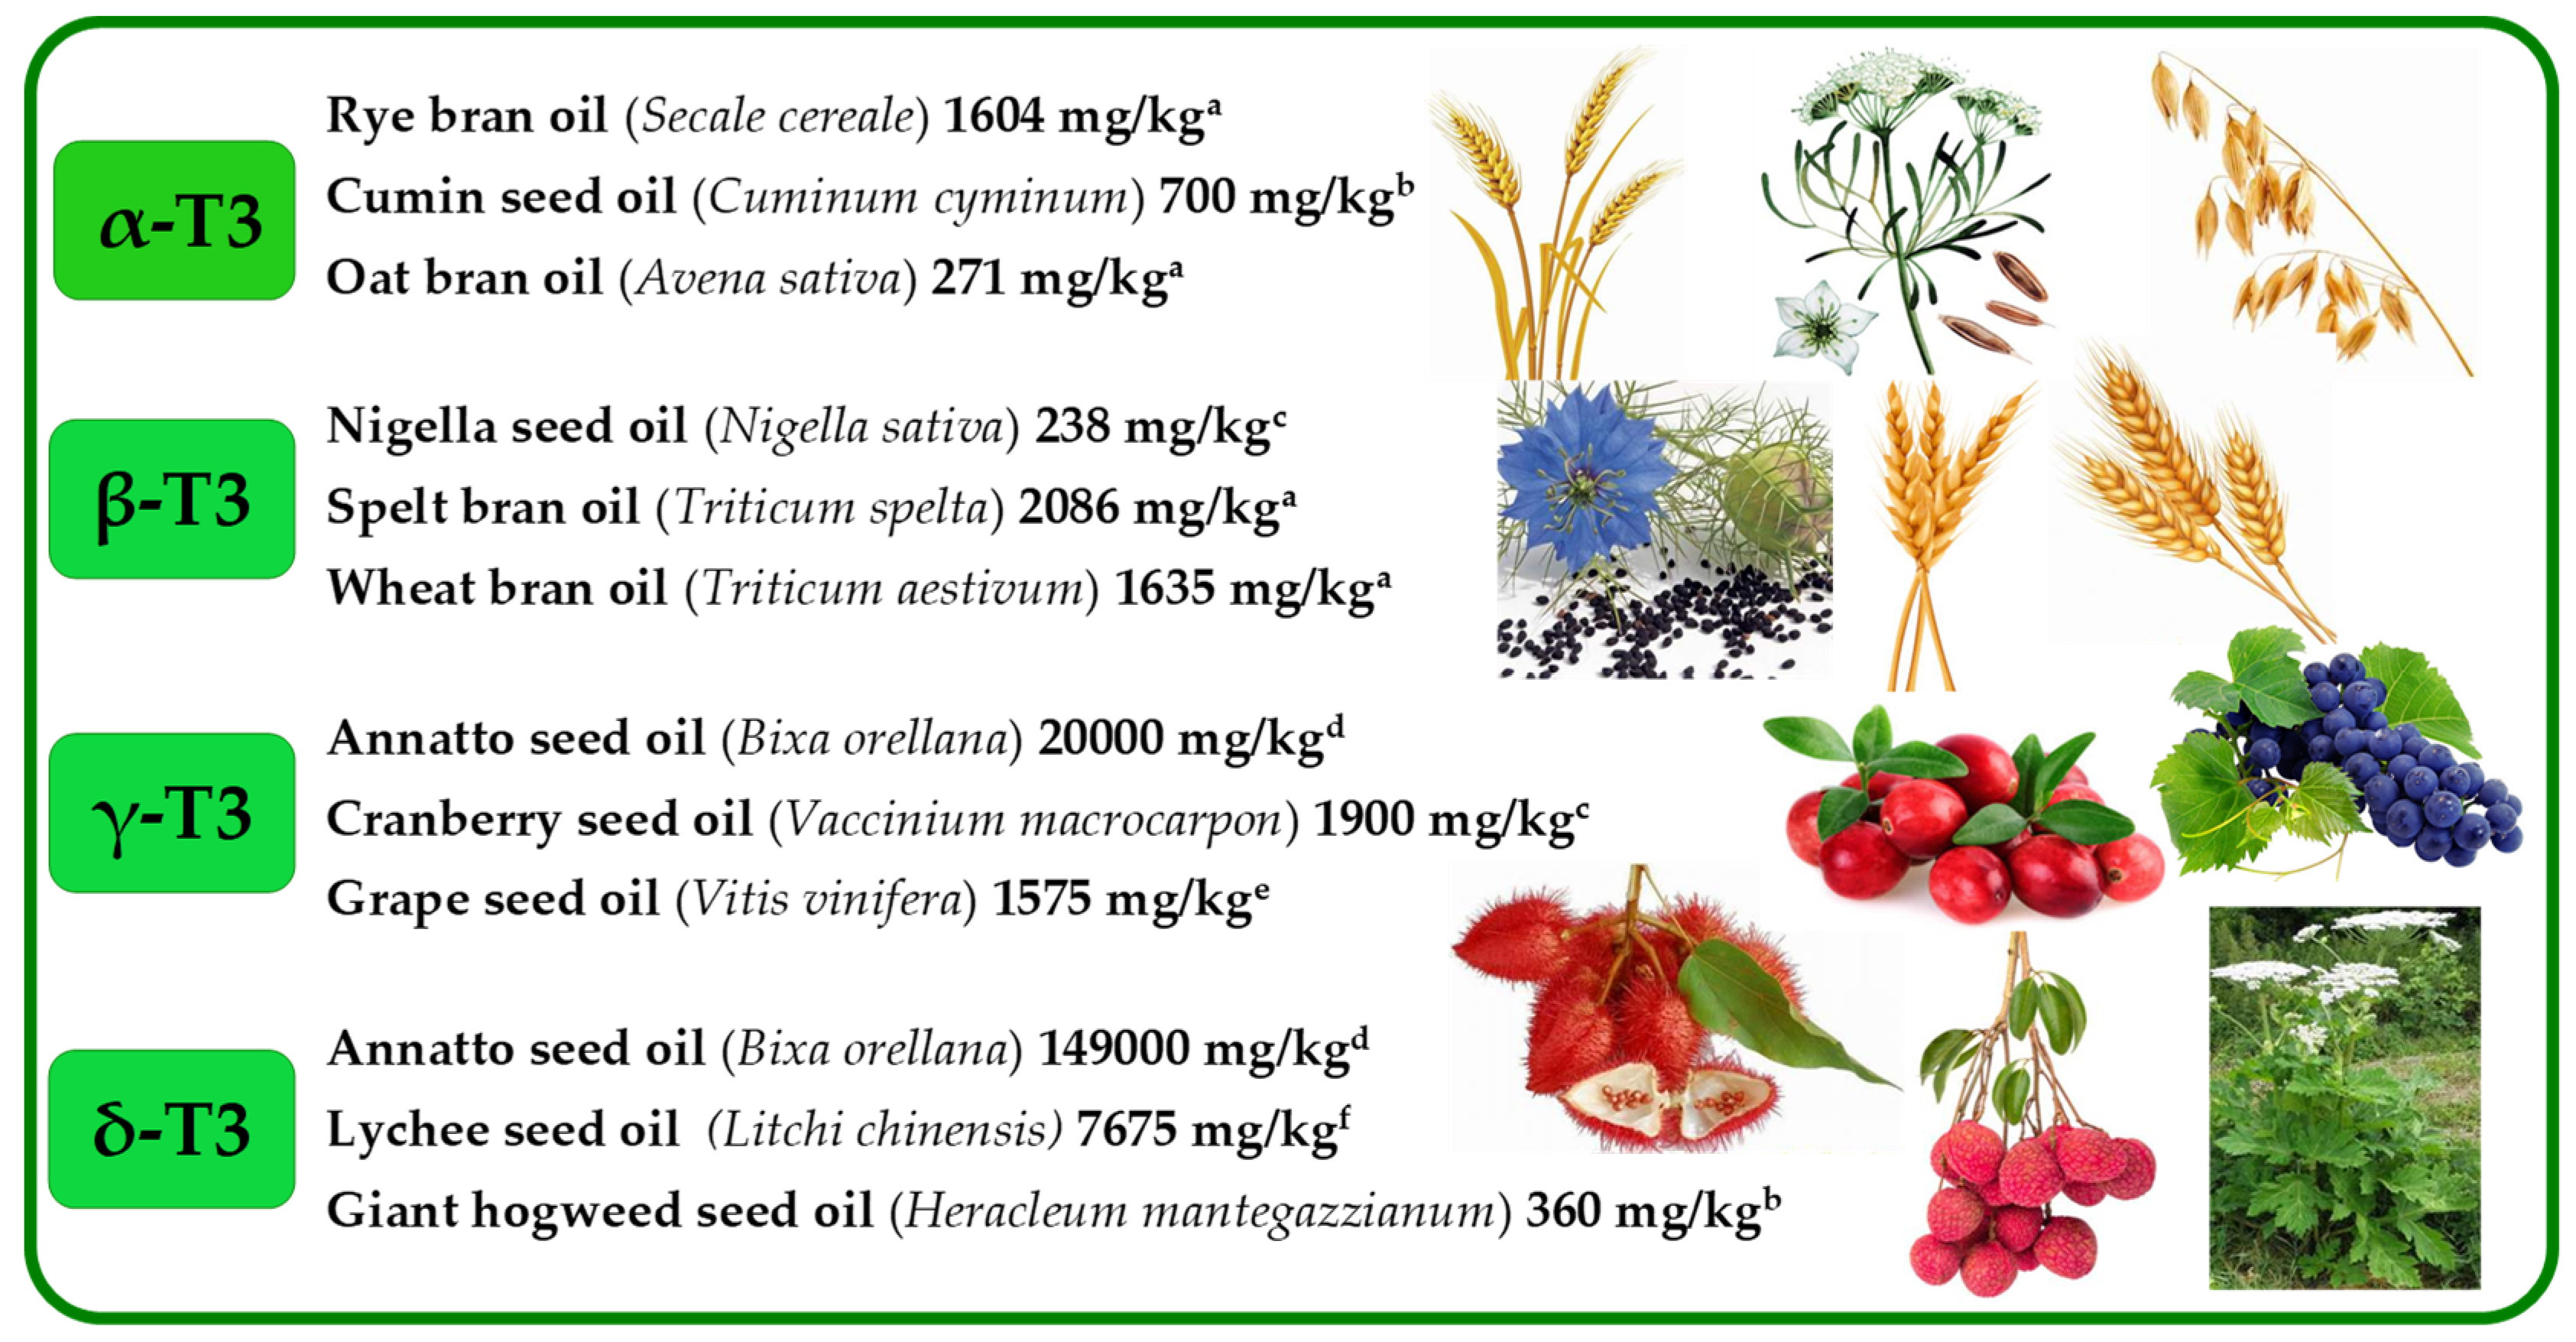
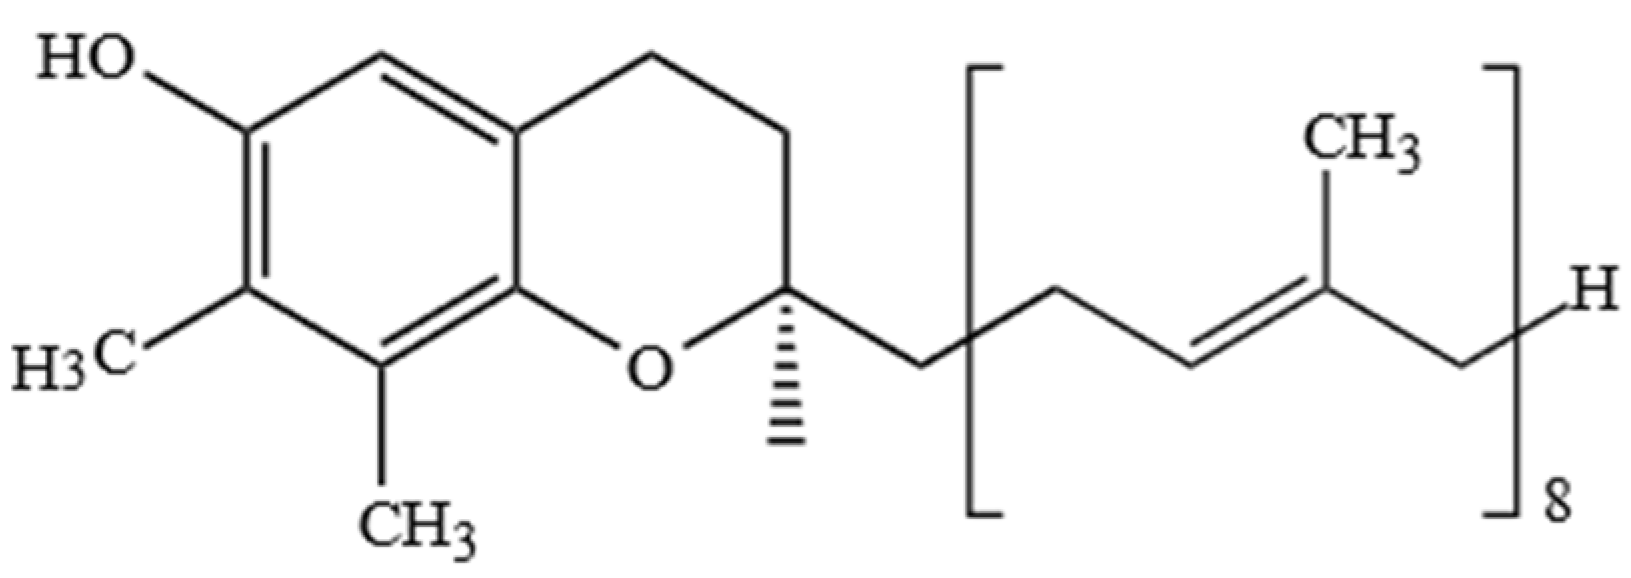
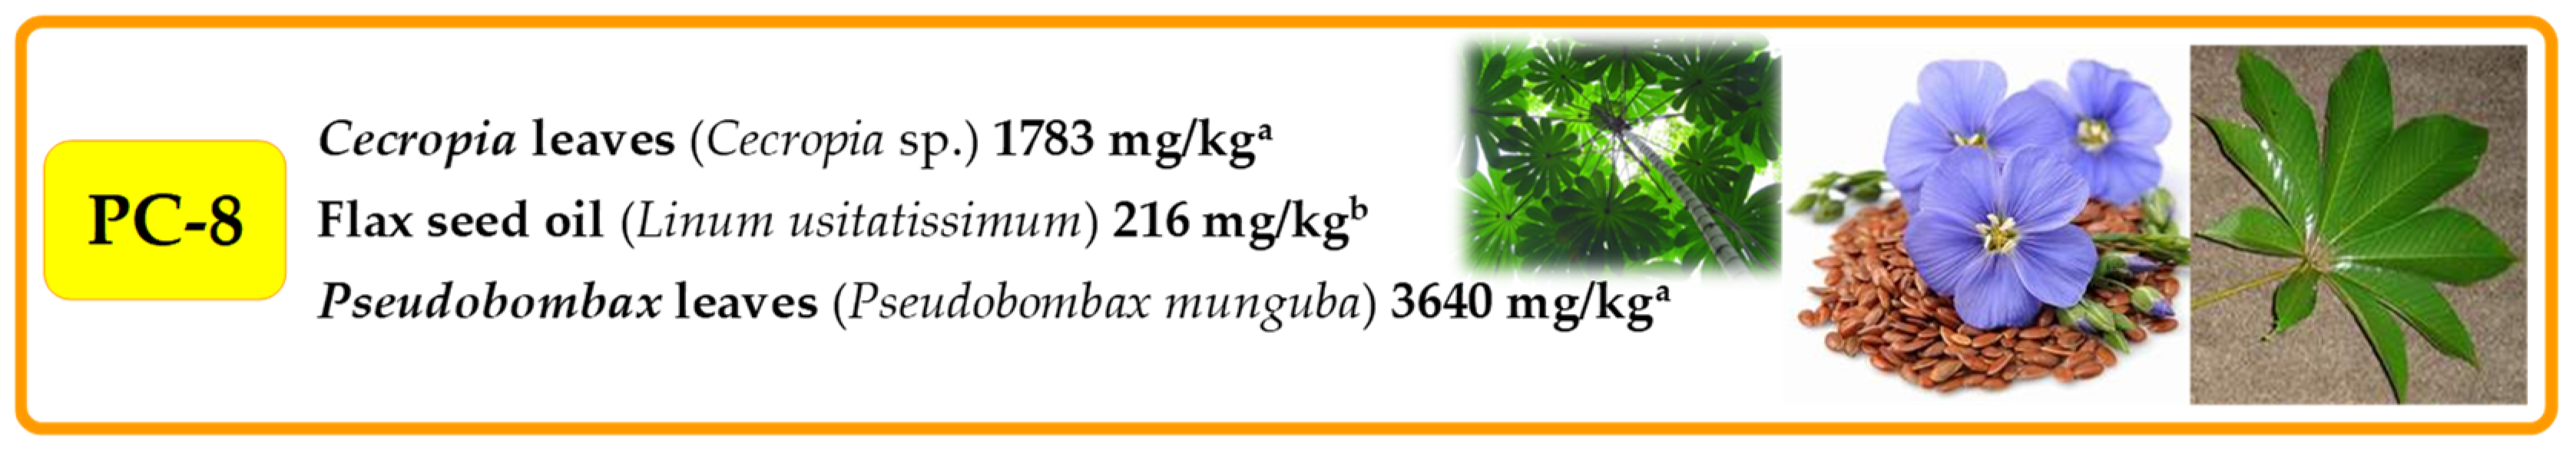
2.1. Tocopherols (Ts), Tocotrienols (T3s), and Plastochromanol-8 (PC-8)

Ts and T3s are probably the most recognized tocochromanols. From the chemical perspective, all tocochromanol compounds are similar in structure—these compounds share the chromanol moiety and a side-chain.
Ts, apart from other tocochromanols, are unique with full saturation of the side chain (Figure 1).
As Ts have three chiral centers, a total of eight stereoisomers for each T are possible (RRR, RSR, RRS, RSS, SRR, SSR, SRS and SSS), resulting in a total of 32 possible T stereoisomers [24]. In nature, α-T can be found as RRR- stereoisomer, which is considered to have the highest bioavailability, while commercial standards and dietary supplements of α-T or some other Ts or T3s are often synthesized by non-stereospecific reactions, and these standards include a racemic mixture of all stereoisomers (rac-α-T) [25]. The side-chain of T3s contains three unsaturated carbons at positions 3′, 7′ and 11′, and therefore, T3s have only one chiral center and only two possible stereoisomers—R and S (Figure 2).
However, combining both stereoisomers and possible combinations of geometrical (cis/trans-) isomers, a total of eight stereoisomers per one T3 homologue is possible [24]. Four major homologues (α, β, γ, δ) of Ts and T3s can be distinguished, which are differentiated by the number of methyl substituents as well as the substitution place in the chromanol moiety of the molecule. There are three methyl substituents in the chromanol ring for homologue α-(5,7,8-trimethyl-), two methyl substituents for β-(5,8-dimethyl-) and γ- (7,8-dimethyl-) and one methyl substituent for δ-(8-methyl-). A compound without methyl substituents but possessing one hydroxyl group (6-hydroxy-chromanol-) and the inherent T side-chain is trivially called a tocol but if it has a T3 side-chain—desmethyl-T3 [23]. Another compound is didesmethyl-T3, which is a T3 without a methyl group in position R4 (Figure 2). Both desmethyl-T3 and didesmethyl-T3 have been found in rice bran [26]. It can be calculated that there could be a total of eight different 6-hydroxy-chromanol-related compounds differentiated by the number and placement of methyl substituents—one without methyl substituents (tocol), three mono-methyl, three dimethyl, and one trimethyl (α-) (Figure 1). Different authors use Greek letters to mark homologues other than α, β, γ, and δ [23,24,27]; therefore, in the future tocochromanol homologue nomenclature should be systematized, especially if the occurrence of the compound can be confirmed in nature. 5,7-Dimethyltocol [24], tocol [28], and α-tocopheryl acetate (α-T-Ac) (Figure 3) [29] are often used as internal standards because these compounds meet the main criteria of being structurally close to the analytes and are not included in biosynthetic pathways of tocochromanol formation in photosynthetic organisms (main matrix of interest).
The high concentration of individual Ts and T3s with their dominance can be found in nature (Figure 4 and Figure 5, Table S1–S8 in Supplementary Materials).
α-T is the main tocochromanol found in leaves of different species [30,31,32,33] and seed oils, such as safflower, cultivated (Carthamus tinctorius) and wild (Carthamus oxyacantha) [34], almonds (Prunus dulcis), Guelder rose (Viburnum opulus), Sea buckthorn (Hippophae rhamnoides), milk thistle (Silybum marianum), wheat germ (Triticum aestivum), sunflower (Helianthus annuus) [12], and Japanese quince (Chaenomeles japonica) [35]. β-T is often stated as a minor tocochromanol or does not occur at all in seeds and plant oils [36,37]. However, not only the presence but even β-T dominance over other tocochromanols has been clearly shown in several reports on different plant materials, for instance, wheat germ (Triticum aestivum) [38], robusta and arabica coffee beans (Coffea canephora and Coffea arabica) [19,39], oak acorns (Quercus rubra) and oil thereof [12,40], apple (Malus spp.) seeds and seed oils [41,42], Guelder-rose (Viburnum opulus) seeds and seed oil [12,43], and kirkir seed oil (Vangueria madagascariensis) which was initially reported as kerkir seeds (Catunaregam nilotica) [44], but later re-identified as kirkir V. madagascariensis [45]. γ-T is the main T in most seed oils [35,36]. The highest concentration of γ-T can be found in corn oil (Zea mays) [36], canola (Brassica napus), chia (Salvia hispanica), flax (Linum usitatissimum), golden flax (Linum flavum), hemp (Cannabis sativa), and pumpkin (Cucurbita pepo) seed oils [12], as well as in less widespread seed oils, such as red currant (Ribes rubrum), pomegranate (Punica granatum), and watermelon (Citrullus lanatus) [35]. To the best of our knowledge, the predominance of δ-T has only been found in the seeds and seed oils of plants belonging to the Boraginaceae family in the Borago genus (B. morisiana, B. officinalis, B. pygmaea, B. longifolia, and B. trabutii) and Echium gentianoides [46]. Relatively high concentration of δ-T can also be found in such seed oils as apple (Malus spp.) [41,42], red currant (R. rubrum) [35], European beech (Fagus sylvatica) [47], Guelder rose (V. opulus), and soybean (Glycine Willd.) [12] (Figure 4, Tables S1–S4 in Supplementary Materials).
The occurrence of T3s in nature is much rarer than Ts and is generally limited to non-photosynthetic organs, most notably in monocots [48]. The predominance of α-T3 over other tocochromanols has been observed in both groups of plants—monocotyledon oat (Avena sativa) and rye (Secale cereale) bran oils [38]—and dicotyledon in seed oils of species belonging to the Apiaceae family (Umbelliferae), such as hemlock (Conium maculatum) [49], cumin (Cuminum cyminum), and garden angelica (Angelica archangelica) [50]. Some authors introduce doubtful or incorrect information on the tocochromanol composition in plant material, which is often based on the limited number of investigated samples, while a faulty choice of analytical tools and wrong interpretation of the obtained results may be another reason for misleading conclusions. For example, [37] paper may state that β-T3 does not occur in plant oils; however, oils obtained from the bran of such monocotyledon plants as spelt (Triticum spelta) and wheat (Triticum aestivum) are particularly rich and dominated in β-T3 [38]. One example of a dicotyledon plant source dominated by β-T3 is black caraway (Nigella sativa) seeds and seed oil [12,51]. The occurrence of β-T3 has also been reported in other cereals, such as barley (Hordeum vulgare) [11], oat (A. sativa), and rye (S. cereale), with the highest concentration in the bran oils [38], and palm oil [12,52]. γ-T3 is probably the most widely distributed T3. Two of the most important sources of γ-T3 are latex from rubber tree (Hevea brasiliensis) [53], discovered in 1965, and annatto (Bixa orellana) seeds [54]. Annatto seed oil is the richest source of γ-T3 with a concentration up to 2 g/100 g oil [54]. γ-T3 is the main tocochromanol in both monocots, e.g., in oils obtained from species belonging to the Arecaceae family, such as California palm (Washingtonia filifera) [55] and oil palm (Elaeis guineensis) (unrefined and refined oils) [12]; and eudicots, e.g., berry seed oil of species belonging to the Ericaceae family, such as wild bilberries (Vaccinium myrtillus), lingonberries (Vaccinium vitis-idaea), Arctic cranberries (Vaccinium oxycoccos), crowberries (Empetrum nigrum), cranberries (Vaccinium macrocarpon) [56], Apiaceae family, such as Prangos platychlaera, Prangos uechtritzii, Heracleum platytaenium, Heracleum trachyloma, Heracleum crenatifolium [49], coriander (Coriandrum sativum), parsley (Petroselinum sativum), celery (Apium graveolens), dill (Anethum graveolens), carrot (Daucus carota), caraway (Carum carvi), fennel (Foeniculum vulgare), and giant hogweed (Heracleum mantegazzianum) [50]; and grape seeds and seed oils, regardless of the species, cross and cultivar [57,58,59] with some exemptions, which can be associated with the varying tocochromanol composition at different stages of grape seed development [60]. δ-T3 and β-T3 are less common T3s in nature than α-T3 and γ-T3, which are found mostly in low concentrations. Annatto (B. orellana) seeds are an exception as they may contain up to nearly 15 g of δ-T3 in 100 g of oil [54]. Up until 1965, palm oil was the only known source of δ-T3. In 1965, δ-T3 was found in rubber tree latex (H. brasiliensis) [53]. δ-T3 can be also found in seed oil from crowberries (E. nigrum) [56], cranberries (V. macrocarpon) [12,56] and in several species belonging to the Apiaceae family [49,50]. In all of the listed sources of δ-T3, the concentration of δ-T3 is 1000 times lower in comparison to annatto seed oil. The composition and concentration of tocochromanols in the plant material depends not only on the species but also plant vegetative part [61], genotype [62], stage of development [31,60], abiotic factors during plant growth [62], and sex of some plants, e.g., sea buckthorn (Hippophae rhamnoides) [30] (Figure 5, Tables S5–S8 in Supplementary Materials).
PC-8 was first identified by Whittle et al. [64] in the leaves of Hevea brassiliensis. PC-8 is also named γ-toco-octaenol and is similar to γ-T3, except γ-T3 has three unsaturated isoprene units in the side-chain, while PC-8 has eight unsaturated isoprene units (Figure 6).
PC-8 is found in the seeds and oils of various species belonging to different families [36,63,65]. The oils richest in PC-8 are Linum usitatissimum [65], which is often used for PC-8 isolation [12,13], and Erythrophleum fordii [63]. PC-8 is present in different plant organs [61,66], especially leaves of both eudicots, e.g., Pseudobombax munguba [65], and monocots, e.g., Zea mays [67]. The content of PC-8 in leaves depends on the species and the stage of development [30,61,66,68] (Figure 7, Table S9 in Supplementary Materials).

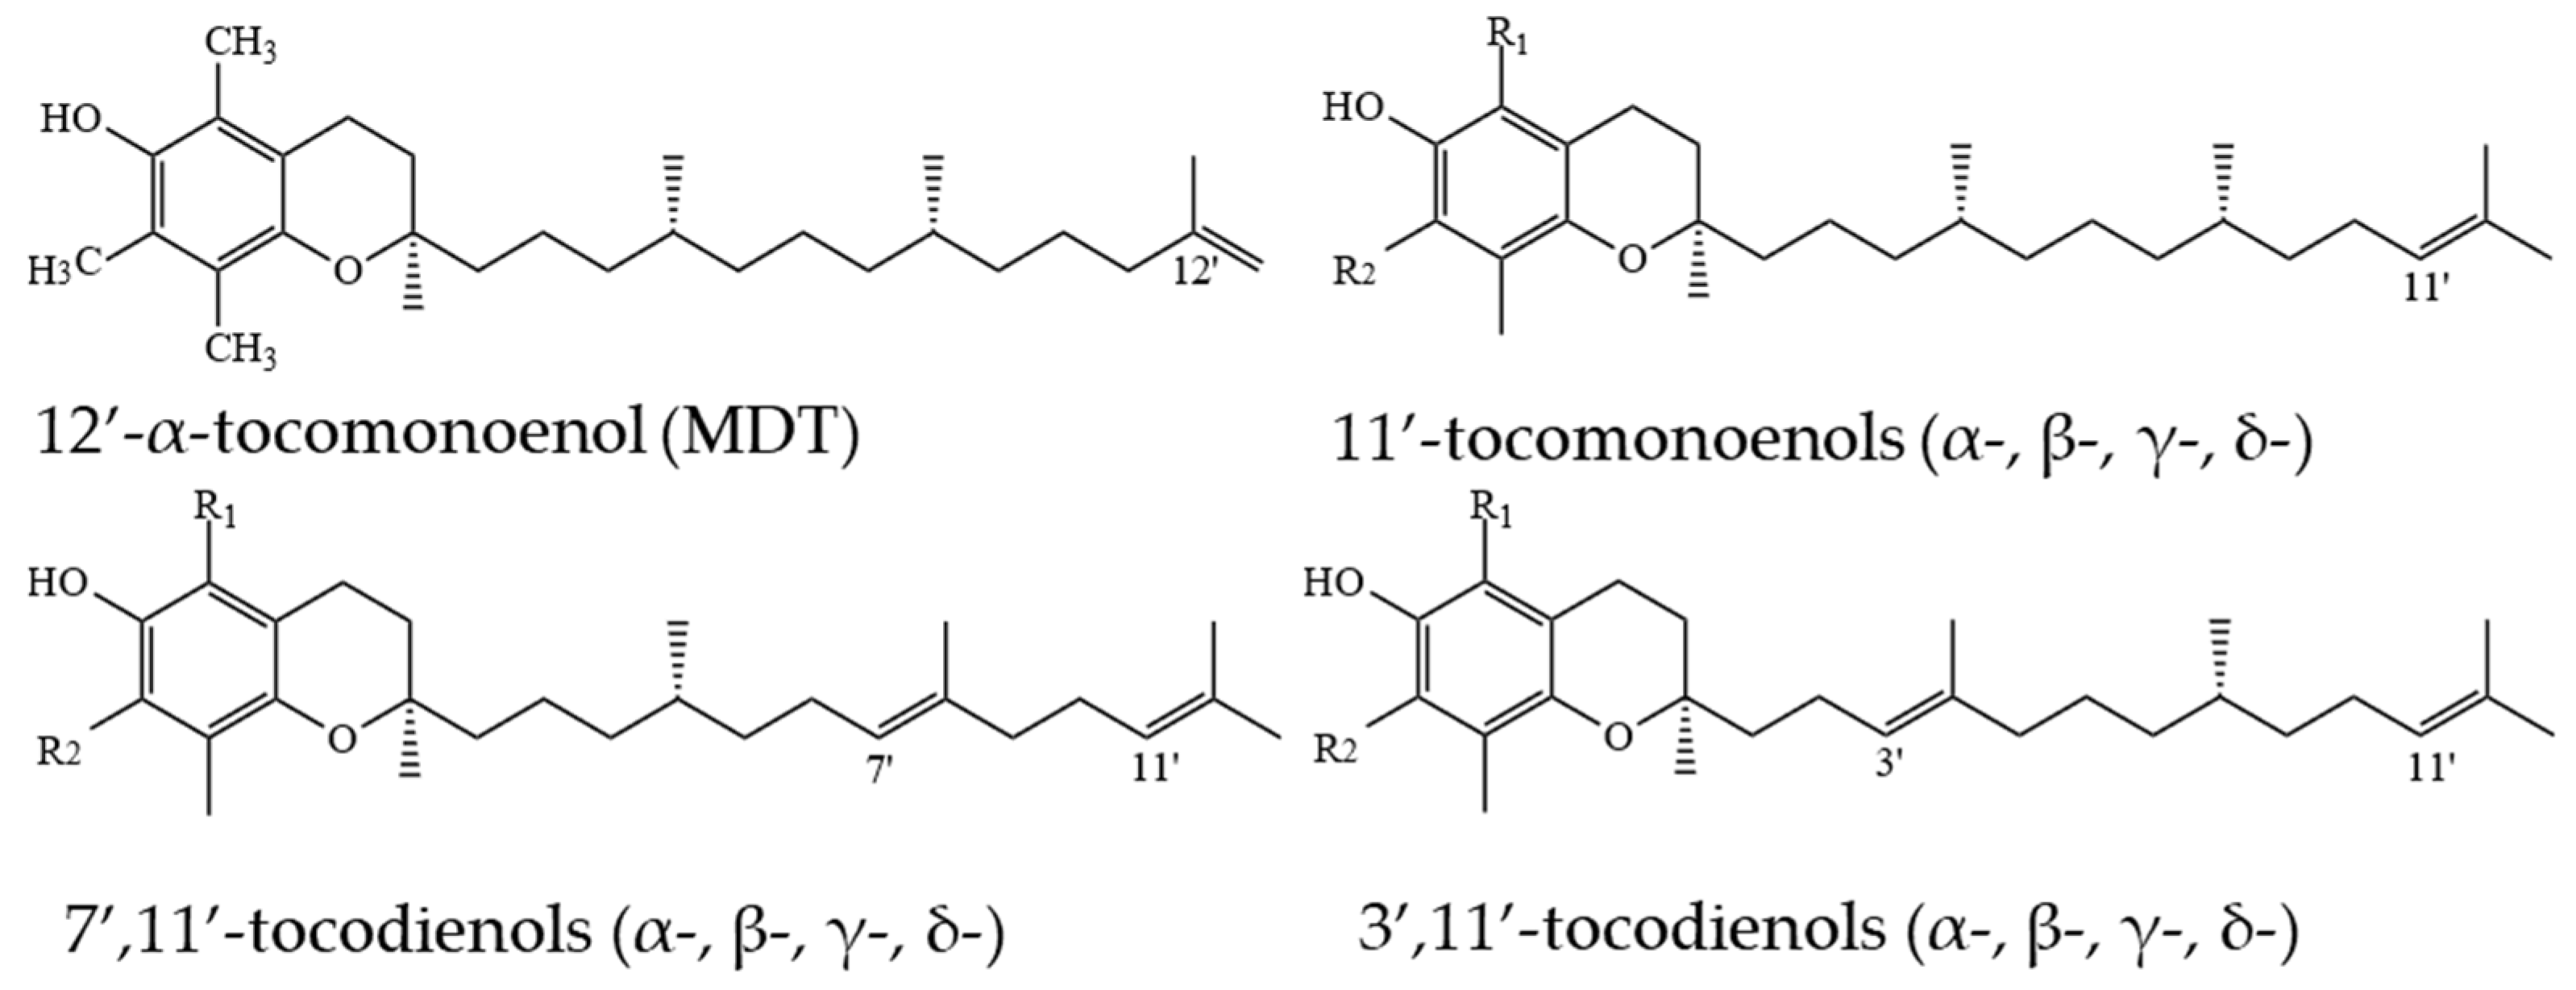
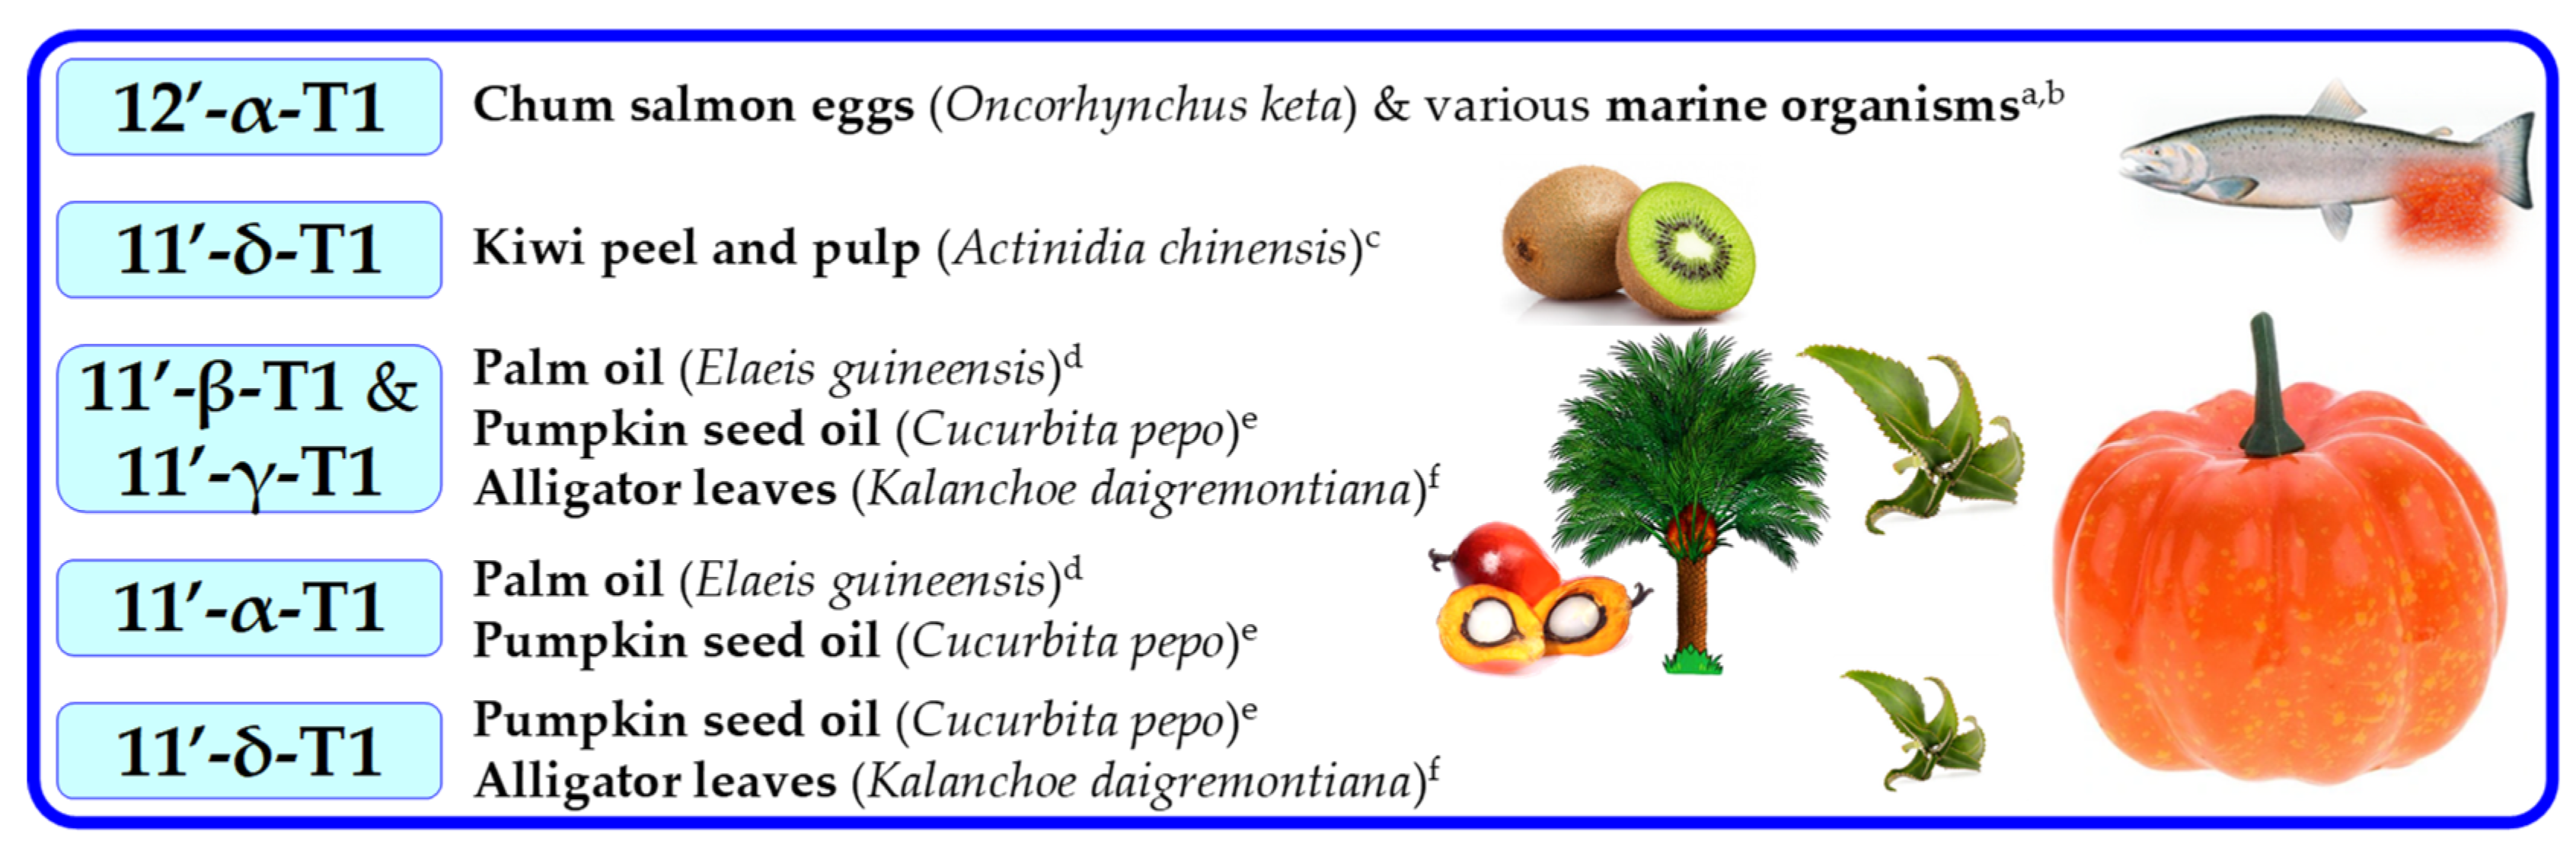
2.2. Tocomonoenols (T1s) and Tocodienols (T2s)

T1s and T2s are less common in nature and can be found in lower concentration than Ts and T3s [14,16]. 11′-α-T1 was first isolated and purified from palm and rice bran oils in 1995 [69]. Relying on the evidence of double bond location in T3s, it can be assumed that in T1s, the double bond can be located on the 3′, 7′ or 11′ positions. However, a novel 12′-α-T1 was discovered in the eggs of Oncorhynchus keta in 1999; it was named “marine-derived tocopherol” (MDT) [70] and later was found in other marine organisms [71] (Figure 8).
Apart from this, in studies on T1s in plants with emphasis on thorough structure identification, only 11′-T1s have been structurally confirmed, and in cases where precise identification was not possible, detected T1s were assumed to be 11′-T1s (Figure 8). T1s were identified in palm oil (11′-α-T1) [72], T3-rich fraction of palm oil (11′-α-T1) [52], countercurrent chromatography (CCC) fraction of palm oil (11′-α-, 11′-β-, and 11′-γ-T1) [73], in pumpkin seed oil and its CCC fraction (11′-α-, 11′-β-, 11′-γ-, and 11′-δ-T1) [16], leaves of Kalanchoe daigremontiana and Phaseolus coccineus (11′-β-, 11′-γ-, and 11′-δ-T1) [74], kiwi (Actinidia chinensis) peel and pulp (11′-δ-T1) [75], in cyanobacteria and microalgae (11′-α-T1 and MDT) [15] (Figure 9). By analogy with T3s, T2s theoretically can have two unsaturated carbons at positions 3′ and 7′, 3′ and 11′ or 7′ and 11′ (Figure 6). α-T2 was identified in 1996 in the palm oil [76], and later, T2s were identified in the T3-rich fraction of palm oil (7′,11′-α-T2) [52], in CCC fraction of palm oil (3′,11′-α-T2 and 7′,11′-α-T2) [73], and in pumpkin seed oil and its CCC fraction (3′,11′-γ-T2, 7′,11′-γ-T2, 3′,11′-α-T2 and 7′,11′-α-T2) [16]. Lastly, it was proposed to call 3′,11′ T2s, 7′,11′ T2s and 11′-T1s ‘tocoflexols’ due to an increased side-chain flexibility in comparison with T3s [77,78] (Figure 10).

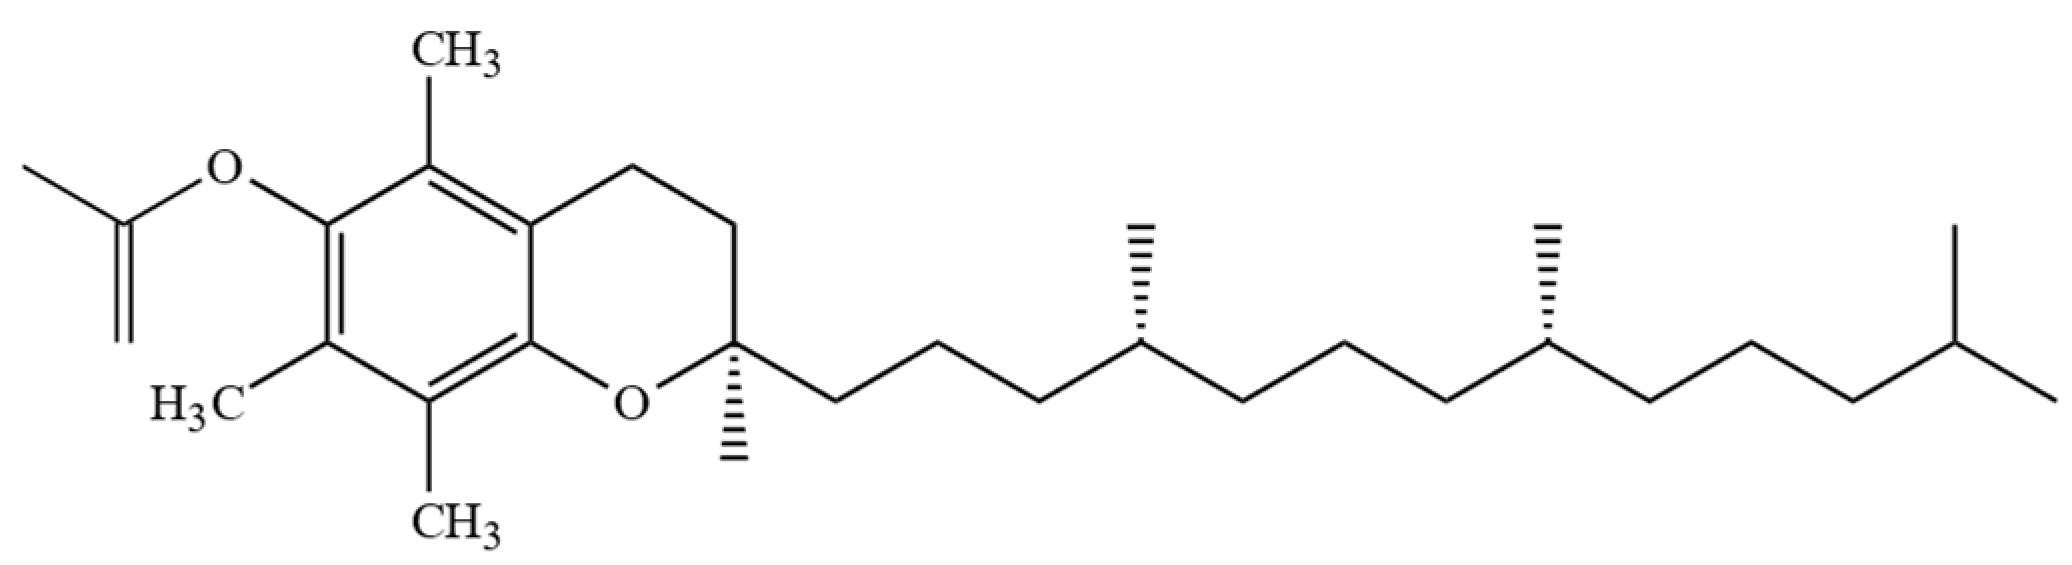
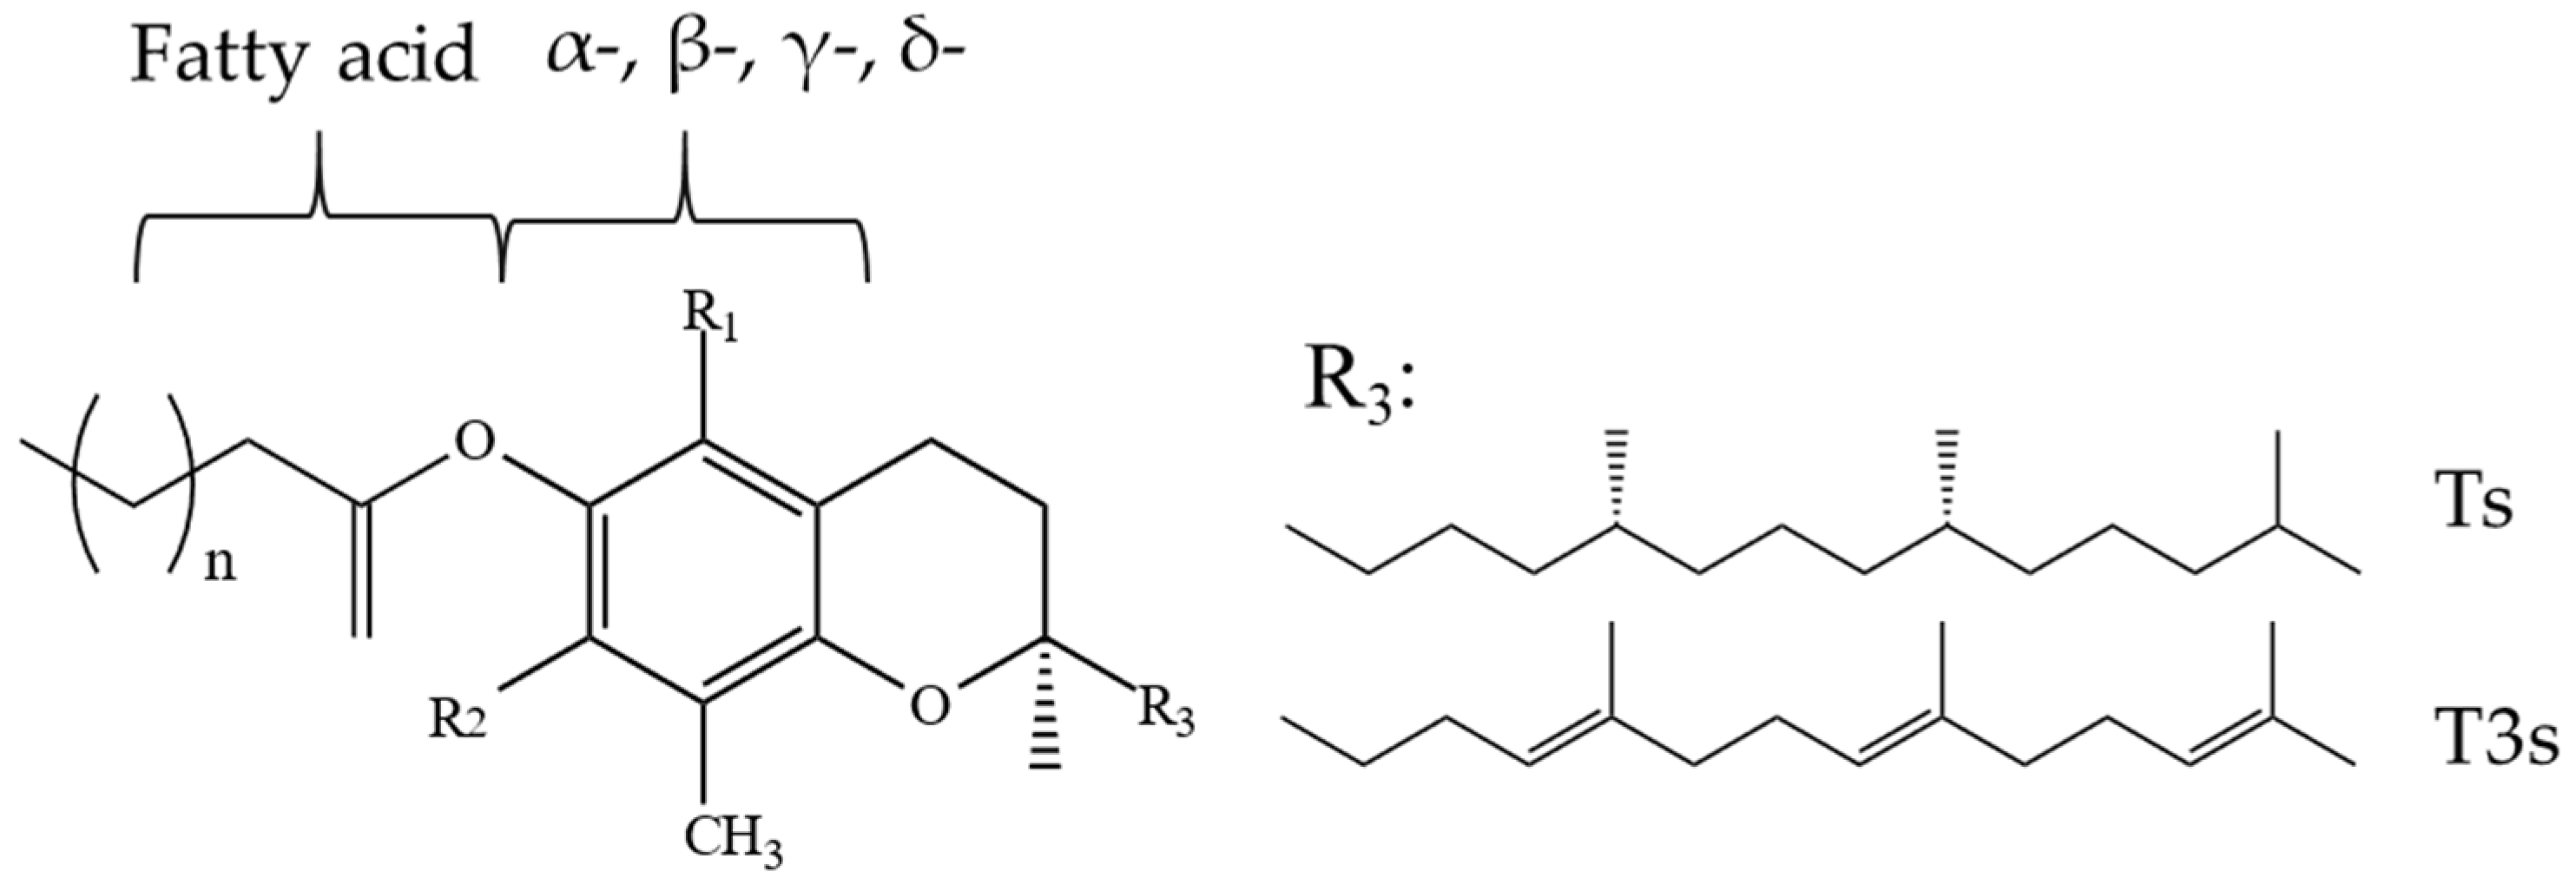
2.3. Bound Tocochromanols

The existence and physiological functions of certain T esters was first raised in 1943 [79]. Acetate, succinate, and phosphate α-T esters are vitamin E (α-T) precursors with more polar characteristics than α-T (a non-polar molecule), and therefore, they show better solubility in water. Generally, precursors of vitamin E (α-T) are synthesized for commercial purposes, e.g., supplements due to their higher resistance against oxidation (increased shelf-life) compared to free tocochromanols [80]. Along with recent ones, reports from as early as 1960s and 1980s show that bound tocochromanols are also present in nature. However, few studies are dedicated to this specific topic.
Tocochromanols in the form of esters (Figure 11) are present in such oils as rice bran oil (7% total, 5% α-T esters), soybean oil (1% total, γ-T and δ-T esters 0.5% of each), sesame oil (1% α-T esters) [81], and palm oil (4–14% total, 3–11% α-T esters) [82]. Esters of tocochromanols are particularly abundant in the lipid fraction of latex obtained from rubber trees (H. brasiliensis) and constitute 45–57% total tocochromanols, depending on the applied hydrolysis (acid and alkali), where γ-T3 is the major ester [53]. Bound Ts have also been found in rape, soybean, and flax seeds, where rapeseeds were characterized by the highest amount of bound Ts (67%) [83] and hazelnut (Corylus avellana) (22–46%) [84]. A varied composition and concentrations of T esters can be found in bell pepper, chili pepper, cucumber, walnut (7–84%), where bell and chili peppers are dominated by α-T esters, while walnut and cucumber are abundant in δ-T and γ-T esters, respectively [10]. In cucumber, walnut, and bell and chili peppers, the following esters have been found: α-T with C12:0, C14:0, C15:0, C16:0, and C16:1Δ9; β-T with C12:0; γ-T with C12:0, C15:0, C14:0, C16:0, C18:1∆9, C18:3∆9,12,15, and C20:0; and δ-T with C12:0, C14:0, C16:0, C18:0, and C20:0 [10]. The esters of α-T, β-T, or γ-T with such saturated fatty acids as C12:0, C14:0, C16:0, and C18:0 have been found in leaves and flowers of Nuphar luteum and stems and leaves of Nymphea alba [85]. The concentration of esters in investigated samples is affected by the plant maturity [86] and cultivar (genetic factor) [84,86]. Tocopheryl fatty acid esters can be found in nature [10], while also can be formed as side products, e.g., during oil heating at frying temperature [87] and oil deodorization [88]. Commercially deodorized oils such as rapeseed and sunflower can contain 3–12 mg/kg of α-T esters [88]. Fatty acid esters can also be found in the purified residues and distillates of structured lipids [89]. Additionally, bound tocochromanols may occur as glycosides and can be obtained, e.g., by the biotransformation of Ts into glycosides by cultured plant cells of Eucalyptus perriniana [90]. Nevertheless, tocopheryl fatty acid esters, in contrast to α-T-Ac, are characterized by a lower bioavailability than free α-T, and they most likely are non-fissile in the human body [10]. Hence, it is important to determine free and esterified tocochromanol separately in future studies on the esterified tocochromanols and other potential biological activity [10].

3. Extraction of Tocochromanols

3.1. Sample Preparation and Extraction Techniques

The sample preparation method used before analysis is one of the main factors affecting the uncertainty of the analysis results. The choice of a correct sample preparation technique depends on several factors, the main ones being the purpose of the study, detection technique, amount of analytes in the sample matrix, and the type of the sample. Such aspects as the extractability, free and bound tocochromanols, and stability of the analytes should be taken into consideration. This section describes the main sample preparation techniques used in the analysis of tocochromanols as well as the main issues associated with extraction.
  • Sample Dilution
For several types of samples rich in fat, such as plant oils [12,35], butter [91], and margarine [92], sample dilution in 2-propanol prior to the analysis of Ts and T3s by RPLC has been proposed. The fat samples were proposed to be diluted also in other solvents, such as n-hexane [93], cyclohexane [94], or methyl tertiary-butyl ether:methanol (1:1 v/v) [95]. The type of used solvent for sample dilution and its proportion is affected by several factors, such as the sensitivity and selectivity of used detection method, concentration of tocochromanols in the sample, technique used for their determination (e.g., n-hexane is suitable for NPLC, while 2-propanol for RPLC), analytical tools (columns) [12], and type of fat sample (e.g., butter and margarine cannot be dissolved in n-hexane due presence of water but can be dissolved in 2-propanol) [91,92]. Due to concerns about tocochromanol stability, some authors prefer to add antioxidants such as butylated hydroxytoluene (BHT) to the sample and use amber glass to protect analytes against oxidation [94]. It should be taken into account that since the sample is not purified, simple dilution technique may lead to the misidentification and misinterpretation of the results, especially if the analyzed matrix, such as cold-pressed oils, is poorly investigated and is rich in many compounds. Sample dilution is not necessarily compatible with all chromatographic techniques due to possible contamination concerns; however, some authors adopt this method for T and T3 detection in oil samples using the RPLC-MS [96] and SFC-MS systems [94].
  • Direct Solvent Extraction
Direct solvent extraction (solid–liquid extraction) is a method used for powdered samples which require the extraction of tocochromanols from the matrix. Briefly, the powdered plant material is supplemented with different solvents, such as methanol, or n-hexane:ethyl acetate (9:1 v/v) [11], 80% ethanol [30], n-hexane [97], ethanol [98,99], and some other solvents in various ratios to plant material, with the addition of antioxidants such as BHT [97,98,99] or pyrogallol [11] and extracted only by mixing [11,97] or treated with ultrasound [30,98,99] at room or elevated temperatures. The application of various solvents for the direct extraction of tocochromanols has been deeply discussed and reviewed previously [100]. In the case of samples with a high enzyme activity, stabilization is advised to prevent tocochromanol destruction [101]. The main flaw in most of those studies is the lack of comparative study investigating extractability when using other solvents and extraction techniques, e.g., saponification, and method validation. Saponification protocol is stated as the most effective in tocochromanol extraction [11,30,102]. The advantages of direct extraction are speed, low workload and costs; it is an environmentally friendlier sample preparation technique if ethanol is used and compatible with NPLC or RPLC when hexane or ethanol and methanol are applied, respectively. The disadvantages are lower extractability and often the presence of other analytes in the extract, e.g., phenolic compounds or lipids (type of used solvent is a key factor), which can negatively affect identification depending on the method of detection.
  • Saponification
Saponification (alkaline hydrolysis) is by far the most common protocol for sample preparation for tocochromanol determination in different types of matrix [11,30,102,103,104]. The aim of this procedure is to improve the extractability of tocochromanols (liberating tocochromanols from ester forms and the matrix) and partly purify the sample (prevents the emuslification, the presence of sample particles, and the high amount of lipidic compounds) [11]. Tocochromanol assays obtained by saponification protocol show the total content of free and bound tocochromanols. In the process of saponification, generally, solutions of potassium hydroxide (KOH) with a concentration from 5 to 20% [83] up to 80% are used, with 60%, w/v, being the most effective [105]. Prior to adding the KOH solution, the sample is supplemented with ethanol and different antioxidants (BHT, pyrogallol, and/or ascorbic acid) to prevent the destruction of tocochromanols during the process of saponification. The reaction takes 10–120 min [83], with 25–45 min applied in most reports [11,30,102,103] at ambient temperature [106] or up to 100 °C [102]; however, the range 70–80 °C is most commonly used [11,30,103]. During saponification, the sample is mixed every 5–10 min [11,30,103] or treated with ultrasound [104]. Then, 1%, w/v, sodium chloride (NaCl) is often added to end the reaction and to reduce the surface tension between the phases [11,30,103]. The sample is cooled in an ice bath and, finally, tocochromanols are extracted by n-hexane [106] or a mixture of n-hexane:ethyl acetate (9:1 or 8:2, v/v) [11,30,102,103]. A 9:1, v/v, ratio of n-hexane to ethyl acetate is most often used [11,30,103]. After multiple re-extractions, the sample is evaporated and dissolved in the suitable solvent for the specific detection method. The saponification protocol is the most effective tocochromanol extraction method [11,30,102]. However, during the process, the sample is firstly saponified and only then extracted; therefore, we do not know whether obtaining a higher content of tocochromanols is the result of liberating bound tocochromanol forms or improving extractability, or both. There is no proof that the saponification protocol provides 100% tocochromanol recovery from the sample matrix. For instance, it has been shown that thermal (roasting) or chemical (decaffeination) sample treatment before saponification improves tocochromanol extractability from coffee beans [19].
  • Alternative Techniques
Soxhlet extraction is the most often method used for oil extraction [38,107], but it is only occasionally used for tocochromanol analysis in comparison to other sample preparation methods [108]. Soxhlet is less effective in tocochromanol extraction from cereal matrixes than saponification [108], and the content of tocochromanols is affected by the type of used solvent in Soxhlet apparatus [107]. Ultrasound treatment seems to be more effective in tocochromanol extraction than Soxhlet when the same type of solvent is used [107]. In another report, two factorial analysis of variance showed a lack of statistically significant differences in tocochromanol profile and content in oils extracted from Japanese quince seeds by Soxhlet, supercritical fluid extraction (SFE), ultrasound treatment, and cold-pressing [109]. The disadvantages of the Soxhlet method are the long time and large volume of harmful solvents, e.g., n-hexane. A microwave-assisted T extraction technique with ethanol and 50% KOH (w/v) [110] has also been applied; however, it was not compared with saponification protocol. Therefore, it is unknown whether this method is more effective. SFE is a modern and environmentally friendlier technique due to the use of liquid CO2. It was highlighted that SFE can be effective in the extraction of tocochromanols (84–100%) from oil crops [111]. However, the SFE method appears to be ineffective for the extraction of tocochromanols from cereal matrixes [108]. From a technical point of view, nearly all SFE systems are designed for the preparation of extracts for commercial rather than for analytical purposes.

3.2. Important Aspects in Extraction of Tocochromanols

  • Bound and Free Tocochromanols
The topic of bound and free tocochromanols was highlighted for the first time in 1965 in latex from the rubber tree (H. brasiliensis) [53]. Esterified tocochromanols (ETs) have been separated from free tocochromanols in latex by thin-layer chromatography (TLC) [53]. A similar procedure has been applied for rice bran, sesame, soybean, and palm oils [81,82]. Then, esters were saponified and liberated tocochromanols were determined. Both free tocochromanols and tocochromanols liberated during alkaline and/or acid hydrolysis of esters were determined by measuring the absorption spectrum [53] and NPLC [81,82]. It was demonstrated that the liberation effectivity of tocochromanol homologues depends on the type of chosen hydrolysis method (alkaline or acidic) [53]. In various studies different mixtures of solvents, techniques and plant material for the extraction of ETs were used; chloroform:methanol (2:1, v/v) by the Folch method from rubber tree latex (H. brasiliensis) [53], acetone and then dichloromethane by ultrasonication in different plant organs of N. alba and N. luteum [85], and a mixture of cyclohexane/ethyl acetate (46:54, w/w) by focused open-vessel microwave-assisted extraction in various vegetables and walnuts [10]. Since none of the applied approaches have been compared, it is difficult to discuss their effectiveness. Future comparison studies are required. Additionally, most achievements in the topic of bound Ts in specific plant materials were investigated by one scientific group that found relatively high concentrations of bound Ts in relation to free Ts, e.g., in rapeseed [83] and hazelnuts [84], which is at least worth re-examination. Therefore, future development of suitable analysis protocols for ETs determination is required. Most of the analysis protocols use saponification followed by the extraction of total tocochromanols (free and liberated from bound forms). It might be one of the reasons for the limited information about extractable and non-extractable tocochromanols. The limited knowledge on the presence of bound tocochromanols in plant material is mainly a result of several challenges: lack of standards and suitable protocols for their determination and the time-consuming performance of such analyses.
  • Non-Extractable Tocochromanols
It has been shown that neither Soxhlet nor the SFE method is effective enough to extract the tocochromanols strongly bound to other components in the cereal matrix [108]. Therefore, the saponification procedure is advised to liberate those tocochromanols [108]. The lower recovery from cereal samples, e.g., barley, can be associated with the presence of ETs or tocochromanols that are bound to the matrix [11]. On the other hand, even the saponification protocol can be insufficient to extract all tocochromanols from plant matrix. It has been shown that the extraction of Ts is slightly improved from coffee beans after such treatments as decaffeination and roasting before the saponification protocol (data supported by RP-UPLC-ESI/MS3), probably due to the cellular structure damage, which allows for the extraction of all Ts [19]. The question is: what can we state in such cases about the presence of the non-extractable tocochromanols? The type of used hydrolysis (alkaline or acid) has been known to affect the final result of tocochromanols since 1965 [53]. The terms ‘non-extractable tocochromanols’, ‘non-extractable tocopherols’, and ‘non-extractable tocotrienols’ are not present in scientific literature. Meanwhile, the term ‘non-extractable polyphenols’ has become more and more discussed in the last decade, especially in studies on fruit peels and by-products [112,113,114,115,116,117], and protocols have already been proposed for their determination in different plant materials [118]. Free tocochromanols, due to the presence of one phenol group in the chromanol ring, are also called monophenols [119]. The occurrence of extractable and non-extractable forms would be another common feature of these bioactive compounds. However, such terms and protocols that exist for polyphenols have never been proposed/investigated for tocochromanols. The esterified forms of tocochromanols and non-extractable tocochromanols are high molecular weight molecules. They can be associated to polysaccharides, proteins, and constituents of dietary fiber similarly to non-extractable polyphenols. Additionally, they can be retained in the matrix and inaccessible to solvents due to various interactions with the plant matrix, as is the case of non-extractable polyphenols [118].
  • Roasting—Challenges after Sample Treatment for Tocochromanol Determination
The analysis of roasted samples should be conducted thoughtfully due to newly formed compounds, which are generally known as Maillard reaction products [120]. A majority of compounds formed during the roasting of mustard seeds were found to be non-polar, probably formed from phospholipids, and some of them may exhibit fluorescence properties [120]. Since a fluorescence detector is one of the most popular detection methods applied for tocochromanol determination, newly formed compounds may interfere with identified tocochromanols and ultimately lead to misinterpretation of the data. While the slight increscent of tocochromanol extraction efficiency from the plant material after roasting, e.g., in coffee [19] or pumpkin seeds [121], can be explained by improved extractability due to plant cell damage, providing an evidence-based explanation for a many-fold concentration increase is difficult. For instance, in thirty two samples of arabica and robusta coffee beans before and after roasting, on average, a nearly four times higher total content of Ts and over thirty-six times higher content of γ-T was observed in the roasted beans [18]. The reason for the obtained results is most likely the coelution of analyzed Ts with newly formed compounds. The unidentified compounds formed during roasting have been observed in several coffee studies during T identification [19,39]. Our thesis, that roasting causes some analytical challenges during tocochromanol determination by using fluorescence detection especially in NPLC, is best supported by three reports on roasted rape seeds. An increased amount of tocochromanols during roasting was observed in all three studies. The three reports generally support each other if total tocochromanols are considered; however, different effects on individual tocochromanol content were observed. The content of γ-T [122], β-, δ-T [123], and PC-8 [124] increased in roasted rapeseeds. In each of those reports, a NPLC-FLD system with different columns and mobile phase modifiers was used. This phenomenon of the differing effect on tocochromanol content during rapeseed roasting requires future investigation using other analytical tools for tocochromanol determination, for instance, RPLC, SFC, gas chromatography (GC) or application of MS detection.

3.3. Lab-Scale Isolation, Synthesis, and Purification of Tocochromanols

One of the challenges in the detailed characterization of tocochromanols in plant material is associated with the lack of commercially available standards (e.g., PC-8, T1s, T2s, and tocochromanol esters). Thus, sometimes, research on rarer tocochromanols is not possible without including isolation and purification methods as well as synthetic approaches to obtain products as qualitative or quantitative standards. In addition, another reason for the acquiring of tocochromanols is to further use the products in studies on biological activity. There are few approaches for the isolation of specific tocochromanols.
To the best of our knowledge, the main criteria for choosing the specific plant material for the isolation of tocochromanols are a high concentration predominance of the compound over other tocochromanols. The right plant material and purification techniques could increase the final purity of the isolate. Plant material with dominance and high concentration of specific T and T3 have been listed in Section 2.1. For instance, PC-8 has been isolated from saponified flaxseed oil (containing mostly γ-T and PC-8) using NPLC with a semi-preparative column [13]. The chromatographical purity of PC-8 was tested using LC with a diode-array detector (DAD), and the final purity of the isolate was 93 %. The concentration was measured gravimetrically. The concentration of tocochromanols such as PC-8, Ts, and T3s can be also measured spectrophotometrically using molar absorption coefficients [13,125,126]. The molar absorption coefficient is affected by the type of used solvent for measurement [13]; however, in the case of other minor tocochromanols, molar absorption coefficients are not available. A similar approach as reported by Siger et al. [13] was used to isolate α-, β-, γ-, δ-T3s and PC-8 from different plant oils by applying SFC with an analytical-scale column [12]. SFC was also proposed to isolate α- and β-T from wheat germ oil using a semi-preparative column [127]. Re-chromatography [13], low-pressure liquid chromatography [128], column chromatography and TLC [129] have been applied to purify PC-8. Similar methods can be used to increase the purity of other tocochromanols. For the isolation of α-T1 and MDT [130] from tuna oil, first, the sample was saponified; later, column chromatography (using silica and n-hexane:ethyl acetate 95:5 v/v) and two fractionations using the HPLC system were applied. Isolation of a novel 11′-δ-T1 homologue from kiwi fruits has been performed by extraction with n-hexane; subsequently, column chromatography (silica—petroleum ether/acetone mixture and NH2-silica—petroleum ether/ethyl acetate mixture) and RPLC preparative chromatography (RP-8 column—methanol:acetonitrile:H2O mixture) were used to fractionate the extract [75]. Counter-current chromatography (CCC) is the latest trend in fraction enrichment with T1s and T2s [16,73]. Higher sample amounts can be loaded into the system due to the absence of the stationary phase; this advantage makes CCC beneficial for the fractionation or isolation of compounds with low content in the plant material, including tocochromanols.
A synthetical approach is another alternative to obtain tocochromanol-related standards. For example, PC-8 has been obtained from plastoquinone-9 [64]. α-T1 and α-T2 have been obtained by saturating double bonds in the side-chain of α-T3 using a partial hydrogenation reaction with palladium-activated carbon ethylenediamine complex as a catalyst [131]. (2R,8′ S,3′ E)-δ-T2 has been obtained in an eight-step synthetic route from δ-T3 [77]. Different α- and γ-tocopheryl fatty acid esters have been obtained by esterification reaction with the subsequent separation of free fatty acid as well as unreacted free T from the mixture using solid phase extraction [10]. α-Tocotrienolquinone epoxides were obtained by the thermal oxidation (3 h, 50 °C) of α-T3 with the addition of azobisisobutyronitrile in oxygen-saturated acetonitrile/water (60:40 v/v) mixture, while 5-formyl-γ-T3 was obtained as a γ-T3 thermal oxidation product (60 °C for 3 h) [132].

4. Chromatographic Techniques Used for Tocochromanol Determination

4.1. Liquid Chromatography (LC)

LC, including normal-phase (NP) and reversed-phase (RP), is the most common technique for T and T3 determination. Using phrases “tocopherol + normal phase” and “tocopherol + reverse phase” in the www.scholar.google.com (on 14 May 2021) search engine, 150,000 and 61,800 results are returned, respectively. While it is not necessarily the most precise way to evaluate the trend, it can be generalized that NP was applied more often than RP. One of the reasons for this predominance of NP over RP in the analysis of Ts could be that NP was introduced earlier than RP.
  • Normal-Phase (NP)
The separation of T homologues (α, β, γ, and δ) in oils was performed for the first time in 1973 using NP on silica columns (Corasil II) by applying hexane:diisopropyl ether (19:1, v/v) as the mobile phase and fluorescence detection with an λex. of 295 nm and an λem. of 340 nm [133]. In NPLC, n-hexane or n-heptane [13,22,52] are generally used as the mobile phase with different modifiers: 2-propanol, dioxane, ethyl acetate, tetrahydrofuran, methanol, tert-butyl methyl ether, diisopropyl ether, and acetic acid up to 5.5% [22,134]. Generally, three main different stationary phases are used for NPLC: diol, amino (NH2) and silica (Si), the latter one being the most popular NP stationary phase for tocochromanol determination [134]. Usually, separation is performed at elevated temperatures; this parameter as well as the flow rate, type and concentration of the modifier are adjusted for the specific column to achieve the best ratio between separation selectivity and total analysis run time [29,134]. In NPLC, the number and position of the methyl substituents on the chromanol ring has higher impact on the compound polarity and thus affinity than the saturation and length of the side chain. It is more apparent when PC-8 is separated simultaneously with Ts and T3s [13]. The highest difference in polarity prevails between homologues α (less polar) and δ (more polar), which have in total three (5,7,8-trimethyl-) and one methyl (8-methyl-) substituents on the chromanol ring, respectively. Therefore, this pair is not considered problematic to separate. On the other hand, β and γ isomers have two methyl substituents on different positions (5,8-dimethyl and 7,8-dimethyl, respectively), and the separation of this pair is considered to be problematic, as structural asymmetry is sometimes not enough for successful separation. The difference in polarity between Ts (less polar) and T3s (more polar) arises due to the saturation degree of the side chain. To sum up, the typical elution order of tocochromanol homologues on the NPLC Si phase is α-T, α-T3, β-T, γ-T, β-T3, γ-T3, δ-T, δ-T3 [134]. α-T-Ac is commonly used as an internal standard and will elute first, since it has reduced affinity to the stationary phase due to the absence of the hydroxyl group on the chromanol ring [29], while 5,7-dimethyltocol is also a viable option to use as internal standard [135]. Diol is another NP stationary phase widely used for tocochromanol separation with the same elution order as Si columns, but it is less reproducible, stable and efficient than Si phases [29,134]. A valuable alternative for the NP separation of tocochromanols is the NH2 phase, which can be used in NP as well as in RP mode. The NH2 phase in NP mode may provide an identical elution order as the Si and diol phases [29,134] or a slightly different order to give α-T, α-T3, β-T, β-T3, γ-T, γ-T3, δ-T, and δ-T3 [134]. Known advantages of NPLC for the determination of tocochromanols are high selectivity, especially for the separation of isomers β and γ, the ability to simultaneously separate PC-8 from Ts and T3s [24,136], compatibility of the mobile phase with the direct dilution of oils [137], and compatibility with direct analysis of sample diluted in n-hexane after saponification [137]. However, the usage of toxic solvents harmful to the environment and the necessity to remove water in instrument channels and switch the instrument for work with NP mode are considered to be the main disadvantages of NPLC.
PC-8 could be considered a γ-tocochromanol homologue but with a longer side chain, however, their biosynthetic pathways are different. Because the retention of tocochromanols in NPLC is more dependent on the differences in the chromanol moiety of the molecule, it is easier to elute/separate it in the NPLC (PC-8 is eluted between β-T and γ-T3) than RPLC [13]. PC-8 is often determined simultaneously with four Ts and four T3s; however, except for two reports with separation run time 40 min [13] and 60 min [136], no papers showing NPLC chromatogram examples have been published [63,93,138]. The lack of separation selectivity and the fact that a PC-8 standard is not commercially available and is rarely specially isolated may become the reasons for misinterpretations of the obtained chromatograms. When the plant material does not contain β-T3 and γ-T3, chromatographic challenges in NPLC are not observed, and PC-8 is eluted immediately after γ-T [139]. On the other hand, when β-T3 and/or γ-T3 occur in plant material, the challenge of PC-8 separation arises, since PC-8 is eluted between this problematic pair. Thus, not only the type and concentration of used modifier for the NP mobile phase but also its purity (data unpublished) are critical. Additionally, PC-8 can also be problematic for the correct identification in the roasted samples due to newly formed compounds and their possible coelution with PC-8. For instance, it has been reported that the PC-8 content can increase more than 26 times in rape seeds during roasting [124]. Such a large PC-8 concentration increase during roasting is difficult to explain other than with the co-elution of PC-8 and compounds formed during roasting. If the results obtained are controversial, we recommend re-examining the samples using additional analytical tools to eliminate misidentification. Table S2 (Supplementary Materials) summarizes NPLC chromatographical methods for the determination of tocochromanol-related compounds.
  • Reverse-Phase (RP)
RPLC started to replace NPLC as an alternative method for tocochromanol determination over two decades ago. Unlike NPLC, RPLC utilizes relatively non-polar stationary phases (e.g., C18, C30) and different mixtures of polar eluents. While the basic silica NPLC stationary phase provides better selectivity for tocochromanol separation, advancements in the technology of RP stationary phase preparation allow achieving baseline separation of the analytes. The use of such mobile phases as methanol and acetonitrile improves the sustainability of the chromatographical methods in the context of the environmental desirability and reproducibility of the obtained results by RPLC. Generally, tocochromanols are compounds of lipophilic (non-polar) nature, and the presence of the relatively long side-chain of tocochromanols makes the elution in RPLC demanding for the strong eluents, meaning a high concentration of the organic phase (methanol, acetonitrile) in the mobile phase. In T and T3 separation, the isocratic flow of a mixture of methanol and water in ratio from 80:20 to 100:0, v/v, is most often used [140,141,142,143] (Table S3—Supplementary Materials). Generally, the concentration of water in the mobile phase is associated with the expected results of separation and number and type of tocochromanols to be separated. It can also depend on the used column phase and its parameters. The addition of water to the pure organic modifier (e.g., methanol) is positively correlated with peak resolution and negatively correlated with the overall sensitivity of method [144]. Acetonitrile, methanol and water [36] or acetonitrile, methanol and dichloromethane are also used quite often on C18 and C30 columns [43,145]. While the isocratic separation of tocochromanols is the most popular, certain samples may include lipophilic compounds that will not be eluted during the isocratic chromatographical run and will most likely elute during the next run. While the drawbacks of the gradient elution include significantly longer analysis time, some authors prefer using gradient elution utilizing methanol:water (96:4) and methanol:methyl tert-butylether:water (4:92:4) [41], methanol and methanol:2-propanol:acetonitrile (40:50:10) [146], methanol:water (80:20) and methanol [142], methanol:water (91:9) and tert-methylbutylether:methanol:water (80:18:2) [101] solvent systems.
The C18 column is often the first choice for the RPLC separations of most analytes due to its universality and availability in most scientific laboratories, however it does not separate β and γ tocochromanol isomers. There is only one published report on the separation of tocochromanols using a PerfectSil Target ODS-3 (octadecyl functional group-C18) column; however, separation was performed at 7 °C, and the total analysis run was 62 min [147]. The elution order of T3s and Ts separated by a C18 column in RPLC is as follows: δ-T3 > β-T3 + γ-T3 > α-T3 > δ-T > β-T + γ-T > α-T [36]. The separation of as many tocochromanols as possible is particularly important when the plant material is investigated for the first time. In the last two decades, several types of stationary phases have been developed, which are capable of separating the β and γ isomers. These stationary phases can be grouped in two groups differing by the elution order between the β and γ isomers—the first group is δ > γ > β > α, while in the second group, δ > β > γ > α. The first group includes C30 columns [36,141]; π-naphthalene (π-NAP) columns—the naphthalene bound stationary phase enhances π–π interactions and improves selectivity for structural isomers such as β and γ [141,148]; and pyrenylethyl (5PYE) columns with 2-(1-pyrenyl) ethyl groups bonded silica offer separation with high molecular shape selectivity or π–π interactions providing high selectivity for the separation of structural isomers [149]. The second group includes pentafluorophenyl (PFP) columns with pentafluorophenyl propyl (PFP/F5) ligands bound to the stationary phase [28,91,140,150,151], and selectivity is achieved through four mechanisms of interaction (hydrogen bonding, dipole–dipole interactions, hydrophobic, and π–π interactions), allowing for structural isomer separation [152]; and RP-Amide columns, which contain a base-deactivated phase with a polar group within the alkyl-bound phase, which provides unique selectivity [150]. The first report about the separation of T isomers (β and γ) using a PFP column was published in 1994 [151], and in only two decades, it had become popular for the separation of four T and four T3 homologues [91,101,140].
  • PC-8 Issue
One of the disadvantages of the RP is the inability of simultaneous separation of PC-8 with four Ts and four T3s in one chromatographic run, which is due to the insufficient eluting strength of the RPLC mobile phase (usually methanol or acetonitrile) and strong interaction of the PC-8 side-chain with RP stationary phase. The analytical determination of PC-8 using RPLC with a C18 column can be achieved by the addition of n-hexane (up to 20%) to the mobile phase [36] or by decreasing the column length, ID and particles (50 × 2.1 mm, 1.7 μm), increasing the column temperature (60 °C), and using 100% methanol [153]. In both cases, the coelution of most Ts and T3s prevents the effective simultaneous separation of these major compounds [36,153]. Nevertheless, both methods are suitable for the determination of PC-8, but Ts and T3s should be detected with a different appropriate method. Therefore, when tocochromanols are determined in green plant material (especially leaves), seeds, and oils rich in PC-8, NPLC and SFC with an established method for the separation of Ts, T3s, and PC-8 [12] seem to be better options than RPLC, or the use of two separate chromatography runs by RPLC should be performed to obtain detailed information about all tocochromanols in the investigated plant material [36].
  • C18 Column Issue
By using phrases “tocopherol + C18 column”, “tocopherol + C30 column”, and “tocopherol + PFP column” in the www.scholar.google.com (on 14 May 2021) search engine, the following number of the results is returned: 46,900, 4110, and 995, respectively. Apart from the fact that these specific keywords do not necessarily need to be directly related to the description of the methodology for the determination of Ts, it can be assumed that the C18 stationary phase might be the most popular choice for T determination by RPLC. Unfortunately, the C18 column has one serious disadvantage: it is unable to separate isomers (β and γ) [144,146,154]. Due to the lack of selectivity for β and γ separation, the results are often described as a sum of β + γ or, worse, as γ homologue content, while the β presence is ignored. Sometimes, it is stated that β-T is only a minor component in plant material, while β-T3 does not occur at all. Such statements are often based on a limited number of reports, therefore, when the presence of β-T or β-T3 cannot be excluded in the tested sample, appropriate tools for β and γ isomer separation should be used to avoid wrong interpretation of the results. Finally, the presence of β isomer can be expressed incorrectly as γ, e.g., in the seed oils of Guelder rose (Viburnum opulus) [56] and Nigella (Nigella sativa) [37]. The widespread use of a C18 column instead of other RP stationary phases for tocochromanol separation is not necessarily linked with a lack of knowledge about the most suitable analytical tools but with the universality of C18 columns for several different applications, including tocochromanol determination [155]. The application of the C18 column is often additionally justified by using the statement provided above about very low β homologues occurrence in nature. Recent studies show that the occurrence of β homologues in the plant world is underestimated, which is mainly due to improper methodology, tools, and unsubstantiated assumptions [40]. Such thinking can often lead to misinterpretation, as has been demonstrated in Table 1.
The examples given above on the presence of β-T and β-T3 (Section 2.1) show that the low occurrence of homologue β in the plant world has been incorrectly assumed. It reinforces the importance of using correct tools for tocochromanol determination. The more detailed determination of minor tocochromanols can be a powerful tool, for instance, in the study of authenticity of plant oils [159].
  • Detectors Used in LC
Different studies include several common detectors that have been applied in the LC analysis of tocochromanol-related compounds: diode array detector (DAD), fluorescence detector (FLD), evaporative light scattering detector (ELSD), electrochemical detector (ECD) as well as different mass spectrometric (MS) techniques. ECD is one of the most sensitive and specific detection methods [160,161], while ELSD and UV are non-selective and less sensitive than FLD [162]. ECD is a unique detection method for tocochromanols, allowing to also measure oxidative products of tocochromanols, which do not fluoresce, while UV detection is not sensitive enough for those compounds. ECD is compatible only with RPLC, since only RP eluents are sufficiently polar to carry electrolytes that are required in the eluent solution to support the redox reactions that are the basis for detection [163]. Tocochromanols have fluorescence properties due to the presence of chromanol moiety of the molecule, and the FLD is the most common detector due to its sensitivity and selectivity [11,30,35,102]. While the UV/DAD detector is a viable option for the determination of tocochromanols (at the wavelength around 295 nm) with relatively low sensitivity and selectivity in comparison to FLD (an λex. of 290 nm and an λem. of 330 nm), it is advised to couple both DAD and FLD to confirm detected analytes, verifying their UV spectra if the concentration allows it [162]. Leray et al. [164] compared the within-run precision of three detectors, and the results were: FLD > UV > ELSD. The sensitivity of the ELSD detector is similar to UV detection; however, it is less selective. Using LC, FLD is around 103 more sensitive in comparison with UV and ELSD, depending on the homologue and conditions [162]. Fluorescence quenching as well as difficulties related to the gradient method development with FLD (baseline is very sensitive to changes in the mobile phase) are the main disadvantages of FLD [141]. Detector sensitivity can generally be lined up as follows: MS ≥ ECD ≥ FLD >> UV = ELSD. Mass spectrum techniques are discussed in Section 4.4.

4.2. Gas Chromatography (GC)

GC methods have been used to identify and quantify tocochromanols since the 1970s. However, LC methods are currently more frequently used than GC for major tocochromanols, which can be explained with the longer time of GC analysis, its lower sensitivity, and necessity for a derivatization step [165,166]. On the other hand, GC seems to be the first choice for the determination of minor tocochromanols such as T1s and T2s [142] and bound forms [10,86] due to its better separation selectivity for minor tocochromanols. In GC, a mixture in the gas phase is moving forward in a carrier gas flow (helium, nitrogen, argon or hydrogen) through packed or capillary columns at elevated temperatures. The main factors that affect the results of the analysis are the type of stationary phase and dimensions of the column, carrier gas flow rate, split ratio and injection volume as well as the temperature program and the type of detector used. Tocochromanols are compounds of lipophilic nature; therefore, relatively non-polar (5% phenyl groups) stationary phases are most commonly used for the separation, e.g., HP-5 [167], Rxi-5Sil MS [168] or CP-SIL 8 CB [169]. A cyanopropyl stationary phase CP-Sil88 has been used for the successful separation of α-T enantiomeric pairs (RRS + SSR, RRR + SSS, RSR + SRS, RSS + SRR) [170]. The elution order of Ts and their esters (TMS) is dependent on their boiling point, giving retention time (RT) as follows δ < β < γ < α [171]. While tocochromanols can be separated using isothermal modes depending on the methods’ purpose, matrix and possible interferences, separation is often performed using pre-programmed temperature gradients: 120–350 °C [167], 180–280 °C [168], 150–320 °C [172], 250–290 °C [169], 200–300 °C [173], and 70–310 °C [174]. Such parameters as injection volume, specific split value or splitless mode are dependent on the concentration of tocochromanols in the sample, the purity of the sample, the detection type, as well as the capacity of the column. Nevertheless, splitless [167,168,172] and different split values from 1:5 to 1:60 have been widely applied. Solvents such as ethanol [167,172], n-hexane [168], chloroform [174], and n-heptane [75] have been used as sample diluents. It is considered that the derivatization procedure is required prior to separation with GC to increase the volatility and thermal stability of the analytes. In some cases, derivatization is required for the improvement in separation selectivity and sensitivity by using MS [171]. While there are some methods that do not require derivatization [167,172], most GC tocochromanol determination methods use trimethylsilyl (TMS) derivatizing agents such as N-methyl-N-(trimethylsilyl)trifluoroacetamide (MSTFA) or N,O-bis(trimethylsilyl) trifluoroacetamide (BSTFA) [168,173,174]. Flame ionization detector (FID) is a universal detector for GC that works under the assumption that any gas molecule entering the permanent flame (usually fueled by hydrogen and air) will ionize and cause a change in electric conductivity. However, this type of detector is not selective and does not provide any direct or indirect information on the identity of the compound. This is why tocochromanols are often detected with a MS detector. Hard ionization sources, such as electron impact [75] or softer chemical ionization [173], have been successfully applied for the determination of tocochromanols. The main advantage of the electron impact ionization is the reproducibility of the spectra, which allows for the creation of widely available libraries of mass spectra (NIST Wiley). Therefore, GC-MS is a common tool for the identification of unknown organic compounds [175].

4.3. Supercritical Fluid Chromatography (SFC)

In the last decade, there has been a breakthrough for SFC or Ultra-Performance Convergence Chromatography (UPC2) systems, which has enabled the acquisition of precision and reproducibility comparable to that of LC systems. Currently, packed column SFC has a meaningful advantage to LC: it uses low-viscosity CO2 with modifiers (e.g., methanol, ethanol, 2-propanol) as the main mobile phase, which allows higher operational flow rates, more rapid analysis compared with LC and, additionally, the application of the CO2 makes SFC an environmentally friendlier method [176]. The improvement of SFC instrumentation has been demonstrated with recent studies, showcasing the benefits of SFC versus LC as well as their differences in selectivity behavior [177,178,179,180]. The advantages of SFC over LC are the possible application of NP, RP, and HILIC columns while using the same mobile phase in both cases (CO2 with a modifier), which provides great versatility in terms of retention mechanisms (NP, RP, and mixed retention mode) [12,181]. Additionally, SFC is characterized by the higher efficiency of molecule separation and rapid analysis time, contributing to the faster method development in comparison to LC. In the last decade, an increased interest can be seen in the application of SFC for tocochromanol determination [182] (Table S4—Supplementary Materials) using columns deigned specially for SFC [52,182] to core–shell ones used in LC [12,144].
It has been clearly demonstrated that unlike in RPLC, in SFC, the C18 stationary phases provide enough selectivity for the separation of β and γ isomers [12,144,181]. However, it has also been shown that isomer separation is not possible in all C18 columns, and this phenomenon can be a result of different carbon loads of C18 columns by various manufacturers [12]. One of the main disadvantages of the SFC is relative complexity in method development. For example, the elution strength of the mobile phase in SFC is dependent not only on the stationary phase (RP, NP) and the type of modifier (methanol, ethanol, acetonitrile) being used but also on the overall pressure in the system, which is continuously changing depending on the used gradient. It has been demonstrated that the simultaneous separation of PC-8, four T and four T3 homologues (run time 15 min) is possible using the biphenyl bound stationary phase [12]. The obtained elution order was mixed mode: δ-T > γ-T > β-T > α-T > δ-T3 > γ-T3 > β-T3 > α-T3 > PC-8 [12]. The elution of PC-8 as the last tocochromanol is in agreement with RP order after the addition of a high percentage of n-hexane to the methanolic mobile phase of the C18 column [36]. However, in SFC, PC-8 is eluted by the increased concentration of methanol in the mobile phase [12]. Since PC-8 is widespread in plants, especially in leaves [65], it makes sense to use at least flax seed oil to confirm the identification of PC-8 in the future.
  • Detectors Used in SFC
The most commonly used detectors in SFC are UV/DAD and MS with the former used more often. SFC-DAD has been applied for the determination of tocochromanols in plant oil (Ts, T3s, and PC-8) [12] and leaves (Ts and T3s) [183]. The Ts and T3s have absorbance maximums in the UV spectra in the range of 292–298 nm with alcoholic solvents as the mobile phase [144,145], while in the SFC method, which uses CO2:methanol (99.8:0.2, v/v), all homologues have similar maximums in the UV spectra 294–295 nm [144]. The limitation of other detectors, e.g., FLD, in SFC is associated with high pressure in detector measurement cells due to the presence of a back-pressure regulator, which is necessary component to maintain CO2 in a liquid stage. The development of a unique cylindrical quartz flow cell is allowed for applying FLD in SFC (up to 20 MPa) [184]. The additional benefits of using FLD in SFC systems, beyond selectivity, are rather minor or limited. The difference in sensitivity between SFC-FLD and SFC-DAD for tocochromanol determination is less pronounced (around 3–20 times, depending on homologue) [184] in comparison to the difference between LC-FLD and LC-UV (about 1000 times) [162]. Application of ECD with SFC has recently been demonstrated for the determination of Ts in vegetable oils [185] and Ts and T3s in nutrition supplements [186].

4.4. Mass Spectrometry Techniques

Modern MS techniques allow for the identification and detection of tocochromanols in complex matrixes with high selectivity and sensitivity. Method development, calibration and sample purification is crucial when using MS. This section will briefly cover the main ionization and mass analyzer types that have been previously applied for the analysis of tocochromanols. Bartosińska et al. [171] have published a detailed review paper on MS techniques in the analysis of tocochromanols. The ionization of non-polar substances may be difficult due to the lack of protonation and/or deprotonation sites [187,188]. In order to overcome this problem, it is good practice to use mobile phase additives. The most common approach is the addition of acid (e.g., formic acid and acetic acid) to the mobile phase to increase the formation of protonated species [165]. There are also less conventional techniques. For instance, it has been found that adducts of silver with Ts increase the ionization of Ts [188]. While it is possible to produce positively and negatively charged ions during electrospray ionization (ESI), Lanina et al. [189] have showed that negative ionization is superior in terms of efficiency for the analysis of Ts. Negative ionization leads to the formation of deprotonated molecular ions without further fragmentation. To assist the formation of deprotonated ions, Bustamante-Rangel et al. [187] used a slightly alkaline mobile phase—6.0 mM ammonia in methanol/water (97:3, v/v). The limits of detection were 0.015 μg/mL, 0.0055 μg/mL, and 0.0062 μg/mL for α-T, γ-T, and δ-T, respectively. In the atmospheric pressure chemical ionization (APCI) technique, the sample is first converted into small droplets in a nebulizer by high-speed nitrogen flow. After desolvation in a heated vaporization chamber, the analytes are ionized via corona discharge and transferred to a mass analyzer [190]. Lanina et al. (2007) showed that APCI ionization in the negative mode was superior for the determination of tocochromanols in comparison with ESI, as it produced lower detection limits (2–6 times), a higher linearity range (7.5–25,000 ng/mL APCI (−), 15–3700 ng/mL ESI(−)) and proved to be more robust to the nature of solvents and structure of the analytes [189]. Viñas et al. [191] have been using the following APCI parameters for the determination of Ts: drying temperature 350 °C, APCI temperature 400 °C, drying gas flow 5 L min−1 and nebulizer gas pressure of 60 psi. In atmospheric pressure photoionization (APPI) techniques, the sample is first converted into gas phase by using a heated nebulizer, and after interacting with photons emitted by a discharge lamp and series of gas-phase reactions, the molecules are ionized. Méjean et al. [94] applied SFC-qTOF for the analysis of Ts and T3s using ESI, APPI and APCI ionization techniques and showed that the APPI source is more sensitive and robust in comparison with APCI.
The most conventional and simple mass analyzers are single quadruple (Q) low-resolution MS systems, which can be operated in full scan or selected ion monitoring (SIM) mode. In a paper by Lanina et al. [189], LC-APCI(-)-Q was used for the analysis of Ts in oil and milk samples, and quantification was based on external standards to construct the calibration curves in SIM mode. The LODs in this case were around 3 ng/mL, which is comparable to an FLD detector. The main disadvantage of single quadruple systems is limited information about structural formation. In studies where it is necessary to detect trace levels of tocochromanols and tocol derivatives in complex matrixes, triple quadruple (QqQ) systems can be used. Single reaction monitoring (SRM) mode has excellent sensitivity. An LC-APCI-QqQ system was successfully used by Nagy et al. [192] to identify tocochromanol-related compounds in human plasma. New studies are discovering more tocol derivatives (metabolites, oxidation products), and high-resolution MS (HRMS) techniques such as Time-Of-Flight (TOF) and Orbitrap mass analyzers are beneficial for the identification of these novel or minor compounds.

4.5. Chromatographical Determination of Tocomonoenols (T1s), Tocodienols (T2s) and Esterified Tocochromanols (ETs)

T1s, T2s, and tocochromanol esters have been detected in plant material in low and very low concentrations and therefore require special tools for their separation, detection and identification. For instance, α-T1 cannot be completely separated by RPLC even when using PFP columns with core–shell technology and small particles (2.6 μm), relatively long columns (150 mm) and high amount of water as mobile phase (20%) to improve the separation between the tocochromanols. α-T1 was eluted by RPLC between the β-T and γ-T, which makes the separation even more difficult (run time of analysis 40 min) [142]. GC-MS is very helpful in determination of T1s and T2s. α-T1 was completely separated from other tocochromanols by GC-MS, and the time required was nearly half shorter that of RPLC [142]. A much better solution for the separation of T1s and T2s, at least for α homologues, would be the application of NPLC in comparison to RPLC, where α-T1 and α-T2 are eluted between α-T and α-T3 (analysis run time 30 min for Ts, α-T1, α-T2, and T3s) [52]. The advantage of using NPLC for the separation of T1s (α-T1 and γ-T1) in pumpkin seed oil has been demonstrated as well [193]. NPLC has also been used for the separation of tocochromanols, including α-T1 in palm-derived T3 rich fraction [194]. However, the most impressive combination of both separation and analysis time (below 5 min for four Ts, α-T1, α-T2, and four T3s) has been obtained by UPC2 and a supercritical carbon dioxide (CO2):methanol (99.5:0.5 v/v) mixture as the mobile phase in isocratic flow [52]. The UPC2/SFC seems to be not only very promising but also a very powerful tool for the separation of T1s and T2s in comparison to other chromatographic techniques. The superficial and limited knowledge about the presence of T1s and T2s is associated with several challenges, including the lack of available standards and very low concentration. CCC is recommended for the enrichment of samples prior to the detection/identification of trace lipid molecules, which are challenging to identify without a sufficient concentration [16,73].
Studies about the determination of ETs are limited due to several reasons: little knowledge about ET presence in nature, inclusion of saponification in protocols (liberation of bound Ts), lack of methodologies/protocols for their extraction from the plant matrix and sufficiently sensitive, selective, specific, and rapid methods of their detection, and, finally, lack of standards. Although esterified tocochromanols were first described in the sixties [53], there are still few reports on this topic, while the literature about their determination without liberating from esterified forms is even more scarce, and all of them are published in the last 7 years with only one exception. Studies on the presence of ETs, tocopheryl esters and their relative abundance (%) in plant material were first conducted in 1994 using a GC-FID and GC-MS system [85]. Tocopheryl esters were identified by MS [85]. The same tools were still used over a decade later in 2016. To determine ETs by GC-FID, the standards of ETs were obtained by esterification with future purification by TLC and the identification by Nuclear Magnetic Resonance (NMR) spectroscopy. The separation of four ETs in heated sunflower oil by GC-FID was completed in 60 min [87]. In 2013, in residues and distillates of structured lipids, the ETs were identified using not only GC-MS in synchronous scan/SIM mode by employing two ionization modes, electron (EI) and chemical (PCI), but also MALDI-TOF-MS to confirm identification [89].
In 2017, ETs were separated from laboratory deodorized vegetable oil and detected not only by GC-FID and GC-MS, but also utilizing a RPLC-UV method for ET determination for the first time. The four ETs were separated by RPLC-UV using a C18 column with isocratic flow of methanol:2-propanol (65:35, v/v) in a 50 min chromatographic run at wavelength 284 nm [88]. The most detailed ET composition thus far was demonstrated in vegetables. For ET identification, standards were synthesized, and a GC-MS system was used in SIM mode for their determination in a 35 min chromatographic run [10,86]. More research is required to better understand the possibility of using techniques other than GC-MS, which presently seems to be the best option due to separation and identification issues.

5. Summary, Future Perspectives and Recommendations

To avoid misinterpretation of the obtained results each analytical technique should be implemented according to the purpose of the study.
Along with β homologues, other less common tocochromanols are generally not analyzed. Rare occurrence and low concentration in plant material is unhelpful for identification and detection, therefore, the suitable tool and protocol development for the determination of minor tocochromanols is required.
It is strongly recommended to use analytical tools that allow to separate the highest number of tocochromanols as possible, especially in investigation of non-reported plant material.
Alkaline hydrolysis (saponification) can be insufficient for the recovery of all tocochromanols in some plant materials, e.g., green coffee beans, while short thermal treatment, for instance, roasting, can cause the release/liberation of bound tocochromanols or formation of non-tocochromanol compounds.
For the analysis of plant material treated at high temperature, for instance, roasted beans and seeds, the application of different separation techniques and/or MS are advised to confirm ambiguous or inconclusive results, e.g., a significant increase in tocochromanols during treatment.
In reversed-phase separations, it is highly recommended to use columns capable of separating β and γ isomers (PFP/F5, C30, RP-amide, PYE and πNAP), especially for plant material which contains both isomers or has not been studied. Methanol and acetonitrile as the RPLC mobile phase do not have sufficient eluting strength to elute PC-8 from the column. Addition of n-hexane to the mobile phase is necessary to elute PC-8, however, it will result in the coelution of major tocochromanols.
Based on several reports, it should be advised to use NP and RP complementarily to provide a “true picture” of the tocochromanol content and profile, especially when results are ambiguous. The complementary use of both techniques could easily prevent serious misinterpretation of the results without using high-cost equipment, e.g., MS detection.
Supercritical fluid chromatography, the latest advancement in alternative tocochromanol analysis techniques, can be considered as a powerful tool for the separation of Ts, T3s and PC-8 as well as the less common T1s and T2s. It allows for the highly efficient, selective and environmentally friendlier separation of tocochromanols due to a combination of LC and GC features with the possibility of adjusting many separation parameters, such as temperature, back pressure, and type of column, allowing to reach NP or RP flow without changing the mobile phase, type of modifier(s), and the possibility of using a gradient both in relation to CO2 and between the mixture of modifiers.
However, the development of proper extraction and identification protocols is required for the determination of free, esterified, and non-extractable tocochromanols. Studies on the application of the alternative extraction and/or sample preparation techniques should be comparative and accompanied by conventional methods, e.g., saponification.
In the last decade, the topic of bound tocochromanols has returned, and more attention is being put on the occurrence of other minor tocochromanols such as T1s and T2s. The most common tool for the determination of these molecules is GC due to improved separation in comparison to LC, while SFC is becoming a good alternative to GC.
Although 100 years have passed since the discovery of the first tocochromanol (α-T, commonly referred to as vitamin E), there are still many unknowns. Modern tool and appropriate protocol application during tocochromanol determination will eliminate information gaps about these bioactive molecules.

Supplementary Materials

The following supporting information can be downloaded at: https://www.mdpi.com/article/10.3390/molecules27196560/s1, Tables S1–S9: α-T, β-T, γ-T, δ-T, α-T3, β-T3, γ-T3, δ-T3, PC-8, respectively (S1 to S9), content [ppm] and its relative amount [%] to other detected tocochromanols in the specified sources; Table S10: Summary of applied NPLC methods for the determination of tocochromanol related compounds; Table S11: Summary of applied RPLC methods for the determination of tocochromanol related compounds; Table S12: Summary of applied SFC methods for the determination of tocochromanol related compounds.

Author Contributions

P.G.: Conceptualization, Visualization, Writing—Original Draft, Writing—Review and Editing; G.B.: Conceptualization, Visualization, Writing—Original Draft, Writing—Review and Editing; A.S.: Visualization, Writing—Review and Editing. All authors have read and agreed to the published version of the manuscript.

Funding

This research was funded by the Latvian Council of Science, project “Dicotyledonous plant families and green tools as a promising alternative approach to increase the accessibility of tocotrienols from unconventional sources”, project No. lzp-2020/1-0422”.

Institutional Review Board Statement

Not applicable.

Informed Consent Statement

Not applicable.

Data Availability Statement

The data used to support the findings of this study are available in Supplementary Material and from the corresponding author upon request.

Conflicts of Interest

The authors declare no conflict of interest.

Abbreviations

APCI, Atmospheric Pressure Chemical Ionization; APPI, Atmospheric Pressure Photoionization; BHT, Butylated Hydroxytoluene; C30, C30 Alkyl Silane; CCC, Countercurrent Chromatography; DAD, Diode-Array Detector; dioxane, 1,4-Dioxane; ECD, Electrochemical Detector; EI, Electron Impact (Ionization); ELSD, Evaporative Light Scattering Detector; ESI, Electrospray Ionization; ETs, Esterified tocochromanols; FLD, Fluorescence detector; GC, Gas Chromatography; LC, Liquid Chromatography; LOD, Limit Of Detection; MDT, Marine-Derived Tocopherol; NPLC, Normal-Phase Liquid Chromatography; PC-8, Plastochromanol-8; PFP, Pentafluorophenyl; RPLC, Reversed-Phase Liquid Chromatography; SFC, Supercritical Fluid Chromatography; SFE, Supercritical Fluid Extraction; Si, Silica; SRM, Single Reaction Monitoring; T, Tocopherol; T1, Tocomonoenol; T2, Tocodienol; T3, Tocotrienol; THF, Tetrahydrofuran; TLC, Thin-Layer Chromatography; TOF, Time-of-Flight; UPC2, Ultra-Performance Convergence Chromatography; α-T-Ac, α-Tocopheryl Acetate; πNAP, Naphthalene.

References

  1. Evans, H.M.; Bishop, K.S. On the existence of a hitherto unrecognized dietary factor essential for reproduction. Science 1922, 56, 650–651. [Google Scholar] [CrossRef] [PubMed] [Green Version]
  2. Emerson, O.H.; Emerson, G.A.; Mohammad, A.; Evans, H.M. The chemistry of vitamin E. Tocopherols from various sources. J. Biol. Chem. 1937, 122, 99–107. [Google Scholar] [CrossRef]
  3. Azzi, A. Tocopherols, tocotrienols and tocomonoenols: Many similar molecules but only one vitamin E. Redox Biol. 2019, 26, 101259. [Google Scholar] [CrossRef] [PubMed]
  4. Shintani, D.; DellaPenna, D. Elevating the vitamin E content of plants through metabolic engineering. Science 1998, 282, 2098–2100. [Google Scholar] [CrossRef] [PubMed]
  5. Szymańska, R.; Kruk, J. Novel and rare prenyllipids—Occurrence and biological activity. Plant Physiol. Biochem. 2018, 122, 1–9. [Google Scholar] [CrossRef] [PubMed]
  6. Peh, H.Y.; Tan, W.S.D.; Liao, W.; Wong, W.S.F. Vitamin E therapy beyond cancer: Tocopherol versus tocotrienol. Pharmacol. Ther. 2016, 162, 152–169. [Google Scholar] [CrossRef]
  7. Aggarwal, B.B.; Sundaram, C.; Prasad, S.; Kannappan, R. Tocotrienols, the vitamin E of the 21st century: Its potential against cancer and other chronic diseases. Biochem. Pharmacol. 2010, 80, 1613–1631. [Google Scholar] [CrossRef] [Green Version]
  8. Ahsan, H.; Ahad, A.; Iqbal, J.; Siddiqui, W.A. Pharmacological potential of tocotrienols: A review. Nutr. Metab. 2014, 11, 1–22. [Google Scholar] [CrossRef] [PubMed] [Green Version]
  9. Yang, C.S.; Luo, P.; Zeng, Z.; Wang, H.; Malafa, M.; Suh, N. Vitamin E and cancer prevention: Studies with different forms of tocopherols and tocotrienols. Mol. Carcinog. 2020, 59, 365–389. [Google Scholar] [CrossRef] [PubMed]
  10. Krauß, S.; Darwisch, V.; Vetter, W. Occurrence of tocopheryl fatty acid esters in vegetables and their non-digestibility by artificial digestion juices. Sci. Rep. 2018, 8, 7657. [Google Scholar] [CrossRef]
  11. Panfili, G.; Fratianni, A.; Irano, M. Normal phase high-performance liquid chromatography method for the determination of tocopherols and tocotrienols in cereals. J. Agric. Food Chem. 2003, 51, 3940–3944. [Google Scholar] [CrossRef] [PubMed]
  12. Baškirovs, G.; Soliven, A.; Górnaś, P. Analytical scale supercritical fluid chromatography for the analysis of nine tocochromanols in 24 different cold-pressed plant oils: Method development, validation, and isolation of tocotrienols and plastochromanol-8. J. Food Compos. Anal. 2022, 110, 104586. [Google Scholar] [CrossRef]
  13. Siger, A.; Kachlicki, P.; Czubiński, J.; Polcyn, D.; Dwiecki, K.; Nogala-Kalucka, M. Isolation and purification of plastochromanol-8 for HPLC quantitative determinations. Eur. J. Lipid Sci. Technol. 2014, 116, 413–422. [Google Scholar] [CrossRef]
  14. Beppu, F.; Gotoh, N. Analysis of minor vitamin E homologues in natural products. J. Berry Res. 2021, 11, 555–566. [Google Scholar] [CrossRef]
  15. Montoya-Arroyo, A.; Lehnert, K.; Lux, P.E.; Jiménez, V.M.; Esquivel, P.; Silva-Benavides, A.M.; Vetter, W.; Frank, J. 11′-α-Tocomonoenol is the major α-tocomonoenol isomer in cyanobacteria and microalgae from Costa Rica. J. Food Compos. Anal. 2022, 107, 104325. [Google Scholar] [CrossRef]
  16. Kröpfl, A.; Nemetz, N.J.; Goncalves Peca, A.; Vetter, W. Countercurrent chromatography isolation of 11′-γ-tocomonoenol from pumpkin seed oil with detection of novel minor tocochromanols. J. Am. Oil Chem. Soc. 2022, 99, 15–26. [Google Scholar] [CrossRef]
  17. Hammann, S.; Kröpfl, A.; Vetter, W. More than 170 polyunsaturated tocopherol-related compounds in a vitamin E capsule: Countercurrent chromatographic enrichment, gas chromatography/mass spectrometry analysis and preliminary identification of the potential artefacts. J. Chromatogr. A 2016, 1476, 77–87. [Google Scholar] [CrossRef] [PubMed]
  18. González, A.; Pablos, F.; Martın, M.; León-Camacho, M.; Valdenebro, M. HPLC analysis of tocopherols and triglycerides in coffee and their use as authentication parameters. Food Chem. 2001, 73, 93–101. [Google Scholar] [CrossRef]
  19. Górnaś, P.; Siger, A.; Pugajeva, I.; Czubinski, J.; Waśkiewicz, A.; Polewski, K. New insights regarding tocopherols in Arabica and Robusta species coffee beans: RP-UPLC-ESI/MSn and NP-HPLC/FLD study. J. Food Compos. Anal. 2014, 36, 117–123. [Google Scholar] [CrossRef]
  20. Kröpfl, A.; Schweizer, S.; Vetter, W. Quantification of tocochromanols in vitamin E dietary supplements by instrumental thin-layer chromatography. Eur. Food Res. Technol. 2022, 248, 1653–1662. [Google Scholar] [CrossRef]
  21. Brandolini, A.; Glorio-Paulet, P.; Estivi, L.; Locatelli, N.; Cordova-Ramos, J.S.; Hidalgo, A. Tocopherols, carotenoids and phenolics changes during Andean lupin (Lupinus mutabilis Sweet) seeds processing. J. Food Compos. Anal. 2022, 106, 104335. [Google Scholar] [CrossRef]
  22. Buddrick, O.; Jones, O.A.; Morrison, P.D.; Small, D.M. Heptane as a less toxic option than hexane for the separation of vitamin E from food products using normal phase HPLC. RSC Adv. 2013, 3, 24063–24068. [Google Scholar] [CrossRef]
  23. Birringer, M.; Siems, K.; Maxones, A.; Frank, J.; Lorkowski, S. Natural 6-hydroxy-chromanols and-chromenols: Structural diversity, biosynthetic pathways and health implications. RSC Adv. 2018, 8, 4803–4841. [Google Scholar] [CrossRef] [Green Version]
  24. Abidi, S.L. Chromatographic analysis of tocol-derived lipid antioxidants. J. Chromatogr. A 2000, 881, 197–216. [Google Scholar] [CrossRef]
  25. Bruno, R.S.; Mah, E. Vitamin E. In Reference Module in Biomedical Sciences, 3rd ed.; Elsevier Inc.: Amsterdam, The Netherlands, 2014. [Google Scholar]
  26. Qureshi, A.A.; Mo, H.; Packer, L.; Peterson, D.M. Isolation and identification of novel tocotrienols from rice bran with hypocholesterolemic, antioxidant, and antitumor properties. J. Agric. Food Chem. 2000, 48, 3130–3140. [Google Scholar] [CrossRef] [PubMed]
  27. Sontag, T.J.; Parker, R.S. Influence of major structural features of tocopherols and tocotrienols on their ω-oxidation by tocopherol-ω-hydroxylase. J. Lipid Res. 2007, 48, 1090–1098. [Google Scholar] [CrossRef] [Green Version]
  28. Cervinkova, B.; Krcmova, L.K.; Klabackova, S.; Solichova, D.; Solich, P. Rapid determination of lipophilic vitamins in human serum by ultra-high performance liquid chromatography using a fluorinated column and high-throughput miniaturized liquid–liquid extraction. J. Sep. Sci. 2017, 40, 3375–3382. [Google Scholar] [CrossRef]
  29. Sanagi, M.M.; See, H.H.; Ibrahim, W.A.W.; Naim, A.A. Separation of tocol–derivatives by elevated temperature normal–phase liquid chromatography. J. Teknol. 2006, 45, 29–40. [Google Scholar] [CrossRef] [Green Version]
  30. Górnaś, P.; Šnē, E.; Siger, A.; Segliņa, D. Sea buckthorn (Hippophae rhamnoides L.) leaves as valuable source of lipophilic antioxidants: The effect of harvest time, sex, drying and extraction methods. Ind. Crops Prod. 2014, 60, 1–7. [Google Scholar] [CrossRef]
  31. Szymańska, R.; Kruk, J. γ-Tocopherol dominates in young leaves of runner bean (Phaseolus coccineus) under a variety of growing conditions: The possible functions of γ-tocopherol. Phytochemistry 2008, 69, 2142–2148. [Google Scholar] [CrossRef]
  32. Wojdyło, A.; Turkiewicz, I.P.; Tkacz, K.; Hernandez, F. Fruit tree leaves as valuable new source of tocopherol and tocotrienol compounds. J. Sci. Food Agric. 2022, 102, 1466–1474. [Google Scholar] [CrossRef] [PubMed]
  33. DellaPenna, D. A decade of progress in understanding vitamin E synthesis in plants. J. Plant Physiol. 2005, 162, 729–737. [Google Scholar] [CrossRef] [PubMed]
  34. Chakradhari, S.; Perkons, I.; Mišina, I.; Sipeniece, E.; Radziejewska-Kubzdela, E.; Grygier, A.; Rudzińska, M.; Patel, K.S.; Radzimirska-Graczyk, M.; Górnaś, P. Profiling of the bioactive components of safflower seeds and seed oil: Cultivated (Carthamus tinctorius L.) vs. wild (Carthamus oxyacantha M. Bieb.). Eur. Food Res. Technol. 2020, 246, 449–459. [Google Scholar] [CrossRef]
  35. Górnaś, P.; Soliven, A.; Segliņa, D. Seed oils recovered from industrial fruit by-products are a rich source of tocopherols and tocotrienols: Rapid separation of α/β/γ/δ homologues by RP-HPLC/FLD. Eur. J. Lipid Sci. Technol. 2015, 117, 773–777. [Google Scholar] [CrossRef]
  36. Gruszka, J.; Kruk, J. RP-LC for determination of plastochromanol, tocotrienols and tocopherols in plant oils. Chromatographia 2007, 66, 909–913. [Google Scholar] [CrossRef]
  37. Trela, A.; Szymańska, R. Less widespread plant oils as a good source of vitamin E. Food Chem. 2019, 296, 160–166. [Google Scholar] [CrossRef] [PubMed]
  38. Górnaś, P.; Rudzińska, M.; Raczyk, M.; Soliven, A. Lipophilic bioactive compounds in the oils recovered from cereal by-products. J. Sci. Food Agric. 2016, 96, 3256–3265. [Google Scholar] [CrossRef]
  39. Alves, R.C.; Casal, S.; Alves, M.R.; Oliveira, M.B. Discrimination between arabica and robusta coffee species on the basis of their tocopherol profiles. Food Chem. 2009, 114, 295–299. [Google Scholar] [CrossRef]
  40. Górnaś, P. Oak Quercus rubra L. and Quercus robur L. acorns as an unconventional source of gamma-and beta-tocopherol. Eur. Food Res. Technol. 2019, 245, 257–261. [Google Scholar] [CrossRef]
  41. Fromm, M.; Bayha, S.; Kammerer, D.R.; Carle, R. Identification and quantitation of carotenoids and tocopherols in seed oils recovered from different rosaceae species. J. Agric. Food Chem. 2012, 60, 10733–10742. [Google Scholar] [CrossRef]
  42. Górnaś, P. Unique variability of tocopherol composition in various seed oils recovered from by-products of apple industry: Rapid and simple determination of all four homologues (α, β, γ and δ) by RP-HPLC/FLD. Food Chem. 2015, 172, 129–134. [Google Scholar] [CrossRef] [PubMed]
  43. Kraujalis, P.; Kraujalienė, V.; Kazernavičiūtė, R.; Venskutonis, P.R. Supercritical carbon dioxide and pressurized liquid extraction of valuable ingredients from Viburnum opulus pomace and berries and evaluation of product characteristics. J. Supercrit. Fluids 2017, 122, 99–108. [Google Scholar] [CrossRef]
  44. Mariod, A.A.; Elkheir, S.; Ahmed, Y.M.; Matthäus, B. Annona squamosa and Catunaregam nilotica seeds, the effect of the extraction method on the oil composition. J. Am. Oil Chem. Soc. 2010, 87, 763–769. [Google Scholar] [CrossRef]
  45. Available online: https://www.food.actapol.net/pub/4_3_2012_err.pdf (accessed on 25 July 2022).
  46. Fabrikov, D.; Guil-Guerrero, J.L.; González-Fernández, M.J.; Rodríguez-García, I.; Gómez-Mercado, F.; Urrestarazu, M.; Lao, M.T.; Rincón-Cervera, M.Á.; Alvaro, J.E.; Lyashenko, S. Borage oil: Tocopherols, sterols and squalene in farmed and endemic-wild Borago species. J. Food Compos. Anal. 2019, 83, 103299. [Google Scholar] [CrossRef]
  47. Siger, A.; Dwiecki, K.; Borzyszkowski, W.; Turski, M.; Rudzińska, M.; Nogala-Kałucka, M. Physicochemical characteristics of the cold-pressed oil obtained from seeds of Fagus sylvatica L. Food Chem. 2017, 225, 239–245. [Google Scholar] [CrossRef] [PubMed]
  48. Horvath, G.; Wessjohann, L.; Bigirimana, J.; Jansen, M.; Guisez, Y.; Caubergs, R.; Horemans, N. Differential distribution of tocopherols and tocotrienols in photosynthetic and non-photosynthetic tissues. Phytochemistry 2006, 67, 1185–1195. [Google Scholar] [CrossRef]
  49. Bagci, E. Fatty acids and tocochromanol patterns of some Turkish Apiaceae (Umbelliferae) plants; a chemotaxonomic approach. Acta Bot. Gall. 2007, 154, 143–151. [Google Scholar] [CrossRef]
  50. Ivanov, S.A.; Aitzetmüller, K. Untersuchungen über die Tocopherol-und Tocotrienolzusammensetzung der Samenöle einiger Vertreter der Familie Apiaceae. Lipid/Fett 1995, 97, 24–29. [Google Scholar] [CrossRef]
  51. Ramadan, M.F. Healthy blends of high linoleic sunflower oil with selected cold pressed oils: Functionality, stability and antioxidative characteristics. Ind. Crops Prod. 2013, 43, 65–72. [Google Scholar] [CrossRef]
  52. Gee, P.T.; Liew, C.Y.; Thong, M.C.; Gay, M.C.L. Vitamin E analysis by ultra-performance convergence chromatography and structural elucidation of novel α-tocodienol by high-resolution mass spectrometry. Food Chem. 2016, 196, 367–373. [Google Scholar] [CrossRef]
  53. Dunphy, P.J.; Whittle, K.J.; Pennock, J.F.; Morton, R.A. Identification and estimation of tocotrienols in Hevea latex. Nature 1965, 207, 521–522. [Google Scholar] [CrossRef]
  54. Zabot, G.L.; Moraes, M.N.; Meireles, M. Process integration for producing tocotrienols-rich oil and bixin-rich extract from annatto seeds: A techno-economic approach. Food Bioprod. Process. 2018, 109, 122–138. [Google Scholar] [CrossRef]
  55. Nehdi, I.A. Characteristics and composition of Washingtonia filifera (Linden ex André) H. Wendl. seed and seed oil. Food Chem. 2011, 126, 197–202. [Google Scholar] [CrossRef]
  56. Yang, B.; Ahotupa, M.; Määttä, P.; Kallio, H. Composition and antioxidative activities of supercritical CO2-extracted oils from seeds and soft parts of northern berries. Food Res. Int. 2011, 44, 2009–2017. [Google Scholar] [CrossRef]
  57. Fernandes, L.; Casal, S.; Cruz, R.; Pereira, J.A.; Ramalhosa, E. Seed oils of ten traditional Portuguese grape varieties with interesting chemical and antioxidant properties. Food Res. Int. 2013, 50, 161–166. [Google Scholar] [CrossRef]
  58. Shiozaki, S.; Murakami, K. Lipids in the seeds of wild grapes native to Japan: Vitis coignetiae and Vitis ficifolia var. ganebu. Sci. Hortic. 2016, 201, 124–129. [Google Scholar] [CrossRef]
  59. Górnaś, P.; Rudzińska, M.; Grygier, A.; Lācis, G. Diversity of oil yield, fatty acids, tocopherols, tocotrienols, and sterols in the seeds of 19 interspecific grapes crosses. J. Sci. Food Agric. 2019, 99, 2078–2087. [Google Scholar] [CrossRef]
  60. Horvath, G.; Wessjohann, L.; Bigirimana, J.; Monica, H.; Jansen, M.; Guisez, Y.; Caubergs, R.; Horemans, N. Accumulation of tocopherols and tocotrienols during seed development of grape (Vitis vinifera L. cv. Albert Lavallée). Plant Physiol. Biochem. 2006, 44, 724–731. [Google Scholar] [CrossRef] [Green Version]
  61. Górnaś, P.; Šnē, E.; Siger, A.; Segliņa, D. Sea buckthorn (Hippophae rhamnoides L.) vegetative parts as an unconventional source of lipophilic antioxidants. Saudi J. Biol. Sci. 2016, 23, 512–516. [Google Scholar] [CrossRef] [Green Version]
  62. Sipeniece, E.; Mišina, I.; Grygier, A.; Qian, Y.; Rudzińska, M.; Kaufmane, E.; Segliņa, D.; Siger, A.; Górnaś, P. Impact of the harvest year of three cultivars of Japanese quince (Chaenomeles japonica) on the oil content and its composition. Sci. Hortic. 2021, 275, 109683. [Google Scholar] [CrossRef]
  63. Matthäus, B.; Vosmann, K.; Pham, L.Q.; Aitzetmüller, K. FA and tocopherol composition of Vietnamese oilseeds. J. Am. Oil Chem. Soc. 2003, 80, 1013–1020. [Google Scholar] [CrossRef]
  64. Whittle, K.J.; Dunphy, P.J.; Pennock, J.F. Plastochromanol in the leaves of Hevea brasiliensis. Biochem. J. 1965, 96, 17C–19C. [Google Scholar] [CrossRef] [PubMed] [Green Version]
  65. Kruk, J.; Szymańska, R.; Cela, J.; Munne-Bosch, S. Plastochromanol-8: Fifty years of research. Phytochemistry 2014, 108, 9–16. [Google Scholar] [CrossRef] [PubMed]
  66. Nogala-Kalucka, M.; Gogolewski, M.; Musnicki, C. Changes of tocopherol and plastochromanol-8 contents during growth of the spring oilseed rape plant [Brassica napus L.]. Oilseed Crops 2002, 23, 157–164. [Google Scholar]
  67. Fleta-Soriano, E.; Munné-Bosch, S. Enhanced plastochromanol-8 accumulation during reiterated drought in maize (Zea mays L.). Plant Physiol. Biochem. 2017, 112, 283–289. [Google Scholar] [CrossRef]
  68. Szymańska, R.; Kruk, J. Identification of hydroxy-plastochromanol in Arabidopsis leaves. Acta Biochim. Pol. 2010, 57, 105–108. [Google Scholar] [CrossRef] [Green Version]
  69. Matsumoto, A.; Takahashi, S.; Nakano, K.; Kijima, S. Identification of new vitamin E in plant oil. J. Jpn. Oil Chem. Soc. 1995, 44, 593–597. [Google Scholar] [CrossRef] [Green Version]
  70. Yamamoto, Y.; Maita, N.; Fujisawa, A.; Takashima, J.; Ishii, Y.; Dunlap, W.C. A new vitamin E (α-tocomonoenol) from eggs of the pacific salmon Oncorhynchus keta. J. Nat. Prod. 1999, 62, 1685–1687. [Google Scholar] [CrossRef]
  71. Dunlap, W.C.; Fujisawa, A.; Yamamoto, Y.; Moylan, T.J.; Sidell, B.D. Notothenioid fish, krill and phytoplankton from Antarctica contain a vitamin E constituent (α-tocomonoenol) functionally associated with cold-water adaptation. Comp. Biochem. Physiol. Part B: Biochem. Mol. Biol. 2002, 133, 299–305. [Google Scholar] [CrossRef]
  72. Ng, M.H.; Choo, Y.M.; Ma, A.N.; Chuah, C.H.; Hashim, M.A. Separation of vitamin E (tocopherol, tocotrienol, and tocomonoenol) in palm oil. Lipids 2004, 39, 1031–1035. [Google Scholar] [CrossRef]
  73. Müller, M.; Kröpfl, A.; Vetter, W. Identification of two α-tocodienol isomers in palm oil after countercurrent chromatographic enrichment. Anal. Bioanal. Chem. 2020, 412, 795–802. [Google Scholar] [CrossRef]
  74. Kruk, J.; Pisarski, A.; Szymańska, R. Novel vitamin E forms in leaves of Kalanchoe daigremontiana and Phaseolus coccineus. J. Plant Physiol. 2011, 168, 2021–2027. [Google Scholar] [CrossRef] [PubMed]
  75. Fiorentino, A.; Mastellone, C.; D’Abrosca, B.; Pacifico, S.; Scognamiglio, M.; Cefarelli, G.; Caputo, R.; Monaco, P. δ-Tocomonoenol: A new vitamin E from kiwi (Actinidia chinensis) fruits. Food Chem. 2009, 115, 187–192. [Google Scholar] [CrossRef]
  76. Mariani, C.; Bellan, G. Content of tocopherols, deidrotocopherols, tocodienols, tocotrienols in vegetable oils. Riv. Ital. Sostanze Grasse 1996, 73, 533–543. [Google Scholar]
  77. Liu, X.; Gujarathi, S.; Zhang, X.; Shao, L.; Boerma, M.; Compadre, C.M.; Crooks, P.A.; Hauer-Jensen, M.; Zhou, D.; Zheng, G. Synthesis of (2R, 8′ S, 3′ E)-δ-tocodienol, a tocoflexol family member designed to have a superior pharmacokinetic profile compared to δ-tocotrienol. Tetrahedron 2016, 72, 4001–4006. [Google Scholar] [CrossRef] [PubMed] [Green Version]
  78. Compadre, C.M.; Singh, A.; Thakkar, S.; Zheng, G.; Breen, P.J.; Ghosh, S.; Kiaei, M.; Boerma, M.; Varughese, K.I.; Hauer-Jensen, M. Molecular dynamics guided design of tocoflexol: A new radioprotectant tocotrienol with enhanced bioavailability. Drug Dev. Res. 2014, 75, 10–22. [Google Scholar] [CrossRef] [Green Version]
  79. Baxter, J.G.; Robeson, C.D.; Taylor, J.D.; Lehman, R.W. Natural α-, β-and γ-tocopherols and certain esters of physiological interest. J. Am. Chem. Soc. 1943, 65, 918–924. [Google Scholar] [CrossRef]
  80. Zingg, J.-M. Water-Soluble Vitamin E—Tocopheryl Phosphate. Adv. Food Nutr. Res. 2018, 83, 311–363. [Google Scholar]
  81. Kato, A.; Tanabe, K.; Yamaoka, M. Esterified tocopherols and tocotrienols in rice bran oil, soybean oil, and sesame oil. J. Jpn. Oil Chem. Soc. 1981, 30, 515–516. [Google Scholar] [CrossRef] [Green Version]
  82. Kato, A.; Gapor, A.; Tanabe, K.; Yamaoka, M.; Mamuro, H. Esterified a-tocopherol and tocotrienols in palm oils. J. Jpn. Oil Chem. Soc. 1981, 30, 590–591. [Google Scholar] [CrossRef]
  83. Olejnik, D. The occurrence of free and bounded forms of tocopherols in certain oil seeds. Rocz. Technol. Chem. Żywn. 1972, 22, 15–23. [Google Scholar]
  84. Ciemniewska-Żytkiewicz, H.; Verardo, V.; Pasini, F.; Bryś, J.; Koczoń, P.; Caboni, M.F. Determination of lipid and phenolic fraction in two hazelnut (Corylus avellana L.) cultivars grown in Poland. Food Chem. 2015, 168, 615–622. [Google Scholar] [CrossRef] [PubMed]
  85. Klink, G.; Buchs, A.; Gülacar, F.O. Tocopheryl esters from Nymphea alba and Nuphar luteum. Phytochemistry 1994, 36, 813–814. [Google Scholar] [CrossRef]
  86. Krauß, S.; Hermann-Ene, V.; Vetter, W. Fate of free and bound phytol and tocopherols during fruit ripening of two Capsicum cultivars. Sci. Rep. 2020, 10, 1–13. [Google Scholar] [CrossRef] [PubMed]
  87. Kreps, F.; Kyselka, J.; Burčová, Z.; Schmidt, Š.; Filip, V.; Dubaj, T.; Gajdoš, P.; Čertík, M. Synthesis and analysis of tocopheryl quinone and tocopherol esters with fatty acids in heated sunflower oil. Eur. J. Lipid Sci. Technol. 2016, 118, 788–802. [Google Scholar] [CrossRef]
  88. Kreps, F.; Kyselka, J.; Burčová, Z.; Schmidt, Š.; Rajchl, A.; Filip, V.; Ház, A.; Jablonský, M.; Sládková, A.; Šurina, I. Influence of deodorization temperature on formation of tocopherol esters and fatty acids polymers in vegetable oil. Eur. J. Lipid Sci. Technol. 2017, 119, 1600027. [Google Scholar] [CrossRef]
  89. Zou, L.; Akoh, C.C. Identification of tocopherols, tocotrienols, and their fatty acid esters in residues and distillates of structured lipids purified by short-path distillation. J. Agric. Food Chem. 2013, 61, 238–246. [Google Scholar] [CrossRef]
  90. Shimoda, K.; Kondo, Y.; Akagi, M.; Abe, K.; Hamada, H.; Hamada, H. Glycosylation of tocopherols by cultured cells of Eucalyptus perriniana. Phytochemistry 2007, 68, 2678–2683. [Google Scholar] [CrossRef]
  91. Górnaś, P.; Siger, A.; Czubinski, J.; Dwiecki, K.; Segliņa, D.; Nogala-Kalucka, M. An alternative RP-HPLC method for the separation and determination of tocopherol and tocotrienol homologues as butter authenticity markers: A comparative study between two European countries. Eur. J. Lipid Sci. Technol. 2014, 116, 895–903. [Google Scholar] [CrossRef]
  92. Górnaś, P.; Siger, A. Simplified sample preparation and rapid detection by RP-HPLC/FLD of tocopherols and tocotrienols in margarines: Preliminary screening of plant fats—Potential quality markers. Eur. J. Lipid Sci. Technol. 2015, 117, 1589–1597. [Google Scholar] [CrossRef]
  93. Górnaś, P.; Siger, A.; Juhņeviča, K.; Lācis, G.; Šnē, E.; Segliņa, D. Cold-pressed Japanese quince (Chaenomeles japonica (Thunb.) Lindl. ex Spach) seed oil as a rich source of α-tocopherol, carotenoids and phenolics: A comparison of the composition and antioxidant activity with nine other plant oils. Eur. J. Lipid Sci. Technol. 2014, 116, 563–570. [Google Scholar] [CrossRef]
  94. Méjean, M.; Brunelle, A.; Touboul, D. Quantification of tocopherols and tocotrienols in soybean oil by supercritical-fluid chromatography coupled to high-resolution mass spectrometry. Anal. Bioanal. Chem. 2015, 407, 5133–5142. [Google Scholar] [CrossRef] [PubMed]
  95. Puspitasari-Nienaber, N.L.; Ferruzzi, M.G.; Schwartz, S.J. Simultaneous detection of tocopherols, carotenoids, and chlorophylls in vegetable oils by direct injection C30 RP-HPLC with coulometric electrochemical array detection. J. Am. Oil Chem. Soc. 2002, 79, 633–640. [Google Scholar] [CrossRef]
  96. Ansolin, M.; de Souza, P.T.; de Almeida Meirelles, A.J.; Batista, E.A.C. Tocopherols and tocotrienols: An adapted methodology by UHPLC/MS without sample pretreatment steps. Food Anal. Methods 2017, 10, 2165–2174. [Google Scholar] [CrossRef]
  97. Kalogeropoulos, N.; Chiou, A.; Ioannou, M.; Karathanos, V.T.; Hassapidou, M.; Andrikopoulos, N.K. Nutritional evaluation and bioactive microconstituents (phytosterols, tocopherols, polyphenols, triterpenic acids) in cooked dry legumes usually consumed in the Mediterranean countries. Food Chem. 2010, 121, 682–690. [Google Scholar] [CrossRef]
  98. Lee, H.W.; Zhang, H.; Liang, X.; Ong, C.N. Simultaneous determination of carotenoids, tocopherols and phylloquinone in 12 Brassicaceae vegetables. LWT-Food Sci. Technol. 2020, 130, 109649. [Google Scholar] [CrossRef]
  99. Lee, H.W.; Bi, X.; Henry, C.J. Carotenoids, tocopherols and phylloquinone content of 26 green leafy vegetables commonly consumed in Southeast Asia. Food Chem. 2022, 385, 132729. [Google Scholar]
  100. Saini, R.K.; Keum, Y.-S. Tocopherols and tocotrienols in plants and their products: A review on methods of extraction, chromatographic separation, and detection. Food Res. Int. 2016, 82, 59–70. [Google Scholar] [CrossRef]
  101. Knecht, K.; Sandfuchs, K.; Kulling, S.E.; Bunzel, D. Tocopherol and tocotrienol analysis in raw and cooked vegetables: A validated method with emphasis on sample preparation. Food Chem. 2015, 169, 20–27. [Google Scholar] [CrossRef]
  102. Ryynänen, M.; Lampi, A.-M.; Salo-Väänänen, P.; Ollilainen, V.; Piironen, V. A small-scale sample preparation method with HPLC analysis for determination of tocopherols and tocotrienols in cereals. J. Food Compos. Anal. 2004, 17, 749–765. [Google Scholar] [CrossRef]
  103. Górnaś, P.; Pugajeva, I.; Segliņa, D. Seeds recovered from by-products of selected fruit processing as a rich source of tocochromanols: RP-HPLC/FLD and RP-UPLC-ESI/MSn study. Eur. Food Res. Technol. 2014, 239, 519–524. [Google Scholar] [CrossRef]
  104. Zhang, L.; Wang, S.; Yang, R.; Mao, J.; Jiang, J.; Wang, X.; Zhang, W.; Zhang, Q.; Li, P. Simultaneous determination of tocopherols, carotenoids and phytosterols in edible vegetable oil by ultrasound-assisted saponification, LLE and LC-MS/MS. Food Chem. 2019, 289, 313–319. [Google Scholar] [CrossRef] [PubMed]
  105. Souza, A.H.P.; Gohara, A.K.; Rodrigues, Â.C.; Ströher, G.L.; Silva, D.C.; Visentainer, J.V.; Souza, N.E.; Matsushita, M. Optimization conditions of samples saponification for tocopherol analysis. Food Chem. 2014, 158, 315–318. [Google Scholar] [CrossRef] [PubMed] [Green Version]
  106. Piironen, V.; Syvaoja, E.L.; Varo, P.; Salminen, K.; Koivistoinen, P. Tocopherols and tocotrienols in cereal products from Finland. Cereal Chem. 1986, 63, 78–81. [Google Scholar]
  107. Pereira, M.G.; Hamerski, F.; Andrade, E.F.; Scheer, A.d.P.; Corazza, M.L. Assessment of subcritical propane, ultrasound-assisted and Soxhlet extraction of oil from sweet passion fruit (Passiflora alata Curtis) seeds. J. Supercrit. Fluids 2017, 128, 338–348. [Google Scholar] [CrossRef]
  108. Fratianni, A.; Caboni, M.; Irano, M.; Panfili, G. A critical comparison between traditional methods and supercritical carbon dioxide extraction for the determination of tocochromanols in cereals. Eur. Food Res. Technol. 2002, 215, 353–358. [Google Scholar] [CrossRef]
  109. Górnaś, P.; Siger, A.; Rudzińska, M.; Grygier, A.; Marszałkiewicz, S.; Ying, Q.; Sobieszczańska, N.; Segliņa, D. Impact of the extraction technique and genotype on the oil yield and composition of lipophilic compounds in the oil recovered from Japanese quince (Chaenomeles japonica) seeds. Eur. J. Lipid Sci. Technol. 2019, 121, 1800262. [Google Scholar] [CrossRef] [Green Version]
  110. Xiao, X.-H.; Wang, J.-X.; Wang, G.; Wang, J.-Y.; Li, G.-K. Evaluation of vacuum microwave-assisted extraction technique for the extraction of antioxidants from plant samples. J. Chromatogr. A 2009, 1216, 8867–8873. [Google Scholar] [CrossRef]
  111. Vafaei, N.; Rempel, C.B.; Scanlon, M.G.; Jones, P.J.H.; Eskin, M.N.A. Application of supercritical fluid extraction (SFE) of tocopherols and carotenoids (hydrophobic antioxidants) compared to non-SFE methods. AppliedChem 2022, 2, 68–92. [Google Scholar] [CrossRef]
  112. Pérez-Jiménez, J.; Saura-Calixto, F. Fruit peels as sources of non-extractable polyphenols or macromolecular antioxidants: Analysis and nutritional implications. Food Res. Int. 2018, 111, 148–152. [Google Scholar] [CrossRef]
  113. Domínguez-Rodríguez, G.; Marina, M.L.; Plaza, M. Enzyme-assisted extraction of bioactive non-extractable polyphenols from sweet cherry (Prunus avium L.) pomace. Food Chem. 2021, 339, 128086. [Google Scholar] [CrossRef] [PubMed]
  114. Sun, S.; Huang, S.; Shi, Y.; Shao, Y.; Qiu, J.; Sedjoah, R.-C.A.-A.; Yan, Z.; Ding, L.; Zou, D.; Xin, Z. Extraction, isolation, characterization and antimicrobial activities of non-extractable polyphenols from pomegranate peel. Food Chem. 2021, 351, 129232. [Google Scholar] [CrossRef] [PubMed]
  115. Reynoso-Camacho, R.; Sotelo-González, A.M.; Patiño-Ortiz, P.; Rocha-Guzmán, N.E.; Pérez-Ramírez, I.F. Berry by-products obtained from a decoction process are a rich source of low-and high-molecular weight extractable and non-extractable polyphenols. Food Bioprod. Process. 2021, 127, 371–387. [Google Scholar] [CrossRef]
  116. Domínguez-Rodríguez, G.; Plaza, M.; Marina, M.L. High-performance thin-layer chromatography and direct analysis in real time-high resolution mass spectrometry of non-extractable polyphenols from tropical fruit peels. Food Res. Int. 2021, 147, 110455. [Google Scholar] [CrossRef] [PubMed]
  117. Domínguez-Rodríguez, G.; Marina, M.L.; Plaza, M. Rapid fingerprinting of extractable and non-extractable polyphenols from tropical fruit peels using direct analysis in real time coupled to orbitrap mass spectrometry. Food Chem. 2022, 371, 131191. [Google Scholar] [CrossRef]
  118. Domínguez-Rodríguez, G.; Marina, M.L.; Plaza, M. Strategies for the extraction and analysis of non-extractable polyphenols from plants. J. Chromatogr. A 2017, 1514, 1–15. [Google Scholar] [CrossRef]
  119. Shahidi, F.; De Camargo, A.C. Tocopherols and tocotrienols in common and emerging dietary sources: Occurrence, applications, and health benefits. Int. J. Mol. Sci. 2016, 17, 1745. [Google Scholar] [CrossRef]
  120. Shrestha, K.; Gemechu, F.G.; De Meulenaer, B. A novel insight on the high oxidative stability of roasted mustard seed oil in relation to phospholipid, Maillard type reaction products, tocopherol and canolol contents. Food Res. Int. 2013, 54, 587–594. [Google Scholar] [CrossRef]
  121. Murkovic, M.; Piironen, V.; Lampi, A.M.; Kraushofer, T.; Sontag, G. Changes in chemical composition of pumpkin seeds during the roasting process for production of pumpkin seed oil (Part 1: Non-volatile compounds). Food Chem. 2004, 84, 359–365. [Google Scholar] [CrossRef]
  122. Siger, A.; Kaczmarek, A.; Rudzińska, M. Antioxidant activity and phytochemical content of cold-pressed rapeseed oil obtained from roasted seeds. Eur. J. Lipid Sci. Technol. 2015, 117, 1225–1237. [Google Scholar] [CrossRef]
  123. Sánchez, R.J.; Mateo, C.M.; Fernández, M.B.; Nolasco, S.M. Bidimensional modeling applied to oil extraction kinetics of microwave-pretreated canola seeds. J. Food Eng. 2017, 192, 28–35. [Google Scholar] [CrossRef]
  124. Shrestha, K.; De Meulenaer, B. Effect of seed roasting on canolol, tocopherol, and phospholipid contents, Maillard type reactions, and oxidative stability of mustard and rapeseed oils. J. Agric. Food Chem. 2014, 62, 5412–5419. [Google Scholar] [CrossRef] [PubMed]
  125. Eitenmiller, R.; Lee, J. Vitamin E: Food Chemistry, Composition, and Analysis; Marcel Dekker Inc.: New York, NY, USA, 2004. [Google Scholar]
  126. Dawson, R.M.C.; Elliott, D.C.; Elliott, W.H.; Jones, K.M. Data for Biochemical Research; Clarendon Press: Oxford, UK, 2002. [Google Scholar]
  127. Saito, M.; Yamauchi, Y. Isolation of tocopherols from wheat germ oil by recycle semi-preparative supercritical fluid chromatography. J. Chromatogr. A 1990, 505, 257–271. [Google Scholar] [CrossRef]
  128. Wan, J.; Zhang, W.; Jiang, B.; Guo, Y.; Hu, C. Separation of individual tocopherols from soybean distillate by low pressure column chromatography. J. Am. Oil Chem. Soc. 2008, 85, 331–338. [Google Scholar] [CrossRef]
  129. Gruszka, J.; Pawlak, A.; Kruk, J. Tocochromanols, plastoquinol, and other biological prenyllipids as singlet oxygen quenchers—Determination of singlet oxygen quenching rate constants and oxidation products. Free Radic. Biol. Med. 2008, 45, 920–928. [Google Scholar] [CrossRef]
  130. Gotoh, N.; Watanabe, H.; Oka, T.; Mashimo, D.; Noguchi, N.; Hata, K.; Wada, S. Dietary marine-derived tocopherol has a higher biological availability in mice relative to alpha-tocopherol. Lipids 2009, 44, 133–143. [Google Scholar] [CrossRef]
  131. Beppu, F.; Sakuma, A.; Kasatani, S.; Aoki, Y.; Gotoh, N. Application of partial hydrogenation for the generation of minor tocochromanol homologs and functional evaluation of hydrogenated tocotrienol-rich vitamin E oil in diabetic obese mice. J. Oleo Sci. 2021, 70, 103–112. [Google Scholar] [CrossRef]
  132. Büsing, A.; Ternes, W. Separation of α-tocotrienol oxidation products and eight tocochromanols by HPLC with DAD and fluorescence detection and identification of unknown peaks by DAD, PBI-EIMS, FTIR, and NMR. Anal. Bioanal. Chem. 2011, 401, 2843–2854. [Google Scholar] [CrossRef]
  133. Van Niekerk, P.J. The direct determination of free tocopherols in plant oils by liquid-solid chromatography. Anal. Biochem. 1973, 52, 533–537. [Google Scholar] [CrossRef]
  134. Kamal-Eldin, A.; Görgen, S.; Pettersson, J.; Lampi, A.-M. Normal-phase high-performance liquid chromatography of tocopherols and tocotrienols: Comparison of different chromatographic columns. J. Chromatogr. A 2000, 881, 217–227. [Google Scholar] [CrossRef]
  135. Abidi, S.L.; Mounts, T.L. Normal phase high-performance liquid chromatography of tocopherols on polar phases. J. Liq. Chromatogr. Relat. Technol. 1996, 19, 509–520. [Google Scholar] [CrossRef]
  136. Balz, M.K.; Schulte, E.; Thier, H.P. Simultaneous determination of α-tocopheryl acetate, tocopherols and tocotrienols by HPLC with fluorescence detection in foods. Lipid/Fett 1993, 95, 215–220. [Google Scholar] [CrossRef]
  137. Xu, Z. Analysis of tocopherols and tocotrienols. Curr. Protoc. Food Anal. Chem. 2002, 4, D1.5.1–D1.5.12. [Google Scholar] [CrossRef]
  138. Matthaus, B.; Özcan, M.M. Chemical evaluation of citrus seeds, an agro-industrial waste, as a new potential source of vegetable oils. Grasas Aceites 2012, 63, 313–320. [Google Scholar] [CrossRef]
  139. Siger, A.; Michalak, M.; Cegielska-Taras, T.; Szała, L.; Lembicz, J.; Nogala-Kałucka, M. Genotype and environment effects on tocopherol and plastochromanol-8 contents of winter oilseed rape doubled haploid lines derived from F1 plants of the cross between yellow and black seeds. Ind. Crops Prod. 2015, 65, 134–141. [Google Scholar] [CrossRef]
  140. Grebenstein, N.; Frank, J. Rapid baseline-separation of all eight tocopherols and tocotrienols by reversed-phase liquid-chromatography with a solid-core pentafluorophenyl column and their sensitive quantification in plasma and liver. J. Chromatogr. A 2012, 1243, 39–46. [Google Scholar] [CrossRef]
  141. Rimmer, C.A.; Putzbach, K.; Sharpless, K.E.; Sander, L.C.; Yen, J.H. Preparation and certification of standard reference material 3278 tocopherols in edible oils. J. Agric. Food Chem. 2012, 60, 6794–6798. [Google Scholar] [CrossRef]
  142. Irías-Mata, A.; Stuetz, W.; Sus, N.; Hammann, S.; Gralla, K.; Cordero-Solano, A.; Vetter, W.; Frank, J. Tocopherols, tocomonoenols, and tocotrienols in oils of costa rican palm fruits: A comparison between six varieties and chemical versus mechanical extraction. J. Agric. Food Chem. 2017, 65, 7476–7482. [Google Scholar] [CrossRef]
  143. Strohschein, S.; Pursch, M.; Lubda, D.; Albert, K. Shape selectivity of C30 phases for RP-HPLC separation of tocopherol isomers and correlation with MAS NMR data from suspended stationary phases. Anal. Chem. 1998, 70, 13–18. [Google Scholar] [CrossRef]
  144. Urvaka, E.; Mišina, I.; Soliven, A.; Górnaś, P. Rapid separation of all four tocopherol homologues in selected fruit seeds via supercritical fluid chromatography using a solid-core C18 column. J. Chem. 2019, 2019, 5307340. [Google Scholar] [CrossRef]
  145. Tan, B.; Brzuskiewicz, L. Separation of tocopherol and tocotrienol isomers using normal-and reverse-phase liquid chromatography. Anal. Biochem. 1989, 180, 368–373. [Google Scholar] [CrossRef]
  146. Irakli, M.N.; Samanidou, V.F.; Papadoyannis, I.N. Development and validation of an HPLC method for the simultaneous determination of tocopherols, tocotrienols and carotenoids in cereals after solid-phase extraction. J. Sep. Sci. 2011, 34, 1375–1382. [Google Scholar] [CrossRef] [PubMed]
  147. Irakli, M.N.; Samanidou, V.F.; Papadoyannis, I.N. Optimization and validation of the reversed-phase high-performance liquid chromatography with fluorescence detection method for the separation of tocopherol and tocotrienol isomers in cereals, employing a novel sorbent material. J. Agric. Food Chem. 2012, 60, 2076–2082. [Google Scholar] [CrossRef] [PubMed]
  148. Xie, Q.; Xia, M.; Sun, D.; Cao, J.; Xiao, Y.; Lin, M.; Hou, B.; Jia, L.; Li, D. Deep eutectic solvent-based liquid-phase microextraction coupled with reversed-phase high-performance liquid chromatography for determination of α-, β-, γ-, and δ-tocopherol in edible oils. Anal. Bioanal. Chem. 2021, 413, 577–584. [Google Scholar] [CrossRef] [PubMed]
  149. Lucchetti, S.; Ambra, R.; Pastore, G. Effects of peeling and/or toasting on the presence of tocopherols and phenolic compounds in four Italian hazelnut cultivars. Eur. Food Res. Technol. 2018, 244, 1057–1064. [Google Scholar] [CrossRef]
  150. Górnaś, P. Optimizing the Separation of Four Tocopherols and Four Tocotrienols via RP-HPLC by Screening Five Different SPP Phases. Available online: https://resources.perkinelmer.com/lab-solutions/resources/docs/ABR_Optimizing-the-Separation-of-FourTocopherols-and-FourTocotrienols-via-RP-HPLC.pdf (accessed on 8 May 2022).
  151. Richheimer, S.L.; Kent, M.C.; Bernart, M.W. Reversed-phase high-performance liquid chromatographic method using a pentafluorophenyl bonded phase for analysis of tocopherols. J. Chromatogr. A 1994, 677, 75–80. [Google Scholar] [CrossRef]
  152. Ashu-Arrah, B.A.; Glennon, J.D.; Albert, K. Synthesis, characterisation and chromatographic evaluation of pentafluorophenyl and phenyl bonded silica phases prepared using supercritical carbon dioxide as a reaction solvent. J. Chromatogr. A 2013, 1273, 34–43. [Google Scholar] [CrossRef]
  153. Martinis, J.; Kessler, F.; Glauser, G. A novel method for prenylquinone profiling in plant tissues by ultra-high pressure liquid chromatography-mass spectrometry. Plant Methods 2011, 7, 23. [Google Scholar] [CrossRef] [Green Version]
  154. Tsochatzis, E.D.; Bladenopoulos, K.; Papageorgiou, M. Determination of tocopherol and tocotrienol content of Greek barley varieties under conventional and organic cultivation techniques using validated reverse phase high-performance liquid chromatography method. J. Sci. Food Agric. 2012, 92, 1732–1739. [Google Scholar] [CrossRef]
  155. Saha, S.; Walia, S.; Sharma, K.; Banerjee, K. Suitability of stationary phase for LC analysis of biomolecules. Crit. Rev. Food Sci. Nutr. 2020, 60, 2856–2873. [Google Scholar] [CrossRef]
  156. Segliņa, D.; Krasnova, I.; Grygier, A.; Radziejewska-Kubzdela, E.; Rudzińska, M.; Górnaś, P. Unique bioactive molecule composition of sea buckthorn (Hippophae rhamnoides L.) oils obtained from the peel, pulp, and seeds via physical “solvent-free” approaches. J. Am. Oil Chem. Soc. 2021, 98, 1009–1020. [Google Scholar] [CrossRef]
  157. Zhou, K.; Yin, J.-J.; Yu, L. Phenolic acid, tocopherol and carotenoid compositions, and antioxidant functions of hard red winter wheat bran. J. Agric. Food Chem. 2005, 53, 3916–3922. [Google Scholar] [CrossRef] [PubMed]
  158. Górnaś, P.; Radenkovs, V.; Pugajeva, I.; Soliven, A.; Needs, P.W.; Kroon, P.A. Varied composition of tocochromanols in different types of bran: Rye, wheat, oat, spelt, buckwheat, corn, and rice. Int. J. Food Prop. 2016, 19, 1757–1764. [Google Scholar] [CrossRef] [Green Version]
  159. Chen, H.; Angiuli, M.; Ferrari, C.; Tombari, E.; Salvetti, G.; Bramanti, E. Tocopherol speciation as first screening for the assessment of extra virgin olive oil quality by reversed-phase high-performance liquid chromatography/fluorescence detector. Food Chem. 2011, 125, 1423–1429. [Google Scholar] [CrossRef]
  160. Colombo, M.L.; Marangon, K.; Bugatti, C. CoulArray® electrochemical evaluation of tocopherol and tocotrienol isomers in barley, oat and spelt grains. Nat. Prod. Commun. 2009, 4, 251–254. [Google Scholar] [CrossRef] [PubMed] [Green Version]
  161. Sarzanini, C.; Mentasti, E.; Vincenti, M.; Nerva, M.; Gaido, F. Determination of plasma tocopherols by high-performance liquid chromatography with coulometric detection. J. Chromatogr. B Biomed. Sci. Appl. 1993, 620, 268–272. [Google Scholar] [CrossRef]
  162. Cunha, S.C.; Amaral, J.S.; Fernandes, J.O.; Oliveira, M.B.P.P. Quantification of tocopherols and tocotrienols in Portuguese olive oils using HPLC with three different detection systems. J. Agric. Food Chem. 2006, 54, 3351–3356. [Google Scholar] [CrossRef]
  163. Ruperez, F.J.; Martın, D.; Herrera, E.; Barbas, C. Chromatographic analysis of α-tocopherol and related compounds in various matrices. J. Chromatogr. A 2001, 935, 45–69. [Google Scholar] [CrossRef]
  164. Leray, C.; Andriamampandry, M.; Gutbier, G.; Cavadenti, J.; Klein-Soyer, C.; Gachet, C.; Cazenave, J.-P. Quantitative analysis of vitamin E, cholesterol and phospholipid fatty acids in a single aliquot of human platelets and cultured endothelial cells. J. Chromatogr. B: Biomed. Sci. Appl. 1997, 696, 33–42. [Google Scholar] [CrossRef]
  165. Mottier, P.; Gremaud, E.; Guy, P.A.; Turesky, R.J. Comparison of gas chromatography–mass spectrometry and liquid chromatography–tandem mass spectrometry methods to quantify α-tocopherol and α-tocopherolquinone levels in human plasma. Anal. Biochem. 2002, 301, 128–135. [Google Scholar] [CrossRef]
  166. Olmo-García, L.; Polari, J.J.; Li, X.; Bajoub, A.; Fernández-Gutiérrez, A.; Wang, S.C.; Carrasco-Pancorbo, A. Deep insight into the minor fraction of virgin olive oil by using LC-MS and GC-MS multi-class methodologies. Food Chem. 2018, 261, 184–193. [Google Scholar] [CrossRef] [PubMed]
  167. Kadioglu, Y.; Demirkaya, F.; Kursat Demirkaya, A. Quantitative determination of underivatized α-tocopherol in cow milk, vitamin and multivitamin drugs by GC-FID. Chromatographia 2009, 70, 665–670. [Google Scholar] [CrossRef]
  168. Hussain, N.; Jabeen, Z.; Li, Y.-l.; Chen, M.-x.; Li, Z.-l.; Guo, W.-l.; Shamsi, I.H.; Chen, X.-y.; Jiang, L.-x. Detection of tocopherol in oilseed rape (Brassica napus L.) using gas chromatography with flame ionization detector. J. Integr. Agric. 2013, 12, 803–814. [Google Scholar] [CrossRef]
  169. Kim, J.K.; Ha, S.-H.; Park, S.-Y.; Lee, S.M.; Kim, H.J.; Lim, S.H.; Suh, S.-C.; Kim, D.H.; Cho, H.S. Determination of lipophilic compounds in genetically modified rice using gas chromatography–time-of-flight mass spectrometry. J. Food Compos. Anal. 2012, 25, 31–38. [Google Scholar] [CrossRef]
  170. Piironen, V.I.; Liljeroos, A.I.; Koivistoinen, P.E. Transfer of alpha-tocopherol stereoisomers from feeds to eggs. J. Agric. Food Chem. 1991, 39, 99–101. [Google Scholar] [CrossRef]
  171. Bartosińska, E.; Buszewska-Forajta, M.; Siluk, D. GC–MS and LC–MS approaches for determination of tocopherols and tocotrienols in biological and food matrices. J. Pharm. Biomed. Anal. 2016, 127, 156–169. [Google Scholar] [CrossRef]
  172. Demirkaya, F.; Kadioglu, Y. Simple GC-FID method development and validation for determination of α-tocopherol (vitamin E) in human plasma. J. Biochem. Biophys. Methods 2007, 70, 363–368. [Google Scholar] [CrossRef]
  173. Frega, N.; Mozzon, M.; Bocci, F. Identification and estimation of tocotrienols in the annatto lipid fraction by gas chromatography-mass spectrometry. J. Am. Oil Chem. Soc. 1998, 75, 1723–1727. [Google Scholar] [CrossRef]
  174. Lytovchenko, A.; Beleggia, R.; Schauer, N.; Isaacson, T.; Leuendorf, J.E.; Hellmann, H.; Rose, J.K.C.; Fernie, A.R. Application of GC-MS for the detection of lipophilic compounds in diverse plant tissues. Plant Methods 2009, 5, 1–11. [Google Scholar] [CrossRef] [Green Version]
  175. Plutowska, B.; Jeleń, H. Analiza Żywności. In Chemia Zywnosci. Biologiczne Właściwości Składników Żywności; Sikorski, Z.E., Hanna, S., Eds.; Wydawnictwo Naukowe PWN: Warsaw, Poland, 2017; pp. 269–306. [Google Scholar]
  176. Dispas, A.; Jambo, H.; André, S.; Tyteca, E.; Hubert, P. Supercritical fluid chromatography: A promising alternative to current bioanalytical techniques. Bioanalysis 2018, 10, 107–124. [Google Scholar] [CrossRef]
  177. Vera, C.M.; Shock, D.; Dennis, G.R.; Farrell, W.; Shalliker, R.A. Comparing the selectivity and chiral separation of D-and L-fluorenylmethyloxycarbonyl chloride protected amino acids in analytical high performance liquid chromatography and supercritical fluid chromatography; evaluating throughput, economic and environmental impact. J. Chromatogr. A 2017, 1493, 10–18. [Google Scholar] [PubMed]
  178. Vera, C.M.; Shock, D.; Dennis, G.R.; Samuelsson, J.; Enmark, M.; Fornstedt, T.; Shalliker, R.A. A preliminary study on the selectivity of linear polynuclear aromatic hydrocarbons in SFC using phenyl-type stationary phases. Microchem. J. 2015, 121, 136–140. [Google Scholar] [CrossRef]
  179. Vera, C.M.; Shock, D.; Dennis, G.R.; Samuelsson, J.; Enmark, M.; Fornstedt, T.; Shalliker, R.A. Contrasting selectivity between HPLC and SFC using phenyl-type stationary phases: A study on linear polynuclear aromatic hydrocarbons. Microchem. J. 2015, 119, 40–43. [Google Scholar] [CrossRef]
  180. Galea, C.M.; Mangelings, D.; Vander Heyden, Y. Investigation of the effect of mobile phase composition on selectivity using a solvent-triangle based approach in achiral SFC. J. Pharm. Biomed. Anal. 2017, 132, 247–257. [Google Scholar] [CrossRef]
  181. Tyśkiewicz, K.; Gieysztor, R.; Maziarczyk, I.; Hodurek, P.; Rój, E.; Skalicka-Woźniak, K. Supercritical fluid chromatography with photodiode array detection in the determination of fat-soluble vitamins in hemp seed oil and waste fish oil. Molecules 2018, 23, 1131. [Google Scholar] [CrossRef] [Green Version]
  182. Tomai, P.; Dal Bosco, C.; D’Orazio, G.; Scuto, F.R.; Felli, N.; Gentili, A. Supercritical fluid chromatography for vitamin and carotenoid analysis: An update covering 2011–2021. J. Chromatogr. Open 2022, 2, 100027. [Google Scholar] [CrossRef]
  183. Qi, N.; Gong, X.; Feng, C.; Wang, X.; Xu, Y.; Lin, L. Simultaneous analysis of eight vitamin E isomers in Moringa oleifera Lam. leaves by ultra performance convergence chromatography. Food Chem. 2016, 207, 157–161. [Google Scholar] [CrossRef]
  184. Iijima, S.; Terada, A.; Tognarelli, D.J.; Burchell, J.; Kanomata, T.; Bounoshita, M.; Sato, Y.; Kuwajima, M. High Sensitivity Fluorescence Detector for Supercritical Fluid Chromatography. Available online: https://jascoinc.com/wp-content/uploads/2018/05/SFC-FP-for-SFC-2017-.pdf (accessed on 25 July 2022).
  185. Yamamoto, K.; Kotani, A.; Hakamata, H. Electrochemical detection of tocopherols in vegetable oils by supercritical fluid chromatography equipped with carbon fiber electrodes. Anal. Methods 2018, 10, 4414–4418. [Google Scholar] [CrossRef]
  186. Yamamoto, K.; Nishimura, T.; Machida, K.; Kotani, A.; Hakamata, H. Supercritical fluid chromatography with post-column addition of supporting electrolyte solution for electrochemical determination of tocopherol and tocotrienol isomers. J. Sep. Sci. 2022, 45, 1797–1805. [Google Scholar] [CrossRef]
  187. Bustamante-Rangel, M.; Delgado-Zamarreño, M.M.; Sánchez-Pérez, A.; Carabias-Martínez, R. Determination of tocopherols and tocotrienols in cereals by pressurized liquid extraction–liquid chromatography–mass spectrometry. Anal. Chim. Acta 2007, 587, 216–221. [Google Scholar] [CrossRef]
  188. Rentel, C.; Strohschein, S.; Albert, K.; Bayer, E. Silver-plated vitamins: A method of detecting tocopherols and carotenoids in LC/ESI-MS coupling. Anal. Chem. 1998, 70, 4394–4400. [Google Scholar] [CrossRef] [PubMed]
  189. Lanina, S.A.; Toledo, P.; Sampels, S.; Kamal-Eldin, A.; Jastrebova, J.A. Comparison of reversed-phase liquid chromatography–mass spectrometry with electrospray and atmospheric pressure chemical ionization for analysis of dietary tocopherols. J. Chromatogr. A 2007, 1157, 159–170. [Google Scholar] [CrossRef]
  190. Desfontaine, V.; Veuthey, J.-L.; Guillarme, D. Hyphenated detectors: Mass spectrometry. In Supercritical Fluid Chromatography; Poole, C.F., Ed.; Elsevier: Amsterdam, The Netherlands, 2017; pp. 213–244. [Google Scholar]
  191. Viñas, P.; Bravo-Bravo, M.; López-García, I.; Pastor-Belda, M.; Hernández-Córdoba, M. Pressurized liquid extraction and dispersive liquid–liquid microextraction for determination of tocopherols and tocotrienols in plant foods by liquid chromatography with fluorescence and atmospheric pressure chemical ionization-mass spectrometry detection. Talanta 2014, 119, 98–104. [Google Scholar] [CrossRef] [PubMed]
  192. Nagy, K.; Courtet-Compondu, M.-C.; Holst, B.; Kussmann, M. Comprehensive analysis of vitamin E constituents in human plasma by liquid chromatography—Mass spectrometry. Anal. Chem. 2007, 79, 7087–7096. [Google Scholar] [CrossRef] [PubMed]
  193. Butinar, B.; Bučar-Miklavčič, M.; Mariani, C.; Raspor, P. New vitamin E isomers (gamma-tocomonoenol and alpha-tocomonoenol) in seeds, roasted seeds and roasted seed oil from the Slovenian pumpkin variety ‘Slovenska golica’. Food Chem. 2011, 128, 505–512. [Google Scholar] [CrossRef] [PubMed]
  194. Tan, O.H.; Tan, E.H.P.; Ooi, H. Fast gradient normal-phase high pressure liquid chromatography for rapid baseline separation of vitamin E forms in palm-derived tocotrienol rich fractions (TRFs). Anal. Methods 2017, 9, 5211–5218. [Google Scholar] [CrossRef]
Figure 1. Chemical structures of tocol-related compounds.
Molecules 27 06560 g001
Figure 2. Chemical structures of tocotrienol-related compounds.
Molecules 27 06560 g002
Figure 3. Chemical structure of α-tocopheryl acetate.
Molecules 27 06560 g003
Figure 4. Selected richest sources of four tocopherol (T) homologues (α, β, γ, and δ). * Concentration of tocopherols was calculated as α-tocopheryl acetate equivalents. Superscripts (a–e) refers to the following literature positions: a, [12]; b, [42]; c, [35]; d, [46]; e, [47].
Molecules 27 06560 g004
Figure 5. Selected richest sources of four tocotrienol (T3) homologues (α, β, γ, and δ). Superscripts (a–f) refers to the following literature positions: a, [38]; b, [50]; c, [12]; d, [54]; e, [57]; f, [63].
Molecules 27 06560 g005
Figure 6. Chemical structure of plastochromanol-8.
Molecules 27 06560 g006
Figure 7. Selected richest sources of plastochromanol-8 (PC-8). Superscripts (a–b) refers to the following literature positions: a, [65]; b, [15].
Molecules 27 06560 g007
Figure 8. Chemical structure of tocomonoenols and tocodienols. For α-, β-, γ-, δ- methyl substituent number and position see Figure 1.
Molecules 27 06560 g008
Figure 9. Sources of tocomonoenols (T1s). Superscripts (a–f) refers to the following literature positions: a, [70]; b, [71]; c, [75]; d, [73]; e, [16]; f, [74].
Molecules 27 06560 g009
Figure 10. Sources of tocodienols (T2s). Superscripts (a–c) refers to the following literature positions: a, [52]; b, [73]; c, [16].
Molecules 27 06560 g010
Figure 11. Chemical structure of tocochromanol fatty acid esters. For α-, β-, γ-, δ- methyl substituent number and position see Figure 1.
Molecules 27 06560 g011
Table 1. Comparison of result interpretation of the tocopherol (T) and tocotrienol (T3) isomers (β and γ) determination in the same type of plant material by LC using different columns (C18, C30, PFP, and Diol) and elution order (NP and RP).
Common NameLatin NameHomologue OccurrencePhase, ColumnRef.Homologue Occurrence and β % of Σβ + γPhase, ColumnRef.
β-Tγ-Tβ-T3γ-T3β-Tγ-Tβ-T %β-T3γ-T3β-T3 %
Black carawayNigella sativayes-yesRP, C18[37]yesyes21%yes100%NP, Diol[51]
European cranberrybushViburnum opulusyes-RP, C18[56]yesyes91–96%RP, C30[43]
Sea buckthornHippophaë rhamnoidesyes-RP, C18[56]yesyes15–79%yesyes9%RP, PFP[156]
WheatTriticum sp.yes-RP, C18[157]yesyes92%yes-100%RP, PFP[158]
- not detected.
Publisher’s Note: MDPI stays neutral with regard to jurisdictional claims in published maps and institutional affiliations.

