Article

An Efficient Method of Birch Ethanol Lignin Sulfation with a Sulfaic Acid-Urea Mixture

by
Alexander V. Levdansky
1,
Natalya Yu. Vasilyeva
1,2,
Yuriy N. Malyar
1,2,*,
Alexander A. Kondrasenko
1,
Olga Yu. Fetisova
1,
Aleksandr S. Kazachenko
1,2,
Vladimir A. Levdansky
1 and
Boris N. Kuznetsov
1,2,*
1
Institute of Chemistry and Chemical Technology, Krasnoyarsk Science Center, Siberian Branch, Russian Academy of Sciences, Akademgorodok 50/24, 660036 Krasnoyarsk, Russia
2
School of Non-Ferrous Metals and Material Science, Siberian Federal University, Pr. Svobodny 79, 660041 Krasnoyarsk, Russia
*
Authors to whom correspondence should be addressed.
Molecules 2022, 27(19), 6356; https://doi.org/10.3390/molecules27196356
Submission received: 30 August 2022 / Revised: 16 September 2022 / Accepted: 19 September 2022 / Published: 26 September 2022
(This article belongs to the Special Issue Natural Polymers and Biopolymers III)

Abstract

:
For the first time, the process of birch ethanol lignin sulfation with a sulfamic acid-urea mixture in a 1,4-dioxane medium was optimized experimentally and numerically. The high yield of the sulfated ethanol lignin (more than 96%) and containing 7.1 and 7.9 wt % of sulfur was produced at process temperatures of 80 and 90 °C for 3 h. The sample with the highest sulfur content (8.1 wt %) was obtained at a temperature of 100 °C for 2 h. The structure and molecular weight distribution of the sulfated birch ethanol lignin was established by FTIR, 2D 1H and 13C NMR spectroscopy, and gel permeation chromatography. The introduction of sulfate groups into the lignin structure was confirmed by FTIR by the appearance of absorption bands characteristic of the vibrations of sulfate group bonds. According to 2D NMR spectroscopy data, both the alcohol and phenolic hydroxyl groups of the ethanol lignin were subjected to sulfation. The sulfated birch ethanol lignin with a weight average molecular weight of 7.6 kDa and a polydispersity index of 1.81 was obtained under the optimum process conditions. Differences in the structure of the phenylpropane units of birch ethanol lignin (syringyl-type predominates) and abies ethanol lignin (guaiacyl-type predominates) was manifested in the fact that the sulfation of the former proceeds more completely at moderate temperatures than the latter. In contrast to sulfated abies ethanol lignin, the sulfated birch ethanol lignin had a bimodal and wider molecular weight distribution, as well as less thermal stability. The introduction of sulfate groups into ethanol lignin reduced its thermal stability.

1. Introduction

Lignin is the most widespread aromatic polymer on the earth. The lignin content in the dry mass of woody plants ranges within 15–40%, depending on the species [1,2]: 5–12% in herbaceous plants, 25–35% in coniferous wood, and 15–30% in deciduous wood. Lignin has an irregular 3D structure built from phenylpropane units (PPUs) with different numbers of methoxyl groups in the aromatic ring: p-hydroxyphenyl (H), guaiacyl (G), and syringyl (S). The PPUs are randomly cross-linked with simple ether C–O–C and C–C bonds [3]. In addition, the propane chains of the lignin PPUs can contain different functional groups: hydroxyl (–OH), carbonyl (C=O), carboxyl (–COOH), and double bonds (–CH=CH–).
The structure, chemical composition, and physicochemical properties of lignins vary within fairly wide limits, depending on the lignocellulosic raw material and lignin isolation method used [4]. The complex heterogeneous composition of lignins complicates the development of efficient techniques for utilization to obtain valuable products [5].
Recently, there has been an increased interest in organosolv methods for extracting cellulose from lignocellulosic biomass. The use of organic solvents makes the organosolv processes environmentally friendly and eliminates the contamination of lignin with sulfur [6]. Organosolv lignins have a higher content of hydroxyl and carbonyl groups [7] than conventional technical lignins and are soluble in organic solvents, which facilitates the chemical modification and processing of these lignins [8,9,10].
A promising direction in the valorization of lignin is its chemical modification to obtain bioactive derivatives [11,12,13]. In particular, sulfated lignins are known for their anticoagulant and antiplatelet activity and can be used in the treatment of thrombotic disorders [11].
The available methods for obtaining the sulfated lignin derivatives are based on the use of aggressive and environmentally hazardous sulfating reagents, e.g., sulfuric anhydride and its complexes with toxic amines [13,14]. The method for the enzymatic sulfation of organosolv and technical lignins was proposed in [15] and is based on the use of p-nitrophenyl sulfate (p-NPS) as a sulfate donor and aryl sulfotransferase (AST) as a catalyst. This method showed high selectivity for the phenolic hydroxyl groups, leaving the aliphatic hydroxyl groups in the lignin side chain intact. The main drawback of this method is the long sulfation time (96 h). We developed a new, simpler, environmentally safe method for producing water-soluble abies ethanol lignin sulfates, which uses low-toxic sulfamic acid mixed with urea as a sulfating agent [16]. The comparative 2D NMR spectroscopy analysis of the structure of the initial and sulfated abies ethanol lignins was used to establish the main structural units and moieties of lignin macromolecules.
It is known well that, in contrast to lignins of abies and other coniferous species, which consist mainly of the guaiacyl structural units, in the hardwood (e.g., birch) lignin structure, the syringyl units dominate [17,18]. Coniferous and hardwood lignins also contain different amounts of condensed structural units; hardwood lignins are less condensed [4]. Birch is widespread in Russia and other countries of the Northern Hemisphere, but its wood finds only limited application in the pulp, paper, and building industries. However, the high content of xylan in birch wood allows it to carry out the complex processing of its biomass with the production of xylose, levulinic acid, and ethanol lignin [19]. Birch ethanol lignin contains no sulfur and has a relatively low molecular weight and a fairly narrow molecular weight distribution, which makes it a convenient substrate for the synthesis of bioactive lignin sulfates.
The aim of this study was to experimentally and numerically optimize the process of the sulfation of ethanol lignin birch wood with a mixture of sulfamic acid and urea in a 1,4-dioxane medium and to characterize the structure and thermochemical properties of the sulfated ethanol lignin.

2. Results

2.1. Kinetic Study of the Process of Birch Ethanol Lignin Sulfation

The scheme of birch ethanol lignin sulfation with the low-toxic sulfamic acid–urea mixture in the 1,4-dioxane medium is shown in Figure 1. The isolation of sulfated lignin was isolated in the form of an ammonium salt.
The use of the low-toxic and non-corrosive mixture of sulfamic acid and urea for the sulfation of abies ethanol lignin was previously proposed [16]. The yield of sulfated ethanol lignin of abies wood and sulfur content can be regulated by varying the sulfation process temperature, time, and the ratio of lignin to sulfating complex (sulfamic acid and urea mixture).
A high yield of sulfated lignin and sulfur content can be obtained at different combinations of the above-mentioned parameters of the sulfation process. Taking into account the data obtained when optimizing the process of abies ethanol lignin sulfation with a mixture of sulfamic acid and urea, the ratio of birch ethanol lignin to the sulfating complex was chosen in this study to be 1:3 mol/mol.
The sulfation process temperature ranged from 70 to 110 °C and the process time from 0.5 to 3.0 h. The data on the effect of the birch ethanol lignin sulfation conditions on the yield of sulfated lignin and sulfur content are given in Table 1.
The high yield of sulfated birch ethanol lignin and the high sulfur content can be obtained at different combinations of the specified parameters of the sulfation process (temperature and time).
The sulfated ethanol lignin samples with a high yield (91.1–96.4%) and a sulfur content of 7.1–8.1 wt % were obtained at a process temperature of 90 °C and a time of 3 h or at a temperature of 100 °C and a time of 1.5–2.0 h. A further increase in the sulfation time and temperature did not significantly affect the sulfur content in the product but reduced the sulfated lignin yield. This may be due to the intensification of secondary condensation and destruction reactions under more severe conditions, which leads to the formation of products that are removed at the stage of sulfated lignin dialysis. It should be noted that the products of sulfation of birch ethanol lignin contain somewhat more sulfur than the products of sulfation of abies ethanol lignin under similar conditions [16]. This is possibly related to the lower reactivity of coniferous lignins that contain more condensed structural units than hardwood lignins [4].
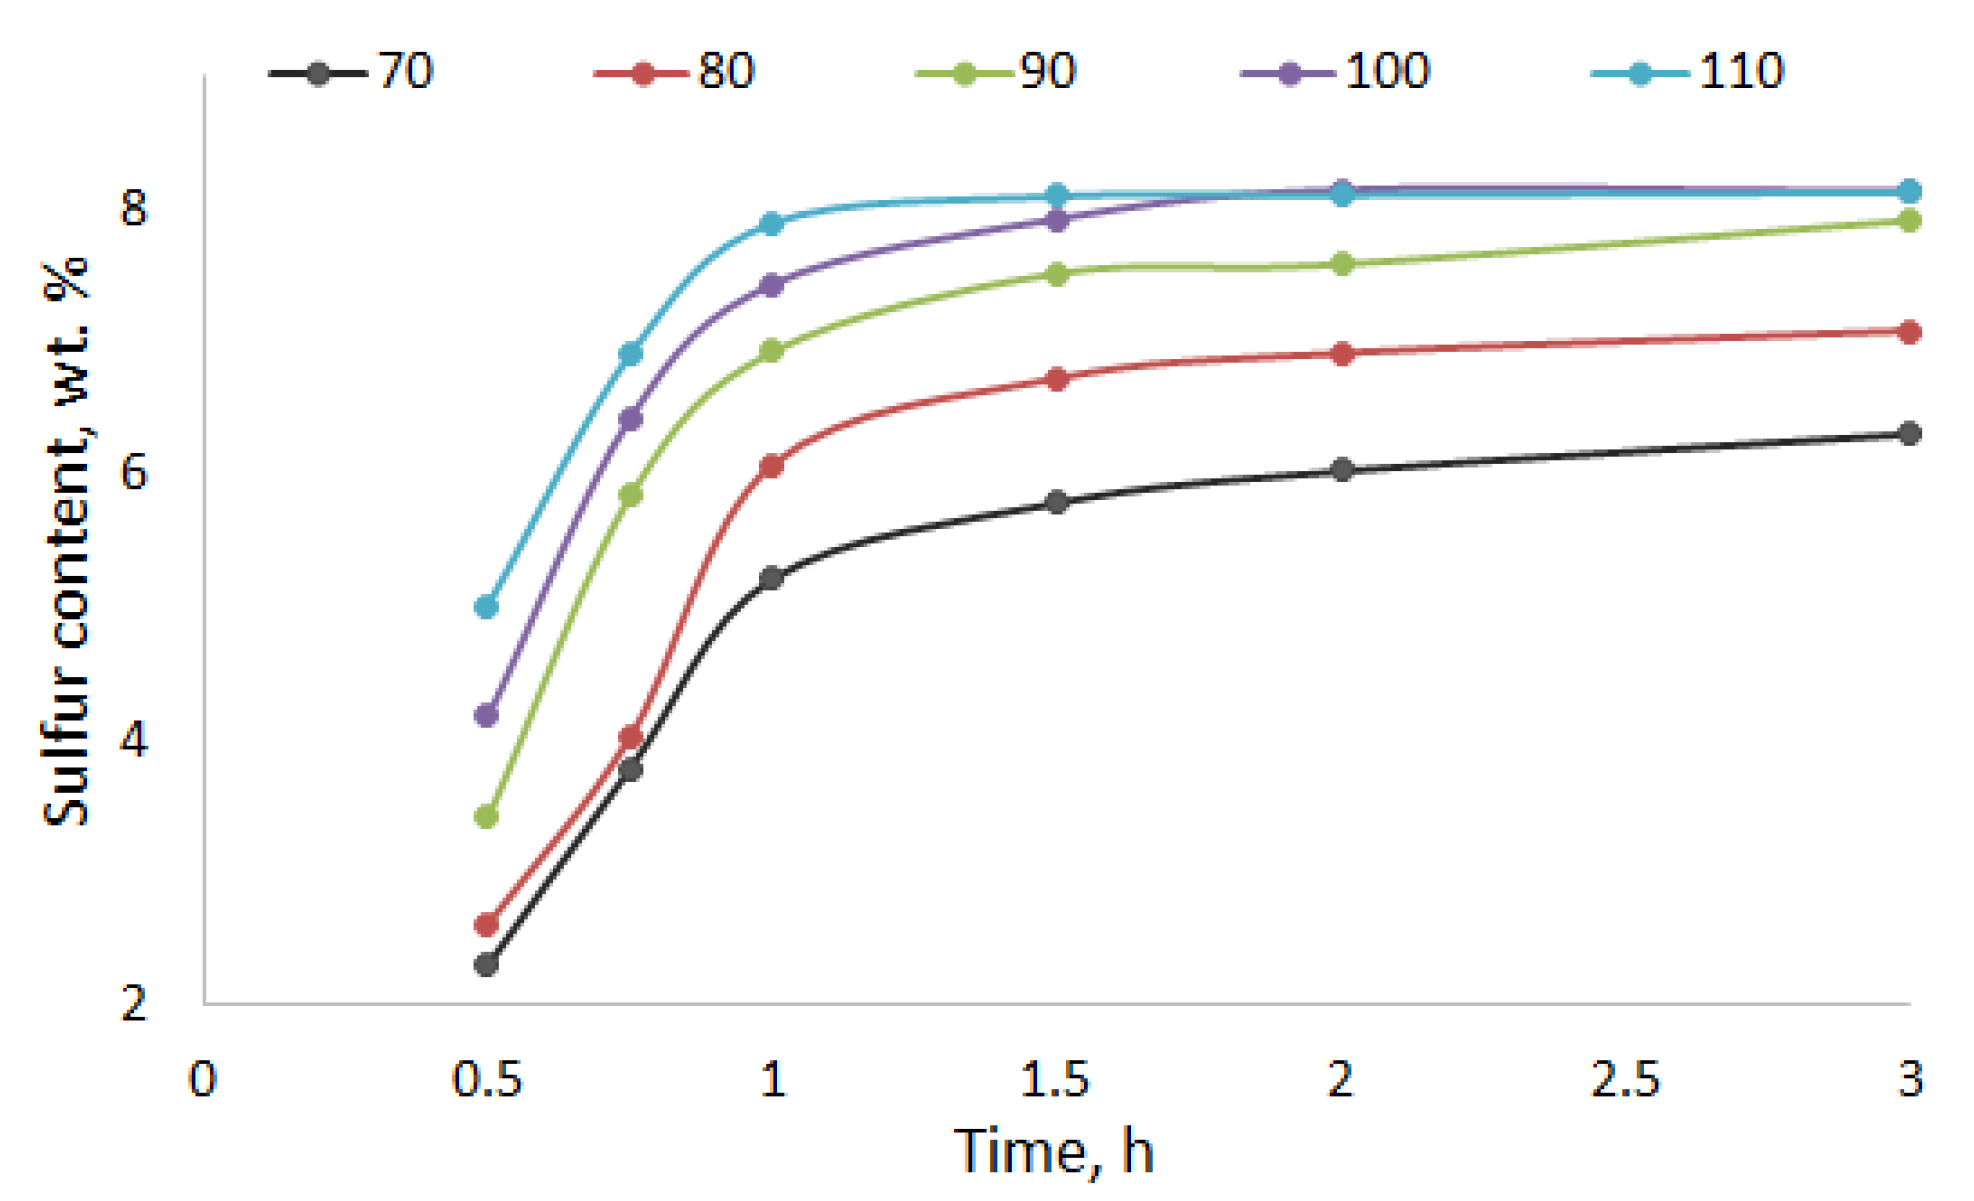
The kinetics of the birch ethanol lignin sulfation with sulfamic acid–urea mixture in 1,4-dioxane medium was investigated in the temperature range of 70–100 °C (Figure 2). The apparent rates of the birch ethanol lignin sulfation were calculated from the change in the sulfur content in sulfated ethanol lignin. The calculation was made using the first-order equation. The activation energy of the sulfation process was determined from the temperature dependence of the rate constants in the Arrhenius coordinates (Figure 3).
The calculated apparent rate constants and activation energies of the birch ethanol lignin sulfation process are given in Table 2.
The activation energies of the processes of sulfation of birch and abies ethanol lignins with sulfamic acid–urea mixture in 1,4-dioxane medium are similar: 10.7 kJ/mol for birch lignin (Table 2) and 8.4 kJ/mol for abies lignin [16]. It should be noted that, for the process of starch sulfation in a deep eutectic solvent (the sulfamic acid–urea mixture), the activation energy was 6.4 kJ/mol [20] and, for the sulfation of arabinogalactan with sulfamic acid in DMSO it was 13.1 kJ/mol [21]. It is known that the low activation energy of the process may indicate the presence of significant diffusion restrictions [22,23]. Taking this into account, we can conclude that, under the chosen conditions, the processes of biopolymer sulfation proceed under diffusion restrictions.
The solubility of the sulfated lignin in water increased with an increase in the content of sulfate groups. The maximum sulfur content in the sulfated ethanol lignin was estimated to be 10.6 wt %, taking into account the hypothetical structure of the Berkman spruce lignin [4], in which one phenylpropane unit has 0.9 mol of free OH groups capable of sulfating. In order to find the conditions that ensure the production of sulfated birch ethanol lignin with maximum yield and sulfur content, a numerical optimization of the sulfation process was carried out.

2.2. Numerical Optimization of the Process of Birch Ethanol Lignin Sulfation

As independent variables, we used two factors: process temperature X1 (70, 80, 90, 100, 110 °C) and time X2 (0.5, 0.75, 1.0, 1.5, 2.0, 3.0 h). The result of the sulfation process was characterized by two output parameters: sulfur content Y1 (wt %) in the sulfated ethanol lignin and sulfated ethanol lignin yield Y2 (wt %). The fixed parameter was the ratio L:SC = 1:3. A combined multilevel experiment plan (Users Design) was used in the calculations. The designations of the variables are listed in Table 3.
The experimental results given in Table 1 were used in the mathematical processing and optimization of the birch ethanol lignin sulfation process.
The dependences of the output parameters on the variable process factors were approximated by second-order regression equations. The results of the variance analysis are given in Table 4.
The variance analysis showed that, within the limits of the experimental conditions used, the greatest contribution to the total variance of the output parameter was made by both factors: the temperature and time of the birch ethanol lignin sulfation process. This is indicated by the high variance ratios (F) for the main effects, which are called also the influence efficiencies. The data in the columns of Table 4 (P) are interpreted similarly. The influence of the variance source on the output parameter is considered to be statistically significant if its significance level is lower than a specified critical value (in our case, 0.05).
The dependence of the sulfur content Y1 in the sulfated birch ethanol lignin on the process variables is approximated by the regression equation
Y 1 = 12.7119 + 0.3212 × X 1 + 3.27557 × X 2 0.00149576 × X 1 2 + + 0.000225435 × X 1 × X 2 0.693718 × X 2 2
The predictive properties of Equation (1) are illustrated in Figure 4, in which the experimental values of the output parameter Y1 are compared with its values calculated using Equation (1). The straight line corresponds to the calculated Y1 values, and the dots correspond to the observed values. The proximity of the experimental points to the straight line confirms the good predictive properties of Equation (1).
The approximation quality is characterized also by the determination coefficient R2adj. In the case under consideration, the value is R2adj = 86.1%, which indicates acceptable approximation quality. This confirms the adequacy of Equation (1) for the experiment and makes it possible to use this equation as a mathematical model of the process under study.
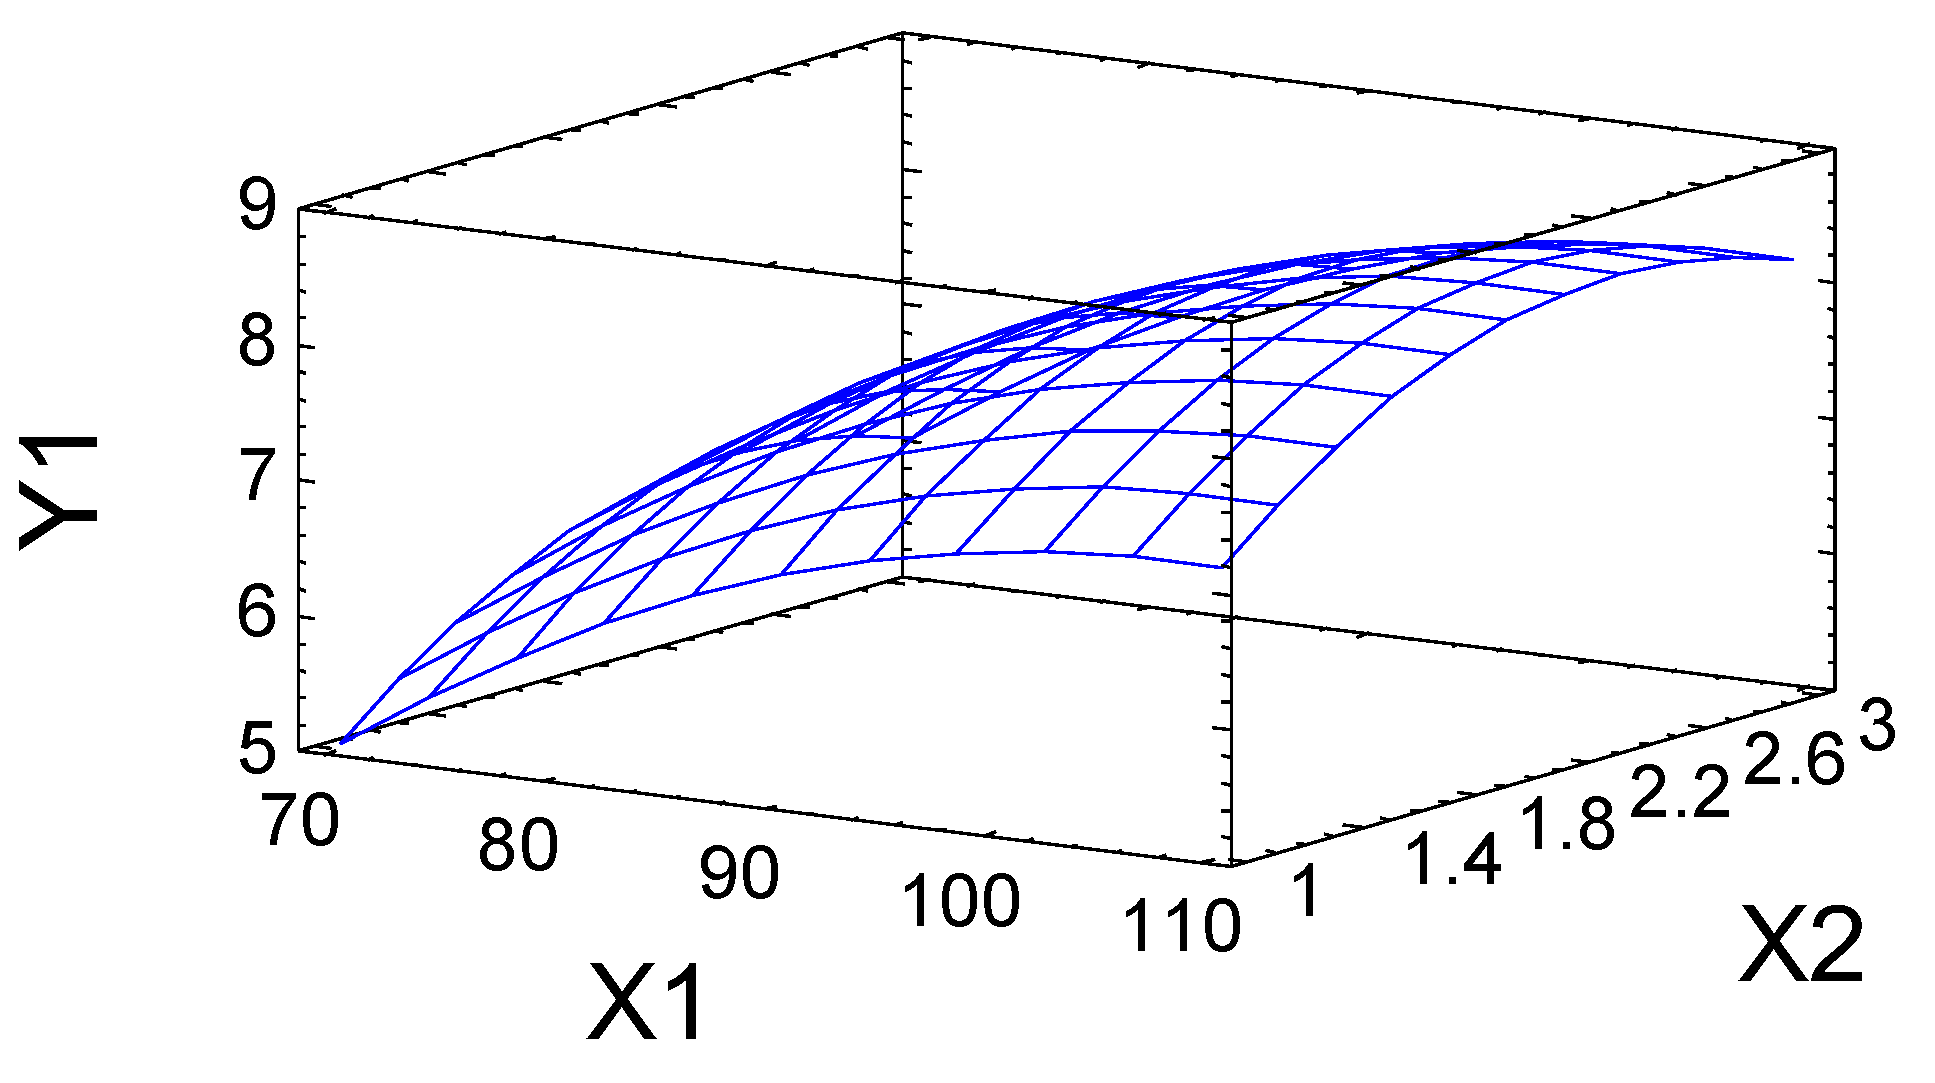
Using the mathematical model, the dependence of the output parameter Y1 on the variables X1 and X2 was plotted in the form of a response surface (Figure 5).
According to the calculation using mathematical model (1), the maximum predicted sulfur content (8.4 wt %) was obtained at the point corresponding to a process temperature of 107 °C and a process time of 2.3 h.
According to the results of the variance analysis within the limits of the chosen experimental conditions, the sulfation temperature contributes significantly to the total variance of the output parameter Y2 (sulfated lignin yield, wt %). This is indicated by the high variance relation (F) corresponding to this factor and the small P criterion.
The dependence of Y2 on the variable process factors is approximated by the regression equation
Y 2 = 36.8673 + 1.29494 × X 1 + 7.57733 × X 2 0.00715242 × X 1 2 0.0850839 × X 1 × X 2 0.14729 × X 2 2
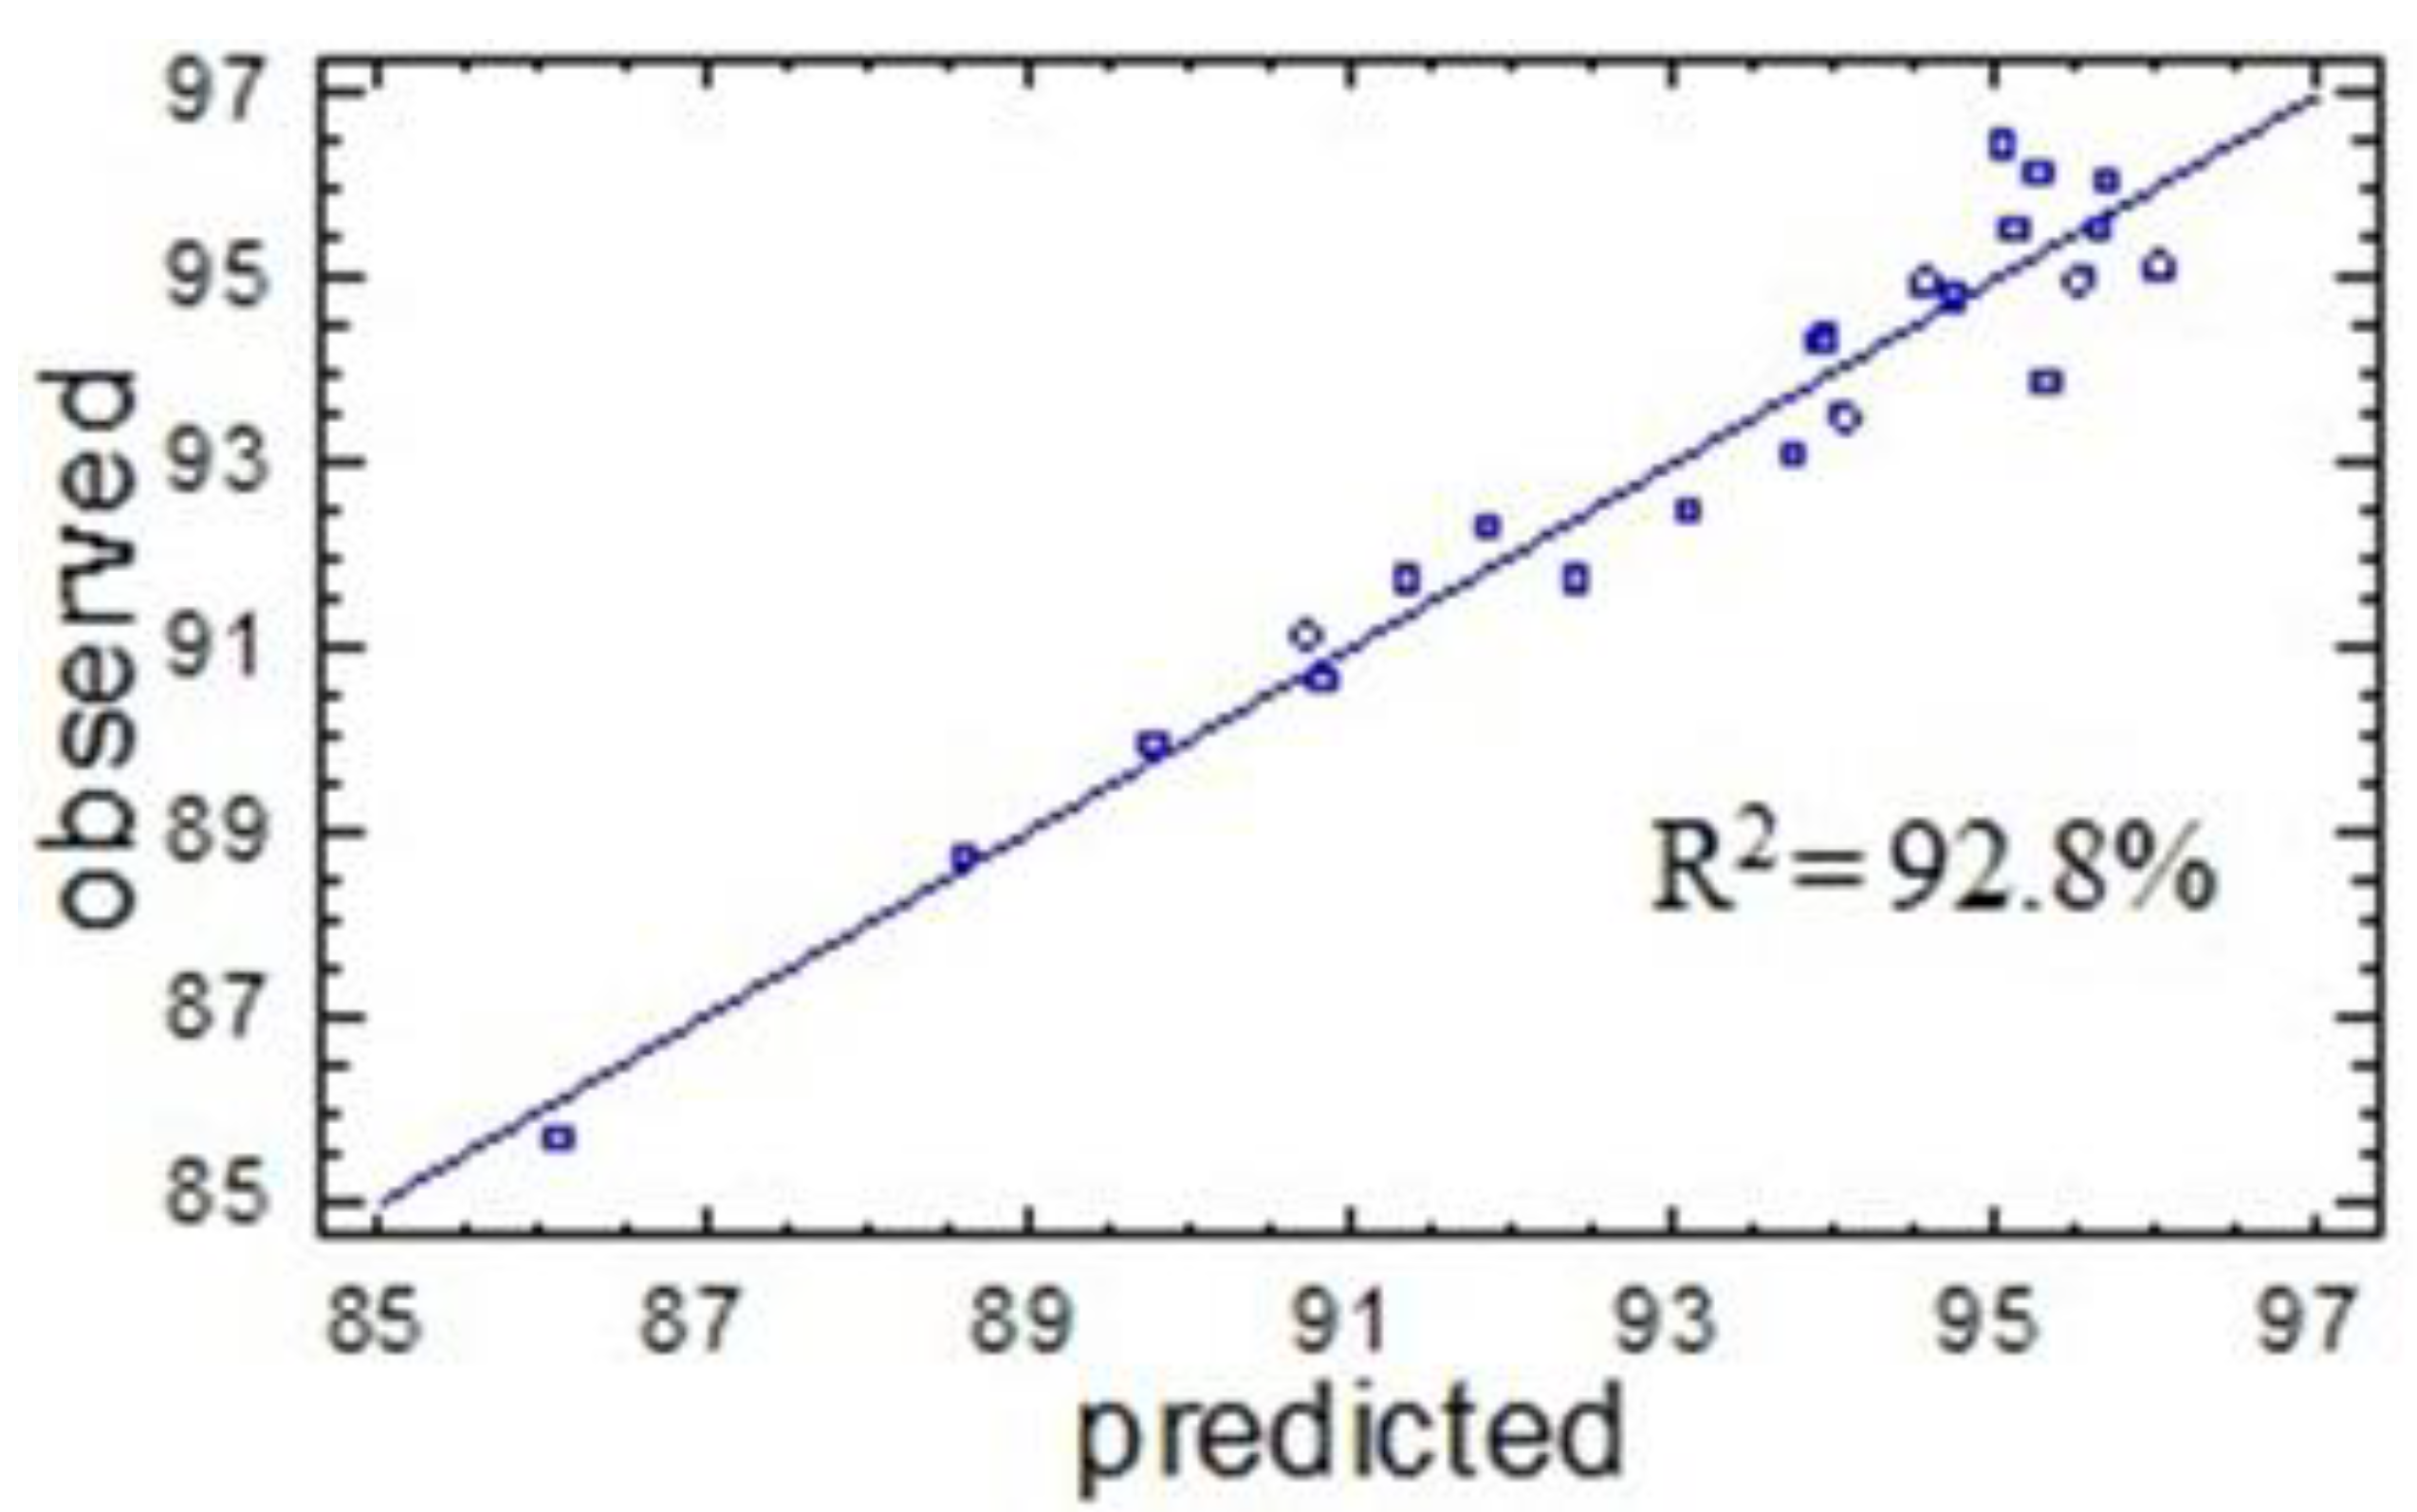
The determination coefficient is fairly high, R2adj = 92.8%, which evidences the good approximation quality. The latter is also confirmed by the good agreement between the output parameters calculated using Equation (2) and those obtained in the experimental measurements. This confirms the adequacy of Equation (2) for the experiment and its use as a mathematical model of the process under study (Figure 6).
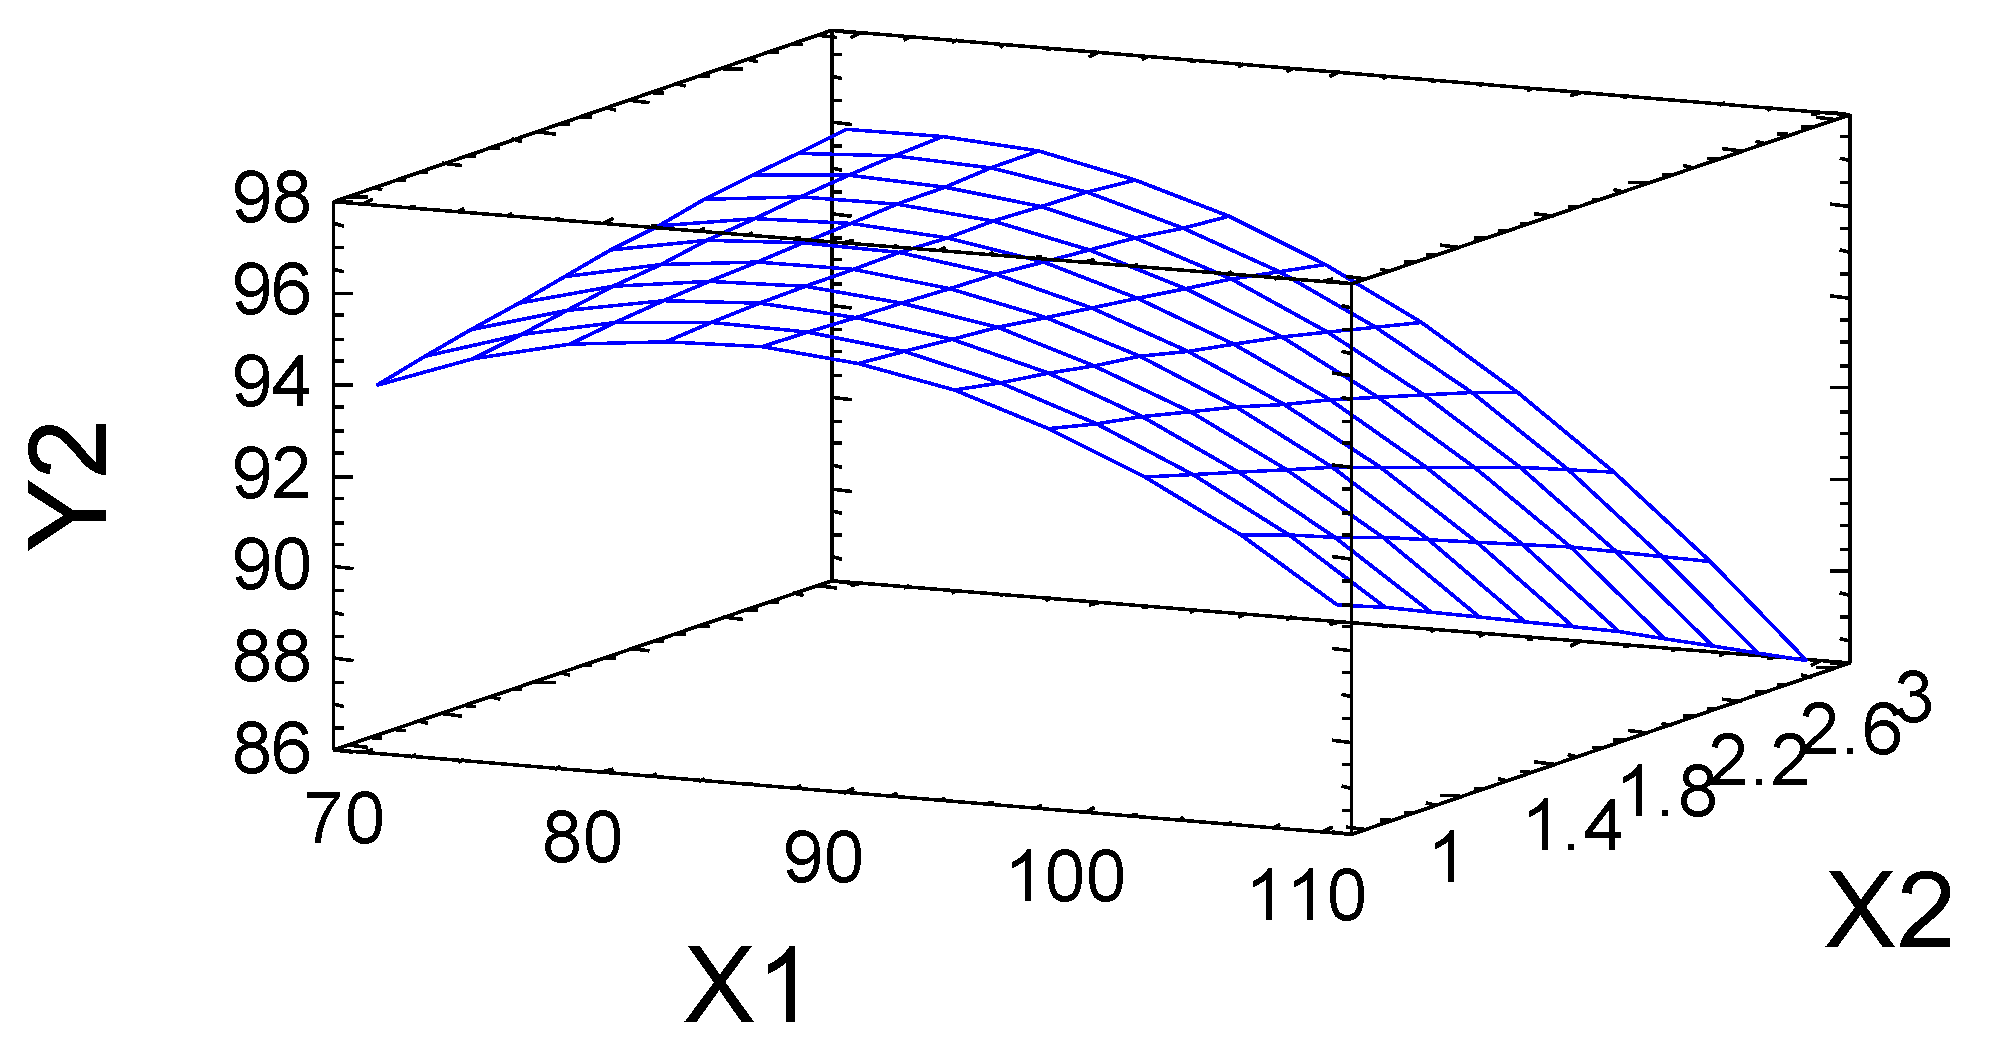
Figure 7 shows the graphical representation of the dependence of the sulfated birch ethanol lignin yield on the variable factors X1 and X2.
According to the above-described model, the optimum conditions for the sulfation of birch ethanol lignin that ensure the maximum yield of sulfated birch ethanol lignin (96.1 wt %) correspond to a process temperature of 78 °C and a time of 2.9 h.

2.3. Characterization of the Sulfated Birch Ethanol Lignin

The substitution of hydroxyl groups for sulfate groups during the sulfation of the birch ethanol lignin with the sulfamic acid–urea mixture was confirmed by FTIR and NMR spectroscopy.
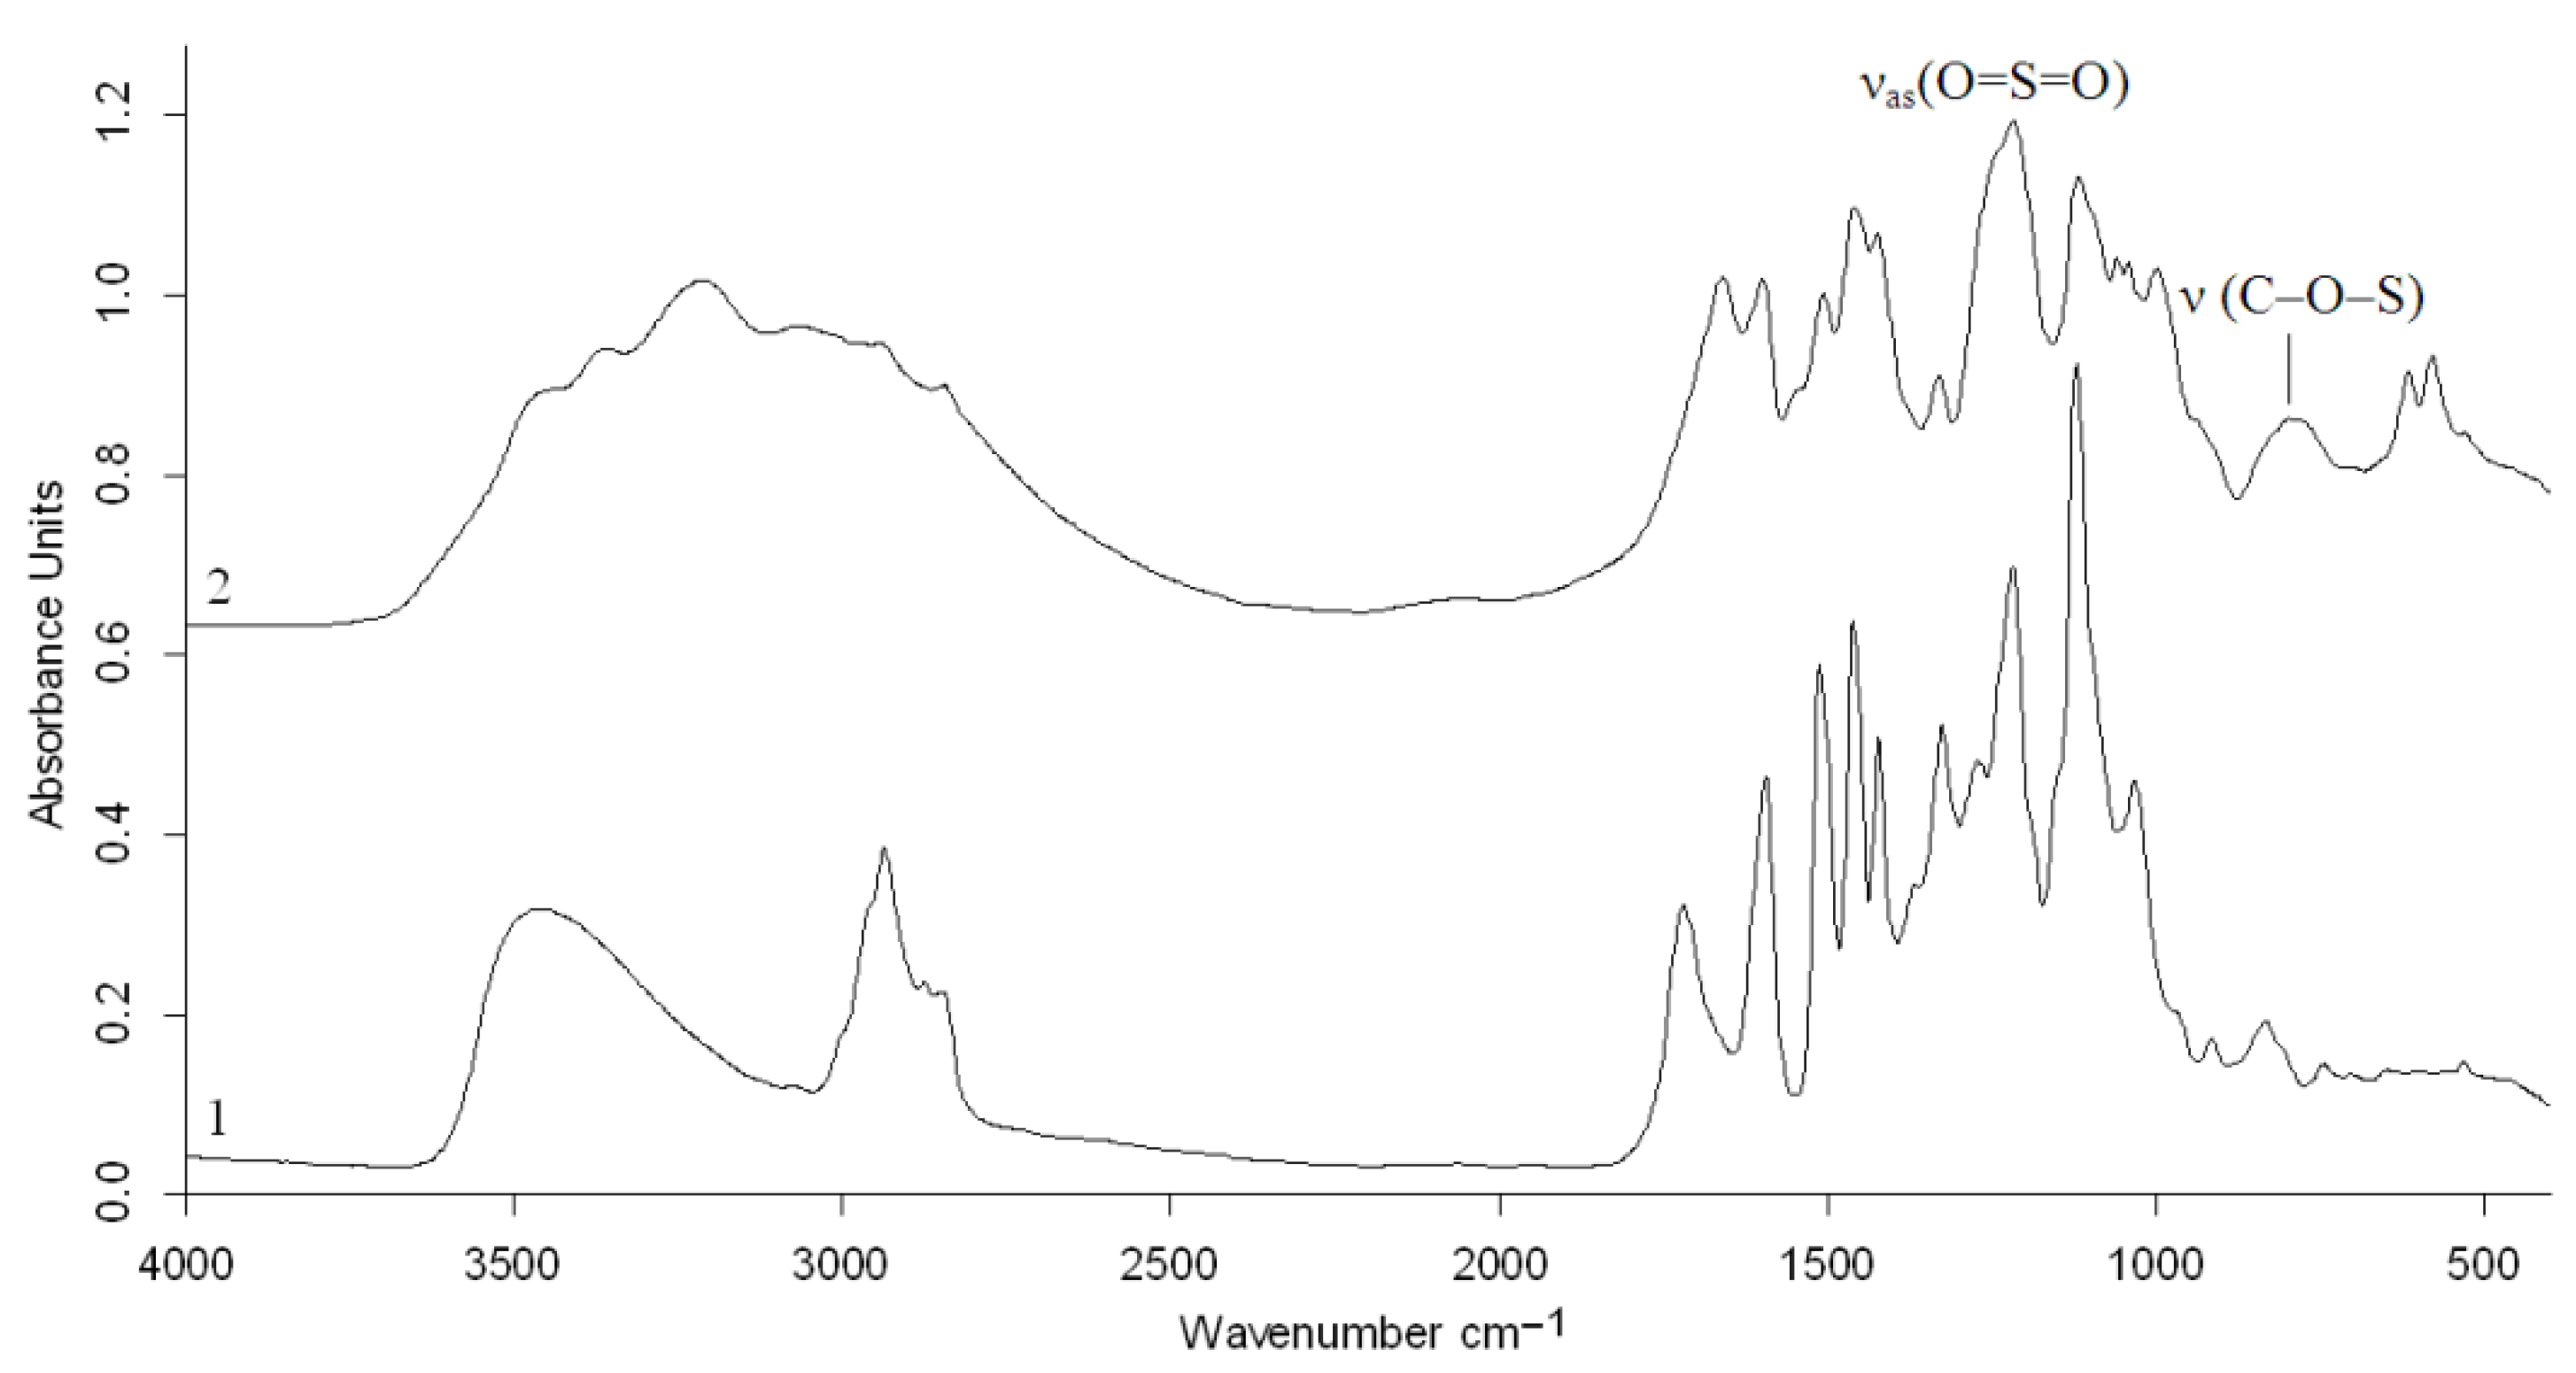
The FTIR spectrum of birch ethanol lignin (Figure 8) contains absorption bands characteristic of hardwood lignins (GS) [24]. The band at 1123 cm−1 corresponds to planar bending vibrations of the C–H syringyl aromatic rings, and the C–O stretching vibrations in secondary alcohols are dominant in the spectrum. The pronounced band with a maximum at 1327 cm−1 belongs to the skeletal vibrations of the syringyl ring with the C–O stretching vibrations. In addition, the spectrum includes medium-intensity absorption bands around 1271 and 1034 cm−1, characteristic of the vibrations of the guaiacyl units of lignin [4].
In contrast to the spectrum of the initial ethanol lignin, the FTIR spectrum of the ammonium salts of the ethanol lignin sulfates contained a new absorption band at 798 cm−1 (Figure 8), which corresponds to the stretching vibrations of the C–O–S bond of the sulfate group and a broad absorption band with the maximum at 1218 cm−1 corresponding to the asymmetric stretching vibrations υas(O=S=O).
The FTIR spectra of birch and abies ethanol lignin sulfates [16] obtained in a similar way are almost identical, except for the presence in the spectrum of the sulfated birch ethanol lignin of the adsorption band at 1331 cm−1 characteristic of the syringyl structures.
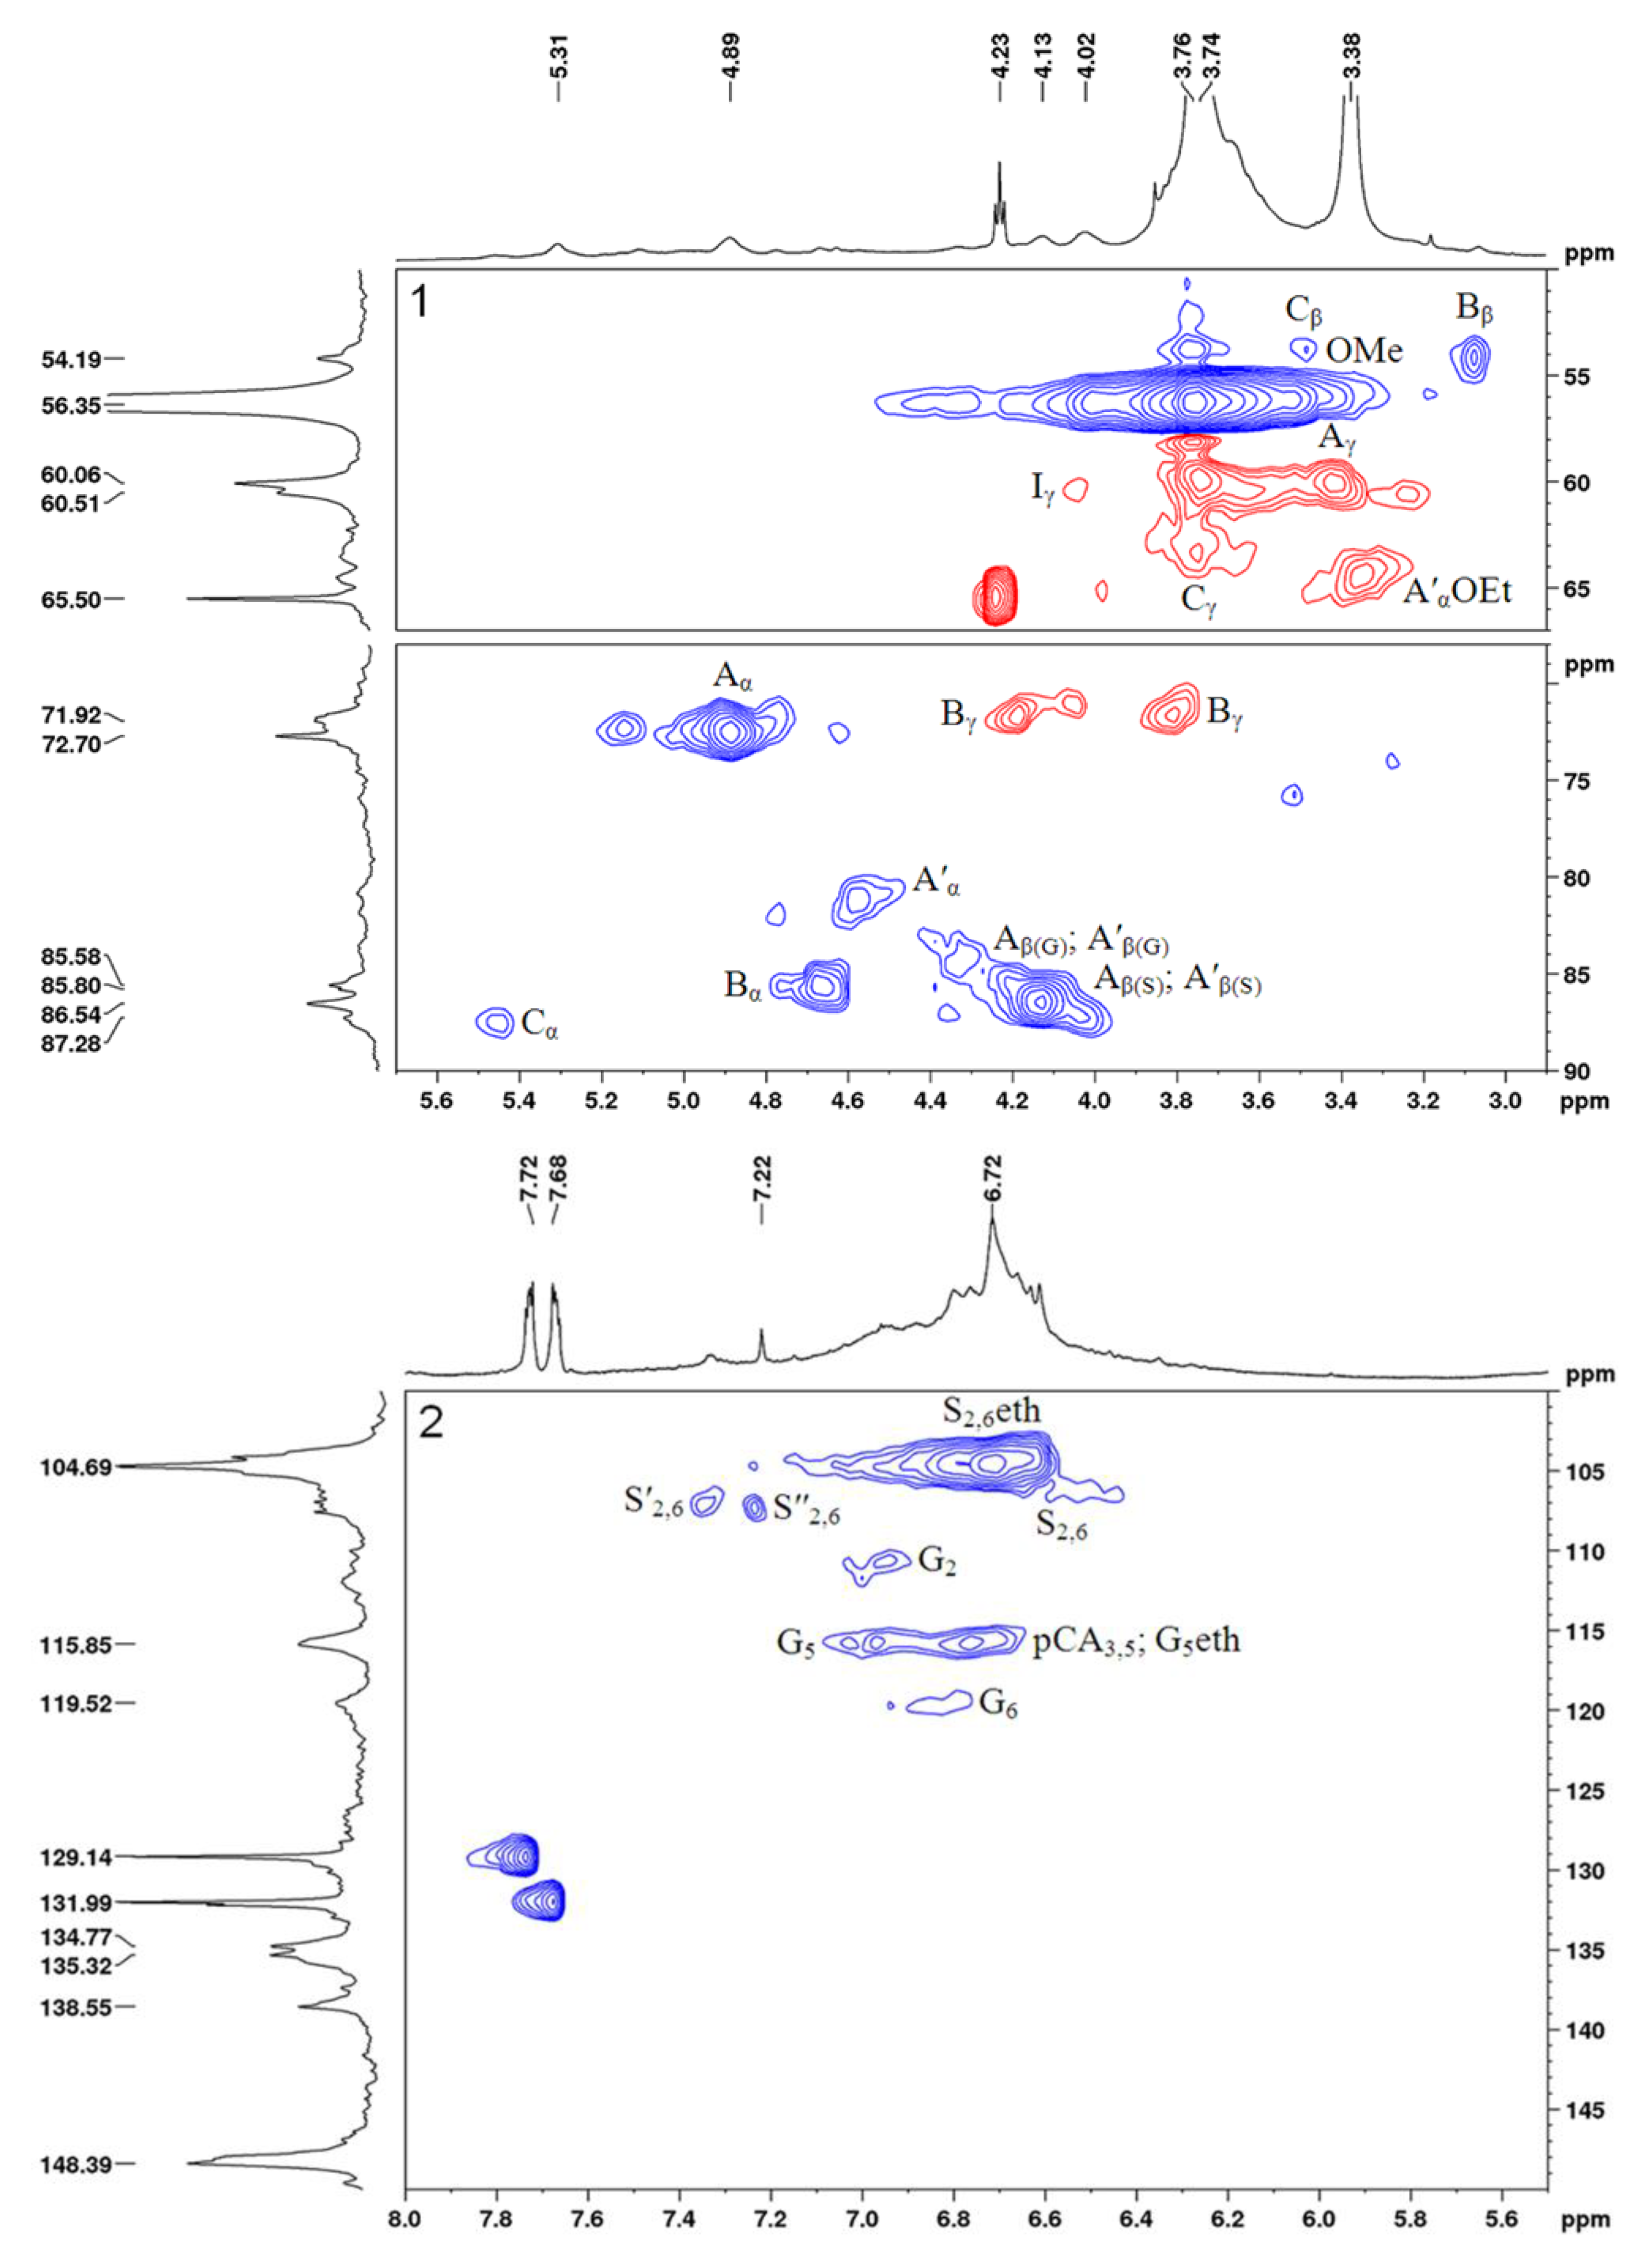
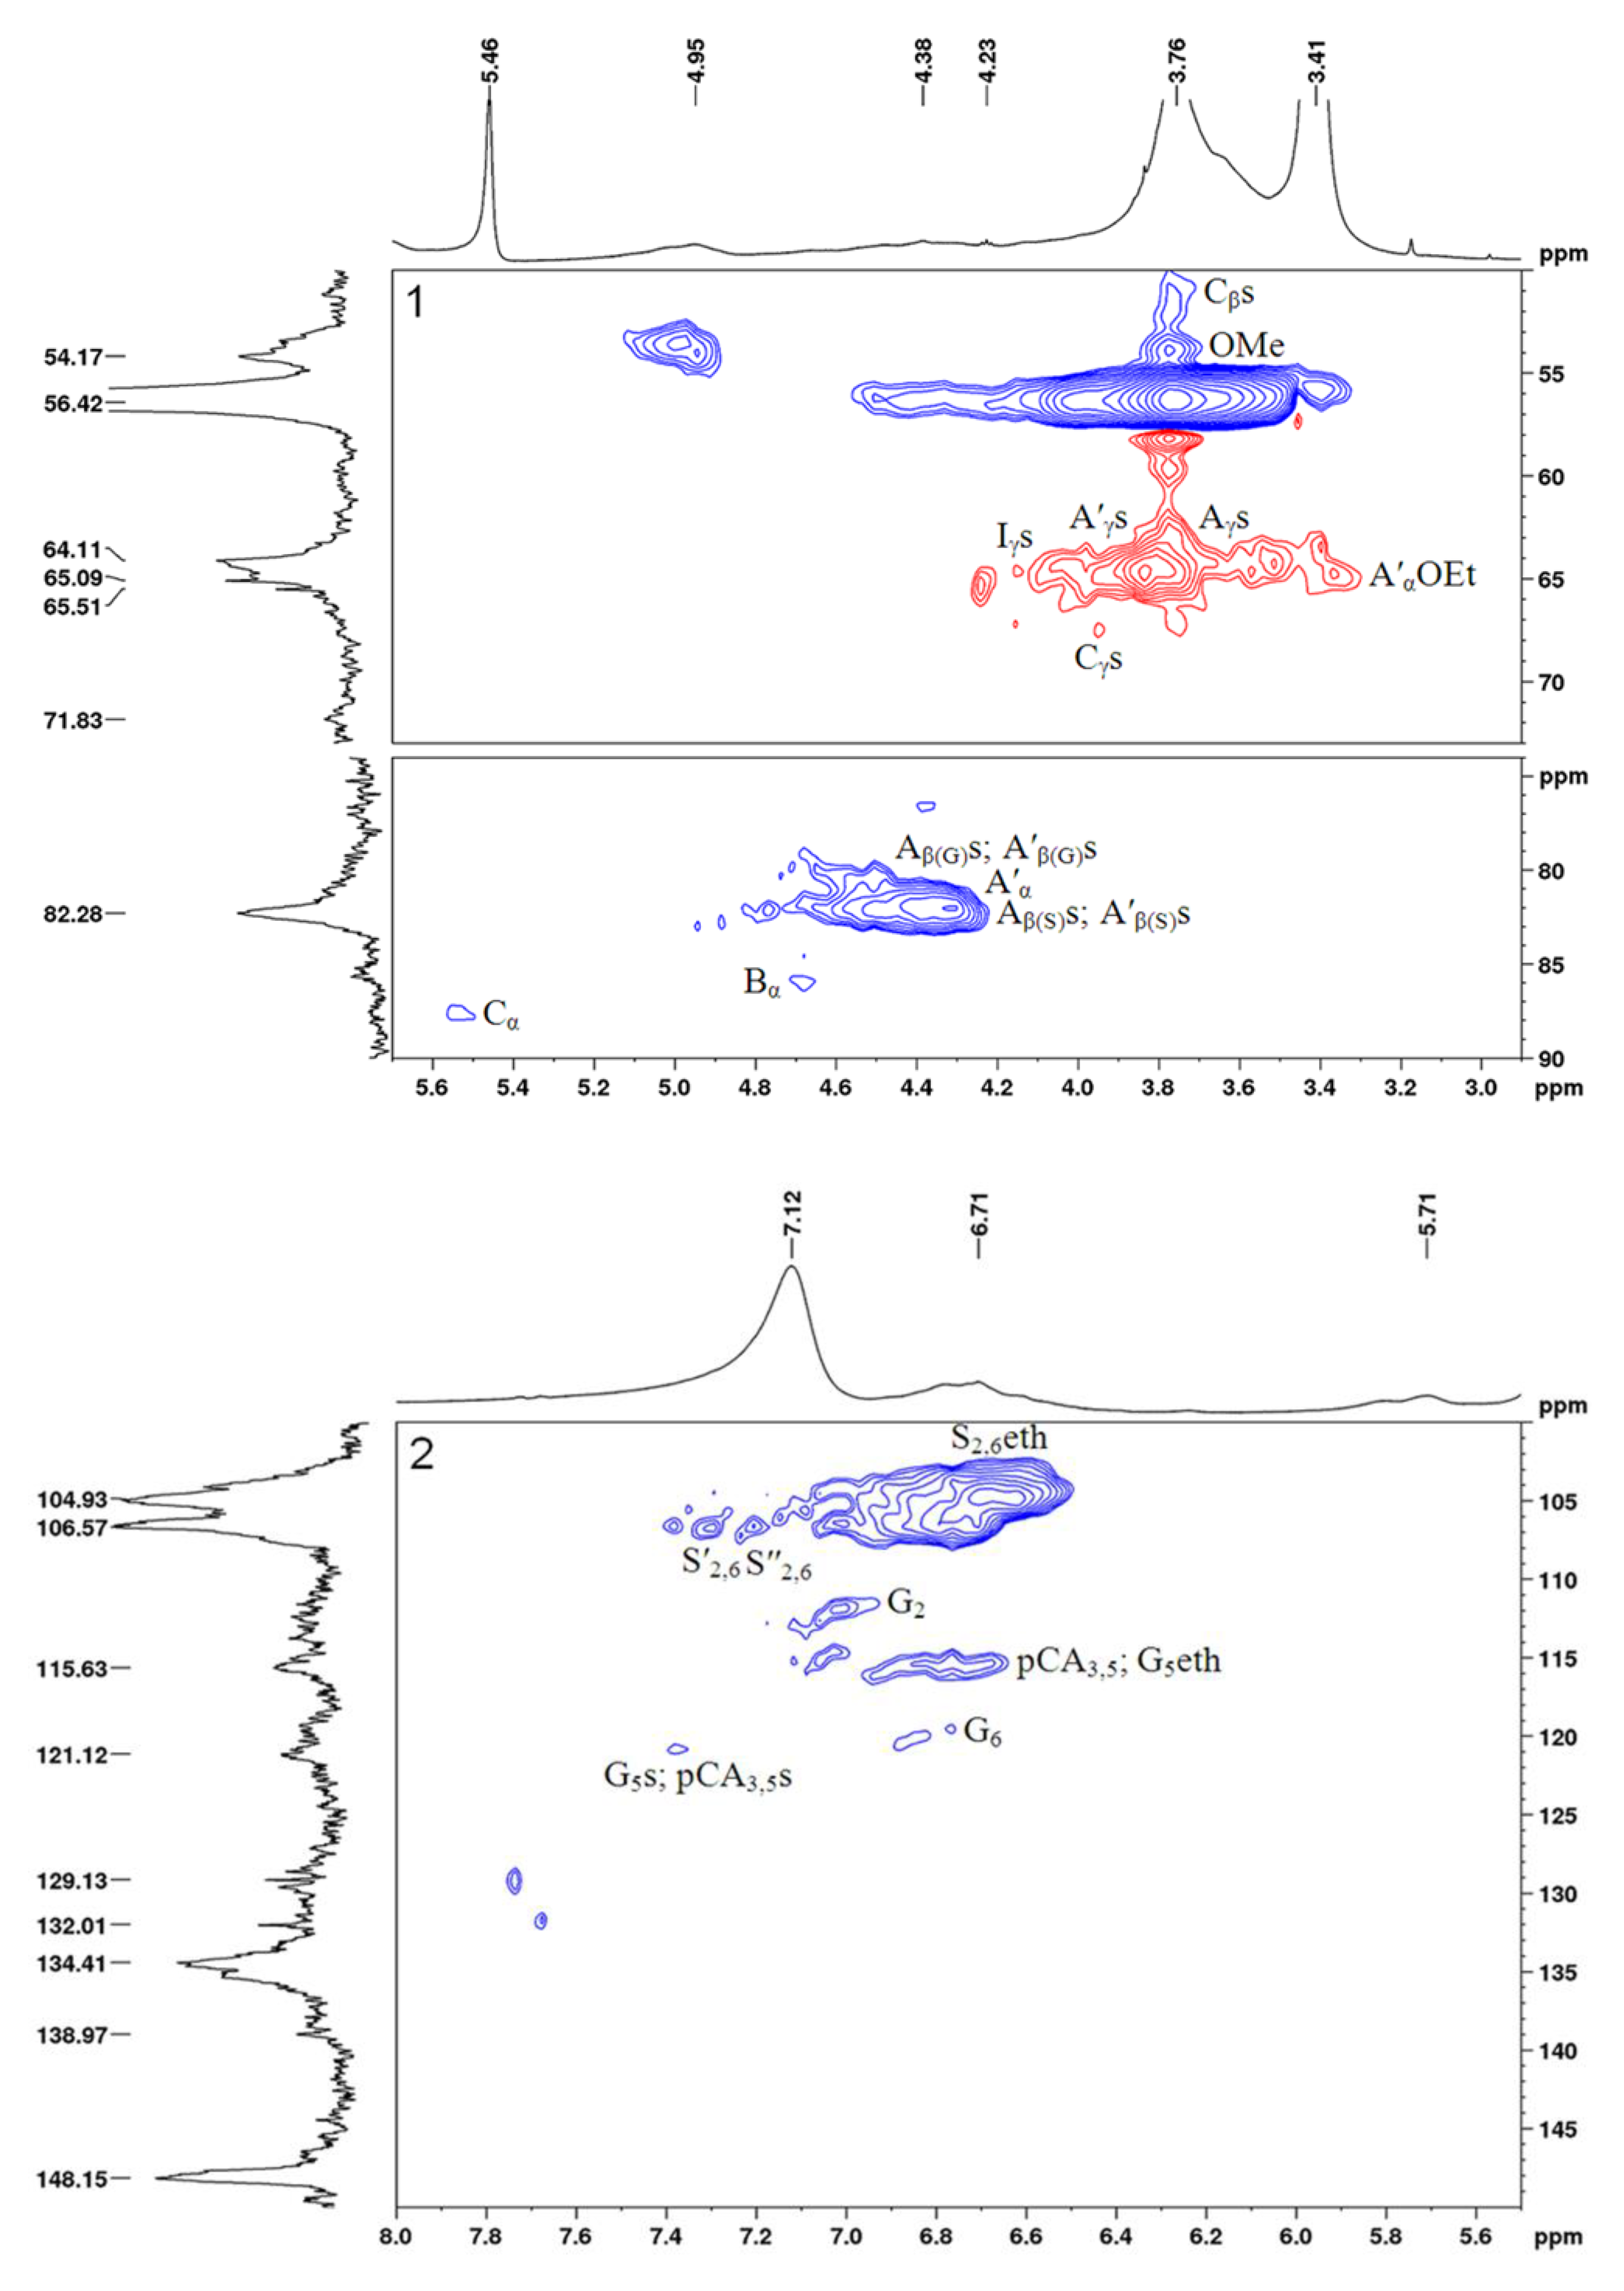
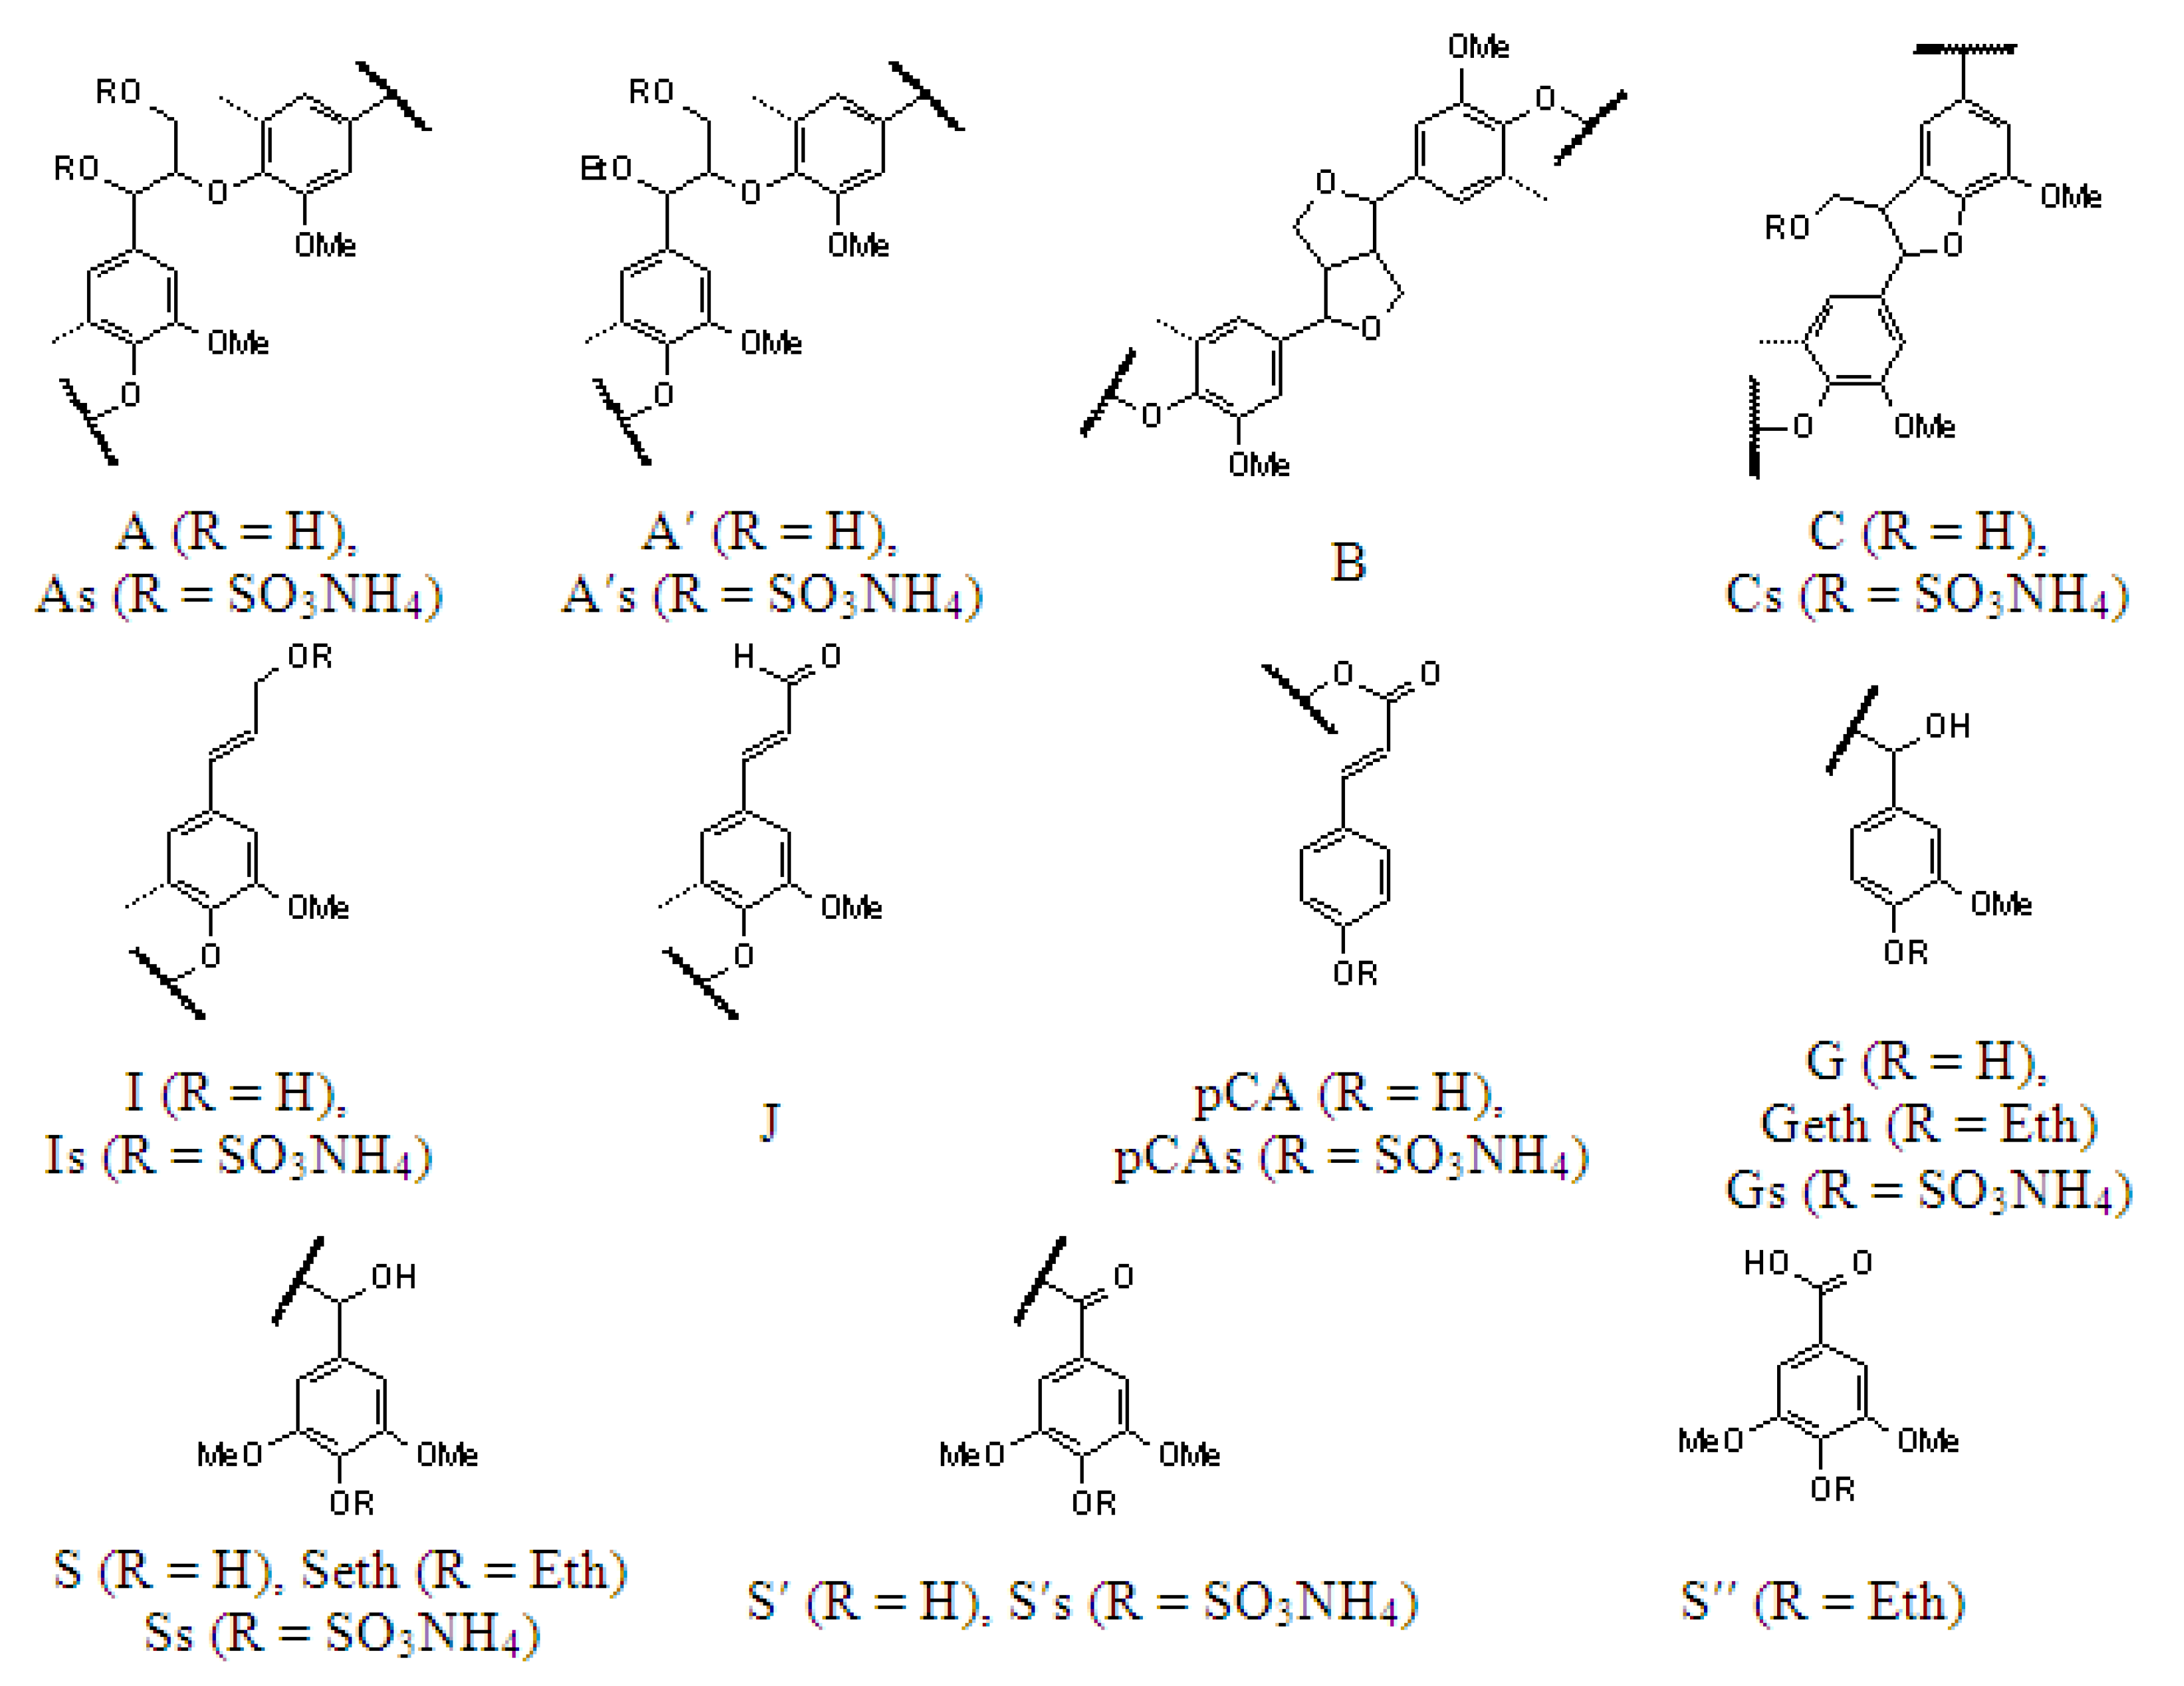
The 2D HSQC NMR spectra of the initial and sulfated birch ethanol lignins are shown in Figure 9 and Figure 10, respectively. The main 1H–13C peaks in the HSQC spectra identified using the literature data [25,26,27] are given in Table 5, together with the chemical shifts of some low-intensity peaks (not shown in Figure 9 and Figure 10). The main structural units and fragments of the initial and sulfated birch ethanol lignins are presented in Figure 11.
The HSQC spectra of the initial and sulfated ethanol lignin samples were compared in the regions of the chemical shifts of atoms from the lignin side chains (δCH 50–90/2.9–5.7 ppm) and aromatic rings (δCH 100–150/5.5–8.0 ppm).
Considering the region of the 1H–13C side chain signals in the HSQC spectrum of the birch ethanol lignin (Figure 9), we can see that it contains the intense correlation peaks of β-aryl ethers (A), pinoresinol (B), and phenylcoumaran fragments (C) (see Figure 11). A part of β-aryl ethers is ethoxylated in the α-position, judging by the fact that the spectra contain signals of the methylene group in the α-ethoxylated β-O-4′ bonds (δCH 64.4/3.33) and the α-position of the α-acylated β-O-4′ bonds (δCH 81.2/4.56). This assumption is confirmed by the presence of a correlation signal of the methyl group at δCH 14.3/1.00 ppm.
In the spectrum of the sulfated ethanol lignin (Figure 10), the group of peaks assigned to the phenylcoumaran fragments (C) is characterized by a change in the position of the correlation signals Cγ-Hγ and Cβ-Hβ (Figure 10), which is related to the effect of sulfation of OH groups in the γ position (Cγ-Hγ: a shift of ΔδC ~ 4 ppm toward weak fields; Cβ-Hβ: a shift of ΔδC ~ 3 ppm toward strong fields).
A similar change in the peak positions along the carbon atom axis in the sulfated ethanol lignin spectrum is observed for β-aryl ethers β-O-4′ (A) and α-ethoxylated β-aryl ethers (A′). The Cγ-Hγ correlation signals of the sulfated lignin are shifted relative to the initial lignin signals toward weak fields by ~5 ppm and the Cβ-Hβ signals toward strong fields by ~4 ppm. Such shifts of the signals in the spectra are most likely due to the sulfation of OH groups of β-aryl ethers of the lignin macromolecule in the γ position. In addition, free OH groups in the α position of β-aryl ethers (A) are probably subjected to the sulfation, since the Cα-Hα peak at δCH 72.5/4.88 ppm is missing in the sulfated lignin spectrum.
The shift of signals in the aliphatic region of the spectrum of the sulfated lignin sample as compared with the spectrum of the initial lignin was also found for the Cγ–Hγ correlations of the cinnamyl alcohol end groups (I). This is also indicative of the sulfation of OH groups bonded with carbon atoms Cγ of this lignin fragment.
Despite the presence of the fairly intense Cα-Hα, Cβ-Hβ, and Cγ-Hγ signals of pinoresinol (β–β′) fragments (B) in the spectrum of the initial ethanol lignin, the intensity of these signals in the spectrum of the sulfated sample drops dramatically. The peaks assigned to the Cγ-Hγ correlations (δCH 71.6/3.80 and 4.18 ppm) disappear almost completely.
It is important to note the appearance of a peak at δCH 53.6/5.00 ppm assigned to the CH3 or CH groups in the aliphatic region of the sulfated ethanol lignin spectrum. We failed to establish an unambiguous correspondence of this peak to any structural fragment.
The 1H–13C aromatic region in the HSQC spectrum of the birch ethanol lignin (Figure 9) contains characteristic correlation peaks of the syringyl (S) and guaiacyl (G) units, p-coumarates (pCA), and cinnamyl aldehyde end groups (J). The syringyl units are of several types. In particular, using the assignments made in [28,29,30], we found S units with a substituent in the 4-position (δCH 104.5/6.70), S units with a free hydroxyl group in the 4-position (δCH 106.2/6.51), S units with a carbonyl group in the α-position (δCH 107.1/7.35), and S units with a carboxyl group in the α position (δCH 107.2/7.23).
In addition, there are high-intensity signals at δCH = 129.1/7.73 and 131.9/7.67 ppm corresponding to the CH or CH3 groups. Some researchers believe that the signals located at these chemical shifts can be attributed to both Cα,β−Hα,β in stilbenes [31] and C2,6-H2,6 in p-benzoates [32].
In the aromatic region of the sulfated lignin spectrum containing the main part of the peaks of the syringyl (S2,6eth, S′2,6, S″2,6) and guaiacyl units (G2, G5, G6), p-coumarates (pCA3,5), and cinnamyl aldehyde end groups (J2,6) (see Table 6), the signal of the C2,6-H2,6 syringyl units with a free hydroxyl group in the 4-position disappears almost completely. This is apparently due to the replacement of this hydroxyl group by the sulfate one. In addition, in this region of the spectrum, a new peak at δCH = 120.8/7.38 and 7.32 ppm appears, which is most likely a signal of the C5-H5 guaiacyl (Gs) and C3,5-H3,5 p-coumarate (pCAs) structural units with sulfate groups attached to the 4-position. These changes in the chemical shifts of adjacent positions 3 and 5 of the aromatic ring caused by esterification correspond to the expected change of the substituent in phenol [33]. The possible substitution of the sulfate group of the phenolic hydroxyls for the guaiacyl (G) units in the 4-position is evidenced also by the almost complete disappearance of the peak at δCH = 115.7/6.97 ppm characteristic of the C5-H5 guaiacyl units (G5) with unsubstituted hydroxyl in the 4-position [34].
Based on the data obtained, it can be concluded that sulfation affects the acceptable aliphatic hydroxyl groups of lignin at the γ-positions of β-aryl ethers, α-ethoxylated β-aryl ethers, phenylcoumaran substructures, and cinnamyl alcohol end groups, as well as the unsubstituted hydroxyl groups in the α-position of β-aryl ethers. In addition, free phenolic hydroxyl groups in the 4-position of syringyl and guaiacyl units and p-coumarates can be subjected to sulfation.
The comparison of the 2D NMR spectroscopy data on birch and abies ethanol lignin sulfates [16] revealed higher structural diversity of the sulfated birch ethanol lignin. A significant difference between the HSQC spectra of birch ethanol lignin and abies ethanol lignin in the area of correlations of the aromatic fragments is the presence of several types of syringyl units in the former. However, both samples are built from the phenylpropane structural units linked by simple ether (β-O-4′) and C–C (β–β′, β–5′) bonds, while the sulfate groups are localized mainly in the γ and α positions of the side chains and, probably, in the 4-position of aromatic rings.
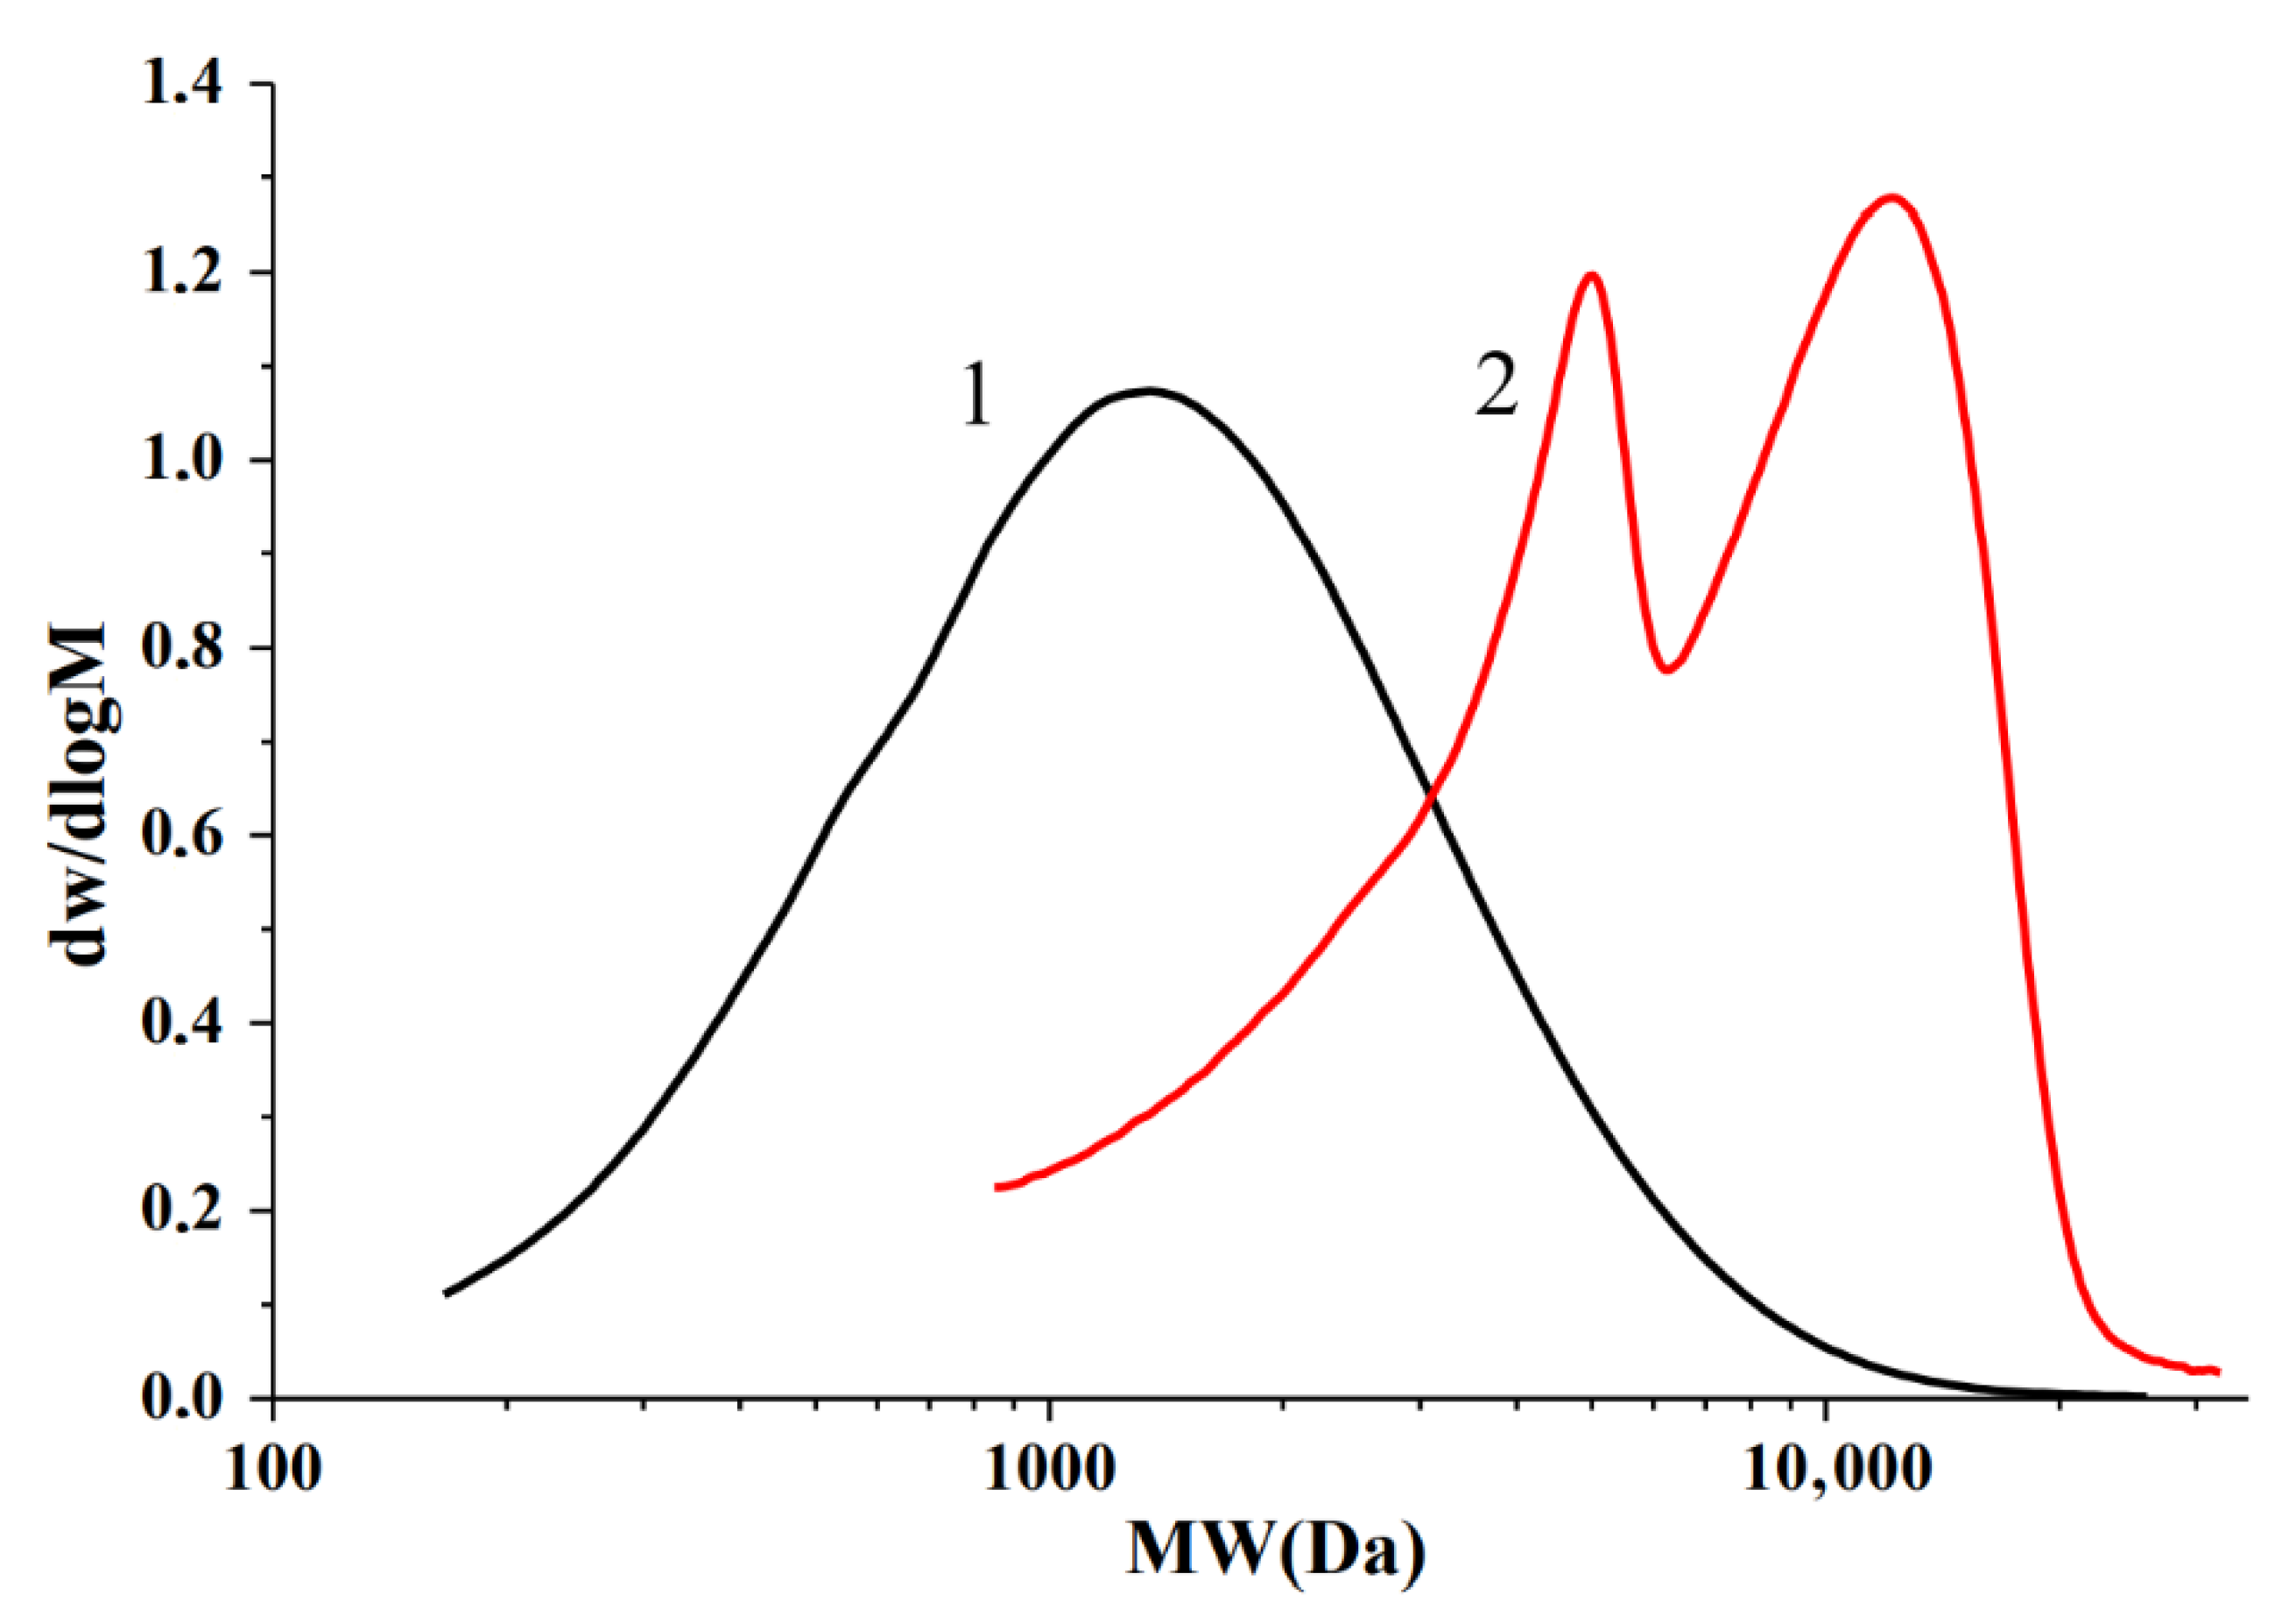
Data on the molecular weight distribution of the initial and sulfated birch ethanol lignin were obtained by the GPC method. The molecular weight distribution curves for the initial and sulfated birch ethanol lignin samples are shown in Figure 12. The average molecular weights and polydispersity of the initial and sulfated ethanol lignins are indicated in Table 6.
The birch ethanol lignin obtained in [35] had a low molecular weight (Mw = 1800 Da) and a monomodal distribution (PD = 2.02), which evidences higher homogeneity of the sample as compared to Alcell birch lignin (Mw = 3470 and PD = 4.1) [17].
As a result of birch ethanol lignin sulfation, the weight average molecular weight Mw of the samples increased from ~1800 to ~7600 Da. Such a significant growth is related to an increase in the weight of lignin macromolecules due to the introduction of sulfate groups and the removal of the low molecular weight fraction of the sulfated lignin along with inorganic impurities at the dialysis stage. A feature distinguishing sulfated birch ethanol lignin from abies ethanol lignin sulfated under similar conditions [16] is the bimodal molecular weight distribution (Figure 12). The molecular weight distribution curve of birch ethanol lignin has two pronounced peaks with molecular weights of ~5000 and ~12,000 Da. These peaks can be attributed to the heterogeneity of the initial ethanol lignin molecules, which enter into the sulfation reaction in different ways. The low molecular weight lignin fraction is possibly less sulfated than the high molecular weight fraction, which is reflected in the separation of the peaks in the molecular weight distribution curve. Sulfated birch ethanol lignin has a higher polydispersity and a higher average molecular weight than sulfated abies ethanol lignin (Mw~5300 Da, PD = 1.63) [16].

2.4. Thermochemical Properties of the Birch Ethanol Lignin

The thermochemical properties of the birch ethanol lignin were studied using the non-isothermal TG/DTG analysis in an argon medium in the temperature range of 30–900 °C.
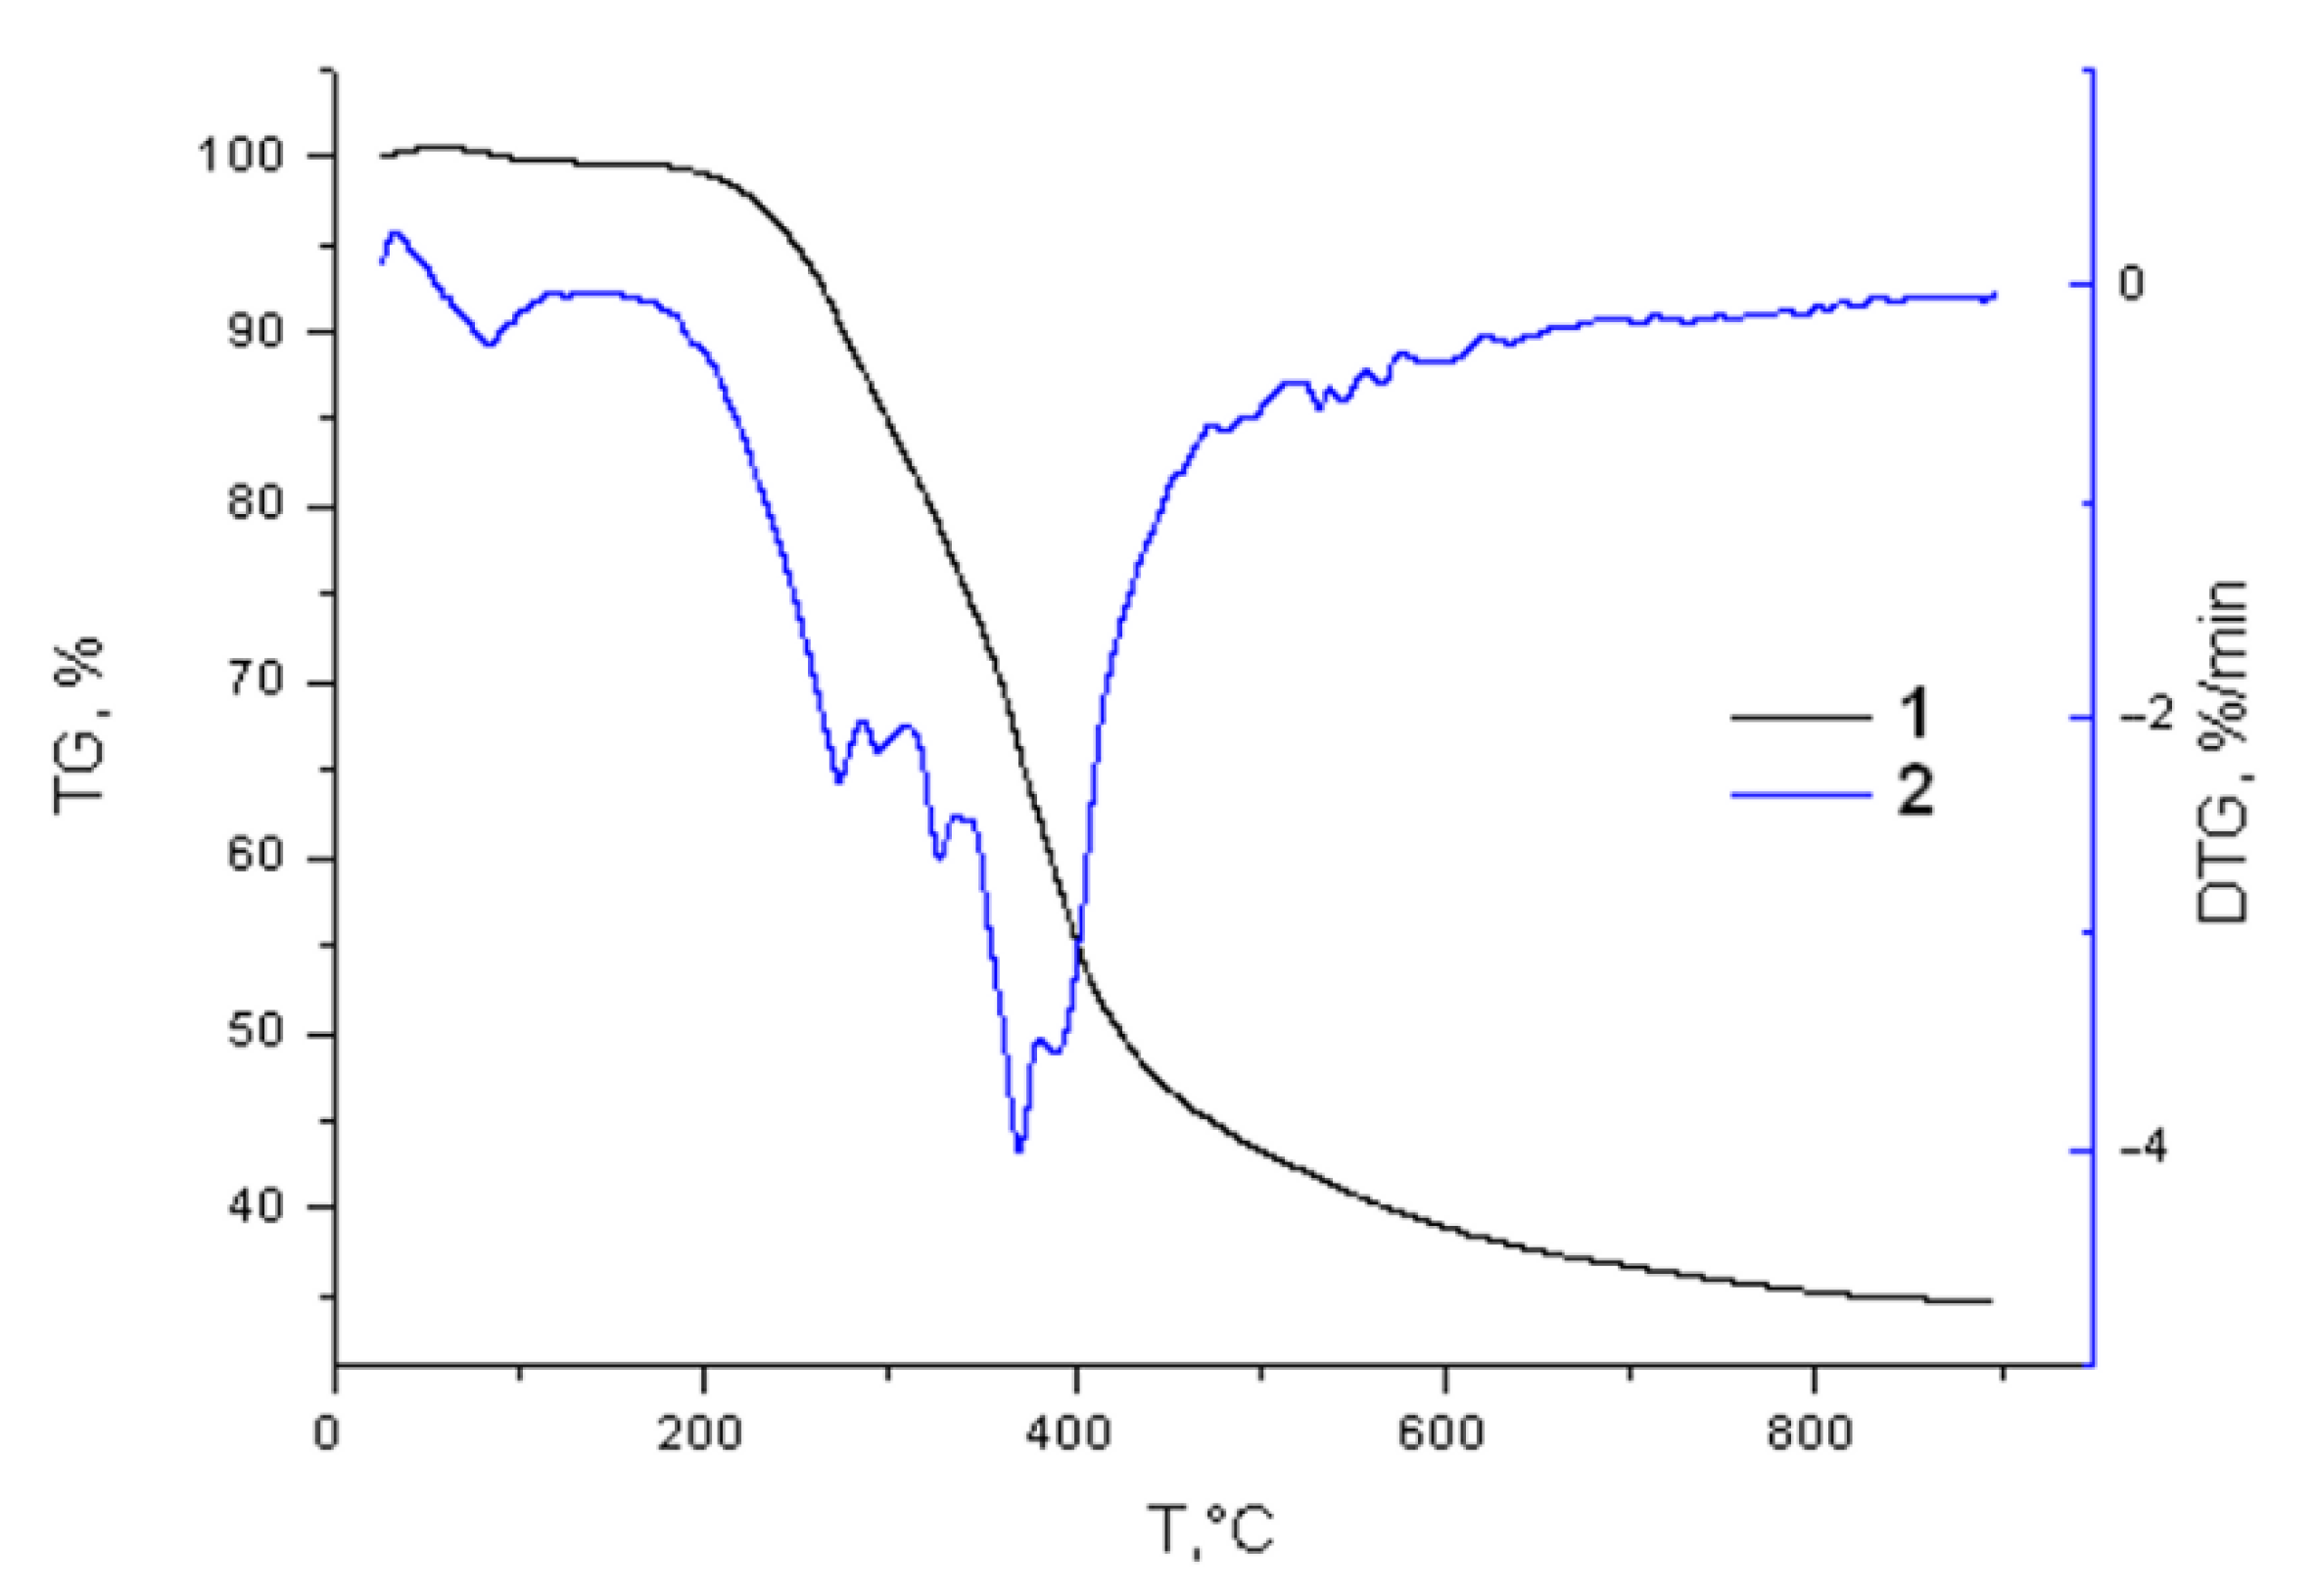
The thermal decomposition of the ethanol lignin occurred over a wide temperature range, since its structure contains various functional groups with different thermal stabilities (Figure 13).
The sample weight loss at temperatures of 30–180 °C was found to be less than 1%. This is explained by the loss of moisture and adsorbed gases. The main thermal decomposition of the ethanol lignin started after 200 °C and practically ended at 600 °C. The solid residue yield gradually decreased with an increase in temperature to 700 °C and then remained constant invariable. At a pyrolysis temperature of 900 °C, the solid residue yield was 34.6 wt %, which is somewhat less than in the case of pyrolysis of the abies ethanol lignin under similar conditions (36.2 wt %) [36]. As is known [37], coniferous lignins consist mainly of the guaiacyl structures, while in hardwood lignins, the syringyl structures dominate. The high yield of the carbon residue during the thermal decomposition of abies ethanol lignin is probably due to the tendency of the guaiacyl propane units to condensation reactions [38].
The DTG curve has a broad peak corresponding to the main thermal decomposition of ethanol lignin and an implicit peak. The maximum rate of thermal degradation of the birch ethanol lignin (4.1%/min) was reached at 372 °C. In the temperature range of 350–400 °C, the main lignin structural moieties (guaiacyl and syringyl) underwent cracking with the formation of phenol-type compounds of different molecular weights, the yield of which increased with temperature [39].
At this temperature range, the pyrolysis products represent a complex mixture of organic compounds containing the aromatic, hydroxyl, and alkyl groups and reflecting the composition and structural features of the initial lignin [40]. During the thermal decomposition of the lignin, the competing depolymerization reactions with the formation of lower molecular weight aromatic products and cross-linking reactions of aromatic compounds and their carbonization occurred [40]. In the temperature range of 450–600 °C, the birch ethanol lignin weight loss rate significantly decreased and the thermal decomposition was mainly completed at 600 °C. In this case, some of the aromatic rings in the lignin probably decomposed and condensed into carbon products [41].
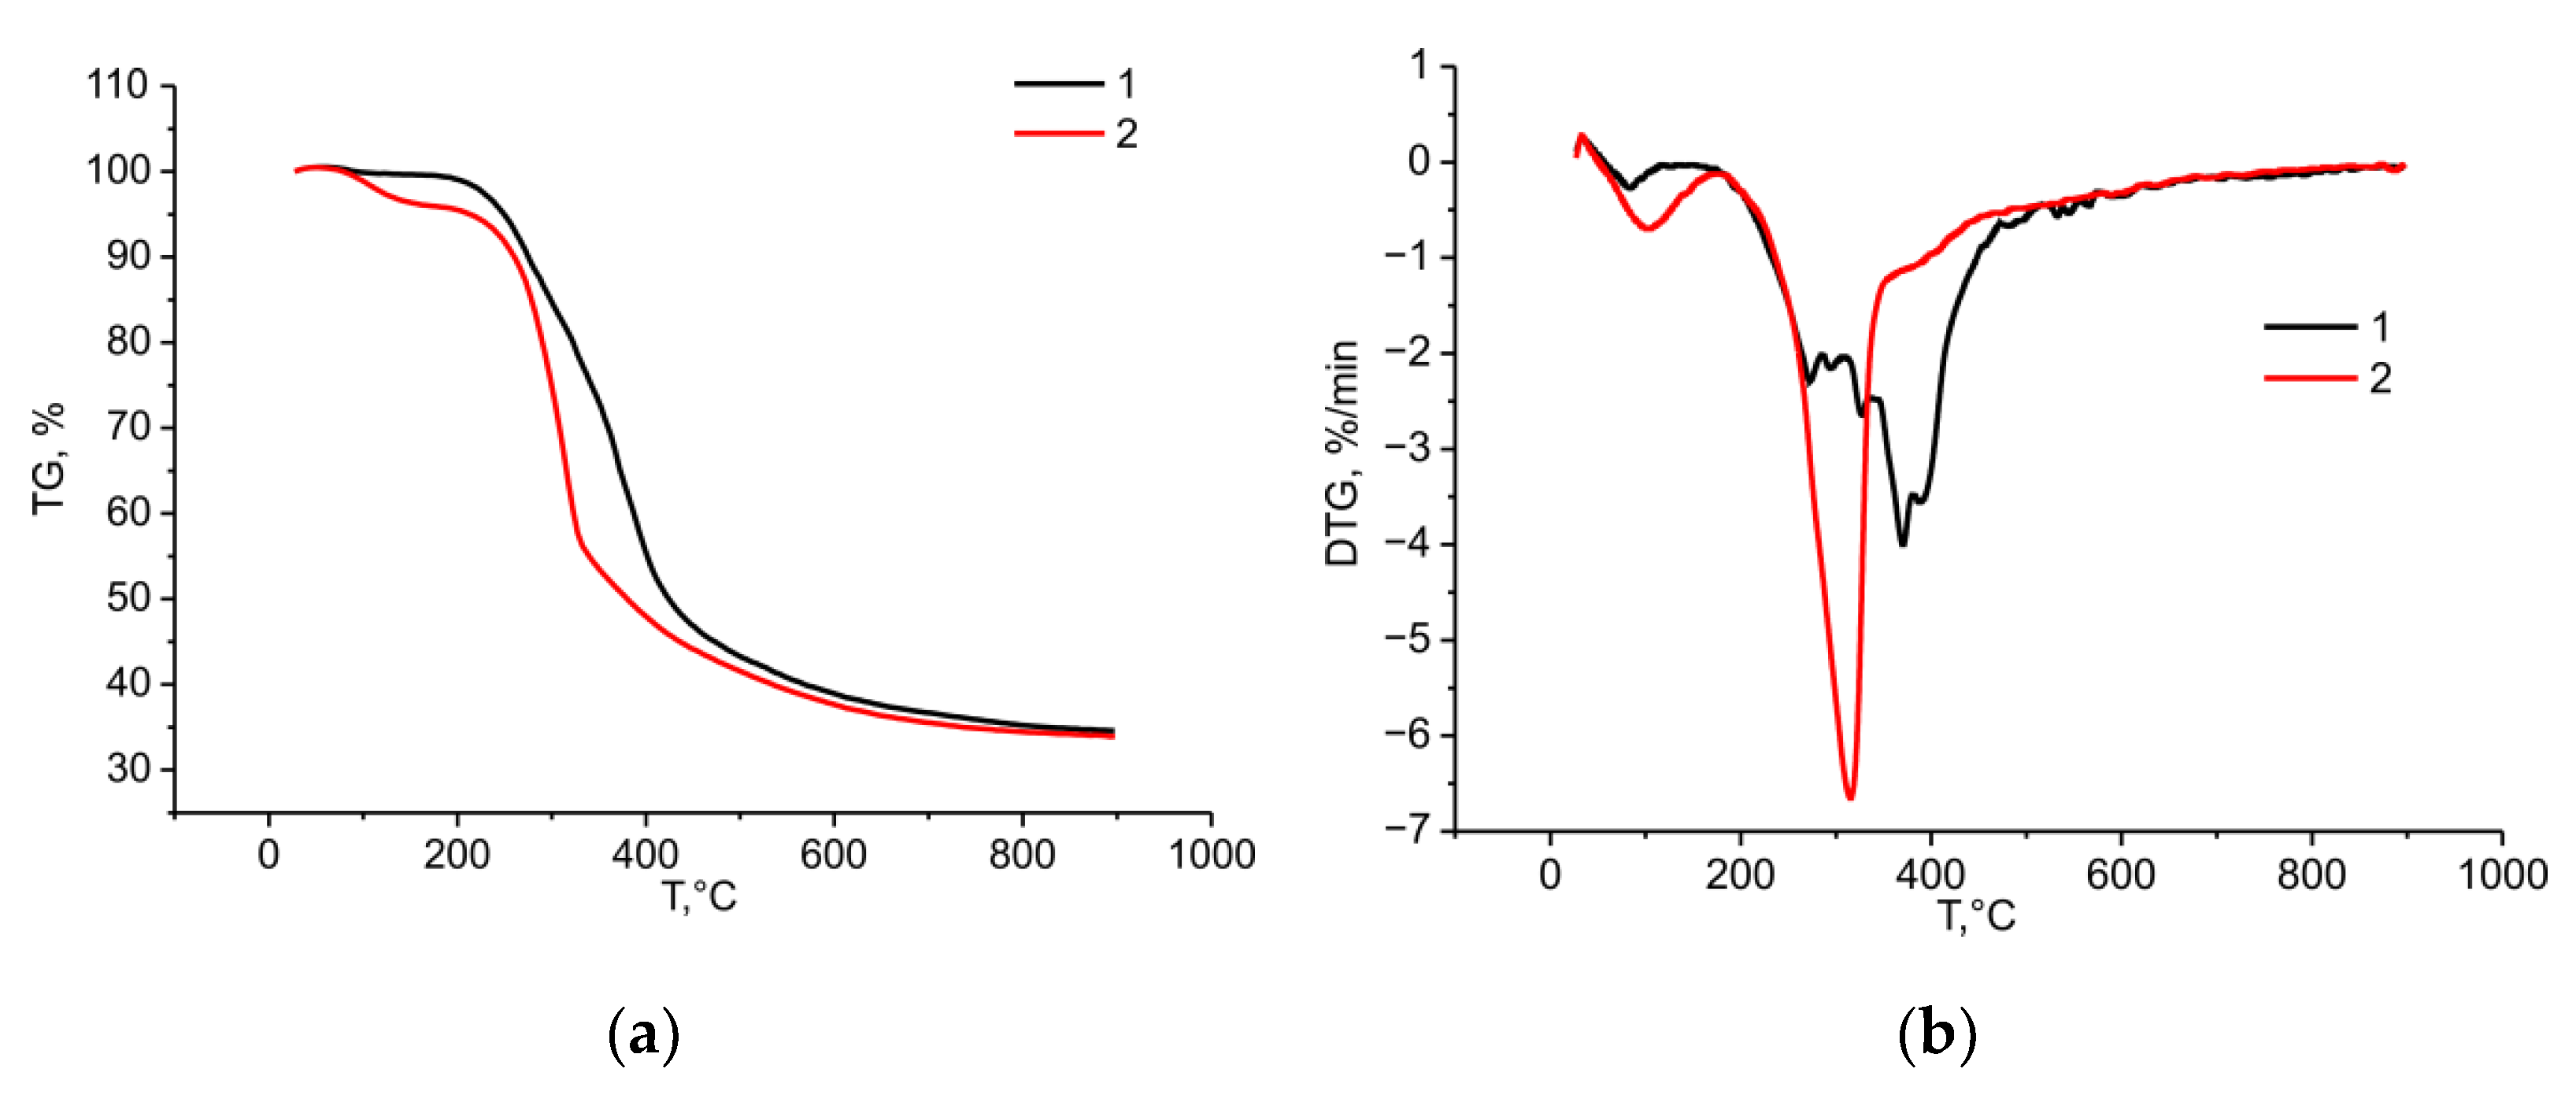
The sulfation of the birch ethanol lignin noticeably changed the nature of its thermal transformation (Figure 14).
According to the data presented in Figure 14a, the sulfation of the birch ethanol lignin reduced its thermal stability. At temperature 300 °C, the sulfated ethanol lignin lost 26.4% of its initial weight, while the initial lignin lost only 15.7%. This tendency continued until the completion of the pyrolysis process.
The sulfation of the birch ethanol lignin also changed its thermal transformation profile (Figure 14b). In the temperature range of 100–150 °C, the sulfated ethanol lignin weight loss rate was much higher than in the case of initial ethanol lignin. As was shown in [42], in this temperature range, the aliphatic hydroxyl groups, carbonyl groups, and C–C bonds in the lignin side chains are broken.
In the temperature range of 200–350 °C, an intense narrow peak appeared in the DTG curve of the sulfated birch ethanol lignin, with a maximum weight loss rate of 6.7%/min at 317 °C, which is attributed to the thermal decomposition of sulfate groups [43].
Thus, the TG/DTG study showed that the syringyl structure of hardwood (birch) ethanol lignin was thermally less stable than the guaiacyl structure dominating in softwood (abies) ethanol lignin. Additionally, the introduction of sulfate groups into the structure of birch ethanol lignin reduced its thermal stability.

3. Materials and Methods

3.1. Materials

The silver birch (Betula pendula Roth) wood harvested in the vicinity of Krasnoyarsk city was used as a feedstock for the isolation of ethanol lignin. The contents of the main birch wood components (% of the absolutely dry wood weight) were 47.3 cellulose, 28.5 hemicelluloses, 19.0 lignin, 4.9 extractives, and 0.3 ash.

3.2. Ethanol Lignin Isolation

The ethanol lignin was separated from birch wood by extraction with an ethanol–water (60:40) mixture in a Rexo Engineering autoclave reactor (Rexo Engineering Co., Ltd., Seoul, Korea) with a capacity of 3000 mL at a temperature of 185 °C under a working pressure of 0.75 MPa for 3 h and subsequent precipitation with cold water using the technique described in [35].

3.3. Ethanol Lignin Sulfation

The obtained ethanol lignin was sulfated with sulfamic acid in 1,4-dioxane in the presence of urea using the procedure described in [16,44].
The sulfation of ethanol lignin was carried out in a three-neck flask (150 mL) equipped with a reflux condenser, a thermometer, and a mechanical stirrer at temperatures 70–100 °C. The ethanol lignin (1.25 g) was added to a mixture of sulfamic acid and urea (mol. ratio 1:1) in 15 mL of 1,4-dioxane. The mixture was intensively stirred for 30–180 min and cooled to room temperature. The solvent was decanted, and the remaining solid product was dissolved in a small amount of water and neutralized with aqueous ammonia to pH 8. To remove the excess reactants, the product was dialyzed against water in a plastic bag of MF-503-46 MFPI brand (USA) with a pore size of 3.5 kDa for 8–10 h. After dialysis, the aqueous solution of sulfated lignin was evaporated with the use of a rotary evaporator to obtain a solid residue—sulfated lignin in the form of an ammonium salt.
The sulfation process of the birch ethanol lignin with sulfamic acid was numerically optimized using the Statgraphics Centurion XVI software, DOE (Design of Experiment) block by the method described in [16].
The estimated sulfated ethanol lignin weight was calculated on the basis of the sulfur content [21] as
m c a l c = 32 × m 32 0.97 × S
The sulfated product Yield (%) was determined as
Y i e l d   ( % ) = m a c t u a l m c a l c × 100 %
where mcalc is the calculated sulfated ethanol lignin weight (g), m is the weight of the initial ethanol lignin sample (g), mactual is the sulfated ethanol lignin weight (g), and S is the sulfur content in the sulfated ethanol lignin (%).

3.4. Elemental Analysis

The elemental analysis of the sulfated ethanol lignin was carried out using a ThermoQuest FlashEA-1112 analyzer (Milan, Italy).

3.5. FTIR Analysis

The FTIR spectra of the initial and sulfated ethanol lignin were recorded using a Shimadzu IRTracer-100 Fourier transform IR spectrophotometer (Tokyo, Japan) in the wavelength range of 400–4000 cm−1. The spectral data were processed using the OPUS software (version 5.0). The solid samples for the analysis were tablets in a KBr matrix (2 mg of the sample/1000 mg of KBr).

3.6. NMR Analysis

The 2D NMR spectra were recorded at 25 °C in 5-mm ampoules using a Bruker Avance III 600 NMR spectrometer (Billerica, MA, USA) at working frequencies of 600 (1H) and 150 MHz (13C). Approximately 80 mg of lignin was dissolved in 0.6 mL of deuterated dimethyl sulfoxide, and then the spectra were recorded in the heteronuclear single quantum correlation (HSQC) experiments with editing (HSQCed) using the Bruker standard sequence library. The solvent signal was used as an internal standard (δC 40.1 and δH 2.5).

3.7. Gel Permeation Chromatography

The number average molecular weight Mn, weight average molecular weight Mw, and polydispersity index of the initial and sulfated ethanol lignin samples were determined by gel permeation chromatography (GPC) using an Agilent 1260 Infinity II Multi-Detector GPC/SEC System with triple detection: refractometer (RI), viscometer (VS), and light scattering (LS). The water-soluble samples were separated on two combined PL Aquagel-OH Mixed-M columns using 0.1 M NaNO3 as the mobile phase. The tetrahydrofuran (THF)-soluble samples were separated on a PLgel 10 µm MIXED-E column with the THF mobile phase stabilized with 250 ppm of butylhydroxytoluene. The columns were calibrated using the polyethylene glycol and polystyrene polydisperse standards (Agilent, Santa Clara, CA, USA), respectively. The eluent flow rate was 1 mL/min, and the injected sample volume was 100 µL. Before the analysis, the ethanol lignin and sulfated ethanol lignin samples were dissolved in THF and water (5 mg/mL), respectively; after that, they were filtered through a 0.45-µm Millipore PTFE membrane filter. The data were collected and processed using the Agilent GPC/SEC MDS software.

3.8. Thermogravimetric Analysis

The thermogravimetry analysis was carried out using a Netzsch STA 449 F1 Jupiter instrument (Waldkraiburg, Germany). The thermal degradation of the lignin samples was studied in argon in the temperature range from 298 to 1173 K. The samples were heated in the dynamic mode at a heating rate of 10 °C/min in corundum crucibles. The measured data were processed using the Netzsch Proteus Thermal Analysis.5.1.0 software package supplied with the instrument.

3.9. Kinetic Calculations

The kinetics of the process of birch ethanol lignin sulfation was studied in the temperature range of 70–100 °C. The apparent initial rates and rate constants of the sulfation reaction were calculated from the change in the sulfur content in the sulfated ethanol lignin. The calculation was carried out according to the first-order equation:
V = k × S = d S d t
where V is the rate of the sulfation reaction, wt %/s; k is the rate constant of the sulfation reaction, 1/s; dS is the change in the sulfur content in birch ethanol lignin sulfate, wt %; and dt is the change in time, s. The activation energy was found by the tangent of the slope of the dependence of ln k on 11/T.

4. Conclusions

As a result of the accomplished study, the main regularities of the process of birch ethanol lignin sulfation with a sulfamic acid–urea mixture in a 1,4-dioxane medium at temperatures of 70–110 °C were established and the sulfating products were characterized using chemical and physical analysis methods.
It was found that similar to the sulfation of abies ethanol lignin under the same conditions [16], the process was complicated by diffusion restrictions due to the increased viscosity of the reaction medium. In the case of excess sulfating agent, the main factors affecting the yield of the sulfated product and sulfur content were the temperature and the duration of the process. Using experimental and computational methods, the optimal conditions for the process of birch ethanol lignin sulfation with a sulfamic acid–urea mixture to provide a high yield of sulfated product (more than 96 wt %) with a sulfur content of 8.1 wt % were established. As in the case of abies ethanol lignin, the sulfation increased the molecular weight of the birch ethanol lignin from 1800 Da to 7600 Da and decreased the polydispersity from 2.02 to 1.81. Moreover, aliphatic hydroxyl groups were more easily sulfated.
Some differences in the sulfation of ethanol lignins of birch and abies were established due to the presence of phenylpropane units of different compositions within these lignins. The sulfation of birch ethanol lignin in which syringyl structures predominate proceeds more completely at moderate temperatures than the abies ethanol lignin with guaiacyl structure. Additionally, in contrast to sulfated abies ethanol lignin, the sulfated birch ethanol lignin had a bimodal and wider molecular weight distribution, as well as less thermal stability.
The sulfated birch ethanol lignin has prospects for use in the production of new sorbents, biocomposites, and nanomaterials, as well as in the development of new anticoagulant and antiviral drugs [12,13,45].

Author Contributions

Conceptualization, A.V.L. and N.Y.V.; methodology, Y.N.M., A.A.K., O.Y.F., A.S.K. and V.A.L.; software, Y.N.M., A.A.K., O.Y.F. and A.S.K.; validation, A.V.L., N.Y.V. and B.N.K.; formal analysis, A.S.K.; investigation, Y.N.M., A.A.K., O.Y.F. and A.S.K.; resources, B.N.K.; data curation, A.V.L., N.Y.V., Y.N.M., A.A.K., O.Y.F. and B.N.K.; writing—original draft preparation, A.V.L., N.Y.V. and B.N.K.; writing—review and editing, A.V.L., N.Y.V. and B.N.K.; visualization, Y.N.M., A.A.K., O.Y.F. and A.S.K.; supervision, B.N.K.; project administration, B.N.K.; funding acquisition, B.N.K. All authors have read and agreed to the published version of the manuscript.

Funding

This study was supported by the Russian Science Foundation, project no. 21-13-00250, https://rscf.ru/project/21-13-00250/.

Institutional Review Board Statement

Not applicable.

Informed Consent Statement

Not applicable.

Data Availability Statement

All data generated during this study are included in the article.

Acknowledgments

This study was carried out using the equipment of the Krasnoyarsk Regional Center for Collective Use of the Krasnoyarsk Scientific Center, Siberian Branch of the Russian Academy of Sciences. The authors are grateful to Sergey V. Baryshnikov for his help in obtaining the lignin samples.

Conflicts of Interest

The authors declare no conflict of interest.

Sample Availability

Samples of the compounds are available from the authors.

References

  1. Faruk, O.; Sain, M. Lignin in Polymer Composites; Elsevier: Oxford, UK, 2015. [Google Scholar] [CrossRef]
  2. Poletto, M. Lignin: Trends and Applications; IntechOpen: Rijeka, Croatia, 2018. [Google Scholar] [CrossRef]
  3. Calvo-Flores, F.G.; Dobado, J.A. Lignin as renewable raw material. ChemSusChem 2010, 3, 1227–1235. [Google Scholar] [CrossRef] [PubMed]
  4. Heitner, C.; Dimmel, D.R.; Schmidt, J.A. Lignin and Lignans: Advances in Chemistry; CRC Press: Boca Raton, FL, USA, 2010. [Google Scholar] [CrossRef]
  5. Feofilova, E.P.; Mysyakina, E.S. Lignin: Chemical structure, biodegradation, and practical application (a review). Appl. Biochem. Microbiol. 2016, 52, 573–581. [Google Scholar] [CrossRef]
  6. Lobato-Peralta, D.R.; Duque-Brito, E.; Villafán-Vidales, H.I.; Longoria, A.; Sebastian, P.J.; Cuentas-Gallegos, A.K.; Arancibia-Bulnes, C.A.; Okoye, P.U. A review on trends in lignin extraction and valorization of lignocellulosic biomass for energy applications. J. Clean. Prod. 2021, 293, 126123. [Google Scholar] [CrossRef]
  7. De la Torre, M.J.; Moral, A.; Hernández, M.D.; Cabeza, E.; Tijero, A. Organosolv lignin for biofuel. Ind. Crops Prod. 2013, 45, 58–63. [Google Scholar] [CrossRef]
  8. Inamuddin. Green Polymer Composites Technology. Properties and Applications; CRC Press: Boca Raton, FL, USA, 2016. [Google Scholar] [CrossRef]
  9. Kai, D.; Tan, M.J.; Chee, P.L.; Chua, Y.K.; Yap, Y.L.; Loh, X.J. Towards lignin-based functional materials in a sustainable world. Green Chem. 2016, 18, 1175–1200. [Google Scholar] [CrossRef]
  10. Shrotri, A.; Kobayashi, H.; Fukuoka, A. Catalytic conversion of structural carbohydrates and lignin to chemicals. Adv. Catal. 2017, 60, 59–123. [Google Scholar] [CrossRef]
  11. Mehta, A.Y.; Mohammed, B.M.; Martin, E.J.; Brophy, D.F.; Gailani, D.; Desai, U.R. Allosterism-based simultaneous, dual anticoagulant and antiplatelet action: Allosteric inhibitor targeting the glycoprotein Ibα-binding and heparin-binding site of thrombin. J. Thromb. Haemost. 2016, 14, 828–838. [Google Scholar] [CrossRef] [PubMed]
  12. Raghuraman, A.; Tiwari, V.; Zhao, Q.; Shukla, D.; Debnath, A.K.; Desai, U.R. Viral inhibition studies on sulfated lignin, a chemically modified biopolymer and a potential mimic of heparan sulfate. Biomacromolecules 2007, 8, 1759–1763. [Google Scholar] [CrossRef]
  13. Raghuraman, A.; Tiwari, V.; Thakkar, J.N.; Gunnarsson, G.T.; Shukla, D.; Hindle, M.; Desai, U.R. Structural characterization of a serendipitously discovered bioactive macromolecule, lignin sulfate. Biomacromolecules 2005, 6, 2822–2832. [Google Scholar] [CrossRef] [PubMed]
  14. Malyar, Y.N.; Vasil’yeva, N.Y.; Kazachenko, A.S.; Skvortsova, G.P.; Korol’kova, I.V.; Kuznetsova, S.A. Sulfation of abies ethanol lignin by complexes of sulfur trioxide with 1,4-dioxane and pyridine. Russ. J. Bioorg. Chem. 2021, 47, 1368–1375. [Google Scholar] [CrossRef]
  15. Prinsen, P.; Narani, A.; Hartog, A.F.; Wever, R.; Rothenberg, G. Dissolving lignin in water through enzymatic sulfation with aryl sulfotransferase. ChemSusChem 2017, 10, 2267–2273. [Google Scholar] [CrossRef]
  16. Kuznetsov, B.N.; Vasilyeva, N.Y.; Kazachenko, A.S.; Levdansky, V.A.; Kondrasenko, A.A.; Malyar, Y.N.; Skvortsova, G.P.; Lutoshkin, M.A. Optimization of the process of abies ethanol lignin sulfation by sulfamic acid–urea mixture in 1,4-dioxane medium. Wood Sci. Technol. 2020, 54, 365–381. [Google Scholar] [CrossRef]
  17. Gabov, K.; Gosselink, R.J.A.; Smeds, A.I.; Fardim, P. Characterization of lignin extracted from birch wood by a modified hydrotropic process. J. Agric. Food Chem. 2014, 62, 10759–10767. [Google Scholar] [CrossRef] [PubMed]
  18. Thoresen, P.P.; Lange, H.; Crestini, C.; Rova, U.; Matsakas, L.; Christakopoulos, P. Characterization of organosolv birch lignins: Toward application-specific lignin production. ACS Omega 2021, 6, 4374–4385. [Google Scholar] [CrossRef]
  19. Kuznetsov, B.N.; Sudakova, I.G.; Chudina, A.I.; Garyntseva, N.V.; Kazachenko, A.S.; Skripnikov, A.M.; Malyar, Y.N.; Ivanov, I.P. Fractionation of birch wood biomass into valuable chemicals by the extraction and catalytic processes. Biomass Conv. Bioref. 2022, 1–15. [Google Scholar] [CrossRef]
  20. Akman, F.; Kazachenko, A.S.; Vasilyeva, N.Y.; Malyar, Y.N. Synthesis and characterization of starch sulfates obtained by the sulfamic acid-urea complex. J. Mol. Struct. 2020, 1208, 127899. [Google Scholar] [CrossRef]
  21. Levdansky, A.V.; Vasilyeva, N.Y.; Kondrasenko, A.A.; Levdansky, V.A.; Malyar, Y.N.; Kazachenko, A.S.; Kuznetsov, B.N. Sulfation of arabinogalactan with sulfamic acid under homogeneous conditions in dimethylsulfoxide medium. Wood Sci. Technol. 2021, 55, 1725–1744. [Google Scholar] [CrossRef] [PubMed]
  22. Karger, J.; Grinberg, F.; Heitjans, P. Diffusion Fundamentals; Leipziger University: Leipzig, Germany, 2005. [Google Scholar]
  23. Lente, G. Deterministic Kinetics in Chemistry and Systems Biology; Springer: New York, NY, USA, 2015. [Google Scholar] [CrossRef]
  24. Faix, O. Classification of lignin from different botanical origins by FTIR spectroscopy. Holzforschung 1991, 45, 21–27. [Google Scholar] [CrossRef]
  25. You, T.-T.; Mao, J.-Z.; Yuan, T.-Q.; Wen, J.-L.; Xu, F. Structural elucidation of the lignins from stems and foliage of Arundo donax Linn. J. Agric. Food Chem. 2013, 61, 5361–5370. [Google Scholar] [CrossRef] [PubMed]
  26. Wen, J.-L.; Sun, S.-L.; Yuan, T.-Q.; Xu, F.; Sun, R.-C. Structural elucidation of lignin polymers of Eucalyptus chips during organosolv pretreatment and extended delignification. J. Agric. Food Chem. 2013, 61, 11067–11075. [Google Scholar] [CrossRef] [PubMed]
  27. Bauer, S.; Sorek, H.; Mitchell, V.D.; Ibáñez, A.B.; Wemmer, D.E. Characterization of Miscanthus giganteus lignin isolated by ethanol organosolv process under reflux condition. J. Agric. Food Chem. 2012, 60, 8203–8212. [Google Scholar] [CrossRef] [PubMed]
  28. Lagerquist, L.; Pranovich, A.; Smeds, A.; von Schoultz, S.; Vähäsalo, L.; Rahkila, J.; Kilpeläinen, I.; Tamminend, T.; Willför, S.; Eklund, P. Structural characterization of birch lignin isolated from a pressurized hot water extraction and mild alkali pulped biorefinery process. Ind. Crops Prod. 2018, 111, 306–316. [Google Scholar] [CrossRef]
  29. Rencoret, J.; Marques, G.; Gutiérrez, A.; Ibarra, D.; Li, J.; Gellerstedt, G.; Santos, J.I.; Jiménez-Barbero, J.; Martínez, A.T.; del Río, J.C. Structural characterization of milled wood lifnins from different eucalypt species. Holzforschung 2008, 62, 514–526. [Google Scholar] [CrossRef]
  30. del Río, J.C.; Rencoret, J.; Marques, G.; Li, J.; Gellerstedt, G.; Jiménez-Barbero, J.; Martínez, Á.T.; Gutiérrez, A. Structural characterization of the lignin from jute (Corchorus capsularis) fibers. J. Agric. Food Chem. 2009, 57, 10271–10281. [Google Scholar] [CrossRef]
  31. Kangas, H.; Liitiä, T.; Rovio, S.; Ohra-aho, T.; Heikkinen, H.; Tamminen, T.; Poppius-Levlin, K. Characterization of dissolved lignins from acetic acid Lignofibre (LGF) organosolv pulping and discussion of its delignification mechanisms. Holzforschung 2014, 69, 247–256. [Google Scholar] [CrossRef]
  32. Lu, F.; Karlen, S.D.; Regner, M.; Kim, H.; Ralph, S.A.; Sun, R.-C.; Kuroda, K.-i.; Augustin, M.A.; Mawson, R.; Sabarez, H.; et al. Naturally p-hydroxybenzoylated lignins in palms. BioEnergy Res. 2015, 8, 934–952. [Google Scholar] [CrossRef]
  33. Ragan, M.A. Phenol sulfate esters: Ultraviolet, infrared, 1H and 13C nuclear magnetic resonance spectroscopic investigation. Can. J. Chem. 1978, 56, 2681–2685. [Google Scholar] [CrossRef]
  34. Rencoret, J.; Marques, G.; Gutiérrez, A.; Nieto, L.; Santos, J.I.; Jiménez-Barbero, J.; Martínez, A.T.; del Río, J.C. HSQC-NMR analysis of lignin in woody (Eucalyptus globulus and Picea abies) and non-woody (Agave sisalana) ball-milled plant materials at the gel state. Holzforschung 2009, 63, 691–698. [Google Scholar] [CrossRef]
  35. Kuznetsov, B.N.; Chesnokov, N.V.; Sudakova, I.G.; Garyntseva, N.V.; Kuznetsova, S.A.; Malyar, Y.N.; Yakovlev, V.A.; Djakovitch, L. Green catalytic processing of native and organosolv lignins. Catal. Today 2018, 309, 18–30. [Google Scholar] [CrossRef]
  36. Fetisova, O.Y.; Mikova, N.M.; Chesnokov, N.V. A kinetic study of the thermal degradation of fir and aspen ethanol lignins. Kinet. Catal. 2019, 60, 273–280. [Google Scholar] [CrossRef]
  37. Moustaqim, M.E.; Kaihal, A.E.; Marouani, M.E.; Men-La-Yakhaf, S.; Taibi, M.; Sebbahi, S.; Hajjaji, S.E.; Kifani-Sahban, F. Thermal and thermomechanical analyses of lignin. Sustain. Chem. Pharm. 2018, 9, 63–68. [Google Scholar] [CrossRef]
  38. Poletto, M. Assessment of the thermal behavior of lignins from softwood and hardwood species. Maderas Cienc. Tecnol. 2017, 19, 63–74. [Google Scholar] [CrossRef]
  39. Liu, Q.; Wang, S.; Zheng, Y.; Luo, Z.; Cen, K. Mechanism study of wood lignin pyrolysis by using TG–FTIR analysis. J. Anal. Appl. Pyrol. 2008, 82, 170–177. [Google Scholar] [CrossRef]
  40. Brebu, M.; Vasile, C. Thermal degradation of lignin—A review. Cellul. Chem. Technol. 2010, 44, 353–363. [Google Scholar]
  41. Nakamura, T.; Kawamoto, H.; Saka, S. Condensation reactions of some lignin related compounds at relatively low pyrolysis temperature. J. Wood Chem. Technol. 2007, 27, 121–133. [Google Scholar] [CrossRef]
  42. Ji, X.; Guo, M.; Zhu, L.; Du, W.; Wang, H. Synthesis mechanism of an environment-friendly sodium lignosulfonate/chitosan medium-density fiberboard adhesive and response of bonding performance to synthesis mechanism. Materials 2020, 13, 5697. [Google Scholar] [CrossRef] [PubMed]
  43. Roman, M.; Winter, W.T. Effect of sulfate groups from sulfuric acid hydrolysis on the thermal degradation behavior of bacterial cellulose. Biomacromolecules 2004, 5, 1671–1677. [Google Scholar] [CrossRef] [PubMed]
  44. Malyar, Y.N.; Kazachenko, A.S.; Vasilyeva, N.Y.; Fetisova, O.Y.; Borovkova, V.S.; Miroshnikova, A.V.; Levdansky, A.V.; Skripnikov, A.M. Sulfation of wheat straw soda lignin: Role of solvents and catalysts. Catal. Today 2022, 397–399, 397–406. [Google Scholar] [CrossRef]
  45. Henry, B.L.; Desai, U.R. Sulfated low molecular weight lignins, allosteric inhibitors of coagulation proteinases via the heparin binding site, significantly alter the active site of thrombin and factor xa compared to heparin. Thromb. Res. 2014, 134, 1123–1129. [Google Scholar] [CrossRef] [PubMed] [Green Version]
Figure 1. Scheme of sulfation of ethanol lignin with the sulfamic acid–urea mixture in 1,4-dioxane medium using β-aryl ethers (β-O-4′) lignin moieties as an example.
Molecules 27 06356 g001
Figure 2. Dynamics of the sulfur content in the process of birch ethanol lignin sulfation with sulfamic acid–urea mixture at different temperatures.
Molecules 27 06356 g002
Figure 3. Temperature dependence of the rate constants of the birch ethanol lignin sulfation process.
Molecules 27 06356 g003
Figure 4. Output parameter Y1 observed in the experiment (dots) and predicted by mathematical model (1) (solid line).
Molecules 27 06356 g004
Figure 5. Response surface illustrating the dependence of sulfur content (wt %) in sulfated birch ethanol lignin on the process temperature (X1) and time (X2).
Molecules 27 06356 g005
Figure 6. Comparison of the values of output parameter Y2 observed in the experiment and those predicted by Equation (2).
Molecules 27 06356 g006
Figure 7. Response surface of the dependence of the sulfated birch ethanol lignin yield on the variable temperature (X1) and time factors (X2).
Molecules 27 06356 g007
Figure 8. FTIR spectra of birch ethanol lignin (1) and sulfated ethanol lignin ammonium salt (2).
Molecules 27 06356 g008
Figure 9. HSQCed spectrum of ethanol lignin: aliphatic oxygenated region 1 and aromatic region 2. The assignment of signals is given in Table 5, and the main identified structural units and fragments are shown in Figure 11.
Molecules 27 06356 g009
Figure 10. HSQCed spectrum of sulfated ethanol lignin: aliphatic oxygenated region 1 and aromatic region 2. The assignment of signals is given in Table 5, and the main identified structural units and fragments are shown in Figure 11.
Molecules 27 06356 g010
Figure 11. Main structural units and moieties of the initial and sulfated ethanol lignins: (A) β-aryl ethers, (As) α,γ-sulfated (α,γ-COSO3NH4) β-aryl ethers, (A′) α-ethoxylated (α-COEt) β-aryl ethers, (A′s) γ-sulfated (γ-COSO3NH4) α-ethoxylated (α-COEt) β-aryl ethers, (B) pinoresinols, (C) phenylcoumarans, (Cs) γ-sulfated (γ-COSO3NH4) phenylcoumarans, (I) cinnamyl alcohol end groups, (Is) γ-sulfated (γ-COSO3NH4) cinnamyl alcohol end groups, (J) cinnamyl aldehyde end groups, (pCA) p-coumarates, (pCAs) 4-sulfated (4-COSO3NH4) p-coumarates, (S) syringyl units, (Seth) 4-etherified (4-COEth) syringyl units, (S′) oxidized (α-C=O) syringyl units, (S″) oxidized (α-COOH) syringyl units, (G) guaiacyl units, (Geth) 4-etherified (4-COEth) guaiacyl units, and (Gs) 4-sulfated (4-COSO3NH4) guaiacyl units.
Molecules 27 06356 g011
Figure 12. Molecular weight distribution curves for (1) the birch ethanol lignin and (2) sulfated ethanol lignin samples.
Molecules 27 06356 g012
Figure 13. (1) TG and (2) DTG curves for the birch ethanol lignin sample.
Molecules 27 06356 g013
Figure 14. TG (a) and DTG (b) curves of the birch ethanol lignin (1) and sulfated birch ethanol lignin (2) samples.
Molecules 27 06356 g014
Table 1. Effect of the conditions for ethanol lignin sulfation with the sulfamic acid–urea mixture in 1,4-dioxane on the yield of water-soluble sulfated lignin and sulfur content.
No.L:SC, mol/molTemperature, °CTime, minSulfur Content, wt %Yield, wt %
11:370302.31 ± 0.02*
21:370453.79 ± 0.02*
31:370605.22 ± 0.0394.35 ± 4.04
41:370905.79 ± 0.0394.95 ± 3.96
51:3701206.03 ± 0.0395.56 ± 3.93
61:3701806.31 ± 0.0495.14 ± 3.88
71:380302.62 ± 0.02*
81:380454.03 ± 0.03*
91:380606.08 ± 0.0493.90 ± 3.91
101:380906.73 ± 0.0394.99 ± 3.83
111:3801206.92 ± 0.0595.53 ± 3.80
121:3801807.09 ± 0.0396.06 ± 3.77
131:390303.42 ± 0.02*
141:390455.84 ± 0.0495.61 ± 3.96
151:390606.93 ± 0.0596.17 ± 3.80
161:390907.52 ± 0.0596.43 ± 3.71
171:3901207.59 ± 0.0594.82 ± 3.69
181:3901807.92 ± 0.0594.31 ± 3.65
191:3100304.18 ± 0.03*
201:3100456.43 ± 0.0493.50 ± 3.87
211:3100607.44 ± 0.0593.08 ± 3.72
221:3100907.93 ± 0.0592.48 ± 3.65
231:31001208.15 ± 0.0591.74 ± 3.62
241:31001808.14 ± 0.0591.14 ± 4.07
251:3110305.02 ± 0.0392.31 ± 3.93
261:3110456.91 ± 0.0491.74 ± 3.80
271:3110607.90 ± 0.0590.66 ± 3.65
281:3110908.11 ± 0.0589.93 ± 3.62
291:31101208.10 ± 0.0588.73 ± 3.62
301:31101808.13 ± 0.0585.71 ± 3.62
*—Sulfated lignin with a sulfur content of ≤ 4.20 wt % is water-insoluble.
Table 2. Apparent rate constants and activation energies of the process of birch ethanol lignin sulfation with the sulfamic acid–urea mixture.
TemperatureApparent Initial Rate Constant, K × 10−4 (s−1)Activation Energy, kJ/mol
701.4110.7
801.80
902.05
1002.78
Table 3. Designations of independent variables (factors) and output parameters (experimental results).
Factors and ParametersDesignations in the Equations
Temperature, °CX1
Time, hX2
Sulfur content, %Y1
Product yield, %Y2
Table 4. Results of the variance analysis.
Variance SourceOutput Parameters
Sulfur Content Y1Yield Y2
Statistical Characteristics
Variance Relation FSignificance Level PVariance Relation FSignificance Level P
X178.740.0000200.980.0000
X224.870.000110.880.0042
X129.840.006059.660.0000
X1X20.000.975736.110.0000
X2221.540.00020.260.6184
R2adj86.192.8
Table 5. Assignment of the 1H–13C peaks in the HSQC spectra of the initial and sulfated birch ethanol lignins.
DesignationδCH, ppm (Initial Lignin)δCH, ppm (Sulfated Lignin)Assignment
OMe56.3/3.7456.3/3.76C-H in the methoxy groups (OMe)
Aγ and A′γ60.0/3.42−3.74-Cγ-Hγ in the β-aryl ether (β-O-4′) substructures (A) and α-ethoxylated (CαOEt) β-aryl ether (β-O-4′) substructures (A′)
Aγs and A′γs-64.6/3.51 and 3.83Cγ-Hγ in the γ-sulfated (γ-OSO3NH4) β-aryl ether (β-O-4′) substructures (As) and γ-sulfated (γ-OSO3NH4) α-ethoxylated (CαOEt) β-aryl ether (β-O-4′) substructures (A′s)
Aβ(G) and A′β(G)84.1/4.30 and 83.4/4.39-Cβ-Hβ in the β-aryl ether (β-O-4′) substructures bonded to the G units (A) and α-ethoxylated (CαOEt) β-aryl ether (β-O-4′) substructures bonded to the G units (A′)
Aβ(S) and A′β(S)86.5/4.12 and 84.8/4.27-Cβ-Hβ in the β-aryl ether (β-O-4′) substructures bonded to the S units (A) and α-ethoxylated (CαOEt) β-aryl ether (β-O-4′) substructures boded to the S units (A′)
Aβ(G)s and A′β(G)s-80.7/4.50 and 80.0/4.64Cβ-Hβ in the γ-sulfated (γ-OSO3NH4) β-aryl ether (β-O-4′) substructures bonded to the G units (As) and γ-sulfated (γ-OSO3NH4) α-ethoxylated (CαOEt) β-aryl ether (β-O-4′) substructures bonded to the G units (A′s)
Aβ(S)s and A′β(S)s-82.1/4.35 and 82.1/4.50Cβ-Hβ in the γ-sulfated (γ-OSO3NH4) β-aryl ether (β-O-4′) substructures boded to the S units (As) and γ-sulfated (γ-OSO3NH4) α-ethoxylated (CαOEt) β-aryl ether (β-O-4′) substructures boded to the S units (A′s)
Aα72.5/4.88-Cα-Hα in the β-aryl ether (β-O-4′) substructures (A)
A′αOEt64.4/3.3364.7/3.36C-H of the methylene groups in the α-ethoxylated (CαOEt) β-aryl ether (β-O-4′) substructures (A′)
A′α81.2/4.5681.1/4.53Cα-Hα in the α-ethoxylated (CαOEt) β-aryl ether (β-O-4′) substructures (A′)
Bβ54.1/3.0655.1/3.06Cβ-Hβ in the pinoresinol (β–β′) substructures (B)
Bγ71.6/3.80 and 4.18-Cγ-Hγ in the pinoresinol (β–β′) substructures (B)
Bα85.6/4.6885.9/4.68Cα-Hα in the pinoresinol (β–β′) substructures (B)
Cβ53.7/3.48-Cβ-Hβ in the phenylcoumaran (β–5′) moieties (C)
Cβs-51.1/3.65Cβ-Hβ in the γ-sulfated (γ-OSO3NH4) phenyl coumaran (β–5′) moieties (Cs)
Cγ63.4/3.74-Cγ-Hγ in the phenyl coumaran (β–5′) substructures (C)
Cγs-67.5/3.94Cγ-Hγ in the γ-sulfated (γ-OSO3NH4) phenylcoumaran (β–5′) substructures (Cs)
Cα87.6/5.4587.5/5.55Cα-Hα in the phenylcoumaran (β–5′) substructures (Cα)
Iγ60.4/4.0359.9/4.03Cγ-Hγ in the cinnamyl alcohol end groups (I)
Iγs-64.6/4.15Cγ-Hγ in the γ-sulfated (γ-OSO3NH4) cinnamyl alcohol end groups (Is)
J2,6(S)107.0/7.08106.4/7.00C2,6-H2,6 in the cinnamyl aldehyde end groups (J)
S2,6eth104.5/6.70104.8/6.62C2,6-H2,6 in the 4-etherified syringyl units (Seth)
S2,6106.2/6.51-C2,6-H2,6 in the 4-non-etherified syringyl units (S)
S′2,6107.1/7.35106.7/7.30C2,6-H2,6 in the oxidized (Cα=O) syringyl units (S′)
S″2,6107.2/7.23106.5/7.20C2,6-H2,6 in the oxidized (CαOOH) syringyl units (S″)
pCA3,5115.8/6.79115.5/6.79C3,5-H3,5 in the p-coumarates (pCA)
pCA3,5s-120.8/7.32C3,5-H3,5 in the 4-sulfated (4-OSO3NH4) p-coumarates (pCAs)
G2110.6/6.94111.9/7.00C2-H2 in the 4-etherified guaiacyl units (Geth)
G5115.7/6.97-C5-H5 in the 4-non-etherified guaiacyl units (G)
G5s-120.8/7.38C5-H5 in the 4-sulfated (4-OSO3NH4) guaiacyl units (Gs)
G5eth115.7/6.76115.4/6.76C5-H5 in the 4-etherified guaiacyl units (Geth)
G6119.4/6.79119.5/6.76C6-H6 in the 4-etherified guaiacyl units (Geth)
Table 6. Average molecular weights Mn and Mw and polydispersity of the initial and sulfated birch ethanol lignin samples.
SampleMn (Da)Mw (Da)PD
Birch ethanol lignin90218282.02
Sulfated birch ethanol lignin419975991.81
Publisher’s Note: MDPI stays neutral with regard to jurisdictional claims in published maps and institutional affiliations.